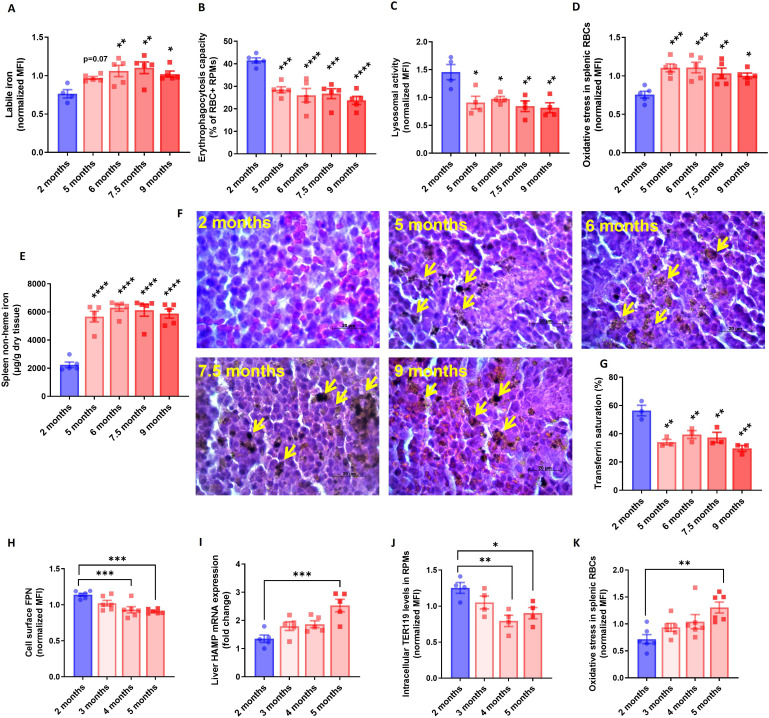
Figure 4. RPM dysfunction develops early in aging and is associated with ferroportin downregulation.
(A) Cytosolic ferrous iron (Fe2+) content in RPMs derived from mice at the indicated age was measured using FerroOrange with flow cytometry. (B) Erythrophagocytosis capacity of RPMs derived from mice at the indicated age was determined using flow cytometry by measuring the percentage of RPMs that phagocytosed transfused PKH67-labeled temperature-stressed RBCs. (C) Lysosomal activity in RPMs derived from mice at the indicated age was determined using Lysosomal Intracellular Activity Assay Kit by flow cytometry. (D) The cytosolic ROS levels in RBCs derived from the spleens of mice at the indicated age were estimated by determining CellROX Deep Red fluorescence intensity with flow cytometry. (E) Splenic non-heme iron content was determined in mice at the indicated age. (F) Hematoxylin and eosin staining of the splenic red pulp in young, aged, and aged IR mice. Arrows indicate extracellular dark-colored aggregates. (G) Plasma transferrin saturation was determined in mice at the indicated age. (H) Expression of ferroportin (FPN) on the cell membrane of RPMs derived from mice at the indicated age was assessed by flow cytometry. (I) Relative mRNA expression of hepcidin (Hamp) in the liver from mice at the indicated age was determined by qPCR. (J) Erythrophagocytosis capacity of RPMs derived from mice at the indicated age was determined by intracellular staining of the erythrocytic marker TER119 in RPMs and flow cytometry. (K) The cytosolic ROS levels in RBCs derived from the spleens of mice at the indicated age were estimated by determining CellROX Deep Red fluorescence intensity with flow cytometry. Each dot represents one mouse. Data are represented as mean ± SEM. Statistical significance versus young controls (2 months) was determined by One-Way ANOVA test with Dunnett’s Multiple Comparison test. *p<0.05, **p<0.01, ***p<0.001 and ****p<0.0001.

