

Abstract
This study aimed to compare the serum levels of 34 cytokines of children with hemophagocytic lymphohistiocytosis (HLH) and explored the specific cytokine pattern of HLH subtypes and the relationship between cytokine levels and prognosis. This retrospective study assessed the clinical data and cytokine levels of newly diagnosed children with HLH in Beijing Children’s Hospital, Capital Medical University, from January 2017 to December 2021. A total of 101 children were enrolled in the study. The levels of IFN-γ and IL-18 increased in more than 90% of patients, and MIP-1α, SDF-1α, IP-10, IL-6, IL-8, IL-10, IL-1 RA, and TNF-α increased at different levels in more than 50% of patients. The levels of IL-10 in EBV-HLH increased significantly, followed by IFN-γ and IL-18, while IL-10 and IFN-γ in CAEBV-HLH had a slight increase. Except for IL-10, the levels of IL-6, Eotaxin, IL-13, IL-18, IFN-γ, and MIP-1β in Rh-HLH increased significantly. F-HLH had significantly high IL-10 levels and a slight increase in IL-13. We showed that various cytokines could assist in differentiating HLH subtypes with ROC curve analysis. When IL-10/IL-6 was 1.37, the sensitivity and specificity of diagnosing EBV-HLH were higher than 80% (AUC = 0.837, p < 0.001). The effect of cytokine ratio on classifying HLH subtypes (17/22, 77.3%) was more significant than the single cytokine (5/22, 22.7%). The 3-year overall survival (OS) rate of children with F-HLH was the lowest during the follow-up. The 3-year OS of patients with EBV-HLH and CAEBV-HLH was significantly higher than that with F-HLH (88.1% ± 5.0% vs. 94.1% ± 5.7% vs. 57.1% ± 14.6%, p = 0.017). Cox proportional hazards model revealed that elevated GM-CSF and MCP-1, as well as CNS involvement, were independent risk factors for poor outcomes for patients with HLH. Various cytokines play important roles in HLH. Different subtypes of HLH have their specific cytokines pattern, and the ratio of cytokines may be more significant in differentiating HLH subtypes than the single one. Elevated GM-CSF and MCP-1 could be useful biomarkers for a poor prognosis for patients with HLH.
Supplementary Information
The online version contains supplementary material available at 10.1007/s00277-023-05132-6.
Keywords: Hemophagocytic lymphohistiocytosis; Children; Cytokine pattern; Subtype; Prognosis; Wenxin Ou, Yunze Zhao, and Ang Wei contributed equally as co-first authors.
Introduction
Hemophagocytic lymphohistiocytosis (HLH) is a rare, life-threatening inflammatory state characterized by cytokine storms caused by the uncontrolled activation of cytotoxic T lymphocytes and macrophages, resulting in tissue injury and multiorgan dysfunction. Various cytotoxic dysfunction of HLH subtypes lead to the cytotoxic function impairment of natural killer (NK) cells and cytotoxic T lymphocytes, but these cells can still release cytokines. Overstimulated cytotoxic cells activate the immune response, resulting in a vicious cycle and cytokine storms.
Serum cytokine storm in patients with HLH has become a research hotspot involving immune mechanism and targeted therapy of HLH. Serum soluble CD25 (sCD25) is an early-phase biomarker of T lymphocyte activation, which can competitively bind interleukin (IL)-2, inhibit lymphocytes proliferation, and interfere with immune function. The level of sCD25 is one of the diagnostic criteria of HLH. The significantly increased interferon (IFN)-γ, IL-1 β, IL-6, IL-10, and IL-18 levels in HLH also indicate important roles for these cytokines in the pathogenesis of HLH [1]. Targeted blockades of cytokines (IFN-γ, IL-1 inhibitors, IL-18, etc.) with low toxicity have achieved significant efficacy in a small number of HLH patients [2]. They have broad therapeutic prospects, and clinical trials were ongoing. Cytokines are the mediators of immune activation. Analysis of serum cytokine patterns in HLH may explore the development of various HLH subtypes from the pathogenic mechanism, which is helpful to differentiate the subtypes of HLH and promote broader targeted therapies. Herein, for the first time, we performed a study on the relationship between 34 cytokines and different HLH subtypes.
Patients and methods
Patients
A retrospective study was conducted to enroll newly diagnosed children with active HLH from January 2017 to December 2021 in Beijing Children’s Hospital, Capital Medical University. The following characteristics were collected and analyzed for each patient in this study: demographic characteristics, clinical features, laboratory data, diagnosis, treatment, and prognosis. Patient follow-up was carried out by either outpatient visits and/or telephones.
Diagnostic criteria
The diagnosis of HLH was based on the criteria (HLH-2004) of the International Histiocyte Society [3]. The classification of HLH was based on the recommendations from the North American Consortium for Histiocytosis in 2019 [4]. Children with HLH in our study were divided into the following five subtypes: (1) Epstein-Barr virus-associated HLH (EBV-HLH); (2) Chronic active EBV-associated HLH (CAEBV-HLH); (3) Malignant-associated HLH (M-HLH); (4) Rheumatological HLH (Rh-HLH); and (5) Familial HLH (F-HLH). Patients were divided into the primary HLH (pHLH) group and the secondary HLH (sHLH) group based on gene mutation. They were divided into the CNS and the non-CNS groups based on the level of central nervous system (CNS) involvement.
Determination of cytokines
Sample of every patient was collected within 72 h after admission. Cytokines levels in patients before chemotherapy were detected using the Liquid Phase Chip Technology-Luminex analytical platform system from Millipore. Thirty-four cytokines were included in the analysis, including macrophage inflammatory protein (MIP)-1α, stromal cell-derived factor (SDF)-1α, IL-27, IL-1β, IL-2, IL-4, IL-5, interferon-induced protein (IP)-10, IL-6, IL-7, IL-8, IL-10, Eotaxin, IL-12p70, IL-13, IL-17A, IL-31, IL-1 receptor A (IL-1RA), regulation upon activation normal T cell expressed and secreted (RANTES), IFN-γ, granulocyte-macrophage colony-stimulating factor (GM-CSF), tumor necrosis factor (TNF)-α, MIP-1β, IFN-α, monocyte chemotactic protein (MCP)-1, IL-9, TNF-β, growth-related oncogene (GRO)-α, IL-1α, IL-23, IL-15, IL-18, IL-21, and IL-22.
Treatment methods
All patients were treated according to the modified HLH-94 protocol immediately after solidified diagnosis3.
Statistical analysis
The number of samples is expressed by n. Continuous variables are presented as mean±standard deviation for normal distribution or median (range) for abnormal distribution. T test is used to compare the measurement data of normal distribution, and rank sum test is used to compare the measurement data of abnormal distribution. Chi-square (χ2) test was used to compare the enumeration data. Diagnostic performance was estimated with receiver operating characteristic (ROC) curve analysis. Bayesian formula was used to analyze the sensitivity and specificity of cut-off value. Survival analysis was performed by the Kaplan–Meier method, and survival curves were compared using the Log-rank test. Cox proportional hazards model was applied to multivariate analysis to investigate the independent risk factors for prognosis. All statistical analysis was performed using the Statistical Package for Social Sciences software, version 26.0 (IBM Corp, Armonk, NY, USA). Spearman correlation analysis was adopted to analyze cytokines and HLH index. In our study, p < 0.05 was considered significant.
Results
General and clinical data
A total of 101 children (55 males and 46 females) were enrolled, with a median age of 3.24 (0.46–16.78) years. All patients were divided into five groups based on the diagnostic criteria, including 42 EBV-HLH, 17 CAEBV-HLH, 8 M-HLH (all of them with non-Hodgkin’s lymphoma), 22 Rh-HLH (3 with juvenile idiopathic arthritis and 19 with autoinflammatory diseases) and 12 F-HLH (7 with PRF1 mutation and 5 with UNC13D mutation). The general data and clinical features of patients are shown in Table 1.
Table 1.
Clinical data of HLH
| Variable | Total | EBV-HLH | CAEBV-HLH | M-HLH | Rh-HLH | F-HLH | p value |
|---|---|---|---|---|---|---|---|
| No. | 101 | 42 | 17 | 8 | 22 | 12 | — |
| Age (median, range) | 3.245 (0.46–16.78) | 2.975 (0.82–16.78) | 4.74 (1.14–14.03) | 8.2 (2.38–12.73) | 2.51 (0.67–13.47) | 3.3 (0.46–12.49) | 0.096 |
| Sex (female/male) | 46/55 | 20/22 | 10/7 | 4/4 | 8/14 | 4/8 | 0.672 |
| CNS involvement (n) | 27 | 8 | 3 | 4 | 6 | 6 | 0.112 |
| Fever (n) | 101 | 42 | 17 | 8 | 22 | 12 | — |
| Rash (n) | 32 | 7 | 4 | 1 | 15 | 5 | < 0.001 |
| Lymphadenoma (n) | 71 | 25 | 15 | 6 | 15 | 10 | 0.233 |
| Splenomegaly (n) | 83 | 37 | 16 | 7 | 11 | 12 | < 0.001 |
| Hb (g/L) | 95.0 (56–128) | 93.0 (57–122) | 96.0 (71–128) | 94.5 (57–107) | 89.0 (56–119) | 100.0 (70–118) | 0.342 |
| ANC (×109/L) | 0.87 (0.05–27.71) | 0.56 (0.18–8.73) | 0.9 (0.07–4.52) | 1.22 (0.05–2.58) | 1.67 (0.06–27.71) | 0.56 (0.29–7.03) | 0.122 |
| Plt (×109/L) | 89.0 (3–288) | 74.0 (3–287) | 125.0 (21–234) | 54.0 (5–167) | 100.0 (6–217) | 67.0 (11–288) | 0.157 |
| AST (U/L) | 209.5 (20.8–3612.7) | 272.05 (21.3–3538.7) | 135.4 (34.6–1515.5) | 154.0 (54.2–1677.6) | 214.6 (41.2–3612.7) | 149.4 (20.8–385.0) | 0.268 |
| ALT (U/L) | 148.0 (11.9–2271.8) | 166.7 (15.8–978.0) | 144.2 (13.5–797.8) | 125.65 (24.1–502.2) | 148.0 (17.8–2271.8) | 77.7 (11.9–357.9) | 0.701 |
| LDH (U/L) | 809.0 (189–15589) | 1007.5 (270–15589) | 598.0 (454–2585) | 849.0 (189–2436) | 1157.0 (339–3669) | 489.0 (308–1121) | 0.013 |
| CK (U/L) | 36.0 (9–1033) | 36.0 (9–1033) | 41.0 (12–229) | 43.5 (10–134) | 34.0 (9–188) | 28.0 (12–135) | 0.508 |
| CK-MB (U/L) | 20.0 (7–103) | 20.5 (8–103) | 20.0 (7–66) | 18.0 (7–45) | 25.0 (9–95) | 14.0 (8–43) | 0.125 |
| Albumin (g/L) | 32.3 (19.0–66.3) | 33.0 (21.2–47.6) | 33.3 (21.6–43.8) | 32.7 (21.3–48.4) | 31.9 (19.0–66.3) | 31.7 (19.6–43.6) | 0.968 |
| TBil (umol/L) | 10.17 (3.42–258.68) | 14.54(4.83–162.85) | 9.17 (3.73–58.73) | 17.63 (3.42–258.68) | 9.76 (3.80–117.0) | 8.89 (5.0–39.52) | 0.351 |
| Triglyceride (mmol/L) | 2.59 (0.73–9.58) | 3.06 (0.94–9.58) | 2.06 (1.01–3.87) | 2.76 (0.73–6.62) | 2.76 (0.89–7.12) | 2.92 (1.29–4.48) | 0.121 |
| Fibrinogen (g/L) | 1.535 (0.28–3.81) | 1.40 (0.28–3.63) | 2.04 (0.76–3.15) | 1.205 (0.55–2.62) | 1.62 (0.79–3.03) | 1.44 (0.77–3.81) | 0.491 |
| BUN (mmol/L) | 3.86 (0.59–16.09) | 3.985 (1.60–16.09) | 3.71 (2.34–8.91) | 4.36 (1.63–10.75) | 4.09 (2.30–12.41) | 3.22 (0.59–6.16) | 0.636 |
| Creatinine (𝜇mol/L) | 26.7 (3.8–108.5) | 27.15 (14.5–62.6) | 26.1 (4.2–108.5) | 27.7 (3.8–58.5) | 25.0 (13.5–81.6) | 29.2 (16.1–68.0) | 0.571 |
| Ferritin (ng/ml) | 2380.0 (24.4–139139.0) | 3968.0 (166.2–139139.0) | 296.9 (24.4–4455.0) | 1839.0 (24.5–8032.0) | 6536.0 (407.3–109754.0) | 341.1 (119.0–2144.0) | <0.001 |
| Hemophagocytosis (n) | 81 | 35 | 10 | 4 | 22 | 10 | <0.001 |
| NK (%) | 15.36 (7.80–27.01) | 16.665 (11.97–27.01) | 14.97 (7.80–26.59) | 15.215 (13.02–19.15) | 14.26 (9.22–21.12) | 13.98 (10.38–20.58) | 0.005 |
| Soluble CD25 (pg/ml) | 23911.0 (3017–273270) | 33257.0 (3987–273270) | 15347.0 (5988–34716) | 18940.5 (7758–34036) | 16536.5 (3017–107740) | 40118.0 (5631–108150) | 0.001 |
n, number; EBV-HLH, Epstein-Barr virus-associated HLH; CAEBV-HLH, chronic active EBV-associated HLH; M-HLH, malignancy-associated hemophagocytic lymphohistiocytosis; Rh-HLH, rheumatological-HLH; F-HLH, familial HLH; CNS, central nervous system; ANC, absolute neutrophil count; PLT, platelet count; AST, aspartate aminotransferase; ALT, alanine aminotransferase; CK, creatine kinase; LDH, lactate dehydrogenase; TBil, total bilirubin; BUN, blood urea nitrogen; NK, natural killer
Characteristics of cytokines in HLH.
Comparison of cytokines among different subtypes of HLH
Thirty-four cytokines among different subtypes of HLH were compared and analyzed in this study. The levels of IFN-γ and IL-18 increased in more than 90% of patients, while MIP-1α, SDF-1α, IP-10, IL-6, IL-8, IL-10, IL-1 RA, and TNF-α increased at different levels in more than 50% of patients. We compared cytokines among different HLH subtypes and found significant differences in IL-6, IL-10, Eotaxin, IL-13, IFN-γ, MIP-1β, and IL-18 (Table 2). By grouping and comparing those seven cytokines, we preliminarily observed that different HLH subtypes had specific cytokines patterns (Fig. 1 and Supplemental Figure 1). For patients with infection-related HLH, the cytokine pattern of EBV-HLH and CAEBV-HLH may be different. EBV-HLH had significantly increased IL-10 levels, followed by IFN-γ and IL-18, while IL-10 and IFN-γ were slightly higher in CAEBV-HLH than in other subtypes. Except for IL-10, IL-6, Eotaxin, IL-13, IL-18, IFN-γ and MIP-1 β in Rh-HLH increased significantly. F-HLH had significantly increased IL-10 levels and slightly increased IL-13 levels. In M-HLH, the median of IL-10, IFN-γ, and MIP-1β was all higher than normal, but there was no specific finding compared with other subtypes.
Table 2.
Comparison of cytokines in HLH subtypes
| Subtype | Reference range (pg/ml) | IM-HLH | CAEBV-HLH | M-HLH | Rh-HLH | F-HLH | p value |
|---|---|---|---|---|---|---|---|
| n | 42 | 17 | 8 | 22 | 12 | – | |
| MIP-1α | ≤ 8 | 25.75 (1.3–277.0) | 28.6 (1.1–120.2) | 21.3 (1.1–85.9) | 40.8 (1.1–191.6) | 29.8 (1.1–104.9) | 0.099 |
| SDF-1α | ≤ 620 | 564.75 (32.8–3060.0) | 752.1 (182.0–2612.0) | 745.1 (376.6–1590.0) | 719.4 (227.4–1912.0) | 531.9 (194.2–1027.0) | 0.165 |
| IL-27 | ≤ 45 | 8.3 (0.0–167.8) | 8.6 (0.0–443.1) | 8.65 (0.0–60.6) | 7.9 (0.0–69.2) | 6.7 (0.0–13.6) | 0.507 |
| IL-1β | ≤ 2 | 1.2 (0.3–48.8) | 0.8 (0.3–26.5) | 0.8 (0.4–14.0) | 2.0 (0.6–16.3) | 1.3 (0.3–54.2) | 0.074 |
| IL-2 | ≤ 21 | 4.55 (1.6–71.4) | 4.1 (1.2–67.0) | 3.4 (1.4–17.5) | 4.4 (1.2–34.3) | 4.9 (2.2–13.6) | 0.926 |
| IL-4 | ≤ 11 | 6.45 (2.2–82.4) | 5.8 (2.2–67.9) | 5.3 (0.0–61.5) | 10.0 (0.0–94.6) | 6.8 (2.8–276.2) | 0.274 |
| IL-5 | ≤ 6 | 3.65 (0.0–34.9) | 4.0 (0.0–12.4) | 4.15 (3.3–6.4) | 4.7 (0.0–30.0) | 3.3 (0.0–71.4) | 0.471 |
| IP-10 | ≤ 102 | 383.8 (31.6–1193.0) | 409.4 (61.1–5113.0) | 500.85 (38.1–1816.0) | 575.4 (50.1–6564.0) | 315.0 (85.5–2834.0) | 0.198 |
| IL-6 | ≤ 8 | 6.45 (3.4–218.7) | 7.4 (4.1–224.6) | 7.9 (4.4–733.7) | 48.8 (0.0–376.2) | 6.1 (4.1–190.0) | 0.031* |
| IL-7 | ≤ 3 | 0.7 (0.2–5.7) | 0.8 (0.2–4.6) | 0.55 (0.3–2.9) | 0.5 (0.2–10.5) | 1.0 (0.2–6.6) | 0.843 |
| IL-8 | ≤ 20 | 29.7 (0.7–1180.0) | 38.4 (0.7–376.1) | 52.65 (20.8–277.0) | 64.0 (3.9–1105.0) | 47.6 (1.8–886.4) | 0.296 |
| IL-10 | ≤ 2 | 44.6 (0.3–1834.0) | 3.6 (0.4–78.6) | 6.5 (1.0–51.70 | 5.8 (0.5–555.6) | 44.3 (2.3–464.4) | <0.001* |
| Eotaxin | ≤ 113 | 28.9 (0.9–160.2) | 62.1 (3.1–209.9) | 43.1 (16.6–484.4) | 61.3 (6.1–190.6) | 34.3 (6.4–417.7) | 0.009* |
| IL-12p70 | ≤ 6 | 3.15 (1.3–10.3) | 3.2 (1.7–13.7) | 2.4 (1.2–13.2) | 5.2 (1.4–12.2) | 3.3 (1.0–33.4) | 0.233 |
| IL-13 | ≤ 3 | 2.8 (0.4–32.2) | 2.1 (0.6–17.6) | 2.1 (0.7–14.7) | 3.9 (1.2–26.4) | 1.3 (0.6–14.8) | 0.028* |
| IL-17A | ≤ 2 | 1.1 (0.4–84.3) | 1.2 (0.4–76.9) | 1.05 (0.6–14.7) | 1.1 (0.0–5.6) | 1.0 (0.8–76.9) | 0.974 |
| IL-31 | ≤ 13 | 3.8 (0.0–8.4) | 3.3 (1.8–8.4) | 5.1 (3.1–6.7) | 3.8 (0.0–8.6) | 5.4 (2.9–62.3) | 0.132 |
| IL-1 RA | ≤ 206 | 4293.5 (0.0–102329.0) | 2337.0 (14.4–15917.0) | 2534.05 (0.0–13509.0) | 6531.0 (46.6–21819.0) | 3283.0 (192.7–19078.0) | 0.409 |
| RANTES | ≤ 257 | 91.0 (10.4–411.0) | 94.6 (8.6–567.3) | 106.6 (38.3–1304.0) | 142.3 (27.3–979.1) | 85.4 (29.4–1168.0) | 0.115 |
| IFN-γ | ≤ 7 | 128.05 (0.0–1237.0) | 83.7 (12.8–1054.0) | 224.5 (0.0–451.3) | 322.4 (0.0–2465.0) | 74.4 (14.7–593.0) | 0.015* |
| GM-CSF | ≤ 13 | 6.25 (2.8–29.4) | 5.3 (2.8–12.1) | 7.55 (3.3–28.7) | 5.6 (2.8–13.4) | 5.6 (3.7–29.9) | 0.572 |
| TNF-α | ≤ 8 | 13.05 (3.1–116.6) | 9.6 (1.7–76.7) | 6.1 (4.4–61.8) | 27.7 (3.4–99.3) | 5.8 (3.4–105.3) | 0.103 |
| MIP-1β | ≤ 218 | 118.75 (2.5–991.5) | 196.6 (16.8–613.5) | 184.9 (30.7–296.8) | 285.5 (48.9–923.9) | 150.7 (2.5–337.6) | 0.009* |
| IFN-α | ≤ 1 | 0.2 (0.0–9.5) | 0.2 (0.0–10.3) | 0.3 (0.2–0.5) | 0.3 (0.0–4.0) | 0.2 (0.0–3.6) | 0.082 |
| MCP-1 | ≤ 108 | 61.15 (8.9–760.1) | 59.0 (8.9–223.5) | 117.1 (1.4–310.8) | 141.2 (1.6–513.0) | 96.2 (7.9–1109.0) | 0.240 |
| IL-9 | ≤ 8 | 2.35 (1.0–30.0) | 2.8 (1.2–17.6) | 4.3 (1.2–19.4) | 3.1 (0.0–6.2) | 3.4 (1.2–5.0) | 0.109 |
| TNF-β | ≤ 30 | 3.5 (0.0–45.1) | 4.5 (1.7–19.4) | 2.75 (0.0–5.5) | 3.3 (0.0–13.8) | 4.9 (2.3–8.3) | 0.734 |
| GRO-α | ≤ 25 | 14.6 (1.2–70.9) | 29.7 (2.0–121.4) | 34.6 (4.9–82.0) | 36.4 (2.1–273.1) | 16.8 (1.2–65.4) | 0.124 |
| IL-1α | ≤ 5 | 0.4 (0.2–55.7) | 0.4 (0.3–18.6) | 0.45 (0.2–5.3) | 0.4 (0.3–3.3) | 0.4 (0.3–10.5) | 0.943 |
| IL-23 | ≤ 14 | 5.1 (0.0–25.1) | 5.5 (3.3–21.3) | 7.65 (2.9–97.4) | 5.5 (0.0–88.0) | 4.4 (0.0–243.9) | 0.655 |
| IL-15 | ≤ 11 | 1.4 (0.0–29.7) | 1.6 (0.9–52.4) | 1.9 (1.4–3.3) | 1.4 (0.0–32.5) | 1.6 (1.0–151.9) | 0.091 |
| IL-18 | ≤ 50 | 280.2 (46.6–889.3) | 267.2 (9.0–1094.0) | 284.4 (88.1–759.8) | 545.7 (47.2–3248.0) | 365.8 (108.4–996.3) | 0.043* |
| IL-21 | ≤ 205 | 4.1 (1.4–277.3) | 4.6 (1.7–95.3) | 4.35 (1.8–69.9) | 4.2 (1.9–22.4) | 4.6 (1.7–183.2) | 0.513 |
| IL-22 | ≤ 59 | 9.3 (3.1–1353.0) | 8.8 (4.5–841.5) | 9.8 (4.5–608.1) | 9.9 (1.8–107.5) | 9.8 (4.5–226.1) | 0.992 |
*a significant difference
Fig. 1.

Different levels of IL-6, IL-10, Eotaxin, IL-13, IFN-γ, MIP-1β, and IL-18 in HLH subtypes
There was a significant difference in IL-6 levels between the non-CNS group (n = 74) and the CNS group (n = 27) (11.2 (0.0–733.7)pg/ml vs. 5.8 (3.5–177.9)pg/ml, p = 0.047) and IL-13 levels between the sHLH group (n = 89) and the pHLH group (n = 12) (2.25 (0.4–32.2)pg/ml vs. 1.35 (0.6–14.8) pg/ml, p = 0.034).
The diagnostic significance of cytokine
We further explored the significance of IL-6, IL10, IL-13, IFN-γ, IL-18, and their ratios in the differential diagnosis of HLH subtypes through ROC curve analysis (Fig. 2). Various cytokines and their ratios could help diagnose EBV-HLH, CAEBV-HLH, Rh-HLH, and F-HLH. After summarizing the parameters of cytokines which assisted in differential diagnosis, we found the effect of cytokine ratios on classifying HLH subtypes (17/22, 77.3%) was more significant than the single cytokine (5/22, 22.7%). When IL-10/IL-6 was 1.37, the sensitivity and specificity for EBV-HLH were higher than 80% (AUC = 0.837, p < 0.001) (Supplemental Table 1).
Fig. 2.

ROC curve analysis showed that the cytokine and their ratios could be biomarkers for diagnosing HLH
The prognostic significance of cytokines
Eighteen patients died with a median follow-up time of 3.06 (2.85–3.26) years, including 13 with multiple organ failure caused by disease activity, 2 with septic shock caused by infection, and 3 giving up because of critical condition. The 3-year overall survival (OS) rate in children with F-HLH was the lowest. The 3-year OS in EBV-HLH and CAEBV-HLH was significantly higher than in patients F-HLH (88.1% ± 5.0% vs. 94.1% ± 5.7% vs. 57.1% ± 14.6%, p = 0.017). CNS involvement and pHLH also suggested a poor outcome (Fig. 3). By comparing the effects of increased 34 cytokines levels on prognosis, we found that the patients with increased GM-CSF (n = 4) and MCP-1 (n = 43) levels had lower 3-year OS rates, respectively (84.3% ± 3.7% vs. 25.0% ± 21.7%, p = 0.001; 89.1% ± 4.2% vs. 71.8% ± 6.9%, p = 0.018). Compared with patients with elevated IP-10, IFN-γ, and IL-18, patients with normal levels of these three cytokines all survived (p = 0.071, 0.196, and 0.260, respectively). In addition, Cox proportional hazards model showed that elevated GM-CSF and MCP-1 levels and CNS involvement were independent risk factors for poor prognosis in patients with HLH (Supplemental Table 2).
Fig. 3.
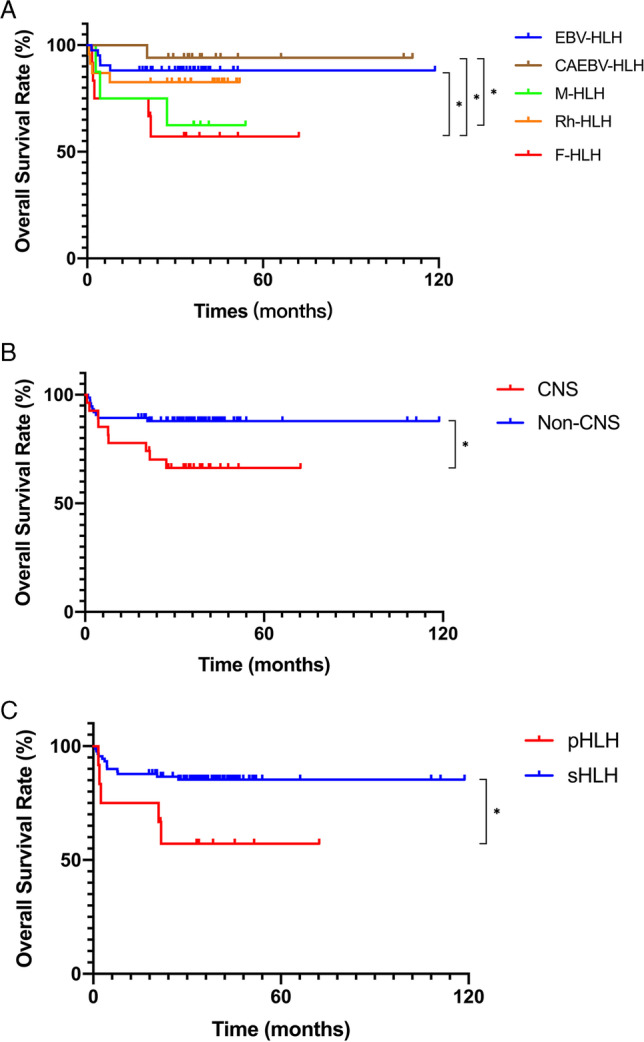
The 3-year OS rates of different groups. A The 3-year OS rates of EBV-HLH, CAEBV-HLH, M-HLH, Rh-HLH, and F-HLH were 88.1% ± 5.0%, 94.1% ± 5.7%, 62.5% ± 17.1%, 82.6% ± 7.9%, and 57.1% ± 14.6%, respectively. The 3-year OS rates were higher in EBV-HLH and CAEBV-HLH than in F-HLH (p = 0.017). The 3-year OS rates were higher in CAEBV-HLH than in M-HLH (p = 0.040). B The 3-year OS rates were higher in the non-CNS group than in the CNS group (87.9% ± 3.8% vs. 66.3% ± 9.2%, p = 0.018). C The 3-year OS rates were higher in the sHLH group than in the pHLH group (85.3% ± 3.8% vs. 57.1% ± 14.6%, p = 0.016)
Associations between cytokines levels and HLH index
The correlation between cytokines (IL-6, IL-10, Eotaxin, IL-13, IFN-γ, MIP-1β, IL-18) and HLH index was analyzed. We demonstrated that IL-6 and IL-10 levels were negatively correlated with the NK cells activity (r = −0.305, p = 0.002; r = −0.242, p = 0.017), and IL-10 levels were positively correlated with triglycerides and serum sCD25 levels (r = 0.306, p = 0.002; r = 0.433, p < 0.001). IFN-γ levels were negatively correlated with fibrinogen levels and positively correlated with ferritin levels (r = −0.259, p = 0.009; r = 0.428, p < 0.001). A negative correlation was observed between Eotaxin and sCD25 (r = −0.325, p = 0.003), and a positive correlation was noticed between MIP-1 beta levels and fibrinogen levels (r = 0.251 and p = 0.012).
Discussion
An impaired host immune system in HLH provides an ineffective but overactive response to pathogen stimulation. The immune system cannot adequately eliminate the stimulation and does not undergo physiologic downregulation, which instead initiates a persistent cytokine secretion and intensified immune activation. Cytokines, typically released by antigen-presenting cells (APC) such as macrophages, T helper (Th) cells, and cytotoxic cells, induce immune activation [5]. Th1 type cytokines mainly contain IFN-γ, and Th2 type cytokines mainly contain IL-4, IL-12, and IL-18. Serum cytokine patterns may unravel the features of immune activation in the inflammatory response. In 2004, Jordan et al. [6] reported on mice deficient in perforin that developed HLH when infected with lymphocytic choriomeningitis virus. In this model, CD8+T cells and IFN were essential for disease expression. Sustained activation of CD8+T cells results in the release of high IFN, a potent activator of macrophages. In response, macrophages produce large amounts of IL-1β, IL-6, IL-18, and TNF [7]. TNF induces further macrophage activation in an autocrine and paracrine manner [8]. Cytokine storm is the key to the development of HLH. Therefore, we performed a study on serum levels of 34 cytokines in children with HLH and aimed to contribute to early diagnosis and differentiation of HLH by exploring serum cytokine patterns of different subtypes of HLH.
Serum cytokines in patients with HLH have significant clinical characteristics. Yang et al. [9] retrospectively analyzed the cytokines levels in 105 patients newly diagnosed with HLH and found that IL-6, IL-10, and IFN-γ moderately or significantly elevated in most patients. Xu et al. [10] determined serum levels of Th1/Th2 cytokines in 756 children with fever admitted to their hematology-oncology unit. The results suggested that children with HLH had a cytokine pattern of a significant increase of IFN-γ and IL-10 combined with a slightly increased level of IL-6. Our study showed that IFN-γ and IL-18 increased in more than 90% of patients, while MIP-1α, SDF-1α, IP-10, IL-6, IL-8, IL-10, IL-1 RA, and TNF-α increased at different levels in more than 50% of patients. IFN-γ can upregulate the expression of major histocompatibility complex I protein on infected cells, further promoting the inflammatory cytokines storm. The significant elevated IFN-γ and its induced chemokine IP-10 (CXCL10), inflammatory cytokines IL-6, IL-10, and IL-18 produced by T lymphocytes and chemokine IL-8, MIP-1α, and SDF-1α in HLH suggest that the activation of T cell and the monocyte-macrophage system could play a role in HLH. IFN-γ appears to be a critical pathogenic molecule in many forms of HLH. However, because of its very short half-life in vivo, it is not easily detected in serum [11].
Our results suggest a correlation between the serum cytokines levels and some HLH indexes. Although the correlation was not strong, it could still enlighten us. Excess cytokines such as IL-6 and IL-10 may induce the persistent inflammatory response in MAS by mediating the exhaustion of NK cells [12, 13]. We observed that IL-6 and IL-10 levels were negatively correlated with NK-cell activity (r = −0.305, p = 0.002; r = −0.242, p = 0.017), while IL-10 levels were positively correlated with triglyceride and serum sCD25 levels (r = 0.306, p = 0.002; r = 0.433, p < 0.001). As one of the key molecules in the pathogenesis of HLH, IFN-γ is also related to the severity of the disease. Although specific mechanisms of the correlation between cytokines and HLH-related indexes remain unclear, high cytokines levels such as IL-6 and IFN-γ indeed contribute to persistent fever, hyperlipidemia, vascular endothelial activation, and coagulopathy, as well as some complications such as hepatitis, CNS vasculitis, and demyelination in HLH [13]. Additionally, we also found correlations between several chemokines and HLH indexes. Eotaxin levels were negatively correlated with the sCD25 levels (r = −0.325, p = 0.003), and MIP-1β levels were positively correlated with the level of fibrinogen (r = 0.251, p = 0.012). Eotaxin/CCL11 belongs to the family of inflammatory cytokines, which is mainly involved in recruiting eosinophils to inflammatory sites and has been widely studied in inflammatory diseases such as allergic diseases and atherosclerosis [14]. MIP-1β is a chemokine and activator of monocytes. The role of Eotaxin and MIP-1β in HLH needs to be further studied.
Our study suggested that different HLH subtypes present distinct cytokine patterns. In EBV-HLH, the level of IL-10 increased significantly, followed by IL-18 and IFN-γ. This is similar with previous studies, as IL-10 levels were much higher in patients with EBV-HLH than in sepsis [15]. Xu et al. [16] suggested the specific cytokine pattern of markedly elevated levels of IFN-γ and modestly elevated IL-10 levels in EBV-HLH. In EBV-HLH, EBV-infected cells secrete viral IL-10, a product of the EBV replication gene BCRF1, which shares structural and functional similarities with human IL-10 [17]. Thus, the high IL-10 levels detected in EBV-HLH may be the amount of the human and viral IL-10. Meanwhile, different factors may regulate the expression of IL-10 through different pathways [18–20]. Thus, the high expression of IL-10 in EBV-HLH may also be a compensatory increase. IL-10 is an important negative immunoregulatory factor in vivo, produced mainly by activated monocytes/macrophages, Treg cells, and Th cells. It plays an anti-inflammatory role by inhibiting the release of pro-inflammatory mediators, antigen presentation, and phagocytosis [21]. However, some studies have shown that the high level of IL-10 was an independent risk factor for poor prognosis in HLH [22]. IL-10 may act as an “alarm factor,” reflecting immune activation and disease severity. In our study, IL-10 and IFN-γ in patients with CAEBV-HLH were not significantly higher than in other subtypes. The different cytokine patterns of CAEBV-HLH and EBV-HLH may be related to their different pathogenic mechanisms. Kasahara et al. [23] revealed that EBV predominantly infected B cells and/or CD8+T cells in EBV-HLH, while the predominant EBV-infected cell populations were CD4+T cells or NK cells in CAEBV. Since the transition from EBV-HLH to CAEBV has been found, the T cells subset dominance might be a dynamic phenomenon, and the difference in cytokine patterns may also arise from the time of analysis. But it remains unclear at present. In addition, cytokine gene polymorphism could induce producing different levels of cytokine in patients with EBV-related diseases (IM, EBV-HLH, and CAEBV), affecting the development of EBV-related diseases [24]. This may also explain why there were different cytokine patterns between CAEBV-HLH and EBV-HLH. Shimizu et al. [25] investigated the clinical significance of serum IL-6 and IL-18 levels for predicting MAS development in 76 patients with JIA. The results showed that the serum IL-18 levels during the active phase in patients with MAS were significantly higher than in those without MAS. This is consistent with our results. In addition, IL-13, Eotaxin, IFN-γ, and MIP-1β also increased significantly in Rh-HLH. The high levels of cytokines in Rh-HLH might have critical roles in the pathogenesis of autoimmune diseases. Ruscitti et al. [26] also observed that MAS patients showed significantly elevated levels of the above cytokines. Macrophages play a pivotal role in the development of MAS, and IFN-γ is a potent activator of macrophages, primarily secreted by activated T cells and NK cells. A study in vitro undertaken by Cifaldi et al. [27] revealed that excess IL-6 might mediate the impairment in NK-cell function by lowering perforin and granzyme B production. MIP is produced by T lymphocytes, especially Th1 cells, which IL-18 can induce. Our study also found that the levels of IL-10, IFN-γ, and IL-13 increased in F-HLH, especially for IL-10. The development of F-HLH involves gene mutations of perforin and its related proteins, which are required to maintain normal functions in cytotoxic T cells and NK cells. In the mice model of perforin deficiency, ELISA detected that the F-HLH development depended on the production of IFN-γ [6]. We demonstrated a primarily increase of IL-10 in F-HLH and EBV-HLH. The difference may be attributed to the detection methods. M-HLH may occur before or during tumor therapy and can be induced by infections and immunotherapy [28]. However, no specific cytokines of M-HLH were found in this study.
We then investigated that various serum cytokines could differentiate different HLH subtypes. The IL-6, IL-10, IL-13, IFN-γ, and IL-18 levels in each HLH subtype were significantly different and were helpful for diagnosis. Because the individual cytokine levels can be easily affected by the drugs applied before sampling and by storage and shipping, we also analyzed the significance of the ratio of those cytokines. Han et al. [29] compared the Th1/Th2 cytokines (IL-2, IL-4, IL-6, IL-10, TNF-α, and IFN-γ) in patients with EBV-HLH or sepsis before and after treatment. Their study showed that IFN-γ/IL-6 and IL-10/IL-6 were novel specific indicators for differential diagnosis of EBV-HLH and IL-6, IL-10, TNF-α, and IFN-γ were useful indices for monitoring the therapeutic effect of EBV-HLH. We also confirmed that IFN-γ/IL-6 and IL-10/IL-6 were helpful in differentiating EBV-HLH, with a sensitivity and specificity of more than 80%. Meanwhile, IL-10, IL10/IL-13, IL-10/IL-18, and IL-10/IFN-γ also have differential significance. Additionally, various cytokines and their ratios can help diagnose CAEBV-HLH, Rh-HLH, and F-HLH to a certain extent. And the effect of cytokine ratio on classifying HLH subtypes (17/22, 77.3%) was more significant than the single cytokine (7/22, 22.7%). Our study also revealed that Th2 type cytokines IL-6 and IL-13 might be novel diagnostic markers of the CNS group (n = 27) and the non-CNS group (n = 74), the sHLH group (n = 89), and the pHLH group (n = 12), respectively. The non-CNS group had higher IL-6 levels, while IL-13 levels were higher in the sHLH group than in the pHLH group. IL-6 down-modulated the cytotoxic activity of NK cells by reducing perforin expression levels [27]. IL-13 is one of the potent inducers of macrophage polarization into the M2 phenotype with an anti-inflammatory effect [30]. However, the relationship between those two cytokines and HLH has not been reported, so further study is required. In addition, due to the small sample size, future large-scale studies may help to confirm the significance of cytokines.
The prognosis of HLH was affected by various factors. Our study showed that among the subtypes of HLH, the 3-year OS of patients with F-HLH was the lowest. GM-CSF and MCP-1 were independent risk factors of poor outcomes for HLH patients. They are equivalent to the “switch” proteins in the inflammatory response, promoting the proliferation of monocytes/macrophages as well as recruitment at the site of inflammation [31, 32]. Meanwhile, GM-CSF has been proven to be involved in developing various inflammatory and autoimmune diseases and could be used as a therapeutic target [33]. Gowri et al. [34] reported that GM-CSF could be a potential biomarker for disease severity and prognosis in their study about serum cytokines in patients with severe dengue virus infection. MCP-1 act as a regulator in the polarization of a Th1 phenotype to a Th2 phenotype. A study focused on serum cytokines in critically ill COVID-19 patients by Chen et al. [35] showed that the remarkable increase of MCP-1 indicated a poor prognosis in patients with severe inflammatory diseases. Patients with normal levels of IL-18, IFN-γ, and IP-10 in our study all survived during follow-up. The significance of IL-18 and IFN-γ in HLH has been widely explored. IP-10 is a kind of IFN-induced protein. These three cytokines may be potential indicators for predicting the prognosis in HLH patients, though there was no significant difference in our analysis.
It should be explained that cytokines were analyzed by the Luminex technology here, which was different from the cytometric bead array (CBA) used in previous studies [16, 36]. Although both are antibody-based immunoassays, researchers reported some differences in the results [37]. In addition, Valaperti et al. [38] demonstrated that correlation between different techniques was almost absent, and almost all the CBA and half of the Luminex showed low reproducibility. The levels of the same cytokine vary greatly depending on the technique employed in making the measurement, such as the IL-18 levels obtained for one patient’s sample ranging from 288 to 914 pg/ml [39]. In addition, studies comparing CBA from BD with Luminex kits from Millipore demonstrated a lack of standardization between them [40]. Such various measurements may be related to the different antibodies used by different techniques [41]. Therefore, the difference between cytokine levels in our analysis and previous studies may be due partly to detection technologies.
Although this is a large-scale study of serum cytokine patterns in patients with newly diagnosed HLH, there were still some limitations. At first, we did not monitor the dynamic changes of serum cytokines during disease. Secondly, many factors affect the cytokine levels, and the interaction of various cytokines and their functions in the development of diseases are unclear. Thirdly, this is a retrospective study in a single center, lacking the universality of prospective multicenter studies. Thus, more studies are required to explore the serum cytokine pattern of children with HLH.
Conclusion
Various cytokines play important roles in HLH and are correlated with some HLH indexes. Different subtypes of HLH present with specific cytokine patterns. EBV-HLH significantly increased IL-10, followed by IFN-γ and IL-18, while IL-10 and IFN-γ in CAEBV-HLH increased slightly. Except for IL-10, levels of IL-6, Eotaxin, IL-13, IL-18, IFN-γ, and MIP-1β were significantly increased in patients with Rh-HLH. F-HLH had a cytokine pattern with significantly high IL-10 levels and slightly increased IL-13 levels. In addition, the effect of cytokine ratio on differentiating HLH subtypes may be more significant than the single cytokine. Elevated GM-CSF and MCP-1 indicate a poor prognosis in patients with HLH. Further studies are needed to determine the clinical significance of some elevated cytokine levels in HLH.
Supplementary information
Supplemental Figure 1 Cytokine pattern in HLH subtypes (TIFF 4971 kb)
Supplemental Table 1 ROC analysis (DOCX 17 kb)
Supplemental Table 2 Multivariate analysis of HLH prognosis (DOCX 14 kb)
Acknowledgements
We thank all the patients and their families for their kind cooperation. We thank all the members of the clinical team who provided care for patients. This work was supported by the National Natural Science Foundation of China (No.82070202), the Beijing Municipal Science & Technology Commission (No. 7214226), the Special Fund of the Pediatric Medical Coordinated Development Center of Beijing Hospitals Authority (No. XTZD20180202), National Science and Technology Key Projects (No. 2017ZX09304029001), and Funding for Reform and Development of Beijing Municipal Health Commission.
Abbreviations
- HLH
Hemophagocytic lymphohistiocytosis
- NK
Natural killer
- sCD25
Soluble CD25
- IL
Interleukin
- EBV-HLH
Epstein-Barr virus-associated HLH
- CAEBV-HLH
Chronic active EBV-associated HLH
- Rh-HLH
Rheumatological HLH
- F-HLH
Familial HLH
- pHLH
Primary HLH
- sHLH
Secondary HLH
- CNS
Central nervous system
- MIP
Macrophage inflammatory protein
- SDF
Stromal cell-derived factor
- IP
Interferon-induced protein
- RANTES
Regulation upon activation normal T cell expressed and secreted
- GM-CSF
Granulocyte-macrophage colony-stimulating factor
- TNF
Tumor necrosis factor
- MCP
Monocyte chemotactic protein
- GRO
Growth-related oncogene
- ROC
Receiver operating characteristic
- APC
Antigen-presenting cells
- Th
T helper
- CBA
Cytometric bead array
Author contributions
Wenxin Ou, Yunze Zhao, and Ang Wei: writing—original draft
Honghao Ma, Qing Zhang: writing—review and editing
Liping Zhang, Hongyun Lian: data curation
Liping Zhang, Dong Wang: formal analysis
Zhigang Li, Tianyou Wang, and Rui Zhang: project administration.
Data availability
The data that support the findings of this study are available on request from the corresponding author.
Declarations
Ethical approval and consent to participate
This study was conducted in accordance with the Declaration of Helsinki and approved by the Institutional Review Board (IRB) of Beijing Children’s Hospital, Capital Medical University.
Consent for publication
All authors have read and approved the final manuscript. All parents signed informed consent forms and approved the final manuscript.
Conflicts of interest
The authors declare no competing interests.
Footnotes
Publisher’s note
Springer Nature remains neutral with regard to jurisdictional claims in published maps and institutional affiliations.
Wenxin Ou, Yunze Zhao and Ang Wei contributed equally to this work.
Contributor Information
Zhigang Li, Email: ericlzg70@hotmail.com.
Tianyou Wang, Email: wangtianyou@bch.com.cn.
Rui Zhang, Email: ruizh1973@126.com.
References
- 1.Al-Samkari H, Berliner N. Hemophagocytic lymphohistiocytosis. Annu Rev Pathol. 2018;13(1):27–49. doi: 10.1146/annurev-pathol-020117-043625. [DOI] [PubMed] [Google Scholar]
- 2.Griffin G, Shenoi S, Hughes GC. Hemophagocytic lymphohistiocytosis: an update on pathogenesis, diagnosis, and therapy. Best Pract Res Clin Rheumatol. 2020;34(4):101515. doi: 10.1016/j.berh.2020.101515. [DOI] [PubMed] [Google Scholar]
- 3.Henter J-I, Horne A, Aricó M, et al. HLH-2004: diagnostic and therapeutic guidelines for hemophagocytic lymphohistiocytosis. Pediatr Blood Cancer. 2007;48(2):124–131. doi: 10.1002/pbc.21039. [DOI] [PubMed] [Google Scholar]
- 4.Jordan MB, Allen CE, Greenberg J, et al. Challenges in the diagnosis of hemophagocytic lymphohistiocytosis: recommendations from the North American Consortium for Histiocytosis (NACHO) Pediatr Blood Cancer. 2019;66(11):e27929. doi: 10.1002/pbc.27929. [DOI] [PMC free article] [PubMed] [Google Scholar]
- 5.Maxeiner H-G, Schneider EM, Kurfiss S-T, et al. Cerebrospinal fluid and serum cytokine profiling to detect immune control of infectious and inflammatory neurological and psychiatric diseases. Cytokine. 2014;69(1):62–67. doi: 10.1016/j.cyto.2014.05.008. [DOI] [PubMed] [Google Scholar]
- 6.Jordan MB, Hildeman D, Kappler J, et al. An animal model of hemophagocytic lymphohistiocytosis (HLH): CD8+ T cells and interferon gamma are essential for the disorder. Blood. 2004;104(3):735–743. doi: 10.1182/blood-2003-10-3413. [DOI] [PubMed] [Google Scholar]
- 7.Billiau AD, Roskams T, Damme-Lombaerts RV, et al. Macrophage activation syndrome: characteristic findings on liver biopsy illustrating the key role of activated, IFN-gamma-producing lymphocytes and IL-6- and TNF-alpha-producing macrophages. Blood. 2005;105(4):1648–1651. doi: 10.1182/blood-2004-08-2997. [DOI] [PubMed] [Google Scholar]
- 8.Crayne CB, Albeituni S, Nichols KE, et al. The immunology of macrophage activation syndrome. Front Immunol. 2019;10:119. doi: 10.3389/fimmu.2019.00119. [DOI] [PMC free article] [PubMed] [Google Scholar]
- 9.Yang S-L, Xu X-J, Tang Y-M, et al. Associations between inflammatory cytokines and organ damage in pediatric patients with hemophagocytic lymphohistiocytosis. Cytokine. 2016;85:14–17. doi: 10.1016/j.cyto.2016.05.022. [DOI] [PubMed] [Google Scholar]
- 10.Xu X-J, Tang Y-M, Song H, et al. Diagnostic accuracy of a specific cytokine pattern in hemophagocytic lymphohistiocytosis in children. J Pediatr. 2012;160(6):984–990.e981. doi: 10.1016/j.jpeds.2011.11.046. [DOI] [PubMed] [Google Scholar]
- 11.Torres C, Aránguez I, Rubio N. Expression of interferon-gamma receptors on murine oligodendrocytes and its regulation by cytokines and mitogens. Immunology. 1995;86(2):250–255. [PMC free article] [PubMed] [Google Scholar]
- 12.Vandenhaute J, Wouters CH, Matthys P. Natural killer cells in systemic autoinflammatory diseases: a focus on systemic juvenile idiopathic arthritis and macrophage activation syndrome. Front Immunol. 2019;10:3089. doi: 10.3389/fimmu.2019.03089. [DOI] [PMC free article] [PubMed] [Google Scholar]
- 13.Grom AA. Natural killer cell dysfunction: a common pathway in systemic-onset juvenile rheumatoid arthritis, macrophage activation syndrome, and hemophagocytic lymphohistiocytosis? Arthritis Rheum. 2004;50(3):689–698. doi: 10.1002/art.20198. [DOI] [PubMed] [Google Scholar]
- 14.Williams TJ. Eotaxin-1 (CCL11) Front Immunol. 2015;6:84. doi: 10.3389/fimmu.2015.00084. [DOI] [PMC free article] [PubMed] [Google Scholar]
- 15.Tang Y, Xu X, Song H, et al. Early diagnostic and prognostic significance of a specific Th1/Th2 cytokine pattern in children with haemophagocytic syndrome. Br J Haematol. 2008;143(1):84–91. doi: 10.1111/j.1365-2141.2008.07298.x. [DOI] [PubMed] [Google Scholar]
- 16.Xu X-J, Luo Z-B, Song H, et al. Simple evaluation of clinical situation and subtypes of pediatric hemophagocytic lymphohistiocytosis by cytokine patterns. Front Immunol. 2022;13:850443. doi: 10.3389/fimmu.2022.850443. [DOI] [PMC free article] [PubMed] [Google Scholar]
- 17.Moore KW, Vieira P, Fiorentino DF, et al. Homology of cytokine synthesis inhibitory factor (IL-10) to the Epstein-Barr virus gene BCRFI. Science. 1990;248(4960):1230–1234. doi: 10.1126/science.216155. [DOI] [PubMed] [Google Scholar]
- 18.Incrocci R, McCormack M, Swanson-Mungerson M. Epstein-Barr virus LMP2A increases IL-10 production in mitogen-stimulated primary B-cells and B-cell lymphomas. J Gen Virol. 2013;94(Pt 5):1127–1133. doi: 10.1099/vir.0.049221-0. [DOI] [PMC free article] [PubMed] [Google Scholar]
- 19.Samanta M, Iwakiri D, Takada K. Epstein-Barr virus-encoded small RNA induces IL-10 through RIG-I-mediated IRF-3 signaling. Oncogene. 2008;27(30):4150–4160. doi: 10.1038/onc.2008.75. [DOI] [PubMed] [Google Scholar]
- 20.Lambert SL, Martinez OM. Latent membrane protein 1 of EBV activates phosphatidylinositol 3-kinase to induce production of IL-10. J Immunol. 2007;179(12):8225–8234. doi: 10.4049/jimmunol.179.12.8225. [DOI] [PubMed] [Google Scholar]
- 21.Sabat R, Grütz G, Warszawska K, et al. Biology of interleukin-10. Cytokine Growth Factor Rev. 2010;21(5):331–344. doi: 10.1016/j.cytogfr.2010.09.002. [DOI] [PubMed] [Google Scholar]
- 22.Luo Z-B, Chen Y-Y, Xu X-J, et al. Prognostic factors of early death in children with hemophagocytic lymphohistiocytosis. Cytokine. 2017;97:80–85. doi: 10.1016/j.cyto.2017.03.013. [DOI] [PubMed] [Google Scholar]
- 23.Kasahara Y, Yachie A, Takei K, et al. Differential cellular targets of Epstein-Barr virus (EBV) infection between acute EBV-associated hemophagocytic lymphohistiocytosis and chronic active EBV infection. Blood. 2001;98(6):1882–1888. doi: 10.1182/blood.v98.6.1882. [DOI] [PubMed] [Google Scholar]
- 24.Hatta K, Morimoto A, Ishii E, et al. Association of transforming growth factor-beta1 gene polymorphism in the development of Epstein-Barr virus-related hematologic diseases. Haematologica. 2007;92(11):1470–1474. doi: 10.3324/haematol.11147. [DOI] [PubMed] [Google Scholar]
- 25.Shimizu M, Nakagishi Y, Inoue N, et al. Interleukin-18 for predicting the development of macrophage activation syndrome in systemic juvenile idiopathic arthritis. Clin Immunol. 2015;160(2):277–281. doi: 10.1016/j.clim.2015.06.005. [DOI] [PubMed] [Google Scholar]
- 26.Ruscitti P, Ursini F, Berardicurti O et al (2022) Cytokine profile, ferritin, and multi-visceral involvement characterise macrophage activation syndrome during adult-onset Still's disease. Rheumatology (Oxford). 10.1093/rheumatology/keac247 [DOI] [PubMed]
- 27.Cifaldi L, Prencipe G, Caiello I, et al. Inhibition of natural killer cell cytotoxicity by interleukin-6: implications for the pathogenesis of macrophage activation syndrome. Arthritis Rheumatol. 2015;67(11):3037–3046. doi: 10.1002/art.39295. [DOI] [PubMed] [Google Scholar]
- 28.Rosée PL, Horne A, Hines M, et al. Recommendations for the management of hemophagocytic lymphohistiocytosis in adults. Blood. 2019;133(23):2465–2477. doi: 10.1182/blood.2018894618. [DOI] [PubMed] [Google Scholar]
- 29.Han X-C, Ye Q, Zhang W-Y, et al. Cytokine profiles as novel diagnostic markers of Epstein-Barr virus-associated hemophagocytic lymphohistiocytosis in children. J Crit Care. 2017;39:72–77. doi: 10.1016/j.jcrc.2017.02.018. [DOI] [PubMed] [Google Scholar]
- 30.Lin S, Qiu M, Chen J. IL-4 modulates macrophage polarization in ankylosing spondylitis. cell physiol biochem. 2015;35(6):2213–2222. doi: 10.1159/000374026. [DOI] [PubMed] [Google Scholar]
- 31.Hamilton JA. Colony-stimulating factors in inflammation and autoimmunity. Nat Rev Immunol. 2008;8(7):533–544. doi: 10.1038/nri2356. [DOI] [PubMed] [Google Scholar]
- 32.Singh S, Anshita D, Ravichandiran V. MCP-1: function, regulation, and involvement in disease. Int Immunopharmacol. 2021;101(Part B):107598. doi: 10.1016/j.intimp.2021.107598. [DOI] [PMC free article] [PubMed] [Google Scholar]
- 33.Achuthan AA, Lee KMC, Hamilton JA. Targeting GM-CSF in inflammatory and autoimmune disorders. Semin Immunol. 2021;54:101523. doi: 10.1016/j.smim.2021.101523. [DOI] [PubMed] [Google Scholar]
- 34.Sankar SG, Anand AAP. Cytokine IP-10 and GM-CSF are prognostic biomarkers for severity in secondary dengue infection. Hum Immunol. 2021;82(6):438–445. doi: 10.1016/j.humimm.2021.03.003. [DOI] [PubMed] [Google Scholar]
- 35.Chen Y, Wang J, Liu C, et al. IP-10 and MCP-1 as biomarkers associated with disease severity of COVID-19. Mol Med. 2020;26(1):97. doi: 10.1186/s10020-020-00230-x. [DOI] [PMC free article] [PubMed] [Google Scholar]
- 36.Zhao X-X, Lian H-Y, Zhang L, et al. Significance of serum Th1/Th2 cytokine levels in underlying disease classification of childhood HLH. Cytokine. 2022;149:155729. doi: 10.1016/j.cyto.2021.155729. [DOI] [PubMed] [Google Scholar]
- 37.Platchek M, Lu Q, Tran H, et al. Comparative analysis of multiple immunoassays for cytokine profiling in drug discovery. SLAS Discov. 2020;25(10):1197–1213. doi: 10.1177/2472555220954389. [DOI] [PubMed] [Google Scholar]
- 38.Valaperti A, Li Z, Vonow-Eisenring M, et al. Diagnostic methods for the measurement of human TNF-alpha in clinical laboratory. J Pharm Biomed Anal. 2020;179:113010. doi: 10.1016/j.jpba.2019.113010. [DOI] [PubMed] [Google Scholar]
- 39.Richens JL, Urbanowicz RA, Metcalf R, et al. Quantitative validation and comparison of multiplex cytokine kits. J Biomol Screen. 2010;15(5):562–568. doi: 10.1177/1087057110362099. [DOI] [PubMed] [Google Scholar]
- 40.Dupuy AM, Kuster N, Lizard G, et al. Performance evaluation of human cytokines profiles obtained by various multiplexed-based technologies underlines a need for standardization. Clin Chem Lab Med. 2013;51(7):1385–1393. doi: 10.1515/cclm-2012-0648. [DOI] [PubMed] [Google Scholar]
- 41.Khan SS, Smith MS, Reda D, et al. Multiplex bead array assays for detection of soluble cytokines: comparisons of sensitivity and quantitative values among kits from multiple manufacturers. Cytometry B Clin Cytom. 2004;61(1):35–39. doi: 10.1002/cyto.b.20021. [DOI] [PubMed] [Google Scholar]
Associated Data
This section collects any data citations, data availability statements, or supplementary materials included in this article.
Supplementary Materials
Supplemental Figure 1 Cytokine pattern in HLH subtypes (TIFF 4971 kb)
Supplemental Table 1 ROC analysis (DOCX 17 kb)
Supplemental Table 2 Multivariate analysis of HLH prognosis (DOCX 14 kb)
Data Availability Statement
The data that support the findings of this study are available on request from the corresponding author.