



Abstract
The safety and efficacy of lentivirus-mediated gene therapy was recently demonstrated in five male patients with Fabry disease—a rare X-linked lysosomal storage disorder caused by GLA gene mutations that result in multiple end-organ complications. To evaluate the risks of clonal dominance and leukemogenesis, which have been reported in multiple gene therapy trials, we conducted a comprehensive DNA insertion site analysis of peripheral blood samples from the five patients in our gene therapy trial. We found that patients had a polyclonal integration site spectrum and did not find evidence of a dominant clone in any patient. Although we identified vector integrations near proto-oncogenes, these had low percentages of contributions to the overall pool of integrations and did not persist over time. Overall, we show that our trial of lentivirus-mediated gene therapy for Fabry disease did not lead to hematopoietic clonal dominance and likely did not elevate the risk of leukemogenic transformation.
Keywords: Fabry disease, clinical trial, gene therapy, lentiviral integration, lentiviral safety
Graphical abstract
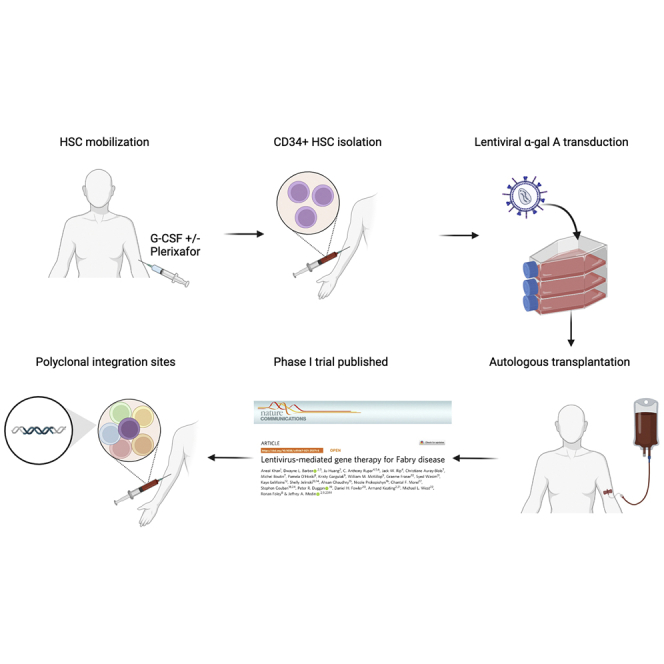
This study by Dr. Armand Keating and colleagues utilized integration site analysis to determine whether lentivirus-transduced hematopoietic cells, used in a Fabry disease gene therapy clinical trial, remain polyclonal. The study shows no evidence of a dominant pre-malignant clone, providing reassuring data on lentivirus-mediated gene therapy safety.
Introduction
Fabry disease is a rare X-linked lysosomal storage disorder with an estimated incidence ranging from 1 in 117,000 to 1 in 40,000 worldwide.1 This disease is defined by GLA mutations that result in deficient α-galactosidase A (α-gal A) activity and, consequently, the accumulation of glycosphingolipids, which cause various end-organ complications.2 The classic phenotype is characterized by childhood-onset and multi-organ involvement, whereas other phenotypes present with later-onset and primarily cardiac involvement.2 End-organ complications include chronic kidney disease, which may progress to renal failure; left ventricular hypertrophy associated with arrhythmias and myocardial fibrosis; auditory loss; transient ischemic attacks; and strokes.2 These complications ultimately lead to premature death and shorten the life expectancies of women and men by 15 and 20 years, respectively.1 Enzyme replacement therapy can decrease cardiac mass, stabilize kidney function, and improve symptoms of neuropathic pain, sweating, gastrointestinal symptoms, hearing loss, and pulmonary symptoms.1 However, enzyme replacement therapy requires intrusive biweekly treatment and is not curative.
We recently demonstrated that infusion with autologous CD34+ hematopoietic stem/progenitor cells engineered via lentiviral transduction to express α-gal A in five adult males with type 1 (classical) phenotype Fabry disease was safe, had no short-term gene therapy-related severe adverse events, and exhibited evidence of biochemical phenotype reversal.3 All patients in our trial produced α-gal A to near-normal levels, and levels of plasma and urine globotriaosylceramide (Gb3) and globotriaosylsphingosine (lyso-Gb3) were reduced over time after transplantation of the gene-modified cells.3
Despite its promising curative potential, gene therapy is associated with several adverse effects, including clonal dominance and leukemogenesis. In one study of retrovirus-mediated gamma(c) gene transfer into autologous CD34+ bone marrow cells to correct X-linked severe combined immunodeficiency (SCID-X1), two patients developed uncontrolled exponential clonal proliferation of mature T cells that carried retrovirus vector integration in proximity to the LMO2 proto-oncogene promoter.4 A follow-up study published 5 years later reported that four of the nine patients treated in the initial study developed T cell leukemia 31–68 months after the retrovirus-based gene therapy.5 Blast cells from these patients had vector integrations near one or more of three proto-oncogenes, LMO2, BMI1, and CCND2.5 Vector insertions near LMO2 were also associated with leukemogenesis in two other trials of gene therapy for SCID-X1.6,7 Genomic instability and clonal progression toward myelodysplasia were reported in a retroviral-mediated gene therapy trial for X-linked chronic granulomatous disease that resulted in insertional activation of ecotropic viral integration site 1 (EVI1).8 Clonal dominance was also observed in a study that used lentiviral β-globin gene transfer to treat human β-thalassaemia, with vector-induced transcriptional activation of HMGA2 and elevated expression of a truncated HMGA2 mRNA that was insensitive to degradation by let-7 microRNAs.9
The risk of oncogenesis highlighted in several gene therapy trials calls for greater caution and careful safety assessments. In this study, we conducted a comprehensive insertion site analysis of genomic DNA from peripheral blood cells of the five patients with Fabry disease who participated in our gene therapy trial. Samples were drawn before transplantation and at intervals ranging from 6 to 42 months after infusion of the transduced cells. Here, we report our vector copy-number analysis, clonality assessment, and vector insertion site profile, including the top 10 insertion sites for each sample, common integration sites across different samples, and the presence of high-risk integration loci.
Results
Vector copy number
In order to extend the safety analysis of our interim study of five adult males infused with autologous CD34+ cells transduced with GLA,3 we analyzed lentiviral integration via whole-exome sequencing (WES). As these patients were recruited and treated over a 25-month period, we selected a 6-month time point for all patients and the latest time point for each patient spanning from 18 (patients 4 and 5) to 42 months (patient 1) post-infusion. A complete list of patient material and control samples is shown in Table 1. To determine the mean vector copy number (VCN) per cell, we analyzed 100 ng genomic DNA from each of the five untransduced pre-transplantation (PTX) samples, 10 peripheral blood patient samples, and five controls (C14, NIBSC codes: 18/142, 18/126, 18/132 and 18/144). C14 is a human induced pluripotent stem cell (iPSC) clone with a pre-determined vector copy of one.10 We used it as a monoclonal control in VCN determination and integration site analysis. Furthermore, we analyzed lentiviral reference samples from the National Institute for Biological Standards and Control (NIBSC). The VCN standard NIBSC 19/158 consists of three reference samples with the following consensus VCNs: 0 (NIBSC 18/142), 1.05 (NIBSC 18/126), and 5.60 (NIBSC 18/132). Additionally, we included the first World Health Organization (WHO) reference reagent for lentiviral integration site analysis (ISA; NIBSC 18/144). Our analysis of the control samples is shown in Table 1. The C14 clone showed the expected VCN of 0.9810. For the NIBSC standards, we were able to efficiently reproduce the reference values for 18/142 (mean VCN: 0), 18/126 (mean VCN: 1.11), and 18/132 (mean VCN: 5.67). For the WHO integration site standard 18/144, we determined 8.91 copies per diploid genome.
Table 1.
Integration site data
| Time point (months) | VCN | ISA on native material | ISA on WGA material | Successful PCR2 amplicons | Reads aligning to hg38 | Sonic lengths | Total integrations | UIS | |
|---|---|---|---|---|---|---|---|---|---|
| Controls | |||||||||
| C14 | – | 0.98 | 4 | 0 | 2 | 442,878 | 4,361 | 15 | 3 |
| NIBSC_18_142 | – | 0 | 2 | 1 | 0 | 0 | 0 | 0 | 0 |
| NIBSC_18_126 | – | 1.11 | 2 | 2 | 2 | 490,080 | 5,232 | 30 | 9 |
| NIBSC_18_132 | – | 5.67 | 2 | 2 | 3 | 789,763 | 18,587 | 128 | 26 |
| NIBSC_18_144 | – | 8.91 | 3 | 4 | 7 | 1,623,829 | 33,633 | 460 | 65 |
| Patient | |||||||||
| 1 | PTX | 0.01 | 2 | 1 | 0 | 0 | 0 | 0 | 0 |
| 1 | 6 | 0.37 | 1 | 2 | 2 | 851,690 | 6,960 | 3,936 | 1,097 |
| 1 | 42 | 0.06 | 2 | 1 | 1 | 435,470 | 968 | 677 | 349 |
| 2 | PTX | 0.00 | 1 | 4 | 0 | 0 | 0 | 0 | 0 |
| 2 | 6 | 0.38 | 1 | 4 | 3 | 1,761,338 | 5,871 | 4,291 | 2,018 |
| 2 | 24 | 0.28 | 1 | 4 | 1 | 392,098 | 1,629 | 1,280 | 698 |
| 3 | PTX | 0 | 1 | 1 | 0 | 0 | 0 | 0 | 0 |
| 3 | 6 | 0.51 | 2 | 2 | 4 | 1,563,935 | 16,586 | 14,127 | 6,005 |
| 3 | 24 | 0.20 | 1 | 2 | 2 | 1,183,394 | 7,228 | 4,734 | 769 |
| 4 | PTX | 0.00 | 1 | 0 | 0 | 0 | 0 | 0 | 0 |
| 4 | 6 | 0.40 | 1 | 0 | 1 | 84,744 | 2,144 | 1,884 | 1041 |
| 4 | 18 | 0.21 | 1 | 0 | 1 | 118,614 | 1,339 | 1,141 | 618 |
| 5 | PTX | 0 | 1 | 0 | 0 | 0 | 0 | 0 | 0 |
| 5 | 6 | 0.84 | 1 | 0 | 1 | 113,470 | 99 | 77 | 31 |
| 5 | 18 | 0.52 | 1 | 0 | 1 | 97,452 | 5,565 | 4,915 | 2,800 |
This table shows controls and patients, time point of analysis, vector copy number (VCN) per diploid genome, number of integration site analyses (ISAs) on native and whole-genome-amplified (WGA) material, the total number of reads aligning to the human genome, the sum of sonic lengths products, the total integrations, and unique integration sites (UISs) for controls and patients.
Table 1 also shows the VCNs for patient samples at PTX and at various time points, ranging from 6 to 42 months after transplant. VCNs ranged from 0.37–0.84 at 6 months. Final time points varied from 18 months for patients 4 (VCN = 0.21) and 5 (VCN = 0.52), respectively, to 42 months for patient 1 (VCN = 0.06). These values compared favorably with our previously reported study,3 independently confirming the fidelity of the VCN assay performed in two distinct laboratories (Figure S1).
For ISA, we amplified vector-genome junctions using the integration site pipeline for paired-end reads (INSPIIRED) workflow, as described by Sherman and colleagues.11,12 A complete list of analyzed samples is shown in Table S1. For a subset of samples, we performed whole-genome amplification of the limited available genomic DNA (gDNA). All obtained Illumina sequences were demultiplexed, quality filtered, vector trimmed, and aligned to the human genome. As expected, there were no alignments for untransduced PTX samples and NIBSC_18_142 because they lacked vector insertions. To investigate whether WGA processing alters the clonal complexity of samples, we compared native and whole-genome-amplified material of NIBSC 18/144; this WHO lentiviral vector (LV) integration site standard was developed in an international collaborative study with 31 laboratories from 13 different countries.13 According to the instructions for use, 10 consensus integration sites (SEMA3F-AS1, SMYD4, ADAM9, CBWD1, FOXP2, RPS10-NUDT3, GRID2, ENTHD1, AGPAT3, R3HDM2) must be detected by the ISA method of choice. For 10 out of 11 reactions (n = 2 for native, n = 9 for WGA), we confirmed the presence of the consensus integration sites. We further compared the sonic abundance of all integration sites and found that the 10 consensus integrations, together with one integration near ZNF598 (not part of the consensus integrations but described to be commonly found in the WHO report), contributed with 95% ± 4.2% to the clonal repertoire (Figure S2). This was true for both native and WGA material. As expected, we were able to detect more integrations with a low contribution for the WGA material (67 ± 51 integrations) compared with the native DNA sample (26 and 21 integrations across the two reactions). Next, we performed independent INSPIIRED reactions on native or WGA material from patients 2 and 3 at 6 months post-treatment and found that the WGA treatment did not change the polyclonal nature of the sample (Figure S3). We sequenced the INSPIIRED amplicons of all patients and controls in four different next-generation sequencing (NGS) libraries and found that a total of 5.27 × 10⁷ reads yielded 1.03 × 10⁷ alignments to the host genome and 3.78 × 10⁴ unique integration sites (Table S1).
Sequencing statistics and clonality assessment
We identified the number of unique insertion sites for each sample and used three metrics (Gini index, Shannon index, and UC50) to assess clonality as shown in Table 2. The Gini index runs from 0 to 1, and a low index suggests a polyclonal situation, whereas a high index reflects the unequal contribution of more dominant sequences to the overall sequence pool.14 In contrast, a higher Shannon index indicates a more polyclonal integration site repertoire.15 The UC50 value describes the number of integrations in a sample that contributes to 50% of all sequences.
Table 2.
Sequencing statistics highlight the polyclonal nature of transduced cells
| Time point (months) | Unique sites | Gini | Shannon | UC50 | |
|---|---|---|---|---|---|
| Controls | |||||
| C14 | – | 3 | 0.67 | 0.01 | 1 |
| NIBSC_18_142 | – | NA | NA | NA | NA |
| NIBSC_18_126 | – | 9 | 0.71 | 1.17 | 2 |
| NIBSC_18_132 | – | 26 | 0.85 | 1.65 | 2 |
| NIBSC_18_144 | – | 65 | 0.93 | 1.76 | 2 |
| Patient | |||||
| 1 | PTX | NA | NA | NA | NA |
| 1 | 6 | 1,097 | 0.33 | 6.31 | 172 |
| 1 | 42 | 349 | 0.31 | 5.67 | 105 |
| 2 | PTX | NA | NA | NA | NA |
| 2 | 6 | 2,018 | 0.34 | 7.38 | 491 |
| 2 | 24 | 698 | 0.25 | 6.42 | 239 |
| 3 | PTX | NA | NA | NA | NA |
| 3 | 6 | 6,005 | 0.19 | 8.61 | 2,332 |
| 3 | 24 | 769 | 0.26 | 6.5 | 249 |
| 4 | PTX | NA | NA | NA | NA |
| 4 | 6 | 1,041 | 0.17 | 6.88 | 421 |
| 4 | 18 | 618 | 0.19 | 6.33 | 240 |
| 5 | PTX | NA | NA | NA | NA |
| 5 | 6 | 31 | 0.33 | 3.22 | 9 |
| 5 | 18 | 2,800 | 0.15 | 7.88 | 1,150 |
The number of unique sites is shown for controls and patients. These are analyzed via three distinct methods: Gini index, Shannon index, and UC50. The Gini index runs from 0 to 1, and a low index suggests a polyclonal situation. A higher Shannon index indicates a more polyclonal integration site repertoire The UC50 values shows the number of integration sites contributing to 50% of the clonal repertoire.
Analysis of the monoclonal C14 control using the metrics described above appropriately identified one prominent insertion (UC50 of 1, with the LINC02010 integration contributing 99.93% of all measured sequences) and demonstrated clonal dominance with a low Shannon index of 0.01 and a high Gini index of 0.67. These results were in line with our previously published results for this clone.10 The negative control NIBSC sample (NIBSC_18_142) and the patient-specific negative controls (PTX samples) did not lead to amplicons or alignments to the human genome and therefore were not analyzed using the metrics described. Except for the 6-month time point for patient 5, all patient samples were polyclonal with ≥349 unique integration sites (UISs) each. The overall Gini index was low at 0.24 ± 0.07, the overall Shannon index was high at 6.82 ± 0.83, and the overall UC50 value was 538 ± 659, collectively demonstrating that the samples were polyclonal. The samples from patient 5 showed only 31 UISs after 6 months. However, the number of UISs in this patient’s peripheral blood increased to 2,800 by 18 months. The reason for the very low integration sites at 6 months could be a technical issue given that the 6-month sample produced only 99 sonic-length products (SLPs), whereas for all other INSPIIRED reactions 6 months post-treatment, we obtained 1,499 ± 576 SLPs (15-fold higher). Due to the polyclonal nature of the samples, the number of UISs in material from patients 1 to 4 was similarly high with 1,181 ± 522 integrations at 6 months post-treatment. Taking the ratio of SLPs to UISs (factor of 0.79) into account, in an ideal situation with similarly high SLPs for patient 5 compared with other samples (adding a 15-fold correction factor), we would assume 367 integration sites after 6 months (31 × 15 × 0.79 = 367).
Infused CD34 cell number and unique integrations found
We observed a positive trend between the number of CD34+ cells/kg infused and the number of UISs in samples collected 6 months after infusion (Figure 1). This correlation suggests that our lentivirus vector effectively integrated into a diverse population of CD34+ cells and that these cells or their progeny persisted across 6 months without being outcompeted by a dominant clone. Patient 5 data were excluded from this analysis due to the low sonic abundance values, and UIS values were normalized for the number of resampling times (as further detailed in Table S2) given that in a polyclonal situation, as observed for patients 1–4, the number of detected UISs can be influenced by the repeated analyses of the same sample (resampling).
Figure 1.

Unique integration sites at 6 months correlate with the number of infused CD34+ cells/kg
We observe a trend regarding the number of unique integration sites (UISs) and the number of CD34+ cells infused in each patient, plotted as a function of CD34+ cells/kilogram. Linear regression was performed, and the equation, non-parametric correlation (Spearman) co-efficient, and p value are illustrated.
Pool size estimation
We analyzed the 6-month samples from patients 2 and 3 in independent reactions to determine the pool size of integrations (Table S3). For patient 2, we performed three individual INSPIIRED reactions on WGA material. We detected 547, 740, and 1,084 integrations. A pool size calculation using the Chapman estimator implied a repertoire of 4,384 ± 368 integrations in the WGA material. Each resampling of the same DNA detected around 17.9% ± 1.8% of the clonal landscape. For patient 3, we compared one native INSPIIRED reaction with two independent WGA reactions 6 months after treatment. As described in the materials and methods, after PCR1, 2 μL of each amplification product was used in two technical replicate PCR2 reactions (true for all reactions described in this article). The technical replicates of the nested PCRs suggested a detection of 83.5% ± 3.2% of all integrations within the same PCR2-amplified material. A similar number was obtained when the same PCR2 replicates of patient 1 (6 months after treatment) were analyzed in two different NGS libraries (87.1% coverage). The pool size estimation with the WGA material of patient 3 argued for a 10-fold higher clonal complexity (40,651 integrations) compared with patient 2. When including the native material in the calculation, we could only cover between 0.1% and 0.3% of the total clonal landscape per INSPIIRED reaction.
Overall, these data further support the polyclonal nature of the samples.
Top 10 insertion sites
To further explore the significance of lentiviral integrations in our study, we characterized and compared insertion sites across patient samples. Figure 2 identifies the top 10 integrations with highest sequence contributions in control (Figure 2A) and patient samples (Figure 2B). As expected, we found a dominant integration near LINC02010 for the control sample, C14, as well as the previously described integration sites for NIBSC_18_144 and NIBSC_18_132.11,13 Analysis of the integration sites across our patient samples demonstrated that all samples except the 6-month sample from patient 5 were polyclonal. Excluding this sample, the maximum contribution of a single integration site in all other samples was 2.38%, and the mean contribution of the top 10 most abundant integrations over all patients was only 0.50% ± 0.38%. Importantly, none of the top 10 integrations was found twice in the same patient at both the 6-month and final time points. While it is possible that a repopulating clone may have persisted at low levels across the 6-month and final time points without being detected due to insufficient sampling, our findings collectively support a polyclonal situation in almost all samples.
Figure 2.

Top 10 integration sites
The top 10 integration sites of control samples (A) and patients 1–5 at the different time points (B) are shown here. Each colored bar represents a separate insertion site, and the gray bars represent all other insertion sites. Below each bar, the gene symbols closest to the integration sites are listed. ∗, integration was within a transcription unit. ∼, insertion was within 50 kb of a cancer-related gene. UIS, unique integration sites.
Insertion site profile
To further characterize the insertion sites, we used the INSPIIRED genomic heatmap tool to analyze genomic features closest to the integration sites. We assessed the tendency to integrate in the vicinity of CpG islands; GC-rich regions; proximity to genes (refSeq_counts); within transcriptional units (within_refSeq_gene); within shorter or longer genes (gene.width); in the vicinity of transcriptional start sites (start.dist); close to gene boundaries (boundary.dist); or near protooncogenes (onco.100k). The results were compared with matched random controls automatically generated by the bioinformatics pipeline, Figure 3 displays the general tendency of LVs to integrate inside transcriptional units. A comprehensive genomic and epigenomic heatmap analysis of insertion sites across all patient samples is shown in Figure S4.
Figure 3.

Tendency for vector integration in genes and close to proto-oncogenes compared with matched random control sites
We found a higher tendency for vector integrations inside transcriptional units (A) and within 100 kb of proto-oncogenes (B) compared with matched random control (mrc) sites). ∗pMann-Whitney < 0.05, ∗∗∗pMann-Whitney < 0.001.
Our analysis demonstrated that integrations commonly occurred in actively transcribed regions (within 100 kb relative to CpG islands) but not within 1–10 kb of CpG islands, hence not near the promoter regions. Our clinical-grade LVs did not commonly integrate within GC-rich regions, which mark promoter regions, nor within long intergenic regions. As expected for LVs, there was a general tendency for the vector to integrate within transcriptional units compared with matched random control sites (84.4% vs. 44.3%), and there was a slight and statistically significant increased tendency to integrate close to proto-oncogenes (11.7% vs. 9.1%).
Overlap analysis
We compared the exact chromosomal location of insertions (position IDs) between the 6-month and final sampling time points for each patient and analyzed the contributions of overlapping position IDs to the overall sequence pool. As shown in Tables 3 and 4, we further compared the genes closest to insertion sites in each patient to identify whether there was significant overlap across patients.
Table 3.
Some integrations persisted in an identical locus across sampling time points for the same patient
| Patient | Overlaps (months) | Posid | Highest contribution (%) |
|---|---|---|---|
| 1 | 6–42 | 0 | – |
| 2 | 6–24 | 2 | 0.18 |
| 3 | 6–24 | 2 | 0.17 |
| 4 | 6–18 | 1 | 0.08 |
| 5 | 6–18 | 0 | – |
The number of overlaps is depicted for each patient from 6 months to the latest time point. The highest contribution of an overlapping position ID (specific locus) to the overall sequence pool of the latest time point is shown.
Table 4.
Substantial overlap in integrations near the same genes was observed from different patients
| Patient | IS in # of genes | Overlaps | Overlapping genes | Overlap (%) |
|---|---|---|---|---|
| 1 | 1,080 | to other patients | 795 | 73.6 |
| 2 | 1,835 | to other patients | 1,285 | 70 |
| 3 | 3,554 | to other patients | 1,892 | 53.2 |
| 4 | 1,275 | to other patients | 909 | 71.3 |
| 5 | 1,950 | to other patients | 1,316 | 67.5 |
We identified roughly 50%–70% similarities in the genes that harbored or were close to integration sites across all patients. Importantly, this table refers to insertions in or near the same gene but not in identical insertion positions.
For patients 1 and 5, there were no overlaps between integrations with the same chromosomal position ID. Patients 2, 3, and 4 each had only one or two overlaps, with the highest percentage of contributions for overlapping integrations being 0.18%.
When the genes closest to integration sites were compared across patients, we found a high degree of overlap at 67.1% ± 8% which may suggest a similar cell-type-specific integration profile for all patients. However, when we compared each patient’s top 10 contributing integrations, we found no overlap of genes. These findings collectively suggest that there was no clonal selection from vector-mediated gene dysregulation.
We analyzed the genes closest to the integrations for common insertion sites (CIS), defined, based on Grubbs outlier analysis, as at least 12 individual integrations per gene. We found high similarity between CISs from patients 1–5 and previously published CISs from three clinical trials that used LVs to treat metachromatic leukodystrophy (MLD), adrenoleukodystrophy (ALD), or Wiskott-Aldrich syndrome (WAS).16,17,18 In the MLD study by Biffi and colleagues, CIS data of three patients overlapped nearly entirely with CISs from the ALD study, with the exception of one gene cluster.16,18 In total, 32 of the 39 CISs reported for the MLD trial and 27 of 32 CISs of the WAS trial overlapped with CISs of patients 1–5 in our study. Table S4 further illustrates that CISs with the most integrations per gene (KDM2A, PACS1, NF1, FCHSD2, EIF4G3, TSBP1) in our study were also among the top CISs in the lentiviral MLD and WAS trials. The genomic positions IDs for each patient and time point were also analyzed for overrepresentation of gene functions. We considered Gene Ontology (GO) classes to be significant if the binomial and the hypergeometric test had a false discovery rate below 0.05 and a region fold enrichment greater than two. We highlighted the substantial overlap with GO data from the MLD gene therapy trial in Table S5. In summary, the CISs that we identified in our study showed substantial overlap with those reported in other lentivirus-mediated gene therapy clinical trials.
Presence of high-risk integration loci
To further evaluate the risk of clonal dominance, we looked for integrations within 100 kb of six high-risk loci, LMO2, IKZF1, CCND2, HMGA2, MECOM, and PRDM16. We found no high-risk insertions inside or within 100 kb of CCND2 or MECOM. However, there were integrations near the remaining four loci, and these are reported in Table 5. None of these contributed more than 0.15% to the pool of integration sites, and none of the precise integration positions persisted over time. At this stage, however, it is not possible to predict the longer-term implications of these insertions.
Table 5.
High-risk integrations within 100 kb of known proto-oncogenes
| Gene_Symbol | Patient | Time point (months) | Position ID | Contribution (%) |
|---|---|---|---|---|
| HMGA2 | 3 | 6 | chr12 + 65858644 | 0.03 |
| HMGA2 | 3 | 6 | chr12 + 65856808 | 0.02 |
| HMGA2 | 5 | 18 | chr12 + 65957840 | 0.06 |
| HMGA2 | 5 | 18 | chr12 + 65858880 | 0.04 |
| HMGA2 | 5 | 18 | chr12 + 65868202 | 0.04 |
| IKZF1 | 5 | 18 | chr7+50257797 | 0.04 |
| LMO2 | 4 | 6 | chr11 + 33886115 | 0.15 |
| PRDM16 | 3 | 6 | chr1 + 3397075 | 0.01 |
High-risk loci were selected based on reports of their potential contributions to leukemogenesis. Percent contributions to overall pool are also highlighted. Integrations were identified in some samples but with low frequency.
Discussion
We recently demonstrated that five adult males with Fabry disease were safely infused with autologous lentivirus-transduced hematopoietic stem/progenitor cells engineered to express α-gal A.3 The results of our trial showed preliminary evidence of efficacy and supported the curative potential of gene therapy. Gene therapy has been associated with severe adverse effects, including clonal dominance and oncogenic transformation.4,5,6,7,8,9 However, it remains unclear whether gene therapy has a direct causal role in oncogenic transformation. A clinical trial using lentivirus-mediated gene therapy for sickle cell disease (ClinicalTrials.gov: NCT02140554) recently reported that one patient developed MDS 3 years after treatment and another developed AML 5.5 years after treatment.19,20 Further analysis excluded insertional oncogenesis as the cause of MDS and AML in these two patients. In the patient who developed AML, vector integrations in blasts were primarily associated with VAMP4, a gene previously documented to play a role in Golgi structure and function but no prior role in proliferation or oncogenesis.19 As for the patient who developed MDS, CD34+ blasts did not carry lentivirus vector integrations.20 The underlying mechanism is likely due to the underlying sickle cell disease and the transplantation procedure and its associated risks, including exposure to the conditioning agent. Nonetheless, given the potential risk of clonal hematopoiesis secondary to gene therapy, our study analyzed vector insertion sites in peripheral blood samples collected at different time points from five patients with Fabry disease who participated in our gene therapy trial.3
We first confirmed the presence of LVs in all patient samples at all time points tested and found that the VCNs ranged from 0.06 to 0.84 per cell across different patients and time points. We also verified that amplified vector-genome junctions aligned to the human genome. Next, we identified the number of unique insertion sites for each sample and used three metrics to assess clonality. Almost all patient samples were polyclonal across different time points, except for one patient whose 6-month sample had only 31 unique vector insertion sites but who then went on to have 2,800 unique insertion sites at 18 months. The remaining 9 post-transplantation samples were polyclonal, with a low overall Gini index of 0.24 ± 0.07, a high overall Shannon index of 6.82 ± 0.83, and a high overall UC50 value of 538 ± 659. We also found that, with the exception of the 6-month sample from patient 5, the maximum contribution of a single integration site in all other samples was 2.38%, and the mean contribution of the top 10 most abundant integrations over all patients was only 0.50% ± 0.38%. None of the top 10 integrations was found twice in the same patient at both the 6-month and final sampling time points. These findings collectively demonstrate that almost all samples were polyclonal.
Having demonstrated that vector transduction did not cause clonal dominance, we then investigated the risk of insertional mutagenesis by looking for integrations within 100 kb of six high-risk loci, LMO2, IKZF1, CCND2, HMGA2, MECOM, and PRDM16. We found unique integrations near LMO2, IKZF1, HMGA2, and PRDM16 but not CCND2 or MECOM. However, none of these integrations contributed more than 0.15% to the pool of integration sites, were only reported as solitary events, and did not persist across different time points.
Overall, we demonstrated that our trial of lentivirus-mediated gene therapy for Fabry disease did not lead to clonal dominance and likely did not elevate the risk of leukemogenesis. Further, we observed a typical lentiviral insertion site repertoire, and substantial overlaps regarding CISs and GO findings compare with other lentiviral gene therapy trials. Our findings are in line with a recent review and meta-analysis of 55 gene therapy clinical trials encompassing 406 patients that demonstrated that LVs are safe with no genotoxic events and have high rates of engraftment (98.7%).21
An important feature of our clinical trial was the conditioning regimen. As we were treating patients harboring a chronic disease, we selected melphalan (100 mg/m2) administered at 50% maximal tolerated dosage.3 Our group has considerable experience with this approach, performing autologous transplants for multiple myeloma and amyloidosis. This strategy was preferred by our patient population and our regulator, Health Canada. It is evident from these data that full hematopoietic engraftment was observed, was polyclonal in nature, and persisted up to almost 4 years in one patient. Furthermore, this therapy could be delivered in the outpatient setting, resulting in fewer adverse events, shorter hospitalizations, and decreased costs.
The results of our phase I trial cast hope for a gene therapy-based cure of patients with Fabry disease. Although it is too early to tell how long the benefits of gene therapy will last, we are excited by the observation that all patients in our clinical trial secrete α-gal A from transduced cells and the three subjects who elected to pause enzyme replacement therapy continue to rely on cell-secreted α-gal A and have not resumed enzyme replacement therapy. Nonetheless, our interim findings are still early and rely on a small sample of patients. It remains unclear, for example, how long the transduced cells will sustain α-gal A production and whether a certain threshold of VCNs is required to attain lifelong α-gal A production. As the field of gene therapy continues to mature, we anticipate that we will learn more about the treatment parameters necessary for effective therapy and possibly cure.
While this study provided reassuring evidence that gene therapy did not increase the risk of malignant transformation in our patient population, it nevertheless remains possible that the integrations identified near proto-oncogenes could, over the course of many years, contribute to a multi-step leukemogenic transformation. We will be in a better position to judge the safety of our gene therapy trial after several more years of follow up. To further evaluate the risks of leukemic transformation, future studies could screen for mutations associated with age-related clonal hematopoiesis prior to gene therapy and at intervals post-transplantation.22 We continue to closely follow the patients who participated in this trial, and, given our reassuring data, we remain cautiously optimistic that our gene therapy trial will demonstrate long-term safety.
Materials and methods
Standards for ISA and VCN determination
We used the WHO’s first Reference Reagent for LV ISA from the NIBSC (South Mimms, UK) with NIBSC code 18/144 according to the instructions for use. Additionally, we used the working standard.
Additionally, the working standard NIBSC RR for LV Integration Copy Number Quantitation (NIBSC code: 19/158) was used.23 We analyzed the log 10 consensus values and DNA concentrations in the instructions for use and calculated vector copies per diploid cells. These numbers were compared with measurements performed at Hannover Medical School (Table S6). Further information on the NIBSC material is available in a WHO report (WHO/BS/2019.2373).13
Determination of DNA concentration and whole-genome amplification
DNA concentrations were determined by analyzing 1 μL per sample on a Qubit device (Thermo Fisher Scientific) according to the manufacturer’s instructions. For some samples, the available sample volume was low. We used 50.5–1270 ng gDNA for whole-genome amplification (WGA) with the REPLI-g Mini kit (Qiagen) according to the manufacturer’s instructions. We used 2.5 μL template DNA as input, incubated for 16 h at 30°C and denatured at 65°C for 3 min. A list of all samples, the available volume, DNA concentration, and details on WGA are shown in Table S1.
VCN determination
The mean VCN per cell was determined by Droplet Digital PCR (ddPCR) with a Taqman approach on a QX200 system. Samples were measured in triplicates using 100 ng gDNA. The number of viral sequences was normalized to a genomic reference sequence. The WPRE element detected viral sequences, whereas primers targeting the PTBP2 gene were used for normalization of gDNA.24 The iPSC clone C14 with a pre-determined VCN of one copy per diploid genome served as a reference value.10 In the trial, the infused drug product VCN was 0.68–1.43 copies/genome.3
ISA
Samples were processed with the INSPIIRED workflow as previously described.10,12,25 A complete list of native or WGA DNA samples is given in Table S1.
DNA samples were resuspended in 120 μL nuclease-free water, sheared, and washed with AMPure beads (0.7-fold bead-to-sample ratio). After end preparation of fragmented DNA and dATailing, linkers (linker blunt + sample-specific linker) were introduced. Following further AMPure purification (0.7-fold bead-to-sample ratio), samples were amplified in PCR1 and PCR2 as described before.25 After PCR1, 2 μL of each amplification product was used in two technical replicate PCR2 reactions. A list of specific self-inactivating-long terminal repeat (SIN-LTR) primers and sample-specific linker primers are given in Tables S1 and S7. PCR2 products were visualized on 2% TAE agarose gels (figures available upon request) and/or measured by Qubit (Table S1). Afterward, PCR2 reactions were mixed in equal volumes to generate the final Illumina libraries 201006_INSPIIRED_RUN27, 201015_ INSPIIRED_RUN28, 201109_INSPIIRED_RUN29, 201116_INSPIIRED_RUN30, and 210324_INSPIIRED_RUN42.
The libraries were first column purified prior to two AMPure purifications with a 0.7- and 0.6-fold ratio of beads to sample volume. Libraries were transferred to the research core unit genomics (RCUG) of Hannover Medical School for quality control via Bioanalyzer and analysis by Illumina sequencing on flow cells with 1 or 15 million clusters each. Protocols regarding quality control (QC) and library preparation by RCUG can be provided upon request. Bioinformatic steps were generally performed as described by Berry and colleagues.11 Modifications are described in Ha et al.25 The individual files were aligned and annotated to the human genome (hg38). All 15,713 UISs are listed in Table S8. Pool size estimations of resampled material from patients 1, 2, and 3 used the Chapman estimator, described in Table S9.26
Data availability
Source data are provided with this paper. The datasets generated during and/or analyzed during the current study are available from Dr. Jeffrey A. Medin on reasonable request.
Acknowledgments
The authors thank the patients for their commitment to further research into Fabry disease. The authors thank Cindy Yau, Rupi Mangat, Sarah Young, and Pam Degendorfer from Ozmosis. Research, Inc., for their support of this study. We thank Violetta Dziadek and the Research Core Unit Genomics of Hannover Medical School for excellent technical support regarding insertion site analysis and NGS. The following institutions provided funding for this study: Canadian Institutes of Health Research (CIHR, grant number 119187), The Kidney Foundation of Canada, and the MACC Fund. Financial support for the study was also provided by AVROBIO, Inc. Research Ethics Board (REB) approval was provided by University Health Network Research. Ethics Board, Alberta Health Services Research Ethics Board, Capital Health Services Research Ethics Board, Hamilton Integrated Research Ethics, and the Medical College of Wisconsin Institutional Review Board. Informed consent was obtained by all participants as required by local REB requirements. All data reported in this study have been de-identified. The clinical trial supporting this study (ClinicalTrials.gov: NCT02800070– approved by Health Canada on April 26, 2016) was conducted in compliance with the Declaration of Helsinki and local institutional and/or university Human Experimentation Committee requirements.
Author contributions
Conceptualization, D.L.B., W.M.M., J.A.M., M.R., A.H.S., R.F., and A.Keating; data curation, D.L.B., W.M.M., and M.R.; formal analysis, M.R., A.H.S., D.L.B., J.A.M., and A.Keating; funding acquisition, A.Keating, C.A.-B., C.A.R., R.F., and J.A.M.; investigation, D.L.B., W.M.M., G.F., C.F.M., C.A.-B., C.A.R., R.F., J.A.M., and A.Keating; methodology, D.L.B., W.M.M., M.R., A.H.S., R.F., J.A.M., and A.Keating; project administration, D.L.B.; software, M.R. and A.H.S.; supervision, A.Keating, D.L.B., and J.A.M.; validation, M.R. and A.H.S.; visualization, D.L.B., M.R., and A.H.S.; writing – original draft, A.H.S., D.L.B., and A.Keating; writing – review & editing, A.H.S., M.R., D.L.B., R.F., J.A.M., and A.Keating All authors approved the final manuscript before publication. The sponsor (University Health Network) played no role in the study design, data collection and analyses, or drafting of the manuscript.
Declaration of interests
D.L.B. was partially paid from a sponsored research agreement from AVROBIO, Inc. C.A.-B. has received a service contract and honoraria for biomarker analysis with AVROBIO, Inc. and a grant from CIHR. C.F.M. has received grants, personal fees, and non-financial support from Takeda Pharmaceuticals (previously Shire HGT); grants, personal fees, and non-financial support from Sanofi-Genzyme; and non-financial support from Amicus Therapeutics. A. Khan received grants, consulting fees, revenue distribution agreement, speaker fees, and travel support with AVROBIO, Inc., as well as has a revenue distribution agreement with University Health Network regarding gene therapy using technology from this work. M.L.W. has received research grants, consulting fees, speaker fees, and travel support from Amicus Therapeutics, Protalix, Sanofi-Genzyme, and Takeda and has a revenue distribution agreement with University Health Network regarding gene therapy using technology from this work. C.A.R. has the following financial relationships to disclose: the Biochemical Genetics clinical diagnostic laboratory at his home institution is contracted by AVROBIO, Inc., to assay enzymes on a fee-for--service basis. He is the laboratory director but receives no personal compensation. J.A.M. is on the scientific advisory board of Rapa Therapeutics; has received honoraria from Sanofi Genzyme and Shire; is a co-founder and shareholder of AVROBIO, Inc.; and has received grants from Canadian Institutes of Health Research and Kidney Foundation of Canada and AVROBIO, Inc. A. Keating has received a consultancy fee from AVROBIO, Inc., unrelated to this study. A.S. and M.R. have a service contract and received consultancy fees from AVROBIO, Inc., unrelated to this study.
Footnotes
Supplemental information can be found online at https://doi.org/10.1016/j.omtm.2023.01.003.
Supplemental information
References
- 1.Zarate Y.A., Hopkin R.J. Fabry's disease. Lancet. 2008;372:1427–1435. doi: 10.1016/S0140-6736(08)61589-5. [DOI] [PubMed] [Google Scholar]
- 2.Ortiz A., Germain D.P., Desnick R.J., Politei J., Mauer M., Burlina A., Eng C., Hopkin R.J., Laney D., Linhart A., et al. Fabry disease revisited: management and treatment recommendations for adult patients. Mol. Genet. Metab. 2018;123:416–427. doi: 10.1016/j.ymgme.2018.02.014. [DOI] [PubMed] [Google Scholar]
- 3.Khan A., Barber D.L., Huang J., Rupar C.A., Rip J.W., Auray-Blais C., Boutin M., O'Hoski P., Gargulak K., McKillop W.M., et al. Lentivirus-mediated gene therapy for Fabry disease. Nat. Commun. 2021;12:1178. doi: 10.1038/s41467-021-21371-5. [DOI] [PMC free article] [PubMed] [Google Scholar]
- 4.Hacein-Bey-Abina S., Von Kalle C., Schmidt M., McCormack M.P., Wulffraat N., Leboulch P., Lim A., Osborne C.S., Pawliuk R., Morillon E., et al. LMO2-associated clonal T cell proliferation in two patients after gene therapy for SCID-X1. Science. 2003;302:415–419. doi: 10.1126/science.1088547. [DOI] [PubMed] [Google Scholar]
- 5.Hacein-Bey-Abina S., Garrigue A., Wang G.P., Soulier J., Lim A., Morillon E., Clappier E., Caccavelli L., Delabesse E., Beldjord K., et al. Insertional oncogenesis in 4 patients after retrovirus-mediated gene therapy of SCID-X1. J. Clin. Invest. 2008;118:3132–3142. doi: 10.1172/JCI35700. [DOI] [PMC free article] [PubMed] [Google Scholar]
- 6.Hacein-Bey-Abina S., von Kalle C., Schmidt M., Le Deist F., Wulffraat N., McIntyre E., Radford I., Villeval J.L., Fraser C.C., Cavazzana-Calvo M., Fischer A. A serious adverse event after successful gene therapy for X-linked severe combined immunodeficiency. N. Engl. J. Med. 2003;348:255–256. doi: 10.1056/NEJM200301163480314. [DOI] [PubMed] [Google Scholar]
- 7.Howe S.J., Mansour M.R., Schwarzwaelder K., Bartholomae C., Hubank M., Kempski H., Brugman M.H., Pike-Overzet K., Chatters S.J., de Ridder D., et al. Insertional mutagenesis combined with acquired somatic mutations causes leukemogenesis following gene therapy of SCID-X1 patients. J. Clin. Invest. 2008;118:3143–3150. doi: 10.1172/JCI35798. [DOI] [PMC free article] [PubMed] [Google Scholar]
- 8.Stein S., Ott M.G., Schultze-Strasser S., Jauch A., Burwinkel B., Kinner A., Schmidt M., Krämer A., Schwäble J., Glimm H., et al. Genomic instability and myelodysplasia with monosomy 7 consequent to EVI1 activation after gene therapy for chronic granulomatous disease. Nat. Med. 2010;16:198–204. doi: 10.1038/nm.2088. [DOI] [PubMed] [Google Scholar]
- 9.Cavazzana-Calvo M., Payen E., Negre O., Wang G., Hehir K., Fusil F., Down J., Denaro M., Brady T., Westerman K., et al. Transfusion independence and HMGA2 activation after gene therapy of human beta-thalassaemia. Nature. 2010;467:318–322. doi: 10.1038/nature09328. [DOI] [PMC free article] [PubMed] [Google Scholar]
- 10.Liu Y., Dahl M., Debnath S., Rothe M., Smith E.M., Grahn T.H.M., et al. Successful gene therapy of Diamond-Blackfan anemia in a mouse model and human CD34(+) cord blood hematopoietic stem cells using a clinically applicable lentiviral vector. Haematologica. 2022;107:446–456. doi: 10.3324/haematol.2020.269142. [DOI] [PMC free article] [PubMed] [Google Scholar]
- 11.Berry C.C., Nobles C., Six E., Wu Y., Malani N., Sherman E., Dryga A., Everett J.K., Male F., Bailey A., et al. INSPIIRED: quantification and visualization tools for analyzing integration site distributions. Mol. Ther. Methods Clin. Dev. 2017;4:17–26. doi: 10.1016/j.omtm.2016.11.003. [DOI] [PMC free article] [PubMed] [Google Scholar]
- 12.Sherman E., Nobles C., Berry C.C., Six E., Wu Y., Dryga A., Malani N., Male F., Reddy S., Bailey A., et al. INSPIIRED: a pipeline for quantitative analysis of sites of new DNA integration in cellular genomes. Mol. Ther. Methods Clin. Dev. 2017;4:39–49. doi: 10.1016/j.omtm.2016.11.002. [DOI] [PMC free article] [PubMed] [Google Scholar]
- 13.Zhao Y., Traylen C., Rigsby P., Atkinson E., Satkunanathan S., Participants, Schneider CK. World Health Organization. Expert Committee on Biological Standardization. Report on a Collaborative Study for the Proposed WHO 1st International Reference Panel (19/158) for the Quantitation of Lentiviral Vector Integration Copy Numbers. 2019. https://who.int/publications/m/item/WHO-BS-2019.2373.
- 14.Strobl C., Boulesteix A.-L., Augustin T. Unbiased split selection for classification trees based on the Gini Index. Comput. Stat. Data Anal. 2007;52:483–501. [Google Scholar]
- 15.Chao A., Shen T.-J. Nonparametric estimation of Shannon’s index of diversity when there are unseen species in sample. Environ. Ecol. Stat. 2003;10:429–443. [Google Scholar]
- 16.Cartier N., Hacein-Bey-Abina S., Bartholomae C.C., Veres G., Schmidt M., Kutschera I., Vidaud M., Abel U., Dal-Cortivo L., Caccavelli L., et al. Hematopoietic stem cell gene therapy with a lentiviral vector in X-linked adrenoleukodystrophy. Science. 2009;326:818–823. doi: 10.1126/science.1171242. [DOI] [PubMed] [Google Scholar]
- 17.Aiuti A., Biasco L., Scaramuzza S., Ferrua F., Cicalese M.P., Baricordi C., Dionisio F., Calabria A., Giannelli S., Castiello M.C., et al. Lentiviral hematopoietic stem cell gene therapy in patients with Wiskott-Aldrich syndrome. Science. 2013;341:1233151. doi: 10.1126/science.1233151. [DOI] [PMC free article] [PubMed] [Google Scholar]
- 18.Biffi A., Montini E., Lorioli L., Cesani M., Fumagalli F., Plati T., Baldoli C., Martino S., Calabria A., Canale S., et al. Lentiviral hematopoietic stem cell gene therapy benefits metachromatic leukodystrophy. Science. 2013;341:1233158. doi: 10.1126/science.1233158. [DOI] [PubMed] [Google Scholar]
- 19.Goyal S., Tisdale J., Schmidt M., Kanter J., Jaroscak J., Whitney D., Bitter H., Gregory P.D., Parsons G., Foos M., et al. Acute myeloid leukemia case after gene therapy for sickle cell disease. N. Engl. J. Med. 2022;386:138–147. doi: 10.1056/NEJMoa2109167. [DOI] [PubMed] [Google Scholar]
- 20.Hsieh M.M., Bonner M., Pierciey F.J., Uchida N., Rottman J., Demopoulos L., Schmidt M., Kanter J., Walters M.C., Thompson A.A., et al. Myelodysplastic syndrome unrelated to lentiviral vector in a patient treated with gene therapy for sickle cell disease. Blood Adv. 2020;4:2058–2063. doi: 10.1182/bloodadvances.2019001330. [DOI] [PMC free article] [PubMed] [Google Scholar]
- 21.Tucci F., Galimberti S., Naldini L., Valsecchi M.G., Aiuti A. A systematic review and meta-analysis of gene therapy with hematopoietic stem and progenitor cells for monogenic disorders. Nat. Commun. 2022;13:1315. doi: 10.1038/s41467-022-28762-2. [DOI] [PMC free article] [PubMed] [Google Scholar]
- 22.Steensma D.P., Bejar R., Jaiswal S., Lindsley R.C., Sekeres M.A., Hasserjian R.P., Ebert B.L. Clonal hematopoiesis of indeterminate potential and its distinction from myelodysplastic syndromes. Blood. 2015;126:9–16. doi: 10.1182/blood-2015-03-631747. [DOI] [PMC free article] [PubMed] [Google Scholar]
- 23.Control WILfBSNIfBSa. Working Standard. NIBSC RR for Lentiviral Vector Integration Copy Number Quantitation. 2021. https://www.nibsc.org/documents/ifu/19-158.pdf.
- 24.Heinz N., Schambach A., Galla M., Maetzig T., Baum C., Loew R., Schiedlmeier B. Retroviral and transposon-based tet-regulated all-in-one vectors with reduced background expression and improved dynamic range. Hum. Gene Ther. 2011;22:166–176. doi: 10.1089/hum.2010.099. [DOI] [PubMed] [Google Scholar]
- 25.Ha T.C., Stahlhut M., Rothe M., Paul G., Dziadek V., Morgan M., Brugman M., Fehse B., Kustikova O., Schambach A., Baum C. Multiple genes surrounding Bcl-xL, a common retroviral insertion site, can influence hematopoiesis individually or in concert. Hum. Gene Ther. 2021;32:458–472. doi: 10.1089/hum.2019.344. [DOI] [PubMed] [Google Scholar]
- 26.Chapman D.G. The estimation of biological populations. Ann. Math. Statist. 1954;25:1–15. [Google Scholar]
Associated Data
This section collects any data citations, data availability statements, or supplementary materials included in this article.
Supplementary Materials
Data Availability Statement
Source data are provided with this paper. The datasets generated during and/or analyzed during the current study are available from Dr. Jeffrey A. Medin on reasonable request.