Abstract
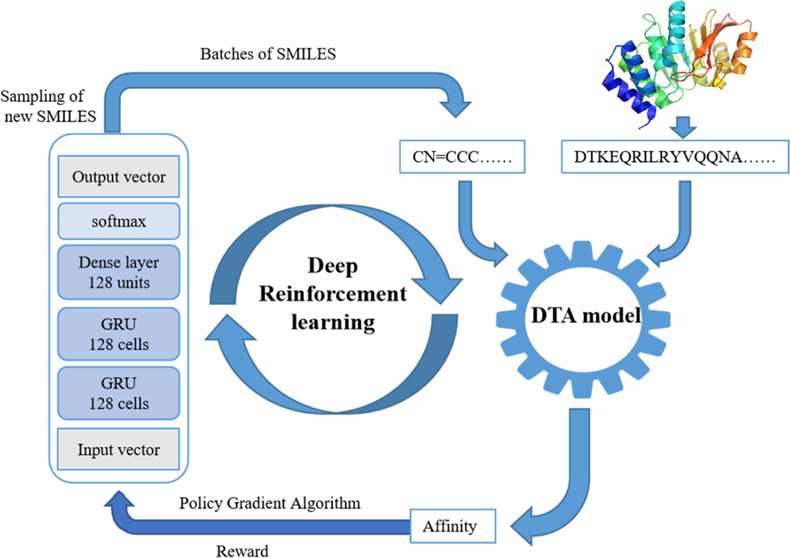
In drug design, the design and manufacture of safe and effective compounds is a long-term, complex, and complicated process. Therefore, developing a new rapid and generalizable drug design method is of great value. This study aimed to propose a general model based on reinforcement learning combined with drug–target interaction, which could be used to design new molecules according to different protein targets. The method adopted recurrent neural network molecular modeling and took the drug–target affinity model as the reward function of optimal molecular generation. It did not need to know the three-dimensional structure and active sites of protein targets but only required the information of a one-dimensional amino acid sequence. This approach was demonstrated to produce drugs highly similar to marketed drugs and design molecules with a better binding energy.
1. Introduction
Drug discovery is a long and complicated process. According to current data estimates, the average cost of discovering new drugs by the traditional methods is $2.6 billion, and the complete workflow may take more than 12 years.1 Reducing costs and speeding up the development of new drugs are the major concerns for pharmaceutical companies. However, the purpose of drug discovery is to identify new compounds with ideal properties that can become approved drugs and can be considered to fit the chemical space of potential drug-like molecules in the range of 1030 to 1060.2 Deep learning (DL) can solve this problem and be used to design diverse compounds with ideal drug properties.3 In recent years, DL has played a vital role in the field of artificial intelligence, especially in natural language processing and image recognition. DL has been gradually applied to other fields.4
The silico prediction of drug-target interaction based on DL has an important biological significance in drug discovery. The advantage of using DL is that it can discover hidden interactions between drugs and targets.5 In studies of DL-based drug–target affinity (DTA), SMILES or graph neural network (GNN) was generally used as the input of drugs, and the amino acid sequence or protein structure information6 that can be extracted was used as the input of the target, and the affinity value is output as a result through the neural network method.7 Also, the current DTA models developed based on DL, such as DeepDTA, GraphDTA, and DeepPurpose,8−10 can predict any protein target and drug molecule.
Besides DTA prediction applications, DL is also used to build molecular generative models. The SMILES string representation is commonly used for training the neural network models to learn molecular feature representations.11,12 Gupta et al. proposed a neural network based on long short-term memory, learned the grammar of using SMILES to represent molecules, and generated new SMILES representing new drugs.13 Olivecrona et al.12 combined the recurrent neural network (RNN) and reinforcement learning (RL) to generate SMILES with specific ideal chemical and biological characteristics (named REINVENT). The use of SMILES to represent a molecule requires the neural network to output a series of characters, and hence, each character output can be regarded as an action. For example, if a valid SMILES strings molecule is successfully output and has certain characteristics, the reward function of RL gives a certain reward. The DrugEx14 method creates a machine learning model as a predictor to predict whether the molecules are active. Based on this predictor as a reward function, the generator is trained by RL. Gao et al.15 develop a generative network complex to generate new drug-like molecules based on the multiproperty optimization in the latent space of an autoencoder. Krishnan et al. used transfer learning to learn the characteristics of the target-specific data set and used prediction models to predict the docking scores of molecules. The two models combined RL to design new drug molecules.16 The aforementioned methods all required specific data of small molecules or target proteins to construct predictors for drug design. It is impossible to design drugs for target proteins without specific data.
We developed a universal approach for drug design for any target protein. Previous studies need protein-specific data. This work can free itself from the requirement of “specific data,” and drug molecules can be designed only by the amino acid sequence without protein and drug data. Using RL, the DTA model was integrated into RL as an exploratory strategy, which was developed based on a molecular generation model and implemented with RNNs and a policy gradient REINVENT algorithm.17 We proved that our model only needed the primary structure of the target protein, that is, the amino acid sequence to design molecules with ideal drug properties. We then screened drugs against the candidate drugs generated by the molecular generation model to find drugs that could target this protein. This method had good universality and application prospect. In the following sections, we discussed the concept, application, and validation of the algorithm, divided into the following components: (1) molecular generation training model; (2) DTA model; (3) RL for property-optimized molecule generation; (4) building of the overall workflow; and (5) validation of the proposed pipeline.
2. Method
2.1. Molecular Generation Training Model
The first step was to train the generation model so that it learned the syntax of the SMILES format for expressing molecules and designed novel and efficient small molecules. The drug data set of the molecular generation model was collected from the CHEMBL database.18 This data set contained 1.44 million SMILES strings. The RNN model built for SMILES strings generation contains five layers: one input layer, three loop layers, and one output layer. The loop layer used 128 GRUs17 as cells, the optimizer is Adam, the learning rate is 0.001, and finally, the model outputs the probability of each string through the softmax function. This model could learn not only the grammar of SMILES but also the distribution of molecular structure information. More detailed information can be found in previous studies.12
2.2. DTA Model
The DTA models are designed to establish relationships between proteins and drugs by machine learning methods and accurately predict the affinity between drugs and targets. Most of the popular DTA models use DL methods. These methods can reduce the loss of feature information in predicting DTA models, thus overcoming certain limitations. Different DTA models have differences in drug embeddings and protein target embeddings. Common drug embeddings include the convolutional neural network (CNN),19 GNN,9 message passing neural network (MPNN),20 and Morgan21 and Daylight10 protein target embeddings including CNN, AAC,19 and so forth. We compared different DTA models developed at present and retrained the existing DTA models using the KIBA22 and the BindingDB23 data sets (version: 2021-01-01) to compare the performance of each DTA model. We selected the DTA model with the best performance as a scoring function integrated into RL.
The input molecule was represented by the SMILES strings. The input protein is represented by the amino acid sequence. Drug–target interaction data were obtained for the BindingDB and KIBA data sets. BindingDB contains 70,750 protein target interactions, 13,392 drugs, and 1507 proteins. The KIBA data set contains 118,254 protein target interactions, 2068 drugs, and 229 proteins. We used BindingDB and KIBA data sets to compare different existing DTA models. To select the best DTA model, we selected the currently popular models, KronRLS,24 SimBoost,25 DeepDTA, GraphDTA, DeepAffinity,26 and DeepPurpose, for comparison.
2.3. Reinforcement Learning
RL is used to describe and solve the problem; agents use learning strategies to maximize returns or achieve specific goals in the process of interaction with the environment. The RL framework was implemented using the REINVENT algorithm, and the aim was to teach the generator to generate a chemical space for molecules with specific properties.
Policy-based RL was used to fine-tune RNN-based proxies to generate molecules with a given desired property. The architecture consisted of two major parts that had the same RNN-based architecture: the prior network and the agent network. In strategy gradient training, the weights of prior models were kept unchanged. The weights of the agent model were normalized along with the learning syntax of small molecules, ensuring that the generated SMILES strings complied with chemical rules.
For RL, both the prior molecular generation model and the agent molecular generation model used molecular generation neural networks; the prior model was used as a reference point to sample the possibility of given SMILES. For each batch of SMILES generated by the agent, the prior model calculated the negative log-likelihood value, recorded as log P(A)prior.
The likelihood of sampling a given SMILES string was given by the product of the action probabilities. Let R(A) be the reward function based on the affinity prediction model. The agent calculated the prior probability by enhancing the likelihood function; the formula is as follows
log P(A)U represents the likelihood function of the prior model and δ represents the weight of the reward function. It uses the prior strategy and the agent’s strategy to find a balanced strategy, and the long-term return is written as
where log P(A)A represents the likelihood function of the agent. The rewards were maximized by minimizing the objective function.
Policies are the basis of RL. The gradient of policy parameters was updated using the following formula.
2.4. Workflow
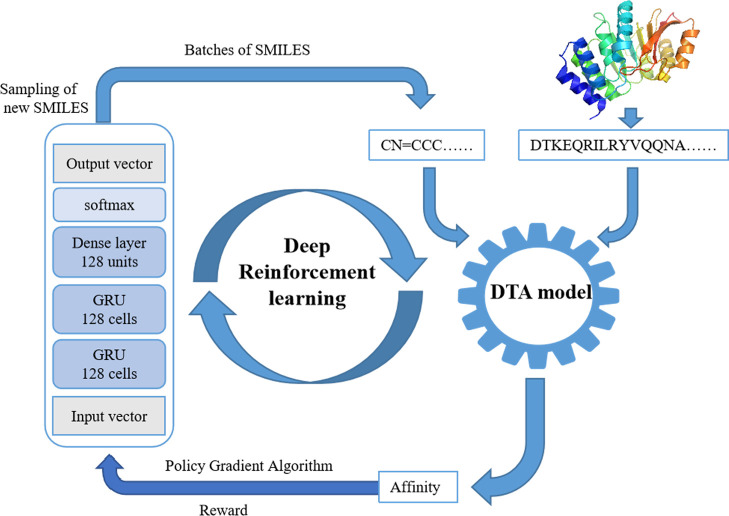
The framework was divided into two parts (Figure 1): the molecular generation model and the DTA model, which were trained to learn the affinity data between the molecule and the protein target. In the first stage, the two models were trained by the supervised learning algorithm. In the second stage, the two models were trained by the RL method. In this system, the molecular generation model was used to produce novel chemically viable molecules via the policy gradient algorithm of REINVENT. The DTA models predicted the affinity of novel compounds to amino acid sequences. The workflow started by selecting an amino acid sequence as input. The number of iterations is 1000, and each iteration is set to generate 128 molecules. First, samples of new compounds were taken from the generation model, and a batch of SMILES was generated. The generated molecules and amino acid sequences could predict affinity through the DTA model, that is, they were rewarded. The better the prediction made according to the DTA model, the greater the reward would be. Therefore, the molecules generated by the molecular generation model had a better affinity with the DTA model. Through repeated iteration, the generated molecules finally had a great affinity with the target amino acid sequence.
Figure 1.
Workflow utilizing REINVENT algorithms and DTA models as reward functions.
2.5. Validation of the Proposed Pipeline
Designing and manufacturing effective and safe compounds and maintaining the biological activity of molecules are important for de novo molecular generation. Therefore, it was necessary to strictly evaluate the molecules designed from scratch, that is, their physicochemical properties, synthetic accessibility, drug similarity, uniqueness, and diversity, to accurately verify that the molecules generated in our study were reliable. We defined a metric to evaluate whether the generated molecule could interact with the protein target. We use the docking score and root mean standard deviation (rmsd) for a more quantitative evaluation. When the generated molecule complied with the five rules of synthetic properties and docking according to the specific cavity of the protein, the compound was considered ideal, that is, when the docking score was <−10.0 kcal mol–1 and rmsd < 2.0 Å. In Vina, rmsd is used to indicate the difference between various docking positions. Taking the first ligand position as a reference, the rmsd values of the second docking position and the first position being within the 2.0 Å range was considered to be effective for molecular protein docking.
The protein was first selected as the input to validate the proposed pipeline. The following four proteins were selected: human Bruton’s tyrosine kinase (BTK), poly ADP-ribose polymerase (PARP), v-Raf murine sarcoma viral oncogene homologue B (BRAF), and epidermal growth factor receptor (EGFR). BTK is a member of the Tec family of nonreceptor tyrosine kinases and a key protein molecule in the B-cell receptor signaling pathway.27 It is involved in the proliferation, transport, chemotaxis, and adhesion of B cells. The types of hematological malignancies are widely expressed. The inhibition of its activity can produce obvious antitumor effects.28 A PARP inhibitor is a medical agent that can affect the self-replication mode of cancer cells. PARP inhibitors can make breast cancer drugs work effectively.29 BRAF is a serine/threonine kinase that is commonly activated by a somatic point mutation in cancer to provide new therapeutic opportunities in malignant melanoma.30 EGFR is a transmembrane glycoprotein that regulates cellular regulatory pathways that regulate cell proliferation, differentiation, and apoptosis. EGFR overexpression is closely related to tumor formation.31 First, the amino acid sequences of BTK (PDB ID: 5P9J), PARP (PDB ID: 5D5K), BRAF (PDB ID: 4MNF), and EGFR (PDB ID: 5ZWJ) proteins were input into the pipeline as inputs to obtain the small-molecule libraries.
Molecular docking is a method of drug design based on the characteristics of receptors and the interaction between receptors and drug molecules. Most frequently, a receptor (protein) molecule and a ligand, other small-molecule proteins, or nucleic acids are used for this procedure. Bound simulated structures of molecules are used with the ultimate goal of producing binding affinity and bound conformation. AutoDock Vina was used for molecular docking to study the interaction and binding energy between molecules and proteins. BTK protein (PDB ID: 5P9J) was taken as an example to verify the candidate drugs generated by the molecular generation model.
3. Results and Discussion
3.1. Comparison of the DTA Model Performance
Most methods currently determine the optimal architecture by changing different protein coding methods and drug molecular descriptors to better predict the affinity between drugs and targets. We compared common DTA models, evaluated by calculating the concordance index (CI) and mean square error (MSE), to find the best DTA model. The calculation formulas and methods of the CI and MSE are detailed in Supporting Information 1.
Comparing the two data sets (KIBA and BindingDB), the results shown in Tables 1 and 2 were obtained. Table 1 shows not much difference between the CI and MSE of GraphDTA, DeepDTA, and DeepPurpose. DeepPurpose (CNN for proteins and CNN for drugs) showed a good performance. As shown in Table 2, DeepPurpose (CNN for proteins and CNN for drugs) had the highest CI and the lowest MSE. Considering that the number of molecules in the BindingDB data set was larger than that in the KIBA data set, the model could better learn the coding rules of the SMILES format. Finally, we decided to choose DeepPurpose (CNN for proteins and CNN for drugs) taking BindingDB as the data set. The schematic diagram of the model is shown in Figure 2. It was used in the subsequent experiments. This model used two inputs, protein sequence and SMILES sequence, to learn the representation vector of each. The convolution and pooling layers were used to capture the potential patterns of proteins and drugs in the input. Then, they were connected through the fully connected layer and finally through training affinity regression.
Table 1. CI and MSE Scores of the Test Set Trained on Six Different Models for the KIBA Data Set.
| models | proteins | drugs | CI | MSE |
|---|---|---|---|---|
| KronRLS | S–W | Pubchem Sim | 0.782 | 0.411 |
| SimBoost | S–W | Pubchem Sim | 0.836 | 0.222 |
| DeepDTA | CNN | CNN | 0.864 | 0.196 |
| GraphDTA | CNN | GNN | 0.862 | 0.196 |
| DeepAffinity | HRNN | GCN | 0.842 | 0.201 |
| DeepPurpose | CNN | CNN | 0.856 | 0.196 |
Table 2. CI and MSE Scores of the Test Set Trained on Five Different Models for the BindingDB Data Set.
| models | proteins | drugs | CI | MSE |
|---|---|---|---|---|
| DeepPurpose | CNN | CNN | 0.857 | 0.600 |
| DeepPurpose | CNN | MPNN | 0.841 | 0.635 |
| DeepPurpose | CNN | Morgan | 0.846 | 0.631 |
| DeepPurpose | AAC | Morgan | 0.848 | 0.629 |
| DeepPurpose | AAC | Daylight | 0.841 | 0.649 |
Figure 2.
DTA model of DeepPurpose (CNN for proteins and CNN for drugs).
3.2. Validation of the Proposed Pipeline
For the current case studies, all the existing BTK, PARP, BRAF, and EGFR inhibitors were collected but used only for validating the pipeline. Before the amino acid sequences of the above four proteins were input into our model, to prevent the DTA model from directly obtaining the information of relevant proteins and drugs, the test results of the universality and effectiveness of the model would be affected. When the above proteins were used as inputs, the amino acid sequence, corresponding inhibitor, and affinity values of this protein (including related proteins with similar structures) were deleted from the BindingDB data set, and the DTA model was retrained to be used in the whole model framework. The DTA model predicts the affinity of the four proteins to the inhibitor, as shown in the Supporting Information.
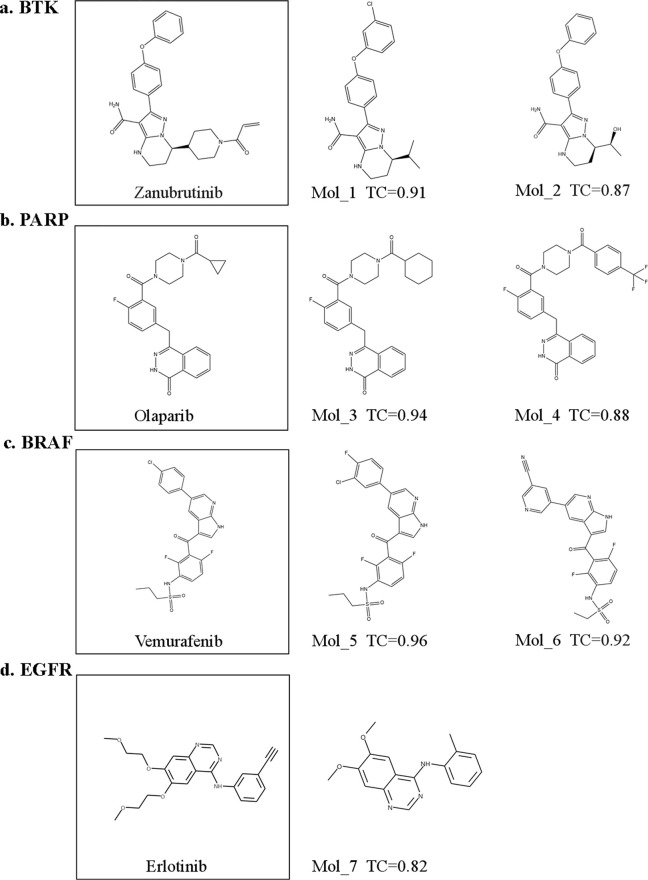
The amino acid sequences of BTK, PARP, BRAF, and EGFR were input into the pipeline to generate four small-molecule compound libraries. The similarity between the molecules was quantified using the Tanimoto coefficient32 (TC) based on RDKit-based molecular fingerprints compared with inhibitors and generated molecules. The TC cutoff value of 0.8 was used to identify the resulting molecule with high similarity to the existing inhibitors of the target protein. For BTK, two molecules highly similar to zanubrutinib (Figure 3a) can be found in the candidate drugs, with TC reaching 0.91 and 0.87, respectively. Among the candidate molecules for PARP generation, olaparib (Figure 3b), the PARP inhibitor, replaces only a three-membered ring with a six-membered ring and a trifluorinated carbon, compared with two molecules of a similar degree. Among the candidate molecules generated for BRAF, the TCs with vemurafenib (Figure 3c) were 0.96 and 0.92, respectively. For EGFR, the generated candidate molecule found a drug with a TC of 0.82 compared with erlotinib (Figure 3d). By comparing the TC, all four protein targets can find molecules that are highly similar to existing inhibitors, indicating that the generated candidate molecules have a great potential for finding better molecules for protein targets than existing inhibitors.
Figure 3.
Subset of the generated small molecules with a high similarity to the existing (a) BTK inhibitor (zanubrutinib), (b) PARP inhibitor (olaparib), (c) BRAF inhibitor (vemurafenib), and (d) EGFR inhibitor (erlotinib).
According to generate batch order of molecules, we calculated the protein molecule and the four kinds of similarity of inhibitors are already on the market, as shown in Figure S1, for each protein, to generate about 120,000 molecules, and the molecule with higher similarity is generated in about 20,000 to 80,000, after might generate better than known inhibitor molecules.
3.3. Distribution of Generated Molecular Properties
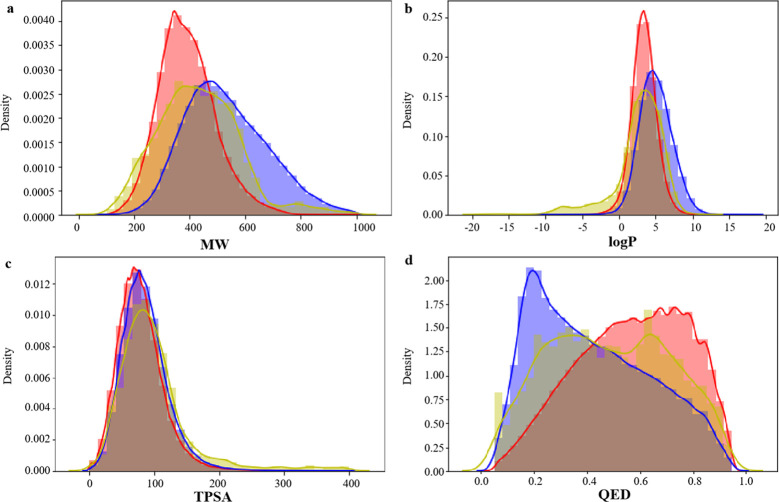
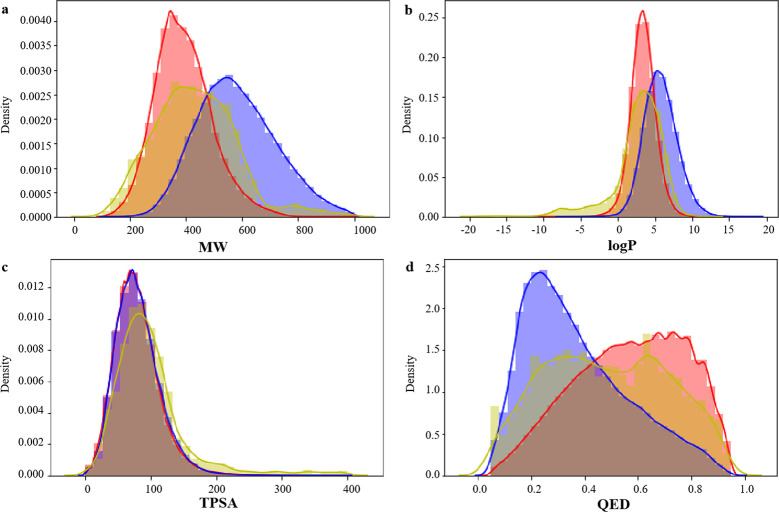
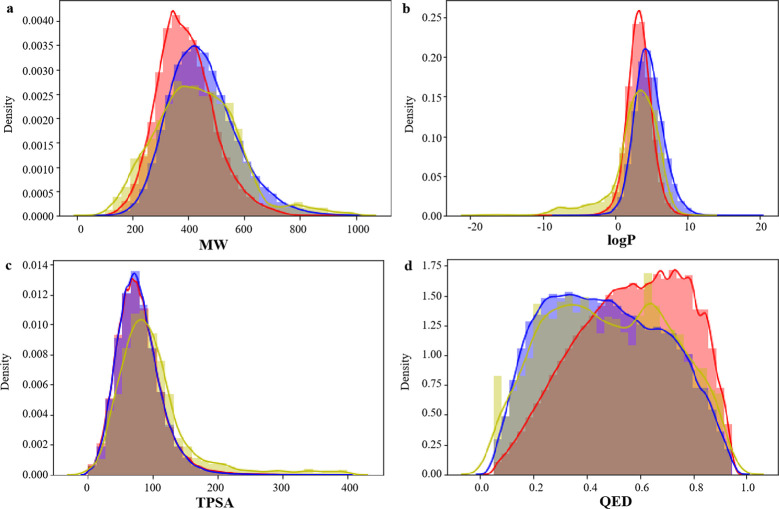
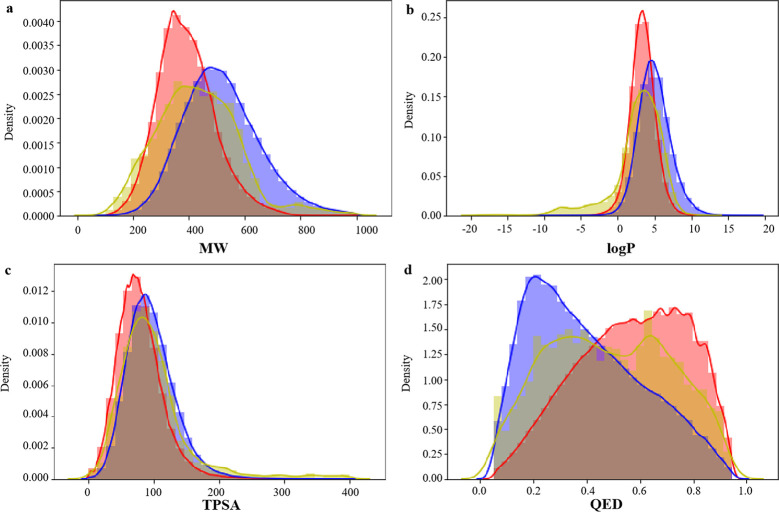
Molecular weight (MW), octanol–water partition coefficient (log P), topological polar surface area (TPSA), and quantitative estimate of drug-likeness (QED) of small molecules in pharmaceutical chemistry. We studied the distribution of several key molecular descriptors about the MW, log P, TPSA, and QED for the generated molecules for these four proteins (BTK, PARP, BRAF, and EGFR). In Figure 4a, the MW of candidate molecules is controlled within 1000, and the distribution range is close to that of two data sets. In Figure 4b,c, the log P and TPSA distributions of BindingDB and CHEMBL data sets are highly similar, while the candidate molecules generated for BTK are basically consistent with the log P and TPSA distributions of BindingDB and CHEMBL data sets, and the parameter distributions are highly similar. In Figure 4d, the peaks of QED distribution in the BindingDB data set are to the right and those in the CHEMBL data set are to the left, and the QED distribution of candidate drugs is to the left and right, indicating that the generated molecules reproduce the physical and chemical characteristics of BindingDB and CHEMBL data sets. Figures 5–7 show the distribution of four properties of candidate molecules for PARP, BRAF, and EGFR, respectively. The results show that the four physicochemical properties were similar to that in Figure 4. It was concluded that no matter which protein was targeted for drug design based on this method, the generated candidate molecules could well reproduce the physicochemical properties of the data sets.
Figure 4.
Distribution of molecular properties of generated molecules for BTK, CHEMBL, and BindingDB. (a) MW, (b) log P, (c) TPSA, and (d) QED. Generated molecules are shown in blue, CHEMBL molecules are shown in red, and BindingDB molecules are shown in yellow.
Figure 5.
Distribution of molecular properties of generated molecules for PARP, CHEMBL, and BindingDB. (a) MW, (b) log P, (c) TPSA, and (d) QED. Generated molecules are shown in blue, CHEMBL molecules are shown in red, and BindingDB molecules are shown in yellow.
Figure 7.
Distribution of molecular properties of generated molecules for EGFR, CHEMBL, and BindingDB. (a) MW, (b) log P, (c) TPSA, and (d) QED. Generated molecules are shown in blue, CHEMBL molecules are shown in red, and BindingDB molecules are shown in yellow.
Figure 6.
Distribution of molecular properties of generated molecules for BRAF, CHEMBL, and BindingDB. (a) MW, (b) log P, (c) TPSA, and (d) QED. Generated molecules are shown in blue, CHEMBL molecules are shown in red, and BindingDB molecules are shown in yellow.
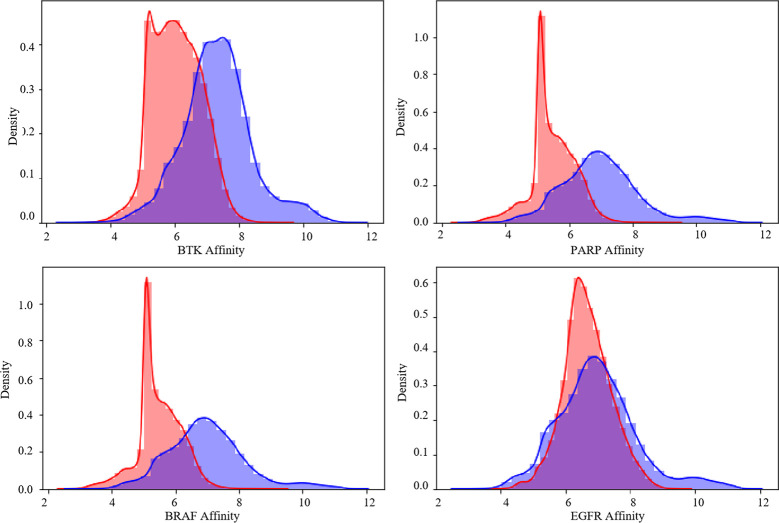
We further explore the generated and ChEMBL training concentrated random molecules and the affinity of distribution, the four proteins from random ChEMBL data set, and generate the same number of molecules for each protein, affinity, calculated through DTA model compared with the affinity of generated molecular distribution, get the results as shown in Figure 8, The peak of the affinity distribution of the molecules generated for these four proteins is to the right of the peak of the affinity distribution of the randomly selected molecules, indicating that our pipeline prediction of molecules is highly likely to be successful.
Figure 8.
Distribution of affinity of generated molecules and a random set of ChEMBL molecules.
3.4. t-Distributed Stochastic Neighbor Embedding Visualization of the Generated Molecules and Training Data Set
We used t-distributed stochastic neighbor embedding (t-SNE)33 to visualize the CHEMBL random molecules and the candidate drugs generated by the molecular generation model of the four proteins in two dimensions to further explore whether the physical and chemical properties of the molecules generated by the pipeline matched the CHEMBL training data. As shown in Figure 9, extended connectivity fingerprint (EGFC4)21 was used as the molecular descriptor, 10,000 molecules were randomly sampled from the CHEMBL data set, and the top 10,000 molecules with affinity ranking were selected. The generated candidate drugs all cover molecules randomly extracted from the CHEMBL data set and are more widely distributed. To ensure the reliability of comparison, molecules randomly extracted from the CHEMBL data set are different each time. Therefore, candidate molecules generated based on this method can well reproduce the characteristics of molecules in the training data set. The resulting molecules can represent larger chemical spaces.
Figure 9.
t-SNE projection of EGFC4 descriptors of random molecules from CHEMBL (blue) and molecules generated (orange).
3.5. Analysis of Performance Metrics for the Generated Molecules
We extracted the top 10,000 molecules of the four protein targets used for pipeline generation with affinity and evaluated them for validity, novelty, filters, and internal diversity. Our model was compared with the five molecular generation models (VAE, AAE, CharRNN, latent GAN, and JTN-VAE) in the MOSES method. The specific evaluation method, reference test set data, and various metrics for evaluating the performance of the generated model were according to MOSES.34 The evaluation results are summarized in Table 3. According to the RDKit library,35 the molecules generated by the pipeline conformed to the chemical structure and had high novelty, but the value and internal diversity through the customized drug chemical filter were low. The drug screening needed to be carried out according to the drug property rules to screen higher-quality lead compounds from these compound molecular libraries to improve the accuracy and efficiency of drug design.
Table 3. Evaluation of the Generated Molecules.
| our
model |
MOSES
reference models |
||||||||
|---|---|---|---|---|---|---|---|---|---|
| BTK | PARP | BRAF | EGFR | VAE | AAE | CharRNN | latent GAN | JTN-VAE | |
| valid | 1.0 | 0.999 | 0.999 | 1.0 | 0.977 ± 0.001 | 0.937 ± 0.034 | 0.975 ± 0.026 | 0.897 ± 0.002 | 1.0 |
| novelty | 0.999 | 0.992 | 0.989 | 0.979 | 0.695 ± 0.007 | 0.793 ± 0.028 | 0.842 ± 0.051 | 0.949 ± 0.001 | 0.914 ± 0.006 |
| filters | 0.308 | 0.398 | 0.413 | 0.793 | 0.997 ± 0.001 | 0.996 ± 0.001 | 0.994 ± 0.003 | 0.973 ± 0.001 | 0.976 ± 0.002 |
| internal diversity | 0.674 | 0.979 | 0.666 | 0.702 | 0.856 ± 0.0 | 0.856 ± 0.003 | 0.856 ± 0.0 | 0.857 ± 0.0 | 0.855 ± 0.003 |
3.6. Subset of Generated Molecules for Molecular Docking
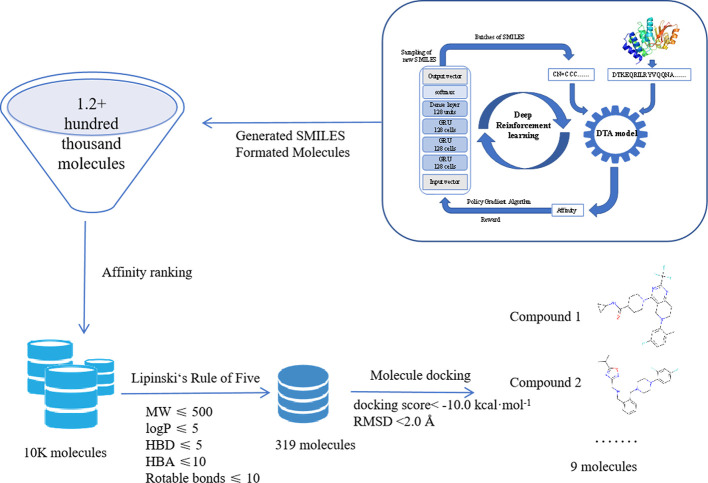
We continue to use BTK as a target protein to verify the reliability of the pipeline to make our pipeline work well. 1.2+ hundred thousand molecules were generated from the pipeline, as shown in Figure 10. The top 10,000 molecules were selected according to the DTA affinity ranking. For these 10,000 molecules, 319 molecules were selected according to the five rules. A high-quality subset was subsequently obtained from the generated molecules. In the next step, molecular docking was carried out. Docking studies attempted to explore the binding mode of the suggested protease inhibitors onto the 3D model of protease of BTK using Autodock Vina.36 Nine molecules were selected according to the docking score <−10.0 kcal mol–1 and rmsd < 2.0 Å. The structural formulae of the nine molecules are provided in the Supporting Information (Figure S2).
Figure 10.
Flowchart of BTK protein design molecules by the pipeline.
However, this study had several limitations. First, when artificial intelligence generates drugs, it is difficult to determine the binding sites of drugs and proteins, which requires the development of accurate machine learning models in the future that can both determine the binding sites of ligands and targets and predict affinity. Second, our research results were based on BTK, and it was difficult to determine how the AI-generated molecules and proteins are bound. Therefore, the therapeutic potential of the ligand we selected for laboratory synthesis, preclinical trials, and other aspects needs to be further examined.
4. Conclusions and Future Work
We proposed a new artificial intelligence drug design method, which will continue to improve with the continuous improvement of the accuracy of the DTA model in the future. In the absence of a target-specific small-molecule data set, small molecules are generated for the target of interest. This method had good versatility. It did not need to know the three-dimensional structure and active site of the protein target and only needed a one-dimensional amino acid sequence. Our aim was primarily the application of drug–target interaction combined with RL in downstream technology. This approach showed several promising traits and could find drug molecules that had a strong affinity for the target.
After creating this framework using RL and the DTA model, the next step was to optimize the DTA model to further improve its accuracy of the DTA model. Simultaneous optimization of multiple attributes, combining RL with multi-objective optimization, enabled the method to meet the strict standards required for drug candidate development. Regarding the accuracy of the model, not only did it rely on an endless stream of algorithms but it also required the support of good data. We called on pharmaceutical companies to contribute more and better DTA data to further improve the accuracy of the DTA model and contribute to human health.
Acknowledgments
This work was supported by the National Key Research & Development Program of China (grant no. 2021YFA1201000).
Supporting Information Available
The Supporting Information is available free of charge at https://pubs.acs.org/doi/10.1021/acsomega.2c06653.
DTA evaluation method, DTA model for proteins and related inhibitors, candidate inhibitors of BTK, and detailed computational methods for molecular assessment (PDF)
The authors declare no competing financial interest.
Supplementary Material
References
- Mohs R. C.; Greig N. H. Drug discovery and development: Role of basic biological research. Alzheimer’s Dementia 2017, 3, 651–657. 10.1016/j.trci.2017.10.005. [DOI] [PMC free article] [PubMed] [Google Scholar]
- Mullard A. The drug-maker’s guide to the galaxy. Nature 2017, 549, 445–447. 10.1038/549445a. [DOI] [PubMed] [Google Scholar]
- Jing Y.; Bian Y.; Hu Z.; Wang L.; Xie X.-Q. Deep learning for drug design: an artificial intelligence paradigm for drug discovery in the big data era. AAPS J. 2018, 20, 58. 10.1208/s12248-018-0243-4. [DOI] [PMC free article] [PubMed] [Google Scholar]
- LeCun Y.; Bengio Y.; Hinton G. Deep learning. Nature 2015, 521, 436–444. 10.1038/nature14539. [DOI] [PubMed] [Google Scholar]
- Wen M.; Zhang Z.; Niu S.; Sha H.; Yang R.; Yun Y.; Lu H. Deep-Learning-Based Drug-Target Interaction Prediction. J. Proteome Res. 2017, 16, 1401–1409. 10.1021/acs.jproteome.6b00618. [DOI] [PubMed] [Google Scholar]
- Meng Z.; Xia K. Persistent spectral–based machine learning (PerSpect ML) for protein-ligand binding affinity prediction. Sci. Adv. 2021, 7, eabc5329 10.1126/sciadv.abc5329. [DOI] [PMC free article] [PubMed] [Google Scholar]
- Lim S.; Lu Y.; Cho C. Y.; Sung I.; Kim J.; Kim Y.; Park S.; Kim S. A review on compound-protein interaction prediction methods: Data, format, representation and model. Comput. Struct. Biotechnol. J. 2021, 19, 1541–1556. 10.1016/j.csbj.2021.03.004. [DOI] [PMC free article] [PubMed] [Google Scholar]
- Öztürk H.; Özgür A.; Ozkirimli E. DeepDTA: deep drug–target binding affinity prediction. Bioinformatics 2018, 34, i821–i829. 10.1093/bioinformatics/bty593. [DOI] [PMC free article] [PubMed] [Google Scholar]
- Nguyen T.; Le H.; Quinn T. P.; Nguyen T.; Le T. D.; Venkatesh S. GraphDTA: prediction of drug–target binding affinity using graph convolutional networks. bioRxiv 2020, 2020, 684662. 10.1101/684662. [DOI] [Google Scholar]
- Huang K.; Fu T.; Glass L. M.; Zitnik M.; Xiao C.; Sun J. DeepPurpose: a deep learning library for drug-target interaction prediction. Bioinformatics 2021, 36, 5545–5547. 10.1093/bioinformatics/btaa1005. [DOI] [PMC free article] [PubMed] [Google Scholar]
- a Segler M. H. S.; Kogej T.; Tyrchan C.; Waller M. P. Generating Focused Molecule Libraries for Drug Discovery with Recurrent Neural Networks. ACS Cent. Sci. 2018, 4, 120–131. 10.1021/acscentsci.7b00512. [DOI] [PMC free article] [PubMed] [Google Scholar]; b Popova O. I.; Isayev O.; Tropsha A. Deep reinforcement learning for de novo drug design. Sci. Adv. 2018, 4, eaap7885 10.1126/sciadv.aap7885. [DOI] [PMC free article] [PubMed] [Google Scholar]
- Olivecrona M.; Blaschke T.; Engkvist O.; Chen H. Molecular de-novo design through deep reinforcement learning. J. Cheminf. 2017, 9, 48. 10.1186/s13321-017-0235-x. [DOI] [PMC free article] [PubMed] [Google Scholar]
- Gupta A.; Müller A. T.; Huisman B. J. H.; Fuchs J. A.; Schneider P.; Schneider G. Generative Recurrent Networks for De Novo Drug Design. Mol. Inf. 2018, 37, 1700111. 10.1002/minf.201700111. [DOI] [PMC free article] [PubMed] [Google Scholar]
- Liu X.; Ye K.; van Vlijmen H. W. T.; IJzerman I. J.; van Westen G. J. P. An exploration strategy improves the diversity of de novo ligands using deep reinforcement learning: a case for the adenosine A2A receptor. J. Cheminf. 2019, 11, 1–16. 10.1186/s13321-019-0355-6. [DOI] [PMC free article] [PubMed] [Google Scholar]
- Gao K.; Nguyen D. D.; Tu M.; Wei G.-W. Generative network complex for the automated generation of drug-like molecules. J. Chem. Inf. Model. 2020, 60, 5682–5698. 10.1021/acs.jcim.0c00599. [DOI] [PMC free article] [PubMed] [Google Scholar]
- Krishnan S. R.; Bung N.; Bulusu G.; Roy A. Accelerating De Novo Drug Design against Novel Proteins Using Deep Learning. J. Chem. Inf. Model. 2021, 61, 621–630. 10.1021/acs.jcim.0c01060. [DOI] [PubMed] [Google Scholar]
- Blaschke T.; Arús-Pous J.; Chen H.; Margreitter C.; Tyrchan C.; Engkvist O.; Papadopoulos K.; Patronov A. REINVENT 2.0: An AI Tool for De Novo Drug Design. J. Chem. Inf. Model. 2020, 60, 5918–5922. 10.1021/acs.jcim.0c00915. [DOI] [PubMed] [Google Scholar]
- Gaulton A.; Hersey A.; Nowotka M.; Bento A. P.; Chambers J.; Mendez D.; Mutowo P.; Atkinson F.; Bellis L. J.; Cibrián-Uhalte E.; et al. The ChEMBL database in 2017. Nucleic Acids Res. 2017, 45, D945–D954. 10.1093/nar/gkw1074. [DOI] [PMC free article] [PubMed] [Google Scholar]
- Reczko M.; Bohr H. The DEF data base of sequence based protein fold class predictions. Nucleic Acids Res. 1994, 22, 3616–3619. [PMC free article] [PubMed] [Google Scholar]
- Gilmer J.; Schoenholz S. S.; Riley P. F.; Vinyals O.; Dahl G. E.. Neural Message Passing for Quantum Chemistry. International Conference on Machine Learning, 2017; Vol. 70, pp 1263–1272.
- Rogers D.; Hahn M. Extended-Connectivity Fingerprints. J. Chem. Inf. Model. 2010, 50, 742–754. 10.1021/ci100050t. [DOI] [PubMed] [Google Scholar]
- He T.; Heidemeyer M.; Ban F.; Cherkasov A.; Ester M. SimBoost: a read-across approach for predicting drug–target binding affinities using gradient boosting machines. J. Cheminf. 2017, 9, 24. 10.1186/s13321-017-0209-z. [DOI] [PMC free article] [PubMed] [Google Scholar]
- Liu T.; Lin Y.; Wen X.; Jorissen R. N.; Gilson M. K. BindingDB: a web-accessible database of experimentally determined protein–ligand binding affinities. Nucleic Acids Res. 2007, 35, D198–D201. 10.1093/nar/gkl999. [DOI] [PMC free article] [PubMed] [Google Scholar]
- Pahikkala T.; Airola S. P.; Pietila S.; Shakyawar A.; Szwajda A.; Tang T.; Aittokallio T. Toward more realistic drug-target interaction predictions. Briefings Bioinf. 2014, 16, 325–337. 10.1093/bib/bbu010. [DOI] [PMC free article] [PubMed] [Google Scholar]
- He T.; Heidemeyer M.; Ban F.; Cherkasov A.; Ester M. SimBoost: a read-across approach for predicting drug–target binding affinities using gradient boosting machines. J. Cheminf. 2017, 9, 24. 10.1186/s13321-017-0209-z. [DOI] [PMC free article] [PubMed] [Google Scholar]
- Karimi M.; Wu D.; Wang Z. Y.; Shen Y. DeepAffinity: interpretable deep learning of compound-protein affinity through unified recurrent and convolutional neural networks. Bioinformatics 2019, 35, 3329–3338. 10.1093/bioinformatics/btz111. [DOI] [PMC free article] [PubMed] [Google Scholar]
- Liang C.; Tian D.; Ren X.; Ding S.; Jia M.; Xin M.; Thareja S. The development of Bruton’s tyrosine kinase (BTK) inhibitors from 2012 to 2017: A mini-review. Eur. J. Med. Chem. 2018, 151, 315–326. 10.1016/j.ejmech.2018.03.062. [DOI] [PubMed] [Google Scholar]
- Kim H. O. Development of BTK inhibitors for the treatment of B-cell malignancies. Arch. Pharmacal Res. 2019, 42, 171–181. 10.1007/s12272-019-01124-1. [DOI] [PubMed] [Google Scholar]
- Dziadkowiec K. N.; Gąsiorowska E.; Nowak-Markwitz E.; Jankowska A. PARP inhibitors: review of mechanisms of action and BRCA1/2 mutation targeting. Przegl. Menopauzalny 2016, 4, 215–219. 10.5114/pm.2016.65667. [DOI] [PMC free article] [PubMed] [Google Scholar]
- Davies H.; Bignell G. R.; Cox C.; Stephens P.; Edkins S.; Clegg S.; Teague J.; Woffendin H.; Garnett M. J.; Bottomley W.; Davis N.; Dicks E.; Ewing R.; Floyd Y.; Gray K.; Hall S.; Hawes R.; Hughes J.; Kosmidou V.; Menzies A.; Mould C.; Parker A.; Stevens C.; Watt S.; Hooper S.; Wilson R.; Jayatilake H.; Gusterson B. A.; Cooper C.; Shipley J.; Hargrave D.; Pritchard-Jones K.; Maitland N.; Chenevix-Trench G.; Riggins G. J.; Bigner D. D.; Palmieri G.; Cossu A.; Flanagan A.; Nicholson A.; Ho J. W. C.; Leung S. Y.; Yuen S. T.; Weber B. L.; Seigler H. F.; Darrow T. L.; Paterson H.; Marais R.; Marshall C. J.; Wooster R.; Stratton M. R.; Futreal P. A. Mutations of the BRAF gene in human cancer. Nature 2002, 417, 949–954. 10.1038/nature00766. [DOI] [PubMed] [Google Scholar]
- Le T.; Gerber D. E. Newer-generation EGFR inhibitors in lung cancer: how are they best used?. Cancers 2019, 11, 366. 10.3390/cancers11030366. [DOI] [PMC free article] [PubMed] [Google Scholar]
- Lipkus A. H. A proof of the triangle inequality for the Tanimoto distance. J. Math. Chem. 1999, 26, 263–265. 10.1023/a:1019154432472. [DOI] [Google Scholar]
- van der Maaten L.; Hinton G. Visualizing Data using t-SNE. J. Mach. Learn. Res. 2008, 9, 2579–2605. [Google Scholar]
- Polykovskiy D.; Zhebrak A.; Sanchez-Lengeling B.; Golovanov S.; Tatanov O.; Belyaev S.; Kurbanov R.; Artamonov A.; Aladinskiy V.; Veselov M.; et al. Molecular Sets (MOSES): A Benchmarking Platform for Molecular Generation Models. Front. Pharmacol. 2020, 11, 565–644. 10.3389/fphar.2020.565644. [DOI] [PMC free article] [PubMed] [Google Scholar]
- Landrum G.Rdkit: Open-source cheminformatics software, 2016.
- Morris G. M.; Huey R.; Lindstrom W.; Sanner M. F.; Belew R. K.; Goodsell D. S.; Olson A. J. AutoDock4 Automated docking with selective receptor flexibility. J. Comput. Chem. 2009, 30, 2785–2791. 10.1002/jcc.21256. [DOI] [PMC free article] [PubMed] [Google Scholar]
Associated Data
This section collects any data citations, data availability statements, or supplementary materials included in this article.


