

Abstract

In this study, a dynamic simulator for three-phase gravity separators in oil production facilities is proposed. The mass conservation equation is established to calculate the pressure, water level, and oil level in the separator and the mass balance equation of the dispersed phase to calculate the oil–water separation efficiency. The proportional integral controllers are applied to control the water level, oil level, and pressure in the separator by setting the opening of the three outlet valves of oil, gas, and water. The model is verified using field data by means of the given valve opening and given proportional integral controller parameters, respectively. Subsequently, the verified simulator is applied to study the dynamic behavior of the separator filling process and the effect of pressure, oil level, and water level setpoint changes on the separator operating status. A detailed analysis of the changes in the liquid level, pressure, and opening of three outlet valves is presented. Then, the effects of operating conditions such as the inlet flow, water setpoint, and weir height on the separation efficiency are discussed. This simulator can be applied for the design of oil, gas, and water three-phase separation processes. In addition, through this simulator, the parameters that are difficult to be measured by instruments during the operation of the separator can be calculated, providing technical support for the construction of the digital twin of the separator.
1. Introduction
The digital twin is one of the buzzwords of the last several years in the petroleum industry.1 Digital twins can provide innovative ways of using simulations to reshape the digital transformation of Oil & Gas 4.0,2 which enable operators to respond to potential equipment failures pre-emptively and plan remedial measures before failures occur.3 Meanwhile, real-time data can be gathered from sensors and simulator results to know the accurate state of the equipment.4 Digital twins are believed to help identify opportunities for process improvement, production data improvement, operating cost reduction, and health, safety, and environment (HSE) risk reduction.5
In the process of oil production, the produced fluid gushing from the Christmas tree is generally a mixture of water, light hydrocarbons, and oil,6 which need to be separated before they can be metered and exported.7 Thus, the separators are an important unit of the gas–oil separation plant, and controlling the separator operation8 is crucial to achieving the required efficiency and specification of the fluids exiting from the separator for further processing.9 The water level, oil level,10 pressure, and separation efficiency are the key parameters for the operation of the three-phase gravity separator.11 The digital twin of the three-phase gravity separator can effectively monitor and control the running state of the separator. The establishment of dynamic simulators plays an indispensable role in the digital twin practice of three-phase gravity separators.12
Many studies have been carried out to investigate the dynamic behavior and separation efficiency of separators, most of which use computational fluid dynamics (CFD).13−15 However, due to the huge demand for computing resources, CFD-based models cannot be applied to the practice of digital twins.16,17 Few studies have been carried out from the perspective of conservation of mass and first-principles.8
Sayda and Taylor18 completed the dynamic modeling of the separator in 2007 by developing a simple phase equilibrium model that extended the American Petroleum Institute (API) static design criteria. On this basis, a simple proportional integral (PI) controller was added to realize the control and level loop process dynamics identification.19 Backi et al.8 presented an approach for the control and simulation of the liquid level, pressure, and oil–water separation efficiency including simplified droplet balance calculations. Three PI controllers were applied to control the flowrate of gas, oil, and water phase outlets, but the valve is not taken into account. Das et al.20 proposed a coalescence-based dynamic gravity separator model to obtain the oil content in the water outlet and the water content in the oil outlet. In addition, a number of mature commercial simulators have been proposed, such as HYSYS,21 OLGA,22 and K-spice,23 which can simulate the processes of the separator. However, the models and algorithms of commercial software are not available to the public.
In this work, a dynamic simulator for a three-phase gravity separator in oil production facilities is proposed. The remainder of the paper is organized as follows. In Section 2, the model development is shown in detail. The model verification is presented in Section 3. The discussions about dynamic behavior due to separator filling and setpoint change and how the separation efficiency is affected by the operating conditions are performed in Section 4. Finally, the conclusions are presented.
2. Model Description
The separation process is shown in Figure 1. In the separation zone on the left side of the weir, the mixed liquid is usually divided into three continuous phases, with a continuous water layer at the bottom and a continuous oil layer above the water layer. The gas phase is at the top of the separator.24 The water level refers to the water level in the separation area on the left side of the weir plate, and the oil level refers to the oil level on the right side of the weir plate.
Figure 1.

Schematic of a three-phase gravity separator.
In the separation zone on the left side of the weir, the oil droplets dispersed in the water and the water droplets dispersed in the oil are separated from their respective bulk phase. In this work, it is assumed that the droplets have reached the dynamic equilibrium of aggregation and fragmentation before entering the separation section. Therefore, the phenomenon of droplet aggregation or fragmentation is ignored in this work. It is assumed that neither the oil phase outlet nor the water phase outlet contains gas; ignore the part of gas dissolved in oil or water. Moreover, only mass conservation is considered inside the separator, and energy conservation is ignored.
2.1. Governing Equations of the Liquid Level and Pressure
For the calculation of the liquid level on the left side of the weir, it is considered that the liquid is incompressible. The volume of the fluid and water on the left side of the weir can be obtained according to eqs 1 and 2 respectively, and the liquid level can be calculated according to eq 3. The first part of eq 3 is the volume of the separator cylinder, and the second part is the volume of the elliptical head of the separator edge.
| 1 |
| 2 |
| 3 |
where, V is the volume of the liquid on the left side of the weir, m3. Q is the flowrate of liquid, m3/s. Δt is the time step, s. L is the length of the left part of the weir plate in the separator, m. D is the diameter of the separator cylinder, m. H is the liquid level, m. hi is the surface width of the ellipse head, m. Subscripts l, w, and o stand for total liquid, water, and oil, respectively. Superscripts t and t+1 stand for the current time step and the next time step, respectively. Subscripts in and out stand for input parameters and output parameters, respectively.
The pressure in the separator can be calculated according to eqs 4 and 5.
| 4 |
| 5 |
where n is the molar amount of gas in the separator, mol. ρg is the density of gas, kg/m3. M is the molar mass, kg/mol. P is the pressure in the separator, Pa. z is the compression factor, which is calculated by the Peng–Robinson equation of state.25R is the gas constant, 8.314 J/(mol·K). T is the temperature, K. Subscript g stands for gas.
The outlet flow of the oil, gas, and water from the separator depends on the pressure difference between the upstream and downstream of the valve, the physical properties of the fluid, and the properties of the valve. Referring to the industry standard ISA-75.01.01-2007,26,27 the mass flowrate at the outlet of the separator is determined by eqs 6–8
| 6 |
 |
7 |
| 8 |
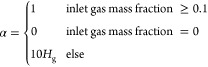
where G is the total mass flowrate through the valve, kg/h. α is the adjusted vapor mass fraction, dimensionless. Hg is the inlet gas mass fraction of the valve. Fp is the pipe geometry parameter. Fp is a dimensionless quantity; if the diameters of the inlet pipe and the outlet pipe of the valve are equal, Fp is equal to 1. If the inlet and outlet diameters of the valve are different, the value of Fp can be found from the valve manufacturer’s catalog. Cv is the effective flow coefficient, m2. ρl is the liquid density, kg/m3. Pinlet and Poutlet represent the pressure at the inlet and outlet of the valve, respectively, kPa. Y is the gas expansion coefficient. Cv, Xt, and Fk are provided by the valve manufacturer.
2.2. Mass Balance Equation of the Dispersed Phase
(No + Nw)Nx grids are generated in this section. The separator is divided into Nx column areas horizontally, Nx – 1 columns on the left side of the weir plate, and one column on the right side of the weir plate. The oil layer and the water layer are divided into No and Nw small control bodies in the vertical direction, which can ensure that the oil–water interface is not in the control body.
The flow of dispersed phase particles due to volume flow is called convective flow, and the flow of dispersed phase particles driven by buoyancy is called non-convective flow, as shown in Figure 2.
Figure 2.

Flow of each small control body in the gravity separator model; convection flow is shown in yellow and the non-convective flow of water and oil droplets is shown in green and red, respectively.
For ease of calculation, the droplets in the control body are classified according to their particle size. The number of droplets in a unit volume is defined as the droplet number density,28 as shown in eq 9. The number density of the kth dispersed phase droplets in the control volume (i, j) at time step t+1 is expressed as eqs 10 and 11
| 9 |
| 10 |
 |
11 |
where σ is the droplet number density, m–3. N is the number of droplets. V is the volume of the control body, m3. v is the velocity of the droplet, m/s. A is the area of the interface of the control volume, m2. Superscripts i and j represent the index of the control body. Subscript k stands for the index of the droplet group. Subscripts x and y represent the parameter in the x and y directions, respectively. Subscripts left and bottom represent the left and bottom interfaces of the control volume, respectively.
Assuming that the flow above and below the oil–water interface is an independent flow, the lateral velocity of the droplets in the gravity separator is expressed as eq 12.
 |
12 |
where ΔV is the volume change of the oil or water phase on the left of the weir plate, m3. A is the cross-sectional area of the oil or water layer, m2.
The velocity29 of the dispersed phase in the vertical direction is expressed as eqs 13–15.
 |
13 |
| 14 |
| 15 |
where vy is the velocity of the dispersed phase in the vertical direction, m/s. ρ is the density of oil or water, kg/m3. Δρ is the density difference between the droplet and the continuous phase, kg/m3. d is the diameter of the droplet, m. μ is the continuous phase viscosity, Pa·s. 0.153 and 1.74 are dimensionless constants.
2.3. Controllers of the Liquid Level and Pressure
In this work, the dynamic change process of the gravity separator is controlled by three PI controllers,30,31 and the incremental algorithm is applied as the control algorithm. The algorithm model is as shown in eq 16 below
 |
16 |
where the subscripts P, ol, and wl represent pressure, oil level, and water level, respectively. f(t) is the controller output value at time t, dimensionless. For water level control, oil level control, and pressure control, the output values are the opening of the water outlet valve, the opening of the oil outlet valve, and the opening of the air outlet valve, respectively. KP is the proportional gain coefficient, and the dimensions of KPP, KPol, and KPwl are pa–1, m–1, and m–1, respectively. e(t) is the error at time t obtained by subtracting the input value from the set point value, and the unit is consistent with the input variable. KI is the integration time constant, and the dimensions of KIP, KIol, and KIwl are all s.
The control logic of system pressure is shown in Figure 3a. The difference between the pressure setting point and the calculated pressure value at the previous time step is the input of the PI controller. The PI controller calculates the flow rate of the gas outlet by eqs 6–8. Then, the system pressure at the current moment can be obtained by eq 9. Similarly, the control logic for the oil level and water level is shown in Figure 3b,c.
Figure 3.

Control logic flow of the PI controller.
3. Model Verification
The dynamic simulator is validated with field data obtained from a separator running in an offshore platform. The horizontal separator has a diameter of 2.2 m and a length of 5 m. The height of the weir plate is 1.6 m, and the distance from the separator inlet is 3.5 m. The components of the separator inlet fluid are shown in Table 1. Where, components 10–14 are estimated as unknown components. Details of estimated unknown components are shown in Table 2.
Table 1. Components of the Separator Inlet Fluida.
| no | component | mole fraction % | mole fraction % (in gas) | mole fraction % (in oil) | no | component | mole fraction % | mole fraction % (in gas) | mole fraction % (in oil) |
|---|---|---|---|---|---|---|---|---|---|
| 1 | N2 | 0.00658 | 2.6485 | 0.08321 | 8 | n-pentane | 0 | 0 | 0 |
| 2 | CO2 | 0.00136 | 0.2413 | 0.02928 | 9 | water | 98.942 | 2.5879 | 0.3125 |
| 3 | methane | 0.240 | 93.911 | 4.8015 | 10 | NBP275* | 0.0838 | 0.001 | 9.8174 |
| 4 | ethane | 0.00136 | 0.4059 | 0.05858 | 11 | NBP443* | 0.255 | 0 | 29.8992 |
| 5 | propane | 0.000454 | 0.09113 | 0.0305 | 12 | NBP624* | 0.259 | 0 | 30.3454 |
| 6 | n-butane | 0.000680 | 0.02548 | 0.02024 | 13 | NBP779* | 0.168 | 0 | 19.6352 |
| 7 | i-butane | 0.000227 | 0.08763 | 0.05794 | 14 | NBP958* | 0.042 | 0 | 4.9088 |
NBP: normal boiling point.
Table 2. Details of Estimated Unknown Components.
| name | NBP275* | NBP443* | NBP624* | NBP779* | NBP958* |
|---|---|---|---|---|---|
| NBP (°C) | 274.9 | 443.1 | 624.2 | 779.2 | 958.2 |
| molecular weight | 203.2 | 390.5 | 639.9 | 884.1 | 1121.8 |
| density [(kg/m3)] | 810.9 | 888.2 | 957.1 | 1008.6 | 1060 |
| Tc (°C) | 444.1 | 590.8 | 738.3 | 859.5 | 995.1 |
| Pc (kPa) | 1610 | 968 | 558 | 340 | 181 |
| Vc(m3/kmol) | 0.874 | 1.539 | 2.835 | 4.877 | 9.644 |
| eccentricity | 0.698 | 1.1031 | 1.488 | 1.7725 | 2.061 |
The downstream pressure of the oil valve, gas valve, and water valve is set to 200 kPa. The initial water level in the separator is set to 1.547 m, the initial oil level on the right side of the weir plate is 1 m, and the initial pressure in the separator is 1150 kPa. The gas mole flowrate, oil mole flowrate, and water mole flowrate at the separator inlet are 3.696, 14.88, and 1724 kmol/h, respectively. The gas volumetric flow rate, oil volumetric flow rate, and water volumetric flow rate at the separator inlet are 0.1936, 8.715, and 31.12 m3/h, respectively. The valve coefficients (Cv)32,33 of the three valves of oil, water, and gas are 52.8215, 57.3018, and 0.3924, respectively. Fp, Xt, and Fk are 1, 0.7, and 0.9, respectively. The particle size distribution of the water droplets in the inlet of the separator is shown in Figure 4.
Figure 4.

Particle size distribution of water droplets in the inlet of the separator.
3.1. Simulation with the Given Valve Opening
In this part, the openings of the three valves of oil, water, and gas are 0.0879, 0.19, and 1. The simulation results of pressure, oil level on the right side of the weir, water level on the left side of the weir, and water volume fraction in oil in the outlet are compared with the operation data of the separator to verify the accuracy of this simulator, which are shown in Figure 5. The average absolute deviations (AADs) for separator pressure, oil level, water level, and water volume fraction in oil in the separator are 0.0943, 0.405, 0.139, and 17.45%, respectively.
Figure 5.

Comparison of the simulation results of pressure, oil level, water level, and water volume fraction in oil with the operation data of the separator.
3.2. Simulation with Given Setpoints of the Oil Level, Water Level, and Pressure
Different from Section 3.1, in this part, the setpoints of pressure, oil level, water level, and PI controller parameters are given in Table 3. The openings of the three outlet valves are controlled by the PI controllers to adjust the pressure and liquid level at the setpoint. The openings of the three outlet valves, the separator pressure, and the liquid level are output by the simulator. The simulation results of pressure, oil level, water level, and valve openings are compared with the operation data to verify the accuracy of this simulator.
Table 3. Given Data in the Simulation.
| pressure | oil level | water level | |
|---|---|---|---|
| setpoint | 1150 kPa | 1 m | 1.547 m |
| KP | 8 pa–1 | 2 m–1 | 10 m–1 |
| KI (s) | 4 | 50 | 25 |
According to Figures 6–8, the AADs for the separator pressure, water level, oil level, and water volume fraction in oil in the separator are 0.15, 0.0022, 0.043, and 26.55%, respectively. The AADs for valve openings for the oil phase and water phase are 5.55 and 1.142%, respectively. According to the simulation results shown in Figure 6, the oil level and water level can be controlled at the setpoint, but the separator pressure is higher than the setpoint of 1150 kPa, both from the field data and the simulation results. This is because the flow capacity of the gas phase outlet valve is insufficient. Even with the gas valve fully open, the separator pressure is still higher than the setpoint, both from the field data and the simulation results.
Figure 6.

Comparison of the simulation results of pressure, oil level, and water level with the operation data of the separator.
Figure 8.

Comparison of the simulation results of valve opening with the operation data of the separator.
Figure 7.

Comparison of the simulation results of water volume fraction in oil with the operation data of the separator.
4. Results and Discussion
4.1. Dynamic Behavior of the Separator Filling Process
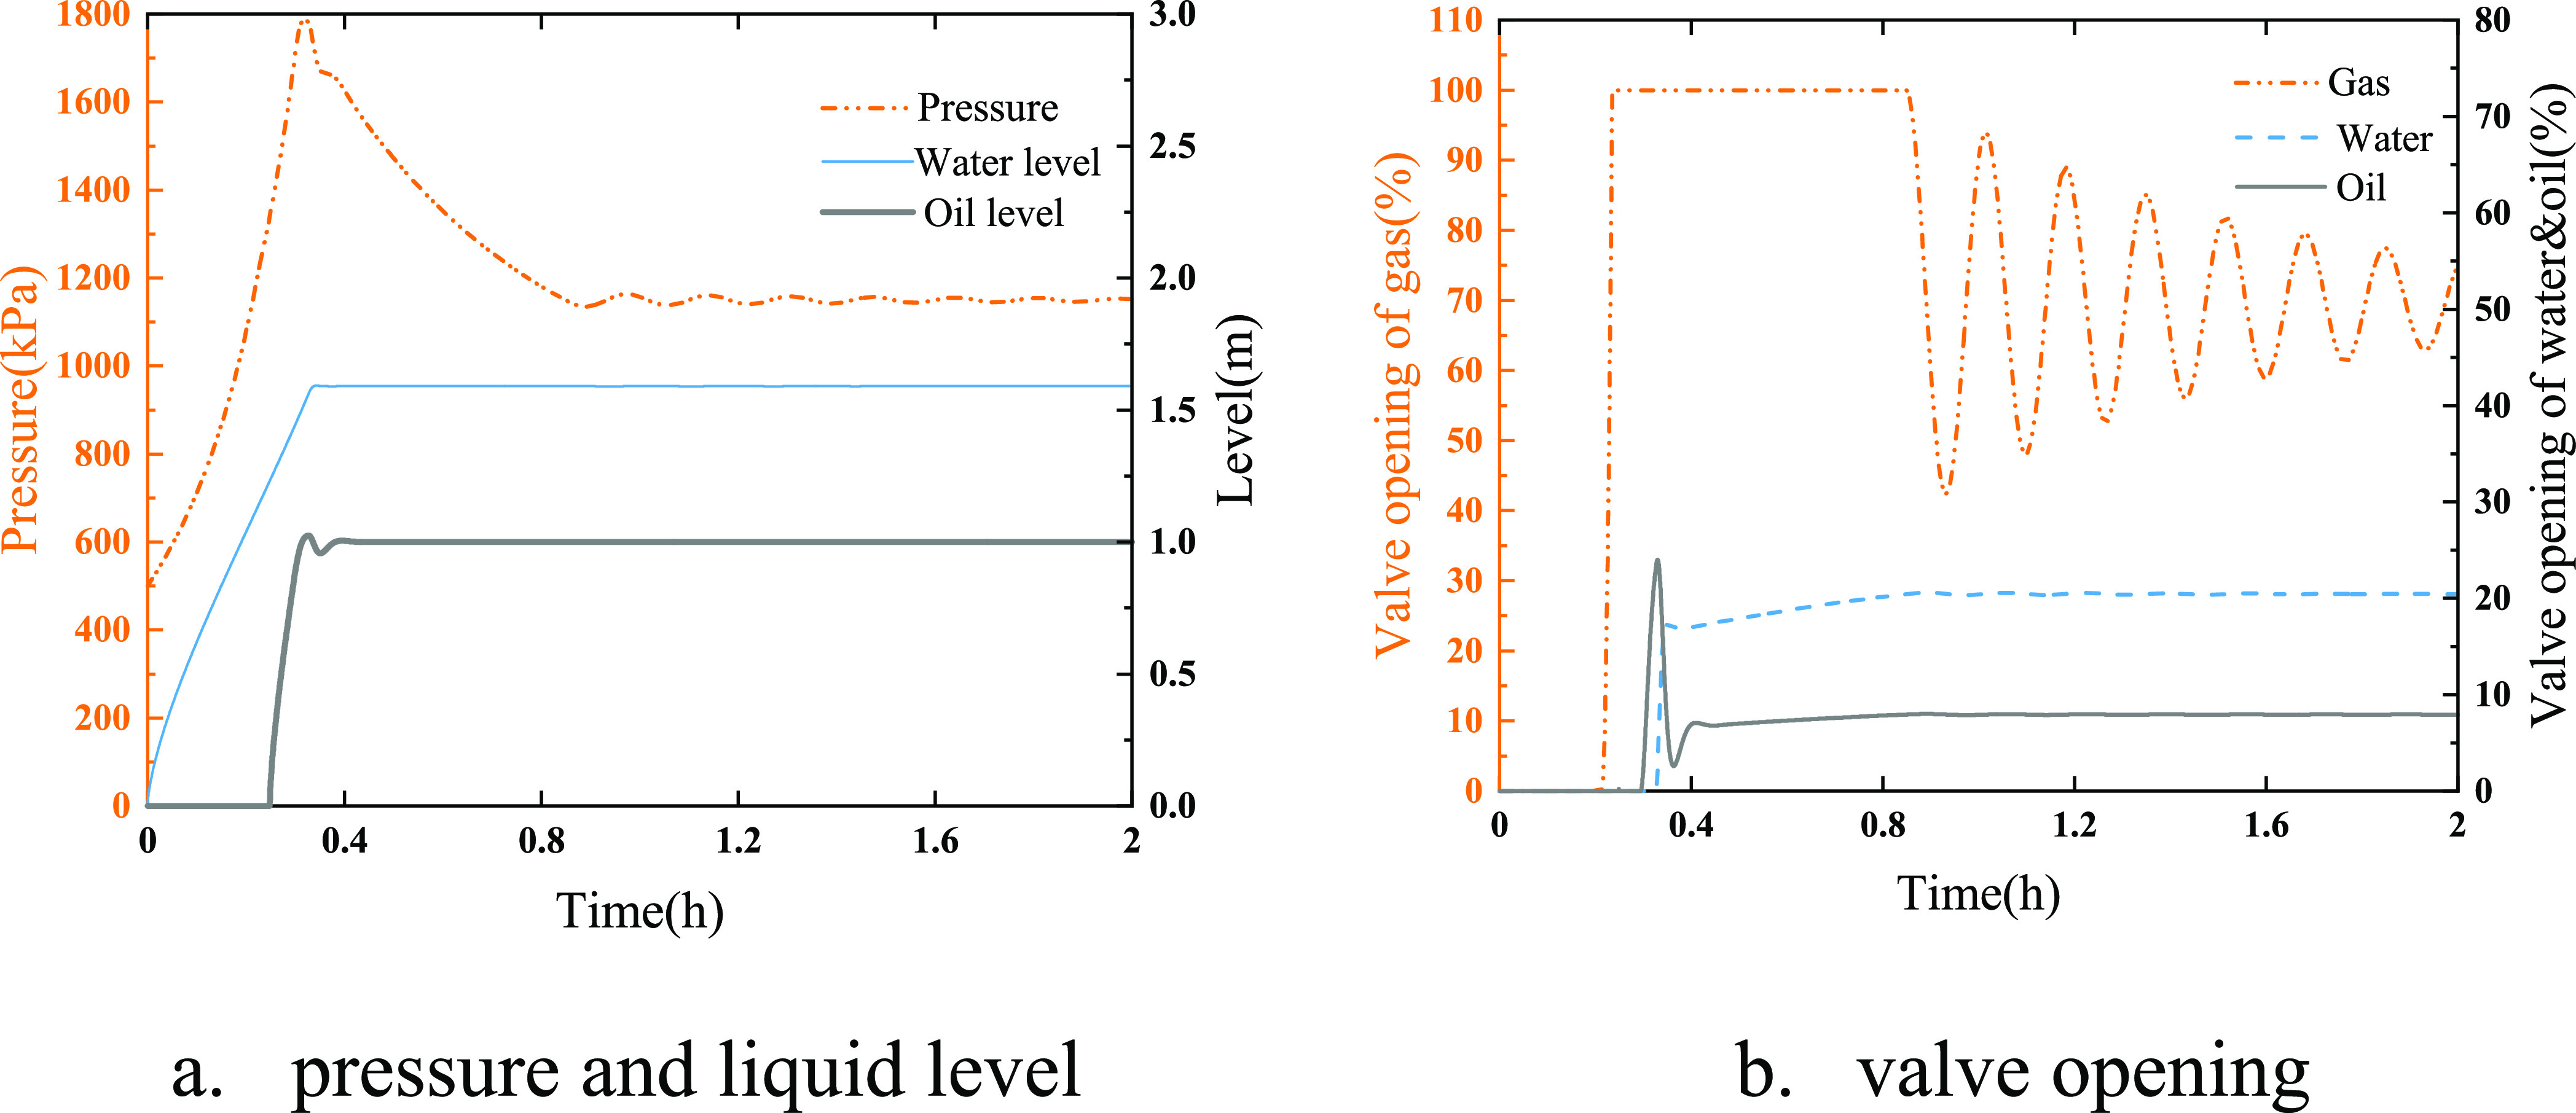
In this part, the filling dynamics of a separator with an initial pressure of 500 kPa is simulated with the verified simulator. The setpoints of pressure, oil level, and water level are 1150 kPa, 1 m, and 1.59 m, respectively. The boundary conditions and PI control parameters are same with the parameters shown in Section 3.
As shown in Figure 9, the separator pressure increases rapidly from 500 kPa when the separator begins to be filled with the produced fluid. Initially, since the liquid level and pressure are lower than the setpoint, the three outlet valves are completely closed, resulting in a rapid increase in the pressure and liquid level. Subsequently, the pressure continues to rise, and when the pressure is approaching the setpoint, the gas valve opening rapidly increases to 100% under the action of the PI controller.
Figure 9.
Parameter changes during the separator filling process.
Similarly, as the liquid level approaches the set point, the valve opening also increases. Water level and oil level reach the setpoint successively and remain stable. After the oil level and water level reached a stable level, the gas phase space in the separator remained constant. Then, the pressure decreased in fluctuation, and at 1 h, it gradually became stable.
4.2. Dynamic Behavior due to the Setpoint Change
In this section, based on the stable operation status in Section 4.1, the setpoints of pressure, oil level, and water level are modified, respectively, to study the dynamic behavior of the separator.
4.2.1. Change of the Pressure Setpoint
Figure 10 shows the evolution of the separator operating parameters over time after the pressure setpoint is increased from 1150 to 1350 kPa. After the pressure setpoint is raised due to the separator operating pressure being lower than the setpoint under the action of the PI controller, the gas outlet valve opening is quickly adjusted from 70% to completely closed, resulting in an increase in the separator pressure. Subsequently, the separator pressure gradually stabilized at 1350 kPa. As the pressure in the separator increases, the pressure before the liquid phase outlet valve increases. In order to ensure the stability of the oil level and water level, the opening of the oil valve and water valve is slightly reduced.
Figure 10.

Parameter changes due to pressure setpoint change from 1150 to 1350 kPa.
4.2.2. Change of the Oil Level Setpoint
Figure 11 shows the evolution of the separator operating parameters over time after the oil level is increased from 1 to 1.2 m. After the oil level setpoint is increased, due to the oil level being lower than the setpoint, the oil valve is closed by the controller, resulting in the enhanced oil level. When the liquid level approaches the setpoint, the opening of the oil valve gradually increases, and finally the oil level is stabilized at the setpoint by the controller.
Figure 11.

Parameter changes due to oil level setpoint change from 1 to 1.2 m.
In addition, an increase in the oil level directly leads to a decrease in the gas space, which in turn leads to an increase in the separator pressure. Since the separator pressure is higher than the setpoint, the gas valve is opened by the controller, and finally the gas pressure is stabilized at the setpoint. During the dynamic adjustment process, the water level does not fluctuate significantly. However, in the initial stage, due to the increase of the separator pressure, the water flow rate out of the separator through the water valve increases, which in turn leads to the decrease of the water level in the separator. Under the action of the regulator, the water level is finally stabilized at the setpoint.
4.2.3. Change of the Water Level Setpoint
Figure 12 shows the evolution of the separator operating parameters over time after the water level is changed from 1.547 to 0.9 m. After the setpoint of the water level is lowered, the water level on the left side of the weir plate is much higher than the setpoint; thus, the water valve is fully opened by the controller. As a result, the water level drops rapidly, causing the liquid level on the left side of the weir to drop rapidly to 1.036 m, which is much lower than the height of the weir (1.6 m).
Figure 12.

Parameter changes due to water level setpoint change from 1.547 to 0.9 m.
The oil flow to the right side of the weir plate decreases to zero, and the oil level at the right side of the weir decreases. In addition, the drop in liquid level leaves vast free space for the gas, which in turn leads to a rapid drop in pressure in the separator. To compensate for this change, the gas valve and oil valve are closed by the controller, and then the liquid level on the left side of the weir plate and the liquid level on the right side of the weir plate gradually rise. Finally, every parameter is stabilized at the setpoint by the controllers.
4.3. Influencing Factors of Oil–Water Separation Efficiency
Oil–water separation is the main function of the separator, and efficient oil–water separation performance is crucial to the operation of the separator.34 The core principle of the gravity separator is that the dispersed phase, which has a density difference with the continuous phase, escapes by floating or sinking within a certain period.35 The longer the residence time of the fluid in the separator, the higher the separation efficiency, and the residence time is affected by parameters such as the flow rate and liquid level setpoint.36,37 The effects of operating conditions such as inlet flow, water setpoint, and weir height on the separation efficiency are discussed in this section. Unless otherwise specified, the setting of case is the same as that in Section 3.2.
The effect of inlet flow on separation efficiency is shown in Figure 13. The flow rates are set from 400 to 2000 kmol/h, respectively, and other setting conditions are the same as in Section 3.2. It can be seen from Figure 13 that as the flow rate increases, the oil–water separation efficiency in the separator becomes lower. With the increase in the flow rate, the residence time of the fluid in the separator gradually decreases and the lateral velocity of the fluid increases. The dispersed phase does not have enough time to escape from the continuous phase. It can be found that with the increase of the flow rate, the slope of the water volume fraction in oil will decrease. Assuming that the flow rate is infinite, it means that the lateral velocity of the fluid is infinite, and all the dispersed phase water droplets have no chance to settle, resulting in the water volume fraction in oil being infinitely close to the inlet volume fraction.
Figure 13.

Variation of the water volume fraction in the oil outlet and oil volume fraction in water outlet with the inlet flowrate.
The effect of water level on separation efficiency is shown in Figure 14. The water level setpoint is set from 0.7 to 1.58 m, respectively, and other setting conditions are the same as in Section 3.2. It can be seen from Figure 14 that as the water level increases, the oil volume fraction in the water outlet decreases while the water volume fraction in the oil outlet increases. When the water level rises, the cross-sectional area of the water phase on the left side of the weir increases; thus, the flow velocity of the water phase decreases, and the residence time increases. In addition, due to the constant height of the weir, the increase in the volume of the water phase compels the volume of the oil phase to decrease, resulting in an increase in the flow velocity of the oil phase in the separator and a decrease in the residence time. The increased water level results in a reduced oil volume fraction in water outlets and an increased water volume fraction in oil outlets.
Figure 14.

Variation of the water volume fraction in the oil outlet and the oil volume fraction in the water outlet with the water level.
The effect of weir height on separation efficiency is shown in Figure 15. The water level setpoint is set as 0.55 m, the oil level setpoint is set as 0.5 m, the weir height is set from 0.59 to 2 m, respectively. The ratio of the water level to weir height is between 93.2 and 27.5%. Other setting conditions are the same as in Section 3.2. It can be seen from Figure 15 that with the increase of the weir height and the unchanged water level, the oil phase space on the left side of the weir plate increases and the residence time of the oil phase increases, which directly leads to a significant decrease in the water volume fraction in oil outlets. In addition, the increase of separation efficiency in the oil phase also leads to more free water entering the bulk water phase, resulting in a slight decrease in the oil volume fraction in the water phase.
Figure 15.

Variation of the water volume fraction in the oil outlet and the oil volume fraction in the water outlet with the weir height.
5. Conclusions
In this work, a dynamic simulator for three-phase gravity separators in oil production facilities is proposed. In this simulator, the mass conservation equation is established to calculate the pressure, water level, and oil level in the separator. The mass balance equation of the dispersed phase is established to calculate the oil–water separation efficiency. The PI controllers are applied to control the water level, oil level, and pressure in the separator by setting the opening of the three outlet valves of oil, gas, and water. The simulator is validated using field data with the given valve opening and given PI controller parameters, respectively. The verification results show that the accuracy of this simulator is within an acceptable range.
Subsequently, the verified simulator is applied to study the dynamic behavior of the separator filling process, and the effect of pressure, oil level, and water level setpoint changes on the separator operating status. A detailed analysis of the changes in the liquid level, pressure, and the opening of three outlet valves is presented. The liquid level, pressure, and valve opening in the separator affect each other, and the change of any parameter will cause fluctuations in other parameters. Under the action of the PI controller, the three parameters of the water level, oil level, and pressure are stabilized in turn. Then, the effects of operating conditions such as inlet flow, water setpoint, and weir height on the separation efficiency are discussed. The increase of the inlet flow reduces the separation efficiency, while the increase of the weir height enhances the separation efficiency. The increase of the water level increases the water volume fraction in oil while reducing the oil volume fraction in water.
This simulator can be applied for the design of oil, gas, and water three-phase separation processes. In addition, through this simulator, the parameters that are difficult to be measured by instruments during the operation of the separator can be calculated, providing technical support for the construction of the digital twin of the separator.
Acknowledgments
This work was supported by the National Natural Science Foundation of China (grant nos 52104069, U20B6005, and 51874323); the National Key Research and Development Program of China (grant no: 2022YFC2806203); the China Postdoctoral Science Foundation (grant no: 2022M713460); and the Science Foundation of China University of Petroleum, Beijing (grant no: 2462020YXZZ045), all of which are gratefully acknowledged.
Glossary
Nomenclature
- Aleft(i,j)
area of the left interface of the control volume (i,j) (m2)
- Abottom(i,j)
area of the bottom interface of the control volume (i,j) (m2)
- Aleft,o
cross-sectional area of the oil layer (m2)
- Aleft,w
cross-sectional area of the water layer (m2)
- Cv
effective flow coefficient
- D
diameter of the separator cylinder (m)
- d
diameter of droplets (m)
- eol(t)
error in oil level at time t (m)
- eP(t)
error in pressure at time t (kPa)
- ewl(t)
error in water level at time t (m)
- Fk
provided by the valve manufacturer
- Fp
pipe geometry parameter
- fol(t)
oil level controller output value at time t
- fP(t)
pressure controller output value at time t
- fwl(t)
water level controller output value at time t
- G
total mass flowrate through the valve (kg/h)
- g
gravitational acceleration, 9.8 m/s2
- H
liquid level (m)
- Hg
mass fraction of the gas phase at the valve inlet
- hi
surface width of the ellipse head (m)
- L
length of the left part of the weir plate in the separator (m)
- Mgt
gas molar mass at time t (kg/mol)
- Nk(i,j)
number of droplets of the kth particle in the control volume (i,j)
- nt
molar amount of gas in the separator at time t (mol)
- Pt+1
pressure in the separator (Pa)
- Pinlet
pressure at the inlet of the valve (kPa)
- Poutlet
pressure at the outlet of the valve (kPa)
- Qin,gt
inlet flowrate of gas at time t (m3/s)
- Qin,ot
inlet flowrate of oil at time t (m3/s)
- Qin,wt
inlet flowrate of water at time t (m3/s)
- Qout,gt
outlet flowrate of gas at time t (m3/s)
- Qout,ot
outlet flowrate of oil at time t (m3/s)
- Qout,wt
outlet flowrate of water at time t (m3/s)
- R
gas constant, 8.314 J/(mol·K)
- Tt+1
temperature at time t+1 (K)
- Δt
time step (s)
- Vlt+1
volume of liquid on the left side of the weir at time t+1 (m3)
- Vot+1
volume of oil on the left side of the weir at time t+1 (m3)
- Vwt+1
volume of water on the left side of the weir at time t+1 (m3)
- V(i,j)
volume of the control volume (i,j) (m3)
- ΔVot
difference of oil volume at time t (m3)
- ΔVwt
difference of water volume at time t (m3)
- vk,xt
velocity of the kth particles in the x direction at time t (m/s)
- vy
velocity of the dispersed phases in the vertical direction (m/s)
- vk,yt
velocity of the kth particles in the x direction at time t (m/s)
- vo,yt
velocity of the oil particles in the x direction at time t (m/s)
- vw,yt
velocity of the water particles in the x direction at time t (m/s)
- Xt
provided by the valve manufacturer
- Y
gas expansion coefficient
- z
compression factor
Glossary
Greek symbols
- α
adjusted vapor mass fraction
- σk(i,j)(t)
droplet number density of k particles in the control volumes i and j at time t (1/m3)
- Δσk,x(i,j)(t)
difference of the droplet number density of kth particles in the control volume (i, j) at time t in the x direction (1/m3)
- Δσk,y(i,j)(t)
difference of the droplet number density of kth particles in the control volume (i, j) at time t in the y direction (1/m3)
- μ
continuous phase viscosity (Pa·s)
- ρ
density (kg/m3)
- ρg
density of the gas (kg/m3)
- ρl
density of the liquid (kg/m3)
- Δρ
density difference between droplets and the continuous phase (kg/m3)
Glossary
Abbreviations
- HSE
health, safety, and environment
- PI
proportional integral
- API
American Petroleum Institute
- CFD
computational fluid dynamics
- AAD
average absolute deviation
- NBP
normal boiling point
The authors declare no competing financial interest.
References
- He L.; Wen K.; Gong J.; Wu C. A multi-model ensemble digital twin solution for real-time unsteady flow state estimation of a pumping station. ISA Trans. 2022, 126, 242. 10.1016/j.isatra.2021.08.021. [DOI] [PubMed] [Google Scholar]
- Kuang L.; Liu H.; Ren Y.; Luo K.; Shi M.; Su J.; Li X. Application and development trend of artificial intelligence in petroleum exploration and development. Petrol. Explor. Dev. 2021, 48, 1–14. 10.1016/S1876-3804(21)60001-0. [DOI] [Google Scholar]
- Sircar A.; Yadav K.; Rayavarapu K.; Bist N.; Oza H. Application of machine learning and artificial intelligence in oil and gas industry. Pet. Res. 2021, 6, 379–391. 10.1016/j.ptlrs.2021.05.009. [DOI] [Google Scholar]
- Bimastianto P.; Khambete S.; AlSaadi H.; Couzigou E.; Al-Marzouqi A.; Chevallier B.; Qadir A.; Pausin W.; Vallet L.. Digital Twin Implementation on Current Development Drilling, Benefits and Way Forward. Abu Dhabi International Petroleum Exhibition & Conference, 2020; D041S111R001, Vol. Day 4 Thu, November 12, 2020.
- Libing G.; Lyu Z.; Suo H.; Liu X. Market analysis and development trend of petrochemical process simulation software. Chem. Ind. Eng. Prog. 2021, 40, 1–14. 10.16085/j.issn.1000-6613.2021-0471. [DOI] [Google Scholar]
- Luo X. M.; He L. M.; Liu X. Y.; Lü Y. L. Influence of separator control on the characteristics of severe slugging flow. Petrol. Sci. 2014, 11, 300–307. 10.1007/s12182-014-0344-3. [DOI] [Google Scholar]
- Vileiniskis M.; Remenyte-Prescott R.; Rama D.; Andrews J. Fault detection and diagnostics of a three-phase separator. J. Loss Prev. Process. Ind. 2016, 41, 215–230. 10.1016/j.jlp.2016.03.021. [DOI] [Google Scholar]
- Backi C. J.; Grimes B. A.; Skogestad S. A Control- and Estimation-Oriented Gravity Separator Model for Oil and Gas Applications Based upon First-Principles. Ind. Eng. Chem. Res. 2018, 57, 7201–7217. 10.1021/acs.iecr.7b04297. [DOI] [Google Scholar]
- Stewart M.Three-Phase Oil and Water Separators. In Gas-Liquid And Liquid-Liquid Separators; Stewart M., Arnold K., Eds.; Gulf Professional Publishing, 2008; Chapter 4, pp 131–174. [Google Scholar]
- Arvoh B. K.; Skeie N.-O.; Halstensen M. Estimation of gas/liquid and oil/water interface levels in an oil/water/gas separator based on pressure measurements and regression modelling. Sep. Purif. Technol. 2013, 107, 204–210. 10.1016/j.seppur.2013.01.045. [DOI] [Google Scholar]
- Hjertaker B. T.; Johansen G.; Jackson P. Level measurement and control strategies for subsea separators. J. Electron. Imag. 2001, 10, 679–689. 10.1117/1.1379771. [DOI] [Google Scholar]
- Yu W.; Patros P.; Young B.; Klinac E.; Walmsley T. G. Energy digital twin technology for industrial energy management: Classification, challenges and future. Renew. Sustain. Energy Rev. 2022, 161, 112407. 10.1016/j.rser.2022.112407. [DOI] [Google Scholar]
- Vijayan V.; Vivekanandan M.; Venkatesh R.; Rajaguru K.; Godwin Antony A. G. CFD modeling and analysis of a two-phase vapor separator. J. Therm. Anal. Calorim. 2021, 145, 2719–2726. 10.1007/s10973-020-09825-2. [DOI] [Google Scholar]
- Xue X. H.; Sun G. G.; Wan G. J.; Shi M. X. Numerical simulation of particle concentration in a gas cyclone separator. Petrol. Sci. 2007, 4, 76–83. 10.1007/s12182-007-0013-x. [DOI] [Google Scholar]
- Samanta A.; Modak N. Influence of operating parameters in particle spreading, separation, and capturing in a hybrid free flow magnetophoretic bio-separator. Phys. Fluids 2020, 32, 112012. 10.1063/5.0024850. [DOI] [Google Scholar]
- Mostafaiyan M.; Saeb M. R.; Alorizi A. E.; Farahani M. Application of evolutionary computational approach in design of horizontal three-phase gravity separators. J. Petrol. Sci. Eng. 2014, 119, 28–35. 10.1016/j.petrol.2014.04.003. [DOI] [Google Scholar]
- He X.; Liu Q.; Zhang H.; Kui M.-Q.; Tan X.-H.; Li X.-P. Numerical investigation of the performance of moisture separators based on two-way coupling model by Lagrangian-Eulerian methodology. Ann. Nucl. Energy 2019, 124, 407–417. 10.1016/j.anucene.2018.10.020. [DOI] [Google Scholar]
- Sayda A.; Taylor J.. Modeling and Control of Three-Phase Gravilty Separators in Oil Production Facilities. American Control Conference, 2007, New York City, USA, July 11–13, 2007, 2007.
- Haekal M.Control-oriented modeling and simulation of a three-phase gravity separator and its level loop process dynamics identification. 2014.
- Das T.; Heggheim S. J.; Dudek M.; Verheyleweghen A.; Jäschke J. Optimal Operation of a Subsea Separation System Including a Coalescence Based Gravity Separator Model and a Produced Water Treatment Section. Ind. Eng. Chem. Res. 2019, 58, 4168–4185. 10.1021/acs.iecr.8b04923. [DOI] [Google Scholar]
- Mamudu O. A.; Igwe G. J.; Okonkwo E.. Process Design Evaluation of an Optimum Modular Topping Refinery for Nigeria Crude Oil Using HYSYS Software. SPE Nigeria Annual International Conference and Exhibition, 2016; SPE-184342-MS, Vol. All Days.
- Ali Z.; Anuar A.; Grippo N.; Ramli N. E.; Rahim N.. Unifying of Steady State and Transient Simulations Methodologies for Increasing Oil Production of Integrated Network of Wells, Pipeline and Topside Processing Equipment. Abu Dhabi International Petroleum Exhibition & Conference, 2021; D022S184R002, Vol. Day 2 Tue, Nov 16, 2021.
- Becquin G.; Castane Selga R.; Abrol S.; Busboom A.; Doder D.; Jain A.; Glomsaker T.; Hyllseth M.; Ruigrok C.. Subsea Multiphase Boosting Station System and Controls Optimization. 17th International Conference on Multiphase Production Technology, 2015; BHR-2015-J3, Vol. All Days.
- Hernandez-Martinez J. L.; Martinez-Ortiz V.. A Method To Size Gas-Liquid Horizontal Separators Handling Nonstable Multiphase Streams. SPE Latin America and Caribbean Petroleum Engineering Conference, 2014.
- Peng D.-Y.; Robinson D. B. A New Two-Constant Equation of State. Ind. Eng. Chem. Fundam. 1976, 15, 59–64. 10.1021/i160057a011. [DOI] [Google Scholar]
- America, I. S. o flow equations for sizing control valves; ISA-75.01.01-2007(IEC 60534-2Mod); United States of America, 2007.
- Grace A.; Frawley P. Experimental parametric equation for the prediction of valve coefficient (Cv) for choke valve trims. Int. J. Pres. Ves. Pip. 2011, 88, 109–118. 10.1016/j.ijpvp.2010.11.002. [DOI] [Google Scholar]
- Shi G.; Song S.; Shi B.; Gong J.; Chen D. A new transient model for hydrate slurry flow in oil-dominated flowlines. J. Petrol. Sci. Eng. 2021, 196, 108003. 10.1016/j.petrol.2020.108003. [DOI] [Google Scholar]
- Pacek A. W. Chem. Eng. Res. Des. 2008, 86, 535–536. 10.1016/j.cherd.2008.01.005. [DOI] [Google Scholar]
- Guo H.-p.; Zou Z.-j.; Liu Y.; Chen J.. RANS Simulation of Self-Propulsion Ship Model Test Coupled With PI Controller. The 27th International Ocean and Polar Engineering Conference, 2017.
- Zhang M.; Wu J. P.; Lin C.; Xu K.. Rethink the tradeoff between proportional controller and PI controller. 7th IEEE International Symposium on Computers and Communications, Taormina, Italy, 2002, 2002; pp 57–62.
- Malavasi S.; Somaschi M. C. Discussion on ″Experimental parametric equation for the prediction of valve coefficient (Cv) for choke valve trims″ by Andrew Grace and Patrick Frawley, International Journal of Pressure Vessels and Piping 88 (2011) 109-118. Int. J. Pres. Ves. Pip. 2015, 125, 1–2. 10.1016/j.ijpvp.2014.08.007. [DOI] [Google Scholar]
- Grace A.; Frawley P. Experimental parametric equation for the prediction of valve coefficient (Cv) for choke valve trims. Int. J. Pres. Ves. Pip. 2011, 88, 109–118. 10.1016/j.ijpvp.2010.11.002. [DOI] [Google Scholar]
- Ahmed T.; Russell P. A.; Makwashi N.; Hamad F.; Gooneratne S. Design and capital cost optimisation of three-phase gravity separators. Heliyon 2020, 6, e04065 10.1016/j.heliyon.2020.e04065. [DOI] [PMC free article] [PubMed] [Google Scholar]
- Skjefstad H. S.; Stanko M. Experimental performance evaluation and design optimization of a horizontal multi-pipe separator for subsea oil-water bulk separation. J. Petrol. Sci. Eng. 2019, 176, 203–219. 10.1016/j.petrol.2019.01.027. [DOI] [Google Scholar]
- Liu S.; Zhang J.; Wang L.-S.; Xu J.-Y. Separation mechanism and influential factor study on vane-type-associated petroleum gas separator. Sep. Purif. Technol. 2020, 250, 117274. 10.1016/j.seppur.2020.117274. [DOI] [Google Scholar]
- Behin J.; Aghajari M. Influence of water level on oil-water separation by residence time distribution curves investigations. Sep. Purif. Technol. 2008, 64, 48–55. 10.1016/j.seppur.2008.08.009. [DOI] [Google Scholar]