Abstract
Objective:
The Office of Radiological Security, U.S. Department of Energy’s National Nuclear Security Administration, is implementing a radiological risk reduction program which seeks to minimize or eliminate the use of high activity radiological sources, including 137Cs, by replacing them with non-radioisotopic technologies, such as x-ray irradiators. The main goal of this paper is to evaluate the equivalence of the dose delivered by gamma- and x-ray irradiators in mice using experimental measurements and Monte Carlo simulations. We also propose a novel biophantom as an in-situ dose calibration method.
Approach:
We irradiated mouse carcasses and 3D-printed mouse biophantoms in a 137Cs irradiator (Mark I-68) and an x-ray irradiator (X-Rad320) at three voltages (160kVp, 225kVp and 320kVp) and measured the delivered radiation dose. A Geant4-based Monte Carlo model was developed and validated to provide a comprehensive picture of gamma- and x-ray irradiation in mice.
Results:
Our Monte Carlo model predicts a uniform dose delivered in soft-tissue for all the explored irradiation programs and in agreement with the absolute dose measurements. Our Monte Carlo model shows an energy-dependent difference between dose in bone and in soft-tissue that decreases as photon energy increases. Dose rate depends on irradiator and photon energy. We observed a deviation of the measured dose from the target value of up to −9% for the Mark I-68, and up to 35% for the X-Rad320. The dose measured in the 3D-printed phantoms are equivalent to that in the carcasses within 6% uncertainty.
Significance:
Our results suggest that 320kVp irradiation is a good candidate to substitute 137Cs irradiation barring a few caveats. There is a significant difference between measured and targeted doses for x-ray irradiation that suggests a strong need for in-situ calibration, which can be achieved with 3D-printed mouse biophantoms. A dose correction is necessary for bone doses, which can be provided by a Monte Carlo calculation. Finally, the biological implications of the differences in dose rates and dose per photon for the different irradiation methods should be carefully assessed for each small-animal irradiation experiment.
Keywords: dosimetry, irradiation, x-rays, cs-137
1. Introduction
The Office of Radiological Security, U.S. Department of Energy’s National Nuclear Security Administration, (ORS/NNSA), is implementing a radiological risk reduction program which seeks to minimize or eliminate the use of high activity radiological sources, including 137Cs, by replacing them with non-radioisotopic technologies, such as x-ray irradiators [1]. 137Cs has been historically used to study the biological effect of radiation in humans using models in mice [2]. However, 137Cs irradiators use an extremely high activity 137Cs source in a lead-shielded cavity, and given the high risk that high activity sources imply (safety, terrorism, etc.) and the strict protocols required for their deployment, utilization, and control, the scientific community is turning to safer and easier-to-use x-ray irradiators.
An inherent problem that arises with this technological switch is that gamma- and x-ray irradiation present very different physical properties which might affect dose delivery. Several studies have attempted to compare the biological effects between gamma-rays from 137Cs and x-rays in different mice models, mainly for bone marrow [2–7]. Although x-ray irradiation provided similar effects to 137Cs irradiation in some cases, important differences in physiologic responses were observed.
A fundamental difference between 137Cs gamma-rays (662keV) and medium-energy x-rays (up to 320 kVp) produced by commercial irradiators is that their higher energy implies a higher penetration and a larger range for secondary ionizing radiation (electrons). In addition, typical x-ray generators produce polyenergetic photon spectra, which have substantial lower-energy components, unlike the monoenergetic gamma-ray source. Other differences in the dose distribution may arise because production of x-rays in irradiators is typically more complex than production of 137Cs gamma-rays, which yields several potential sources of systematic uncertainties (absolute number of produced photons, energy distribution, angular distribution, etc.). These variations in the physical properties of photons at different energies and the differences in technology may result in different delivered dose rates or dose per photon.
While dose calibration protocols are well-defined in the clinical setting [8], there is no legal requirement for a protocol to be followed in pre-clinical experiments [9]. As a result, dose differences reaching 42% across institutions have been observed [10]. The reference protocol for energies up to 300kV [11] is based on in–air measurements of the entrance surface dose of a water phantom and does not take into account the anatomical complexity of the subject, thus, underestimating the dose delivered [12]. Calibration of 137Cs irradiators involves the deployment of ion chambers or arrays of thermoluminiscence dosimeters to determine the isodose lines, which are manually interpolated [13]. Again, this method does not take into account subject anatomy and, additionally, is subject to placement inaccuracies [14].
The purpose of this paper is two-fold: first, we provide a comprehensive comparison study of dose and dose rate in mice by a 137Cs irradiator (the Mark I-68) and an x-ray irradiator (the X-Rad320) based on experimental data and a realistic Monte Carlo simulation; and second, we propose an in-situ dose calibration technique based on 3D-printed phantoms.
For the first goal, we quantify the absolute dose delivered by each irradiator for three different x-ray energies (160kVp, 225kVp, and 320kVp) and 137Cs gamma-rays by measuring the dose in mouse carcasses inserted with alanine dosimeters. This is followed by the implementation of a Monte Carlo (MC) model that calculates the dose and dose rate in a digital mouse phantom for gamma- and x-ray irradiation at the voxel and organ level. The dose distributions in the subject depend on several factors specific to each experiment which can be broadly categorized into photon energy spectrum, beam delivery (irradiator geometry and distribution of radiation), and subject (position and anatomy). To understand each factor’s contribution to the final dose in mice, we also run a simple MC study that calculates dose per photon delivered by beams of varying energies in blocks of uniform materials.
For the second goal, 3D-printed rodent biophantoms (RBPs) inserted with alanine pellets are co-irradiated with mouse carcasses to evaluate their accuracy measuring the dose delivered in mice. Some 3D-printed materials have been identified to have similar x-ray attenuation than organic tissue [15–17] for a range of energies with the purpose of building phantoms for imaging or dosimetry experiments, or to be used as a bolus material in radiotherapy. We manufactured RBPs designed to mimic real mouse tissue and to obtain doses equivalent to soft-tissue doses in mice, similar to [18], which we validated in experiment and simulation.
2. Methods
2.1. Irradiators
2.1.1. 137Cs irradiator (Mark I-68)
The Mark I-68 (JL Shepherd and Associates, San Fernando, CA) (Fig. 1) is a gamma irradiation device used in many institutions primarily for biomedical research, including small-animal studies [13, 19], as well as for blood sterilization to avoid fatal complications during transfusions [20]. It is a self-shielded unit with an interior cavity that contains a rotating turntable, the cylindrical source guide, and an active source cylinder unit that may be translated into the source guide to deliver a radiation dose to the cavity and its contents. The source unit for the model used in this study contains two strong solid cesium chloride (CsCl) sources with 2745Ci total activity measured on March 17, 2009, which corresponds to 2068Ci at the time of this experiment (June 22, 2021).
Figure 1.
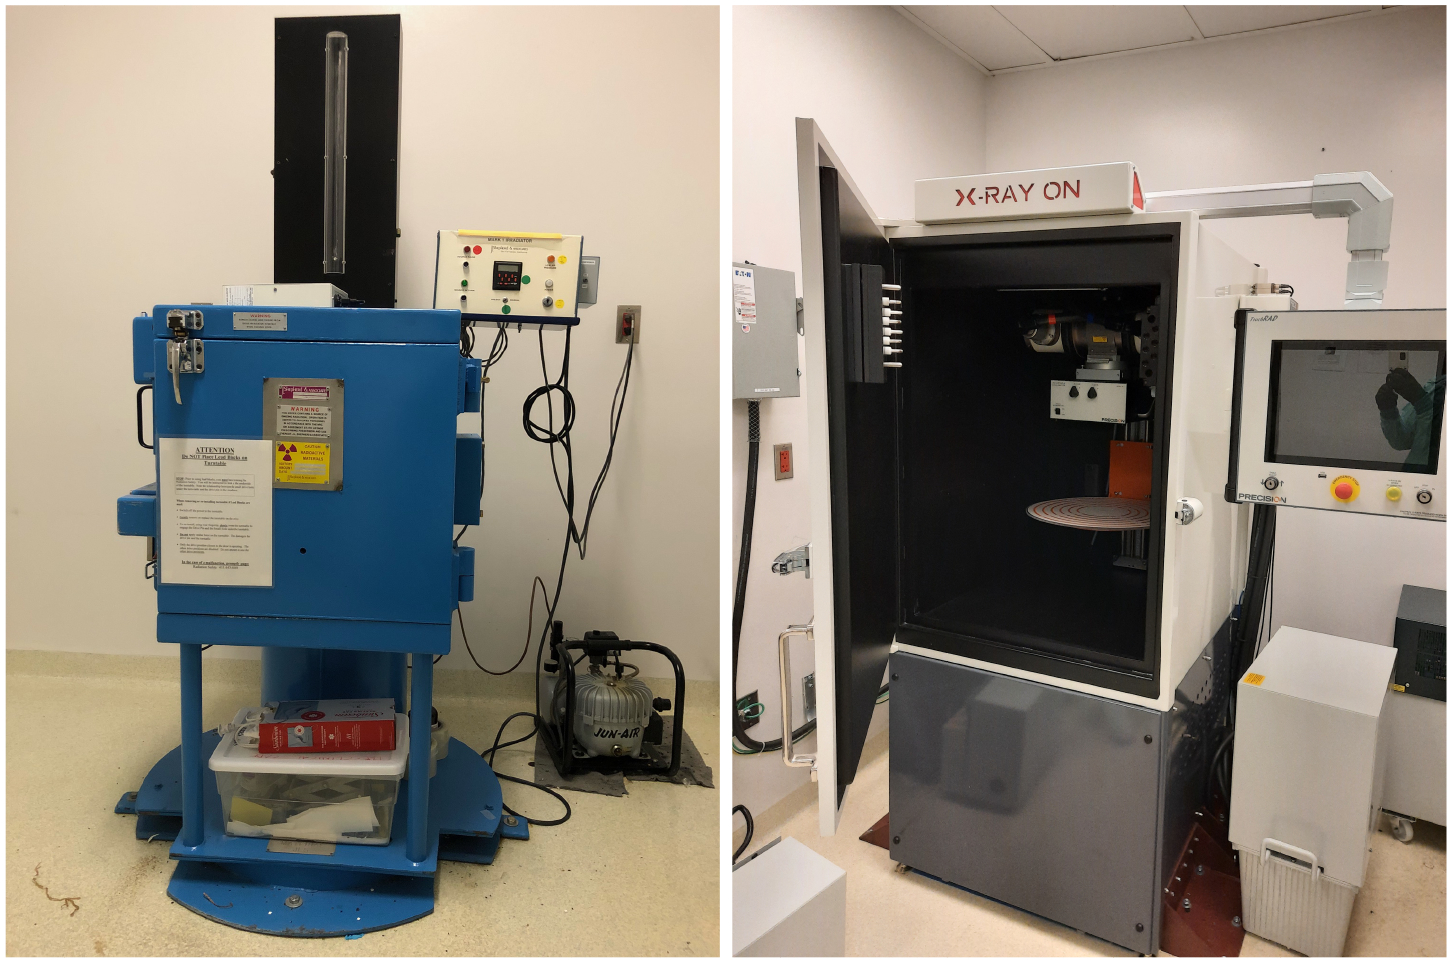
Irradiators used in our experiment: Mark I-68 137Cs irradiator (left) and X-Rad320 x-ray irradiator (right).
2.1.2. X-ray irradiator (X-Rad320)
The X-Rad320 [21] (Fig. 1) is a self-contained x-ray irradiator designed to deliver a precise radiation dosage to specimens from cells to small animals such as mice. It features a 75cm×86cm×102cm cabinet with an x-ray tube that can deliver x-rays up to 320kVp/12.5mA and an adjustable shelf for precise subject location. It includes filters for beam hardening, of which we use a hard F2 thoraeus filter consisting of 1.5mm of Al, 0.25mm of Cu, and 0.75mm of Sn.
2.2. Irradiated subjects
2.2.1. Mouse carcasses
We use them to obtain the soft-tissue dose through a direct measurement by inserting each carcass with three alanine pellets, an internationally recognized dosimetry transfer standard. The pellets are provided by the National Institute of Standards and Technology (NIST) through Far West Technology, and located in the positions shown in Fig. 2: inside the cranium, inside the thoracic cavity, and under the skin in the pelvic area. The pellets were wrapped in parafilm to prevent from dissolving. After irradiation, the alanine pellets are extracted and read out following the procedures in Sec. 2.3.1.
Figure 2.

Position of the alanine pellets (yellow) in mouse phantom. From left to right: head, chest and pelvic surface.
2.2.2. 3D-printed rodent biophantoms
Three types of RBPs (Figs. 3b and 3d) are fabricated using 3D-printing technologies with different materials and structures (Table 1). Three alanine pellets are located inside each RBP in similar positions than for the mouse carcasses (Fig. 2). In this case, the pellets were not wrapped in parafilm, since there was no risk of being dissolved. The pellets were extracted and analyzed to obtain the absorbed dose, following the procedures in Sec. 2.3.1, and compared against the mouse carcass dose.
Figure 3.
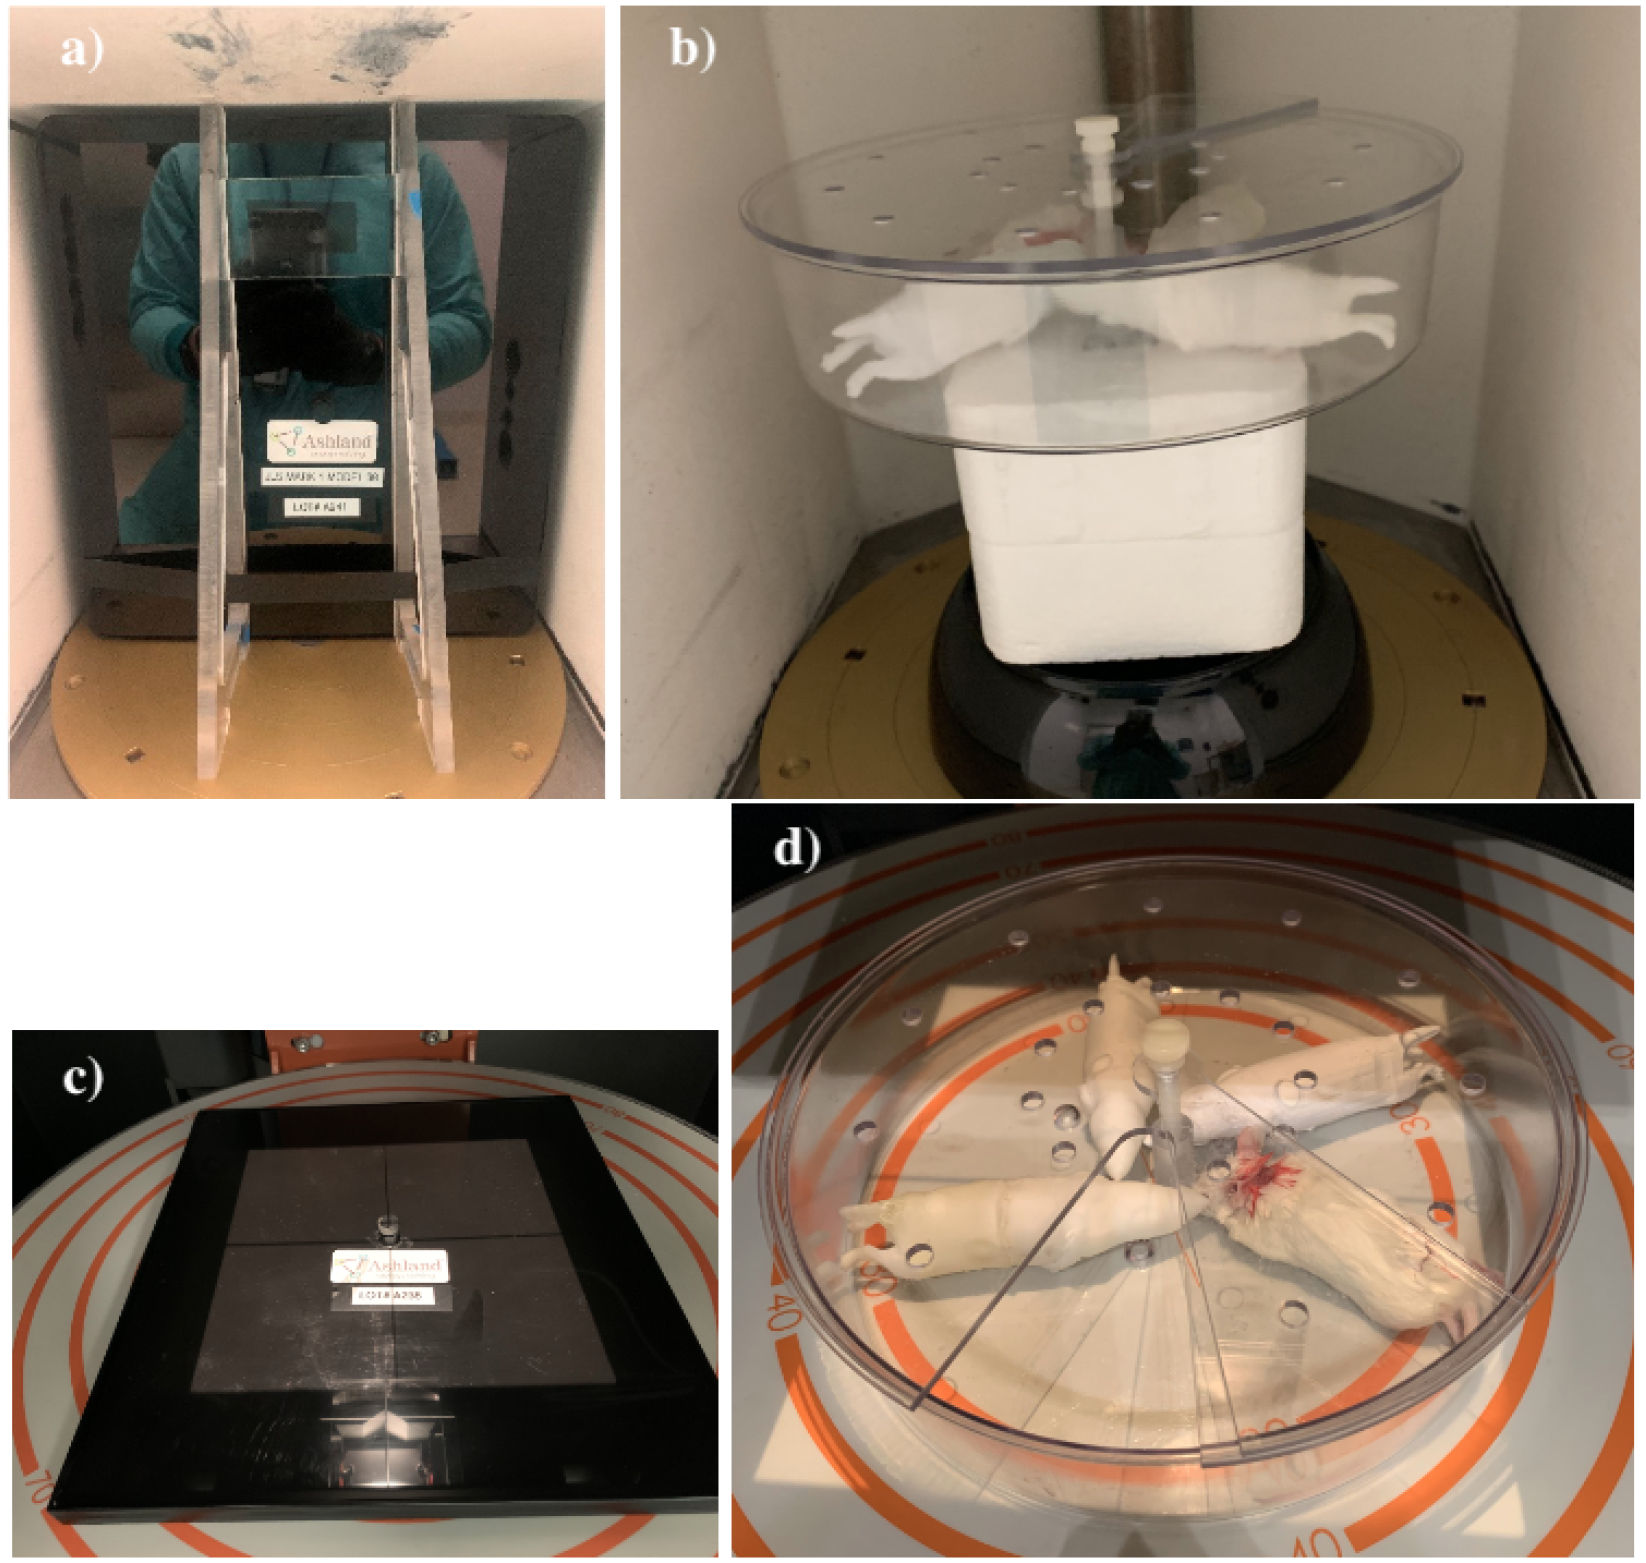
Dose-Map™ and pie cage with mouse carcasses and RBPs as deployed in the Mark I-68 (a and b, respectively) and in the X-Rad320 (c and d, respectively).
Table 1.
Material composition of the 3D-printed RBPs: Polylactic Acid (PLA+), Thermoplastic Elastomer (TPE), and Acrylonitrile Butadiene Styrene (ABS).
| RBP Number | Body | Skeleton | Lungs | Skin | Other organs |
|---|---|---|---|---|---|
| 1 | PLA+ | PLA+ | ABS | ABS | PLA+ |
| 2 | TPE | PLA+ | ABS | ABS | PLA+ |
| 3 | Epoxy resin | PLA+ | ABS | ABS | PLA+ |
2.2.3. Dose-Map™
This is used for dose calibration purposes. It consists of a Gafchromic MD-V3 film [22] encapsulated in a phantom made of high-density polyethylene material of 30.4cm×27.9cm×1cm (referred as the cassette. Figs. 3a and 3c). The Gafchromic MD-V3 film consists of a 10-μm thick active layer containing marker dye, sandwiched in two 125μm layers of matte-polyester substrates. The sizes of the films are 29.4cm × 27.3cm for the Mark I-68 and 19.5cm×19.2cm for the X-Rad320. An alanine pellet sits above the center of the film in a hole that is cut within the top slab of the phantom. The alanine pellets are co-irradiated with the films and used for dose calibration.
2.3. Irradiation procedure and in situ dose measurements
Four different irradiation programs are defined, each intended to deliver an absorbed dose of 25Gy. We tested one Mark I-68 program and three X-Rad320 programs at 160kVp, 225kVp and 320kVp. The parameters for each program (Table 2) are established following the manufacturer’s procedure. Each program is used to irradiate mouse carcasses, RBPs, and Dose-Maps™ as described below.
Table 2.
X-Rad320 and Mark I-68 irradiation program parameters.
| Irradiator | Exposure time [s] | Beam energy or voltage | Activity or current | SSD [cm] | Filter |
|---|---|---|---|---|---|
| Mark I-68 | 862.8 | 662 keV | 2068 Ci | – | – |
| X-Rad320 | 10458 | 160kVp | 25.0mA | 50 | F2 |
| X-Rad320 | 3927 | 225kVp | 17.5 mA | 50 | F2 |
| X-Rad320 | 1944 | 320kVp | 12.5mA | 50 | F2 |
2.3.1. Irradiation of mouse carcasses and rodent biophantoms
A mouse carcass and three RBPs are placed inside a plastic pie cage deployed at the geometric center of the Mark I-68 using a Styrofoam structure (Fig. 3b). Similar pie cages are deployed at the center of the X-Rad320 for each different irradiation program (Fig. 3d) at an SSD of 50cm. One carcass per program (four total) and three RBPs per program (12 total) are irradiated, each with three alanine dosimeters (Fig. 2). The dose delivered to the alanine pellets are measured by NIST in their Electron Paramagnetic Resonance (EPR) facility following their validated procedure [23]. Alanine pellets are deployed in the EPR spectrometer, which has been previously calibrated by irradiating alanine pellets with known doses. The absorbed dose is corrected by the temperature at the time of irradiation, which has been shown to be a non-negligible effect [24]. The change in the alanine response as a function of the photon energy is below 10% between 50keV and 100keV, and practically energy-independent above 100keV, so, in our case, the effect is assumed very small [25] and no energy correction is applied. The final uncertainty on the alanine dose measurement is 1.4% and includes uncertainties in repeatability and reproducibility, pellet mass determination, contamination, and EPR spectrometer fluctuations [23].
2.3.2. Irradiation of Dose-Maps™
In the Mark I-68, a Dose-Map™ is located vertically at the center with its y-axis parallel to the rotation axis (Fig. 3a). In the X-Rad320, a Dose-Map™ cassette is deployed at the center of the shelf with its z-axis aligned with the z-axis of the x-ray chamber and with its sides parallel to the walls of the chamber (Fig. 3c). The distance between the shelf and the x-ray source (SSD) is 50cm. A single Dose-Map™ is irradiated for each listed program (Table 2). After irradiation, the Dose-Maps™ are returned to Ashland™ for calibration at the University of Wisconsin Radiation Calibration Laboratory, an Accredited Dosimetry Calibration Laboratory (ADCL) by the American Association of Physics in Medicine (AAPM), to provide the final dose maps. The final dose distributions are calibrated using the co-irradiated alanine pellet located at the center of the Dose-Map™, so the dose maps are indexed to alanine. The alanine pellets are measured by NIST using the method described in Sec. 2.3.1.
2.4. Monte Carlo model
A MC model is implemented that includes precise geometries of the systems and subjects, and physical models of particle generation and interactions. Irradiators and subjects are simulated in a custom GATE [26] model. GATE is an open-source software tool used in nuclear medicine and medical imaging that provides a user-friendly interface for Geant4 MC simulations [27, 28]. We chose GATE with the aim of enhancing the translatability of these studies to other users’ irradiation experiments because it is a popular open-source tool in nuclear medicine. Furthermore, its Geant4 back-end has been extensively validated for different experiments and it has been previously used for x-ray irradiator simulations [29] and gamma-ray dosimetry [30, 31].
2.4.1. Mark I-68 simulation
Geometry
The Mark I-68 unit is simulated as an internal air cavity inside extensive lead shielding (Fig. 4a). The cavity is a pentagonal prism, with two angled lead walls originating behind the source guide and meeting the rectangular walls at 25.2cm from the doors. The largest internal cavity dimensions are 35cm×31cm×41cm (height, width, depth). Inside the cavity, the active unit consists of two solid CsCl cylinders of 13cm height and 2.54cm diameter, separated by an aluminum spacer of 4.8cm height and 2.54cm diameter. It is surrounded by four layers of 304 stainless steel (304SS [32]), representing two layers welded to hold the sources in place and two layers comprising the source guide. The thicknesses of these layers are, from inner to outer, 1.2mm, 0.9mm, 1.2mm, and 0.6mm, for a total of 3.9mm of 304SS between the active sources and an irradiated object. The central axis of the active unit is 23cm from the center of the copper turntable, which is not modelled since its effect in the delivered dose is assumed small. Interactions from the plastic stands and silver base of the cavity are neglected. The material properties as simulated in GATE are in Table A1.
Figure 4.
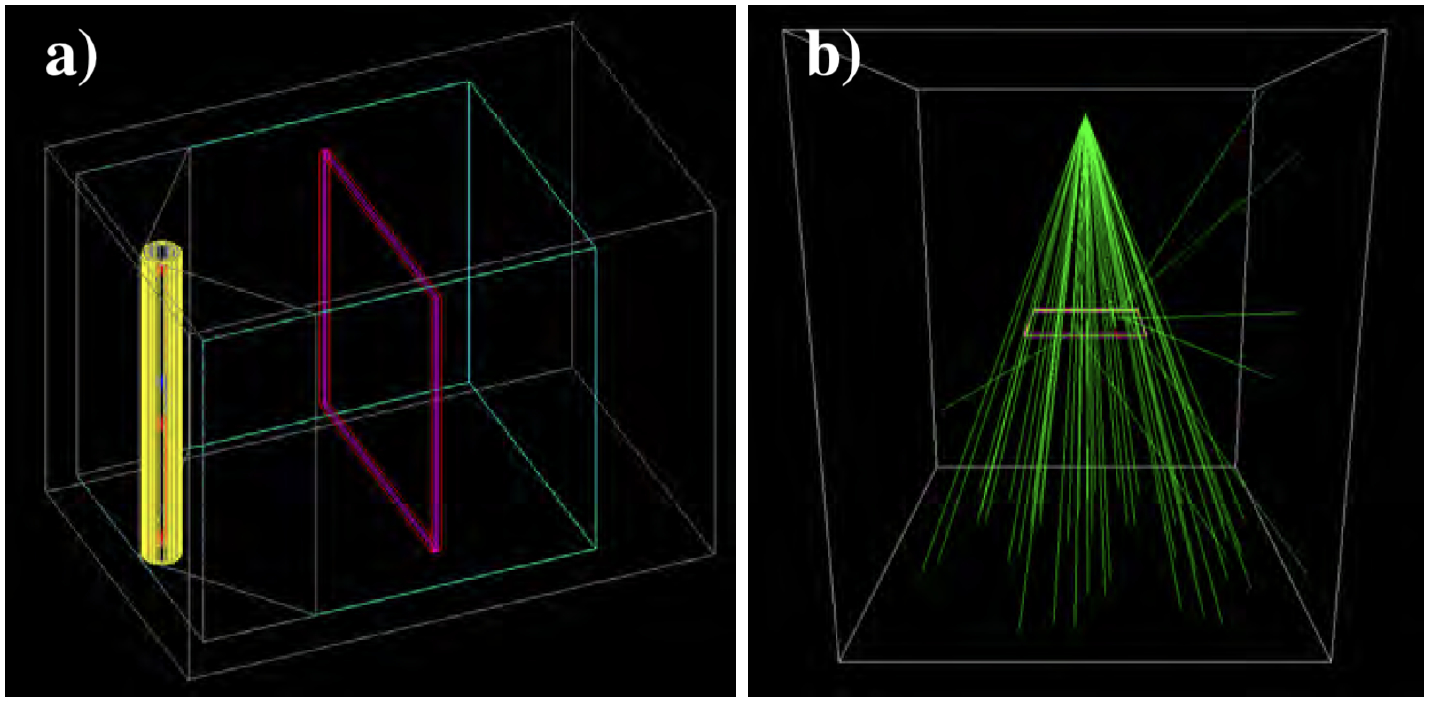
a): Render of the Mark I-68 air cavity (cyan) surrounded by lead (gray). The source guide and active unit are shown in layers of 304 stainless steel (yellow and gray cylinders). A Dose-Map™ cassette is used for quantitative calibration (magenta and red box). b) X-Rad320 MC model with the Dose-Map™ cassette (x-ray photon trajectories are drawn as green lines).
Turntable rotation modeling
Since the turntable experiments rotate sufficiently quickly over the irradiation period, the subject can be considered uniformly exposed from all azimuthal angles. We model this by considering a single whole rotation of the subject in 60 static frames separated by 6°. Each frame corresponds to a time-slice of one second in which GATE accounts for the decay of the radioactive sources.
Absolute number of gamma rays
137Cs decays via two pathways to 137Ba through β− emission (5.6%) or β−,γ emission (94.4%). 137Cs-decays yield a gamma-ray of 662keV with an absolute intensity of 85.1%, which is the dominant contribution to dose delivery in the Mark I-68 irradiator since most of the beta particles are stopped by the stainless steel encapsulation. For this reason, we model the 137Cs decay as a mono-energetic 662-keV gamma source with the half-life of 137Cs (30.07y) and an absolute intensity of 85.1%. Gamma rays are generated uniformly in the cylindrical source volumes and are propagated in the cavity, so the stainless steel penetration is naturally accounted for in our MC model. 3.6×10¹⁰ gamma-rays are simulated and the final results are normalized to the number of generated gamma-rays delivered by the source activity and exposure used in the real experiment, as given in Table 3.
Table 3.
Calculated number of generated photons and averaged photon energies for the four irradiation programs.
| Irradiator | kVp | Activity or current | Exposure time [s] | Averaged energy [keV] | Number of photons [× 1016] |
|---|---|---|---|---|---|
| Mark I-68 | - | 2068 Ci | 862.8 | 662 | 5.58 |
| X-Rad320 | 320 | 12.5 mA | 1944 | 156.3 | 4.38 |
| X-Rad320 | 225 | 17.5 mA | 3927 | 128.8 | 5.14 |
| X-Rad320 | 160 | 25.0 mA | 10458 | 105.7 | 6.80 |
2.4.2. X-Rad320 simulation
Geometry
The unit is simulated as an air volume of dimensions 100cm×100cm×120cm with the x-ray source at the geometric center of the cabinet and with the subject 50cm below the source (Fig. 4b). The walls are simulated with lead material, and the shelf is simulated as a stainless steel surface of 5mm thickness located 50cm from the x-ray source in order to account on the effect of the back-scatters on the absorbed dose.
X-ray source
The x-ray source is modeled as a point located at the geometric center of the cavity that generates photons directed towards the bottom. The energy and angular distribution depend on the voltage potential, the filters, and the x-ray extraction angle. We account for these effects by computing the energy and angular distributions using SpekPy [33], a validated Python tool that provides the energy distribution and x-ray fluence for a large range of energies. We use the ‘spekcalc’ physics model to emulate the standard and commercial software SpekCalc [34], which is used to calculate the x-ray emission spectra from tungsten anodes as in the X-Rad320. An anode angle of 32° is simulated, as per X-Rad320 specifications, along with the F2 filter described in Sec. 2.1.2. The energy spectra for the three relevant kVp energies calculated by SpekPy are in Fig. 5a. For the distribution of the zenith angle, θ, we compute the fluence at different off-sets from θ = 0 to θ = 23° (corresponding to the corner of the Dose-Map™, which is the largest angle subtended by any of our subjects) at steps of 0.023°. The θ distributions for the three relevant kVp energies are in Fig. 5b. A slight deviation from the z-axis was identified in our X-Rad320, which was measured (Sec. 2.5.1) and simulated. The x-ray emission is considered isotropic in azimuth.
Figure 5.

Energy spectra (a) and angular distribution (b) calculated by SpekPy and used in the GATE simulations of the X-Rad320.
Absolute number of photons
Once the system and configuration are specified, the total number of generated photons is determined by the voltage, the x-ray current and the exposure. We simulate the same parameters that those used during the irradiation experiments (Table 3). In practice, we simulate 4×10¹⁰ photons for each different x-ray energy and normalize the calculated dose to the number of generated photons (Table 3).
2.4.3. Physics list
We use the Low Energy Livermore Model [27, 28], which is designed for applications where high accuracy of photons, electrons, hadrons and ions tracking is required. It includes all the relevant electromagnetic physics processes, in particular those contributing to dose delivery, with an extended validity range at lower energies.
2.5. Monte Carlo dosimetry experiments
Two dose calculation experiments are performed: one in a realistic digital mouse phantom using a realistic simulation of the apparatus, and another in a simplistic beam geometry using only uniform blocks of materials as targets. We use the latter to quantitatively assess the dose per photon in soft-tissue and bone at different energies. This analysis is intended to highlight the fundamental similarities and differences between the doses delivered by photons of different energy, independent of the particular geometry of the irradiator, the beam distribution, or the complexity of the mouse anatomy. In this section we report on the methods used to calibrate the MC and to calculate the dose distributions.
2.5.1. Monte Carlo model calibration
To validate and calibrate our MC model, we use the Dose-Maps™ to compare the dose predicted by our simulation to those measured experimentally for each irradiation program. Two aspects of the MC model are calibrated: the absolute delivered dose in each of the irradiators, and the x-ray beam deviation angle with respect to the vertical in the X-Rad320. For the former, a correction factor f is calculated by using the measured central dose through the expression
| (1) |
where Dm and Ds are the measured and simulated central doses. Since the Dose-Map™ measured dose is indexed to alanine, we model it as a 304mm × 279mm × 1mm alanine box sandwiched between two sheets of 304mm × 279mm × 10mm high-density polyethylene, with material properties from Table A1. The positions and orientations are equivalent to those in our experiments in Fig. 3. Regarding the x-ray beam deviation angle, we observe a slight angular deviation of the measured x-ray beam from the vertical that results in the x-ray beam distribution being off-center, as it is visible in Fig. 8. The angular deviation is estimated by identifying the x coordinate of the off-center position by fitting a fifth-order polynomial to the x-axis projection of the 2D distributions. This coordinate is converted into an angular deviation provided that we know the distance between the x-ray beam and the subject. This angular correction is included in our MC model.
Figure 8.
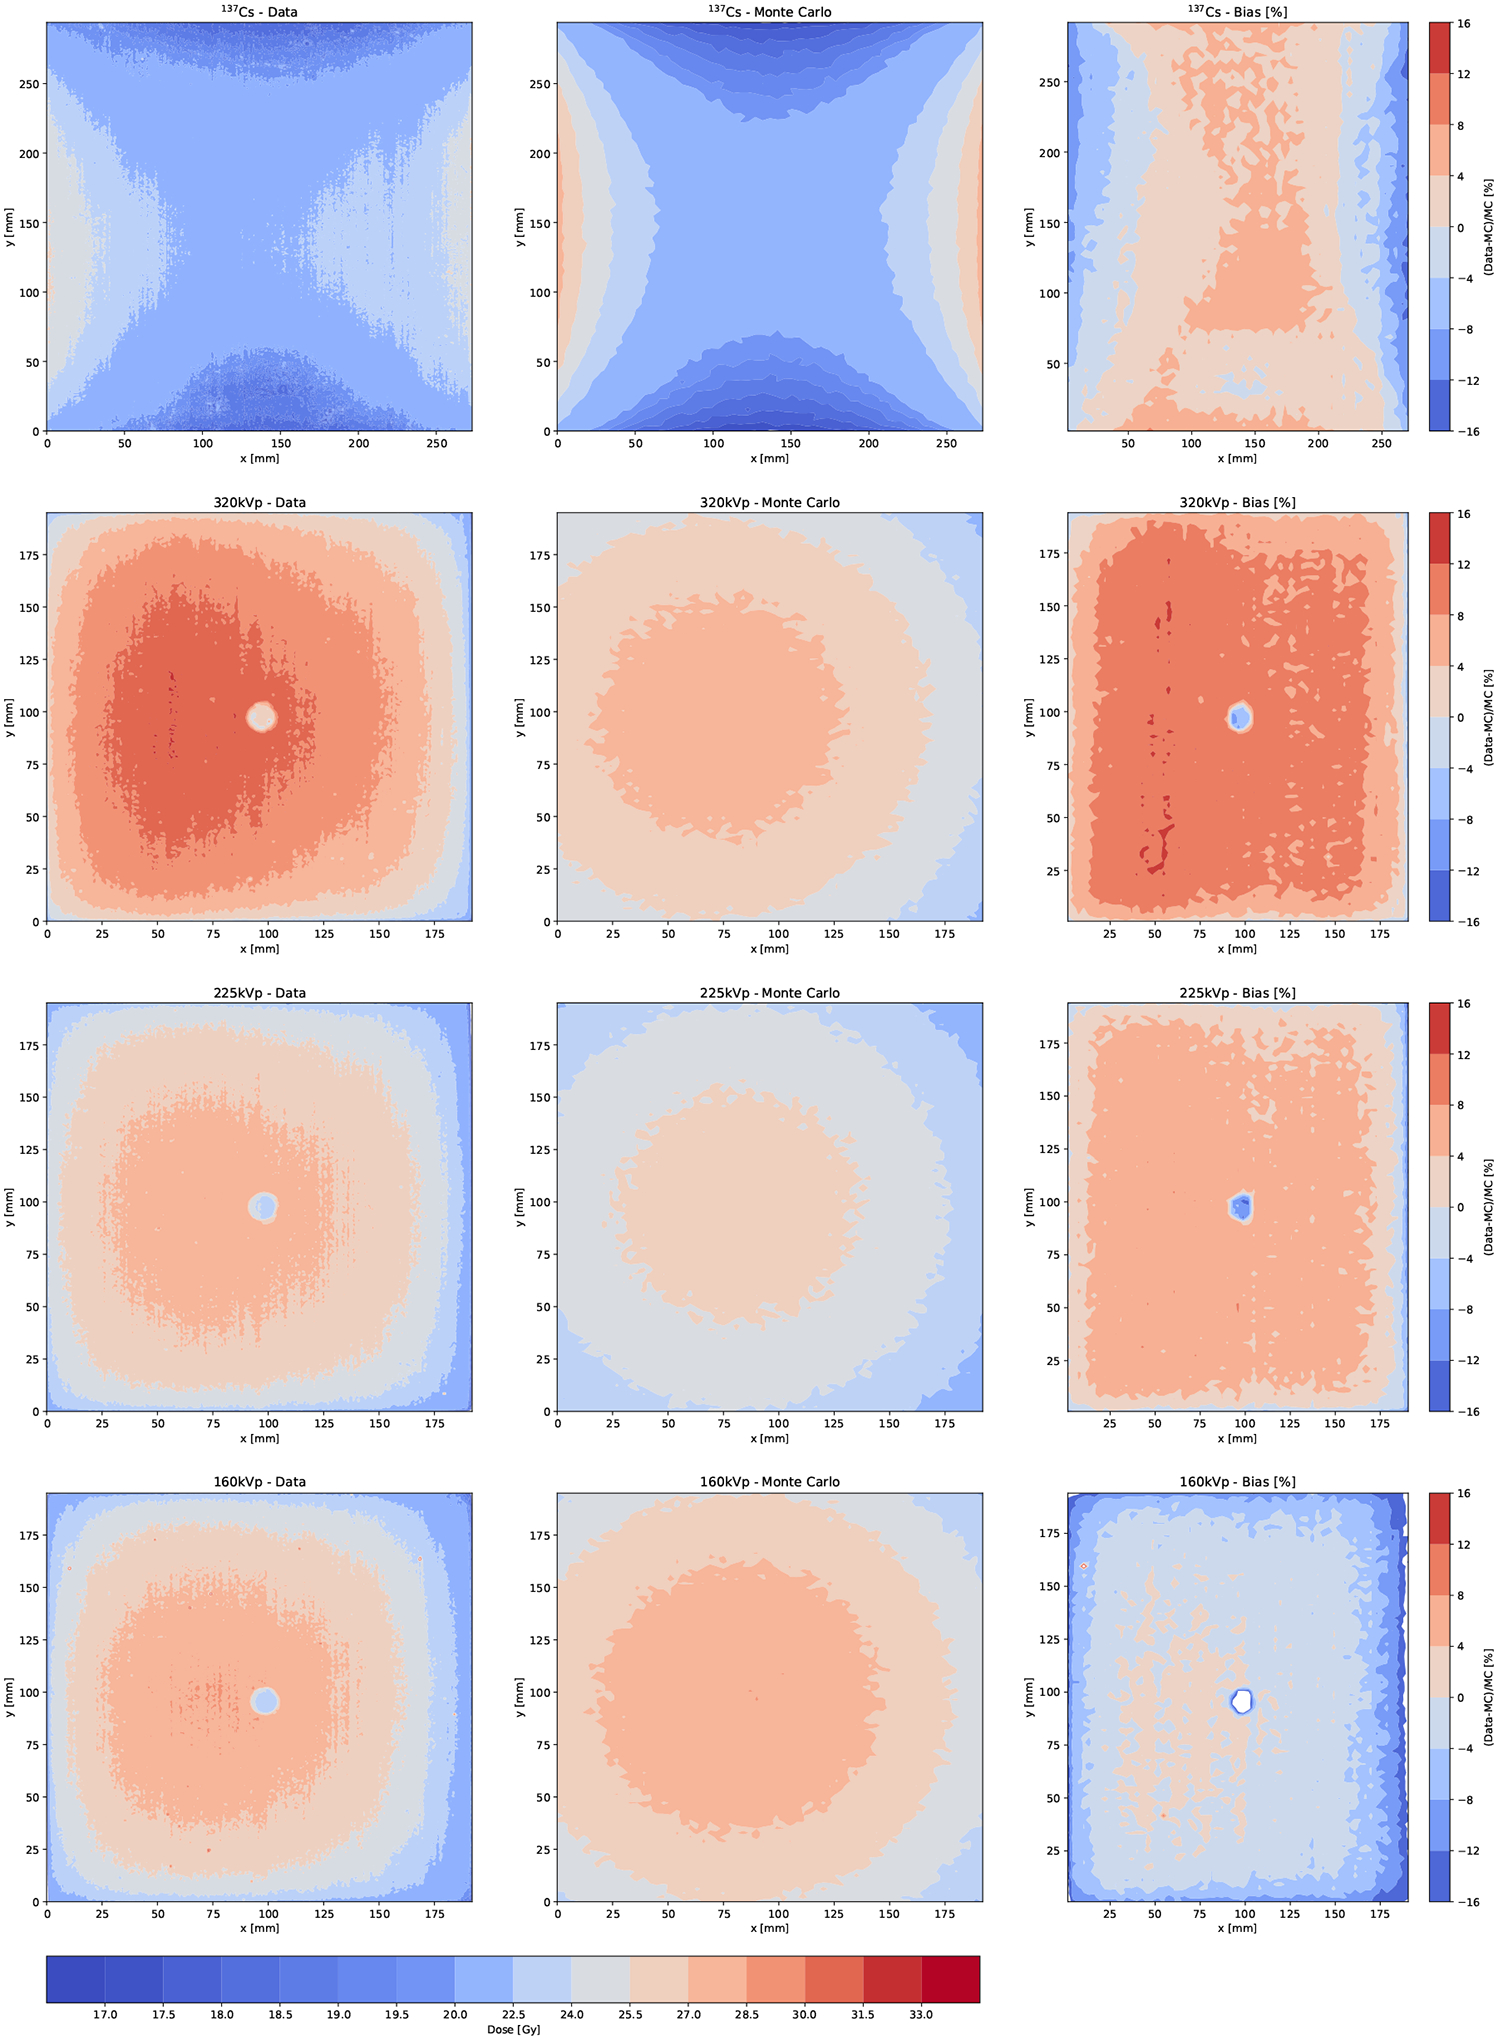
Dose-Map™ doses as measured (left) and calculated using the MC model (center), along with the MC deviation from data or bias (right). The location of the alanine pellets are clearly visible in the Gafchromic films for those irradiated with x-rays. For these plots, the MC is corrected by the angular deviation but not by the absolute dose correction factors f.
2.5.2. Simple phantom Monte Carlo experiment
This simplified simulation irradiates blocks of uniform materials (soft-tissue or bone) with photons from a point source impinging the front face of the block perpendicularly. In this way, we compute the dose per photon for different energies and materials as a function of depth, and compare the different fundamental behaviour of x rays and gamma rays of the relevant energies. We simulate 4×10⁸ photons incident normal to the center of a block of 274mm×294mm×10mm made of homogeneous soft-tissue (body material in Table A1) or bone (rib bone material in Table A1) suspended in an air cavity. Across six different runs for each material, we use monoenergetic photons at 125keV, 320keV, and 662keV, and polyenergetic x-ray spectra at 160kVp, 225kVp, and 320kVp. The Geant4 models included in GATE propagate the primary photons and secondary particles across the different geometries. The subject is voxelized and the deposited energy Ei in each voxel i is recorded, yielding the dose per voxel Di as
| (2) |
where ρi andVi are the density and volume of voxel i. To evaluate absorbed dose as a function of depth, we slice the block into 0.145-mm slices transverse to the incident beam axis. Dose is calculated per slice as in Eqn. (2), with each 274mm×294mm×0.145mm slice analogous to a voxel i.
2.5.3. Digital mouse phantom Monte Carlo experiment
We simulate the mouse carcasses by using the digital mouse phantom MOBY [35]. A static model is used in order to reproduce the absence of motion in the carcasses. We produce a voxelized phantom of 196voxels × 186voxels × 745voxels with 0.145mm × 0.145mm × 0.145mm voxels. The phantom is simplified from 78 materials to the 15 materials in Table A1. The materials are characterized by their densities and composition in order to correctly model the electromagnetic interactions in different tissue. We use the standard material properties defined by the International Commission on Radiological Protection in [36]. The MOBY phantom is placed inside a clear polycarbonate plastic pie cage of 216mm diameter, 51mm height, and 3mm thickness at a −45° angle from the x-axis and 6cm off-center to mimic real conditions (Fig. 3). The pie cage is deployed in the X-Rad320 with its base at 50cm from the x-ray beam, and for the Mark I-68 at the geometric center of the cavity. Dose is calculated per voxel as described in Eqn. (2), with voxels of the same size than the ones used to describe the phantom. The absorbed dose in each organ is defined as the sum over the voxels that belong to that organ, which are identified by a label given when generating the digital phantom using the MOBY software.
3. Results
3.1. Experimental dose measurements
The measured doses in the four carcasses and the twelve RBPs are shown in Fig. 6 for each location in the mouse and each different irradiation program. The measured central dose in the Dose-Maps™ are also shown for comparison. We quantify the deviation of the measured doses from the target dose (25Gy) by defining the bias from the targeted dose, BT, as:
| (3) |
where DM and DT are the measured dose and the target dose, respectively. We also define the bias from the carcass dose, BC, as:
| (4) |
where DC is the measured dose in the carcass. These are shown in the central and bottom panes of Fig. 6. BT of the carcass is between 14% and 35% for the X-Rad320, and between −4% and −9% for the Mark I-68. The RBP doses averaged over location and phantoms are (29.1±1.8)Gy for 160kVp, (32.9±1.6)Gy for 225kVp, (29.4±1.3)Gy for 320kVp, and (23.1±0.5)Gy for 137Cs, in good agreement with the doses in the carcass. The average of BC over all energies and phantoms is (−3.7±7.2)% for the Dose-Maps™ and (0.82±5.40)% for the RBPs. The dose rate in Fig. 7 is calculated as the measured dose divided by the exposure time (Table 2). The dose rate spams approximately one order of magnitude between the X-Rad320 at 160kVp and the Mark I-68.
Figure 6.
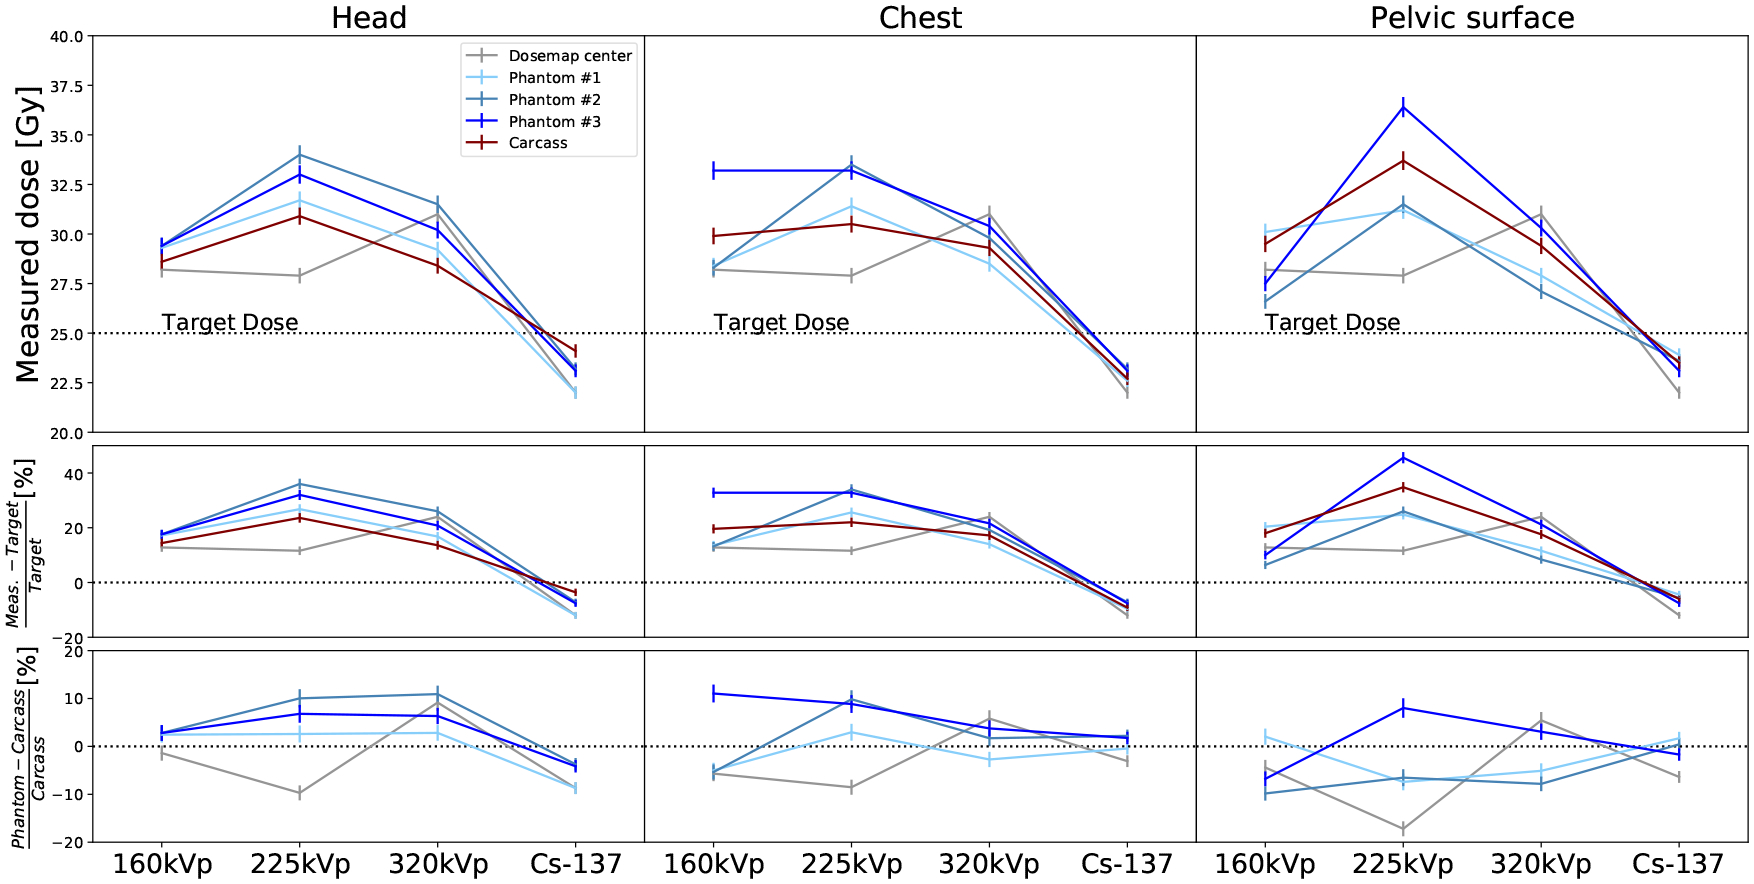
Measured doses from low to high photon energy for the different subjects: carcasses (red), RBPs (blue), and Dose-Maps™ (gray). The doses are reported for the three different locations in the mouse, from left to right: head, chest and pelvic surface. The top row shows the absolute dose for each energy, subject and location. The Dose-Map™ line corresponds to the dose at the center of the cassette. The central row is the bias from the target dose (BT) and the bottom row corresponds to the bias from the dose in the carcass (BC).
Figure 7.

Measured dose rates from low to high photon energy for the different subjects: carcasses (red), RBPs (blue), and Dose-Maps™ (gray). The doses are reported for the three different locations in the mouse, from left to right: head, chest and pelvic surface.
3.2. Monte Carlo-based dosimetry
3.2.1. Monte Carlo calibration
The dose contours are shown in Fig. 8 for data and MC. We observe that the dose distributions predicted by MC simulation are more symmetric than those measured probably due to the heel effect not being precisely modeled. In the central region the prediction is more accurate than at larger θ, where the dose gradient is much steeper for data than for MC. Since the carcasses and RBPs are irradiated in the central region, we do not consider this discrepancy relevant for our study. The correction factors Eqn. (1) defined for the central region are very close to unity, as shown in Table 4, along with the measured angular deviation.
Table 4.
The measured and predicted average doses in the Dose-Map™.
| Irradiator | Measured Dose [Gy] | Predicted Dose [Gy] | Correction | Angular deviation [°] |
|---|---|---|---|---|
| Mark I-68 (137Cs) | 22.00 ± 0.55 | 20.98 ± 0.21 | 1.05 ± 0.03 | – |
| X-Rad320 (320 kVp) | 31.00 ± 0.78 | 27.67 ± 0.42 | 1.12 ± 0.03 | 4.17 |
| X-Rad320 (225 kVp) | 27.90 ± 0.70 | 26.20 ± 0.38 | 1.06 ± 0.03 | 2.60 |
| X-Rad320 (160 kVp) | 28.20 ± 0.70 | 28.12 ± 0.44 | 1.00 ± 0.03 | 2.11 |
3.2.2. Simple phantom dosimetry
The dose as a function of depth for different photon energies and in different materials are shown in Fig. 9. For monoenergetic beams (Fig. 9a), the photon energy determines the difference between the dose delivered to bone and tissue. A greater discrepancy is observed for lower energy photons (125keV) than for higher energy photons (662keV). At lower energies, more dose is absorbed in bone than in tissue due to the substantial differences in photon attenuation between materials. A dose build-up region is observed for 137Cs gamma-ray energies attributed to the combination of the greater penetration of higher-energy gamma-rays, and the longer range of secondary electrons and lack of charged-particle equilibrium [37]. The lack of dose build-up region at these scales for x-rays is explained by the shallower penetration and the shorter range of secondary electrons. At 662keV, build-up regions are observed at the entry and exit interfaces of the block, where the dose in bone is greater than in tissue. This behaviour is inverted after the build-up region, where the dose in tissue exceeds that in bone. The length of the 662keV build-up region roughly matches the diameter of a typical mouse bone, (~1mm, as estimated from the digital mouse phantom). Polyenergetic x-ray spectra at 160kVp, 225kVp, and 320kVp yield similar depth dose profiles than the low-energy monoenergetic beams simulated in Fig. 9a, with elevated bone doses and no significant build-up regions (Fig. 9b). This behavior is explained by the similarity of the average energies of these x-ray spectra (105.7keV, 128.8keV, 156.3keV; see Table 3) to the 125keV monoenergetic beam discussed above.
Figure 9.
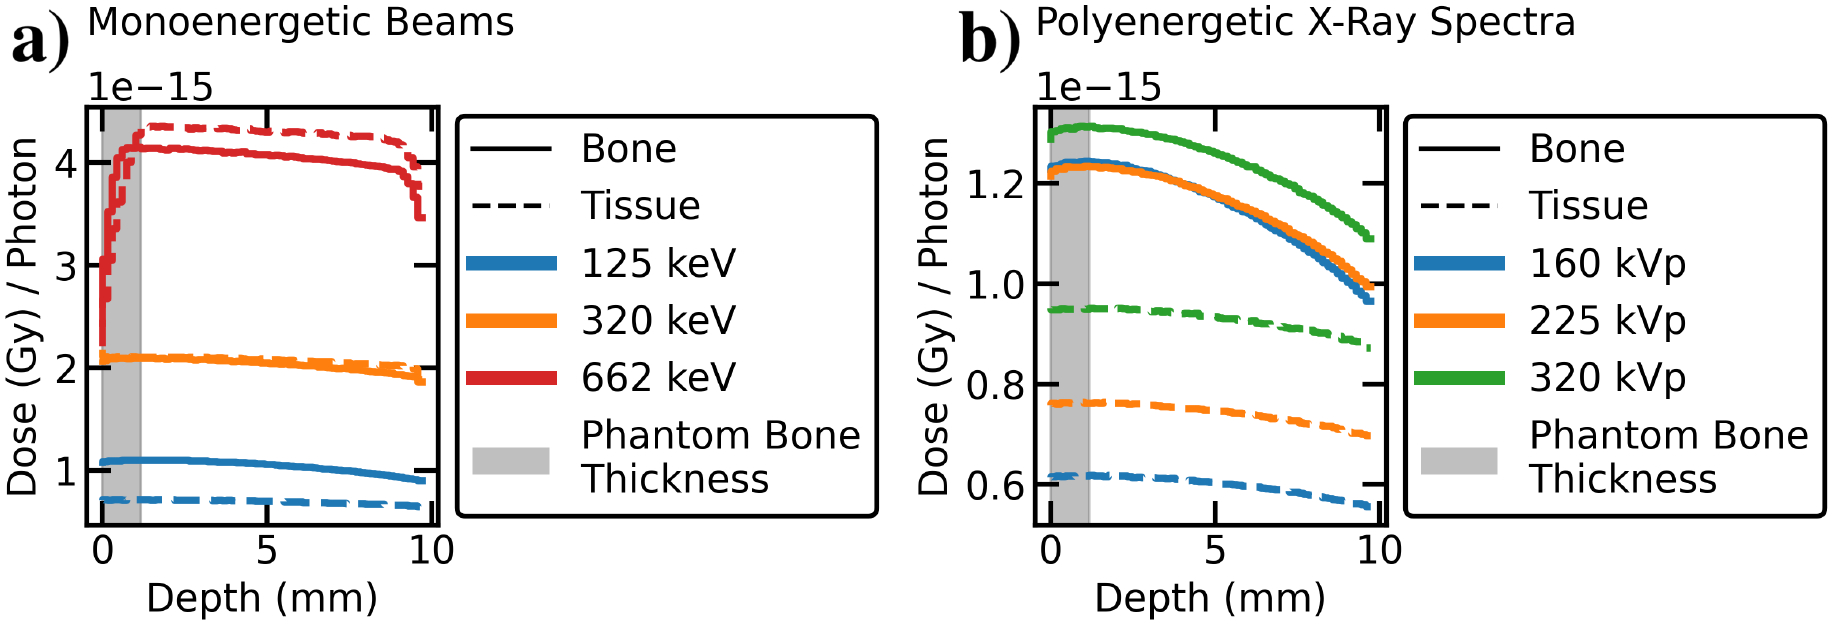
MC depth-dose curves of low, medium, and high energy photon beams in blocks of homogeneous tissue or bone material. a) In monoenergetic beams, low-energy photons deliver more dose to bone than to tissue at all depths, whereas higher-energy beams exhibit a dose build-up region after which tissue dose exceeds bone dose. The build-up region is roughly the same length as thickness of rib bones in the MOBY digital mouse phantom (1.16 mm, shaded in gray). b) The polyenergetic x-ray spectra at 160, 225, and 320 kVp behave similarly to a low-energy monoenergetic beam (with no build-up), as expected from their effective beam energies (105.7keV, 128.8keV, and 156.3keV).
3.2.3. Mouse phantom dosimetry
The distributions of deposited energy per photon and voxel in the digital mouse phantom (Fig. 10) show that the uniformity of the absorbed energy increases with photon energy, as expected due to the higher photon penetration and the larger electron range.
Figure 10.
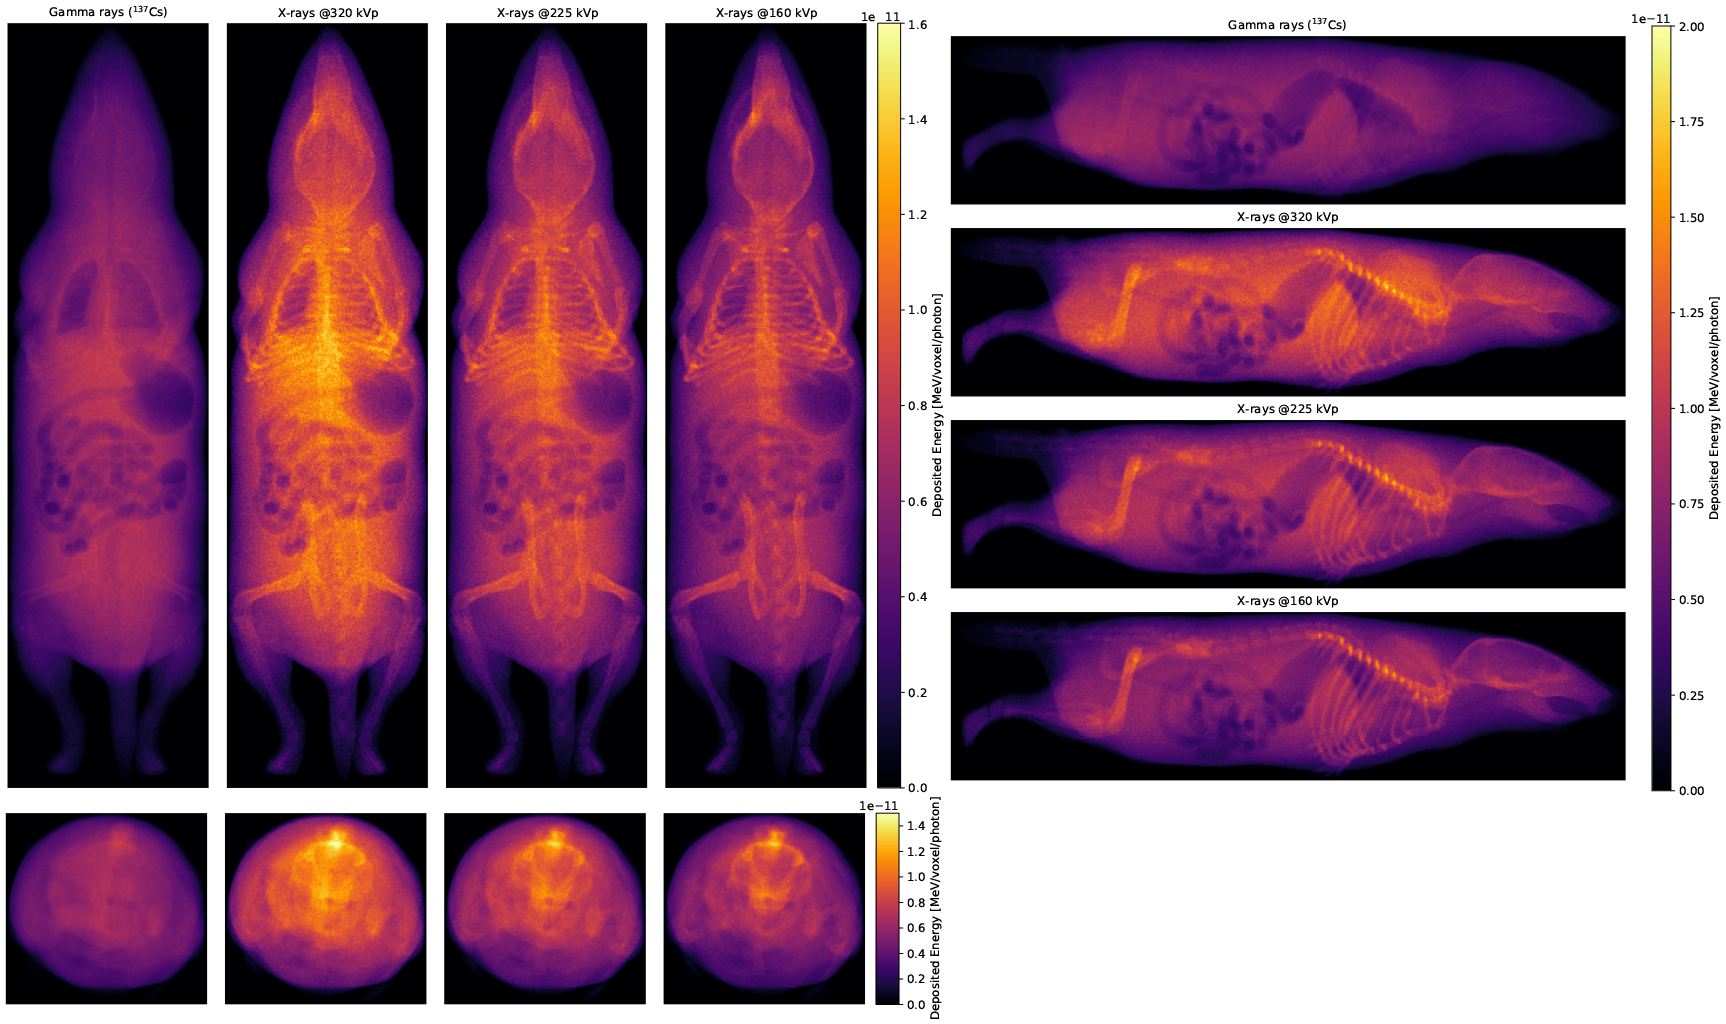
Projections of the deposited energy per voxel for the different irradiation runs. In the left panes, photon energy increases from right to left, and in the right pane, photon energy increases from bottom to top.
The organ-specific doses are shown in Fig. 11a. We can roughly define two dose regimes, a lower dose one corresponding to soft tissue and a higher dose one corresponding to bone. The dose delivered in soft-tissue is very similar between organs for each irradiation program. For 137Cs, the standard deviation of the organ-specific doses in soft-tissue is 1.7%, and for x-rays are 4.7%, 4.9% and 5.2%, from high to low voltage. Dose in bone is predicted to be slightly lower than that in soft-tissue for 137Cs irradiation, while being significantly larger for x-rays. This difference is lower than 40% for 320kVp, while it reaches up to a factor of two for 160kVp. We also observe that the doses predicted for the Mark I-68 are compatible with the target dose, while those for the X-Rad320 are substantially larger, similar to what we observe with the experimental measurements (Fig. 6).
Figure 11.
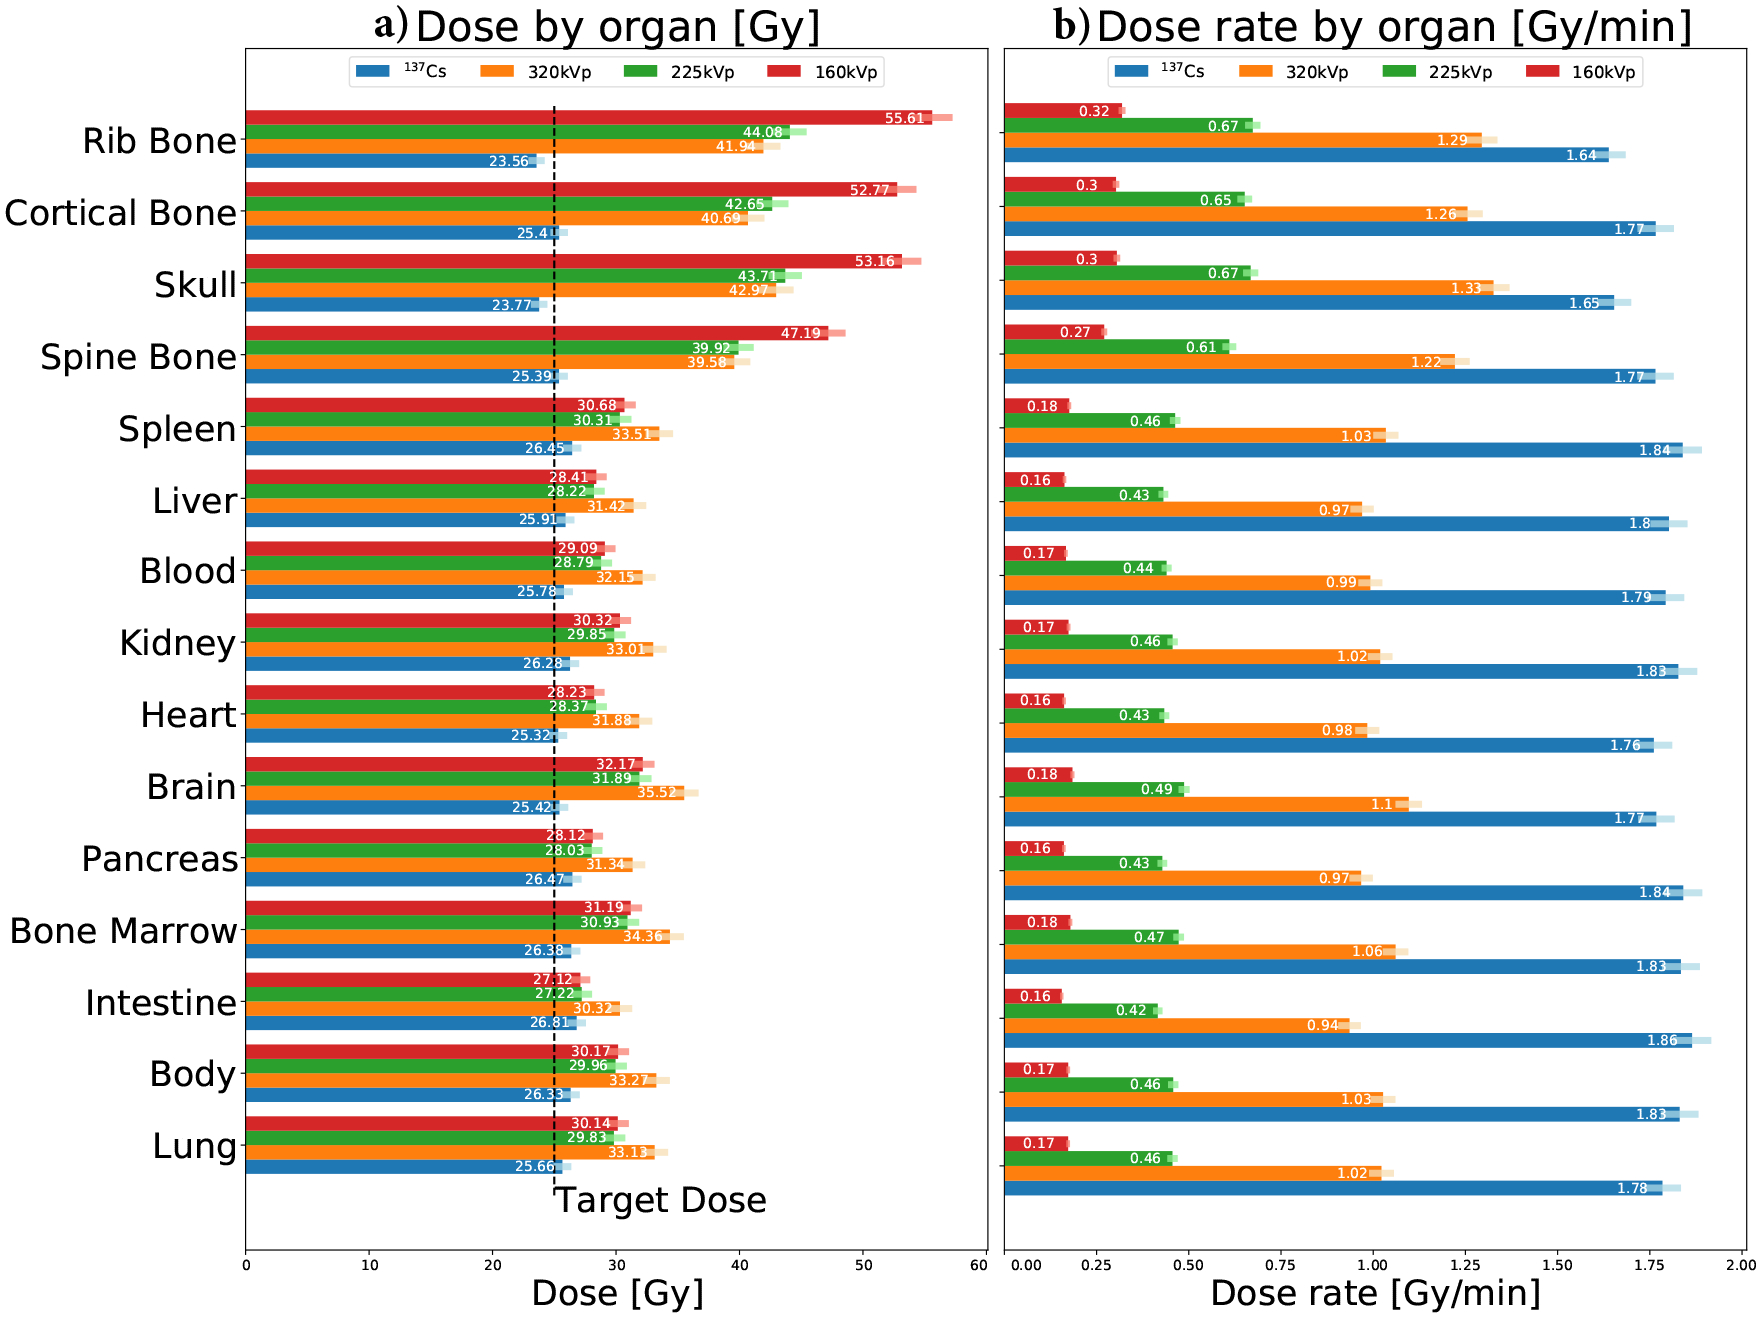
Organ-specific doses (a) and dose rates (b) for each irradiation program. Correction factors (Sec. 2.5.1) are included in these results. Uncertainties are marked with a color error bar.
Dose rates are shown in Fig. 11b for each organ and irradiation program. When compared to the Mark I-68, the X-Rad320 dose rate is lower by about a factor two in soft-tissue at 320kVp and an order of magnitude at 160kVp.
When compared to carcass dose measurements (Fig. 12), MC simulations agree better when considering the calculated dose in soft-tissue dose than in bone. The bone dose predicted by our MC model substantially varies with photon energy, being similar to the dose in soft-tissue for 137Cs, but up to a factor of two different for x rays.
Figure 12.
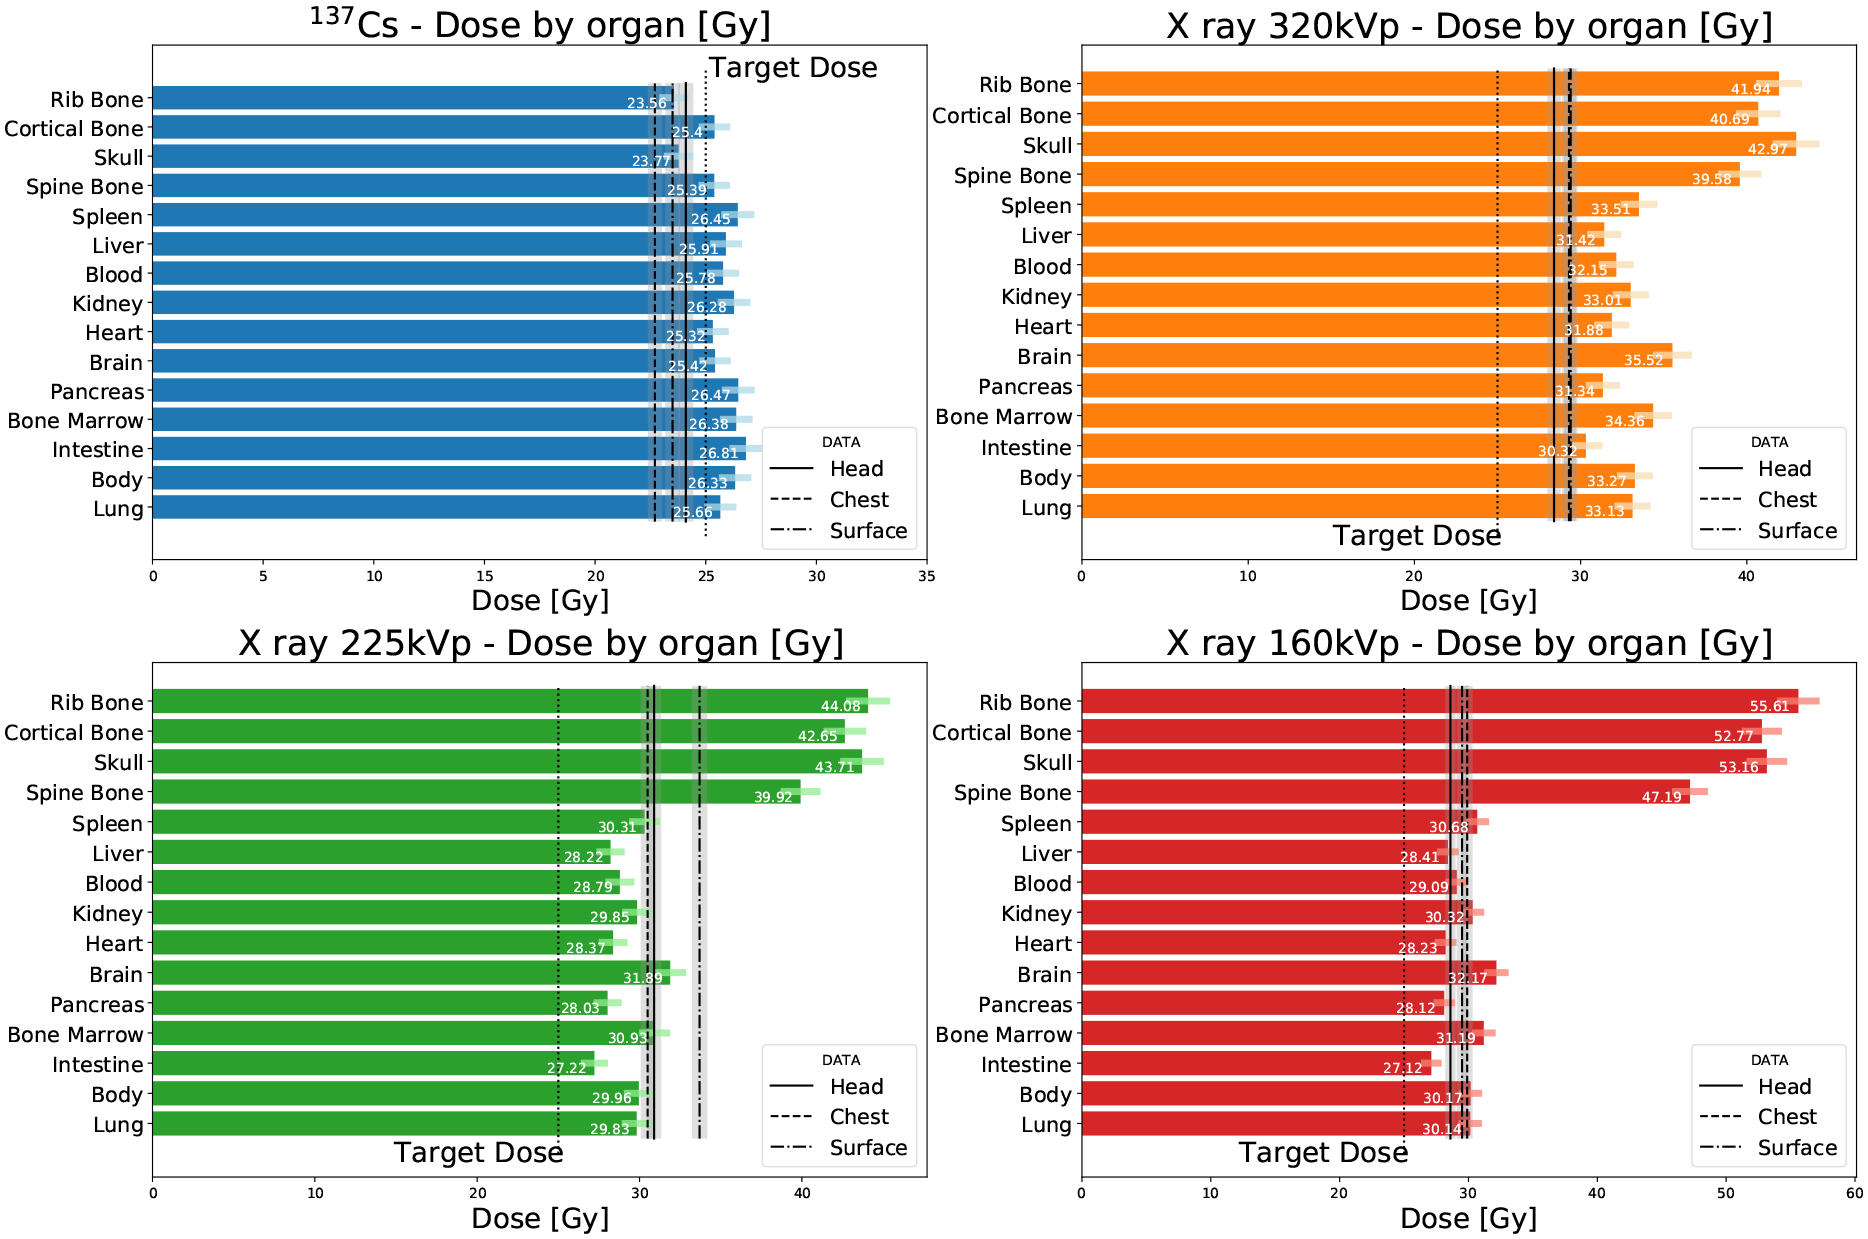
Organ-specific doses calculated from the digital mouse phantom compared to the measured doses in the carcass. Uncertainties for data are marked with a gray shaded region, and as a color error bar for Monte Carlo.
4. Discussion
4.1. Comparison between 137Cs and medium-energy x-ray irradiation
The doses calculated for each organ (Fig. 11) show that the soft-tissue dose is very uniform and independent of the organ for both irradiators. The standard deviation of the dose in soft-tissue organs is smaller than 5%. Regarding the dose delivered to bone, the simplified MC studies (Fig. 9) show that the difference between the dose deposited in bone and in soft-tissue depends on photon energy. This is negligible for 137Cs irradiation but about 30% larger for bone for the 320kVp x-rays case. This is due to the wash-out effect of the long-range secondary electron, which can deposit their energy along centimeter-scale tracks. This is an important effect that must be accounted for in bone irradiation experiments if a precise estimation of the dose in bone is required. We show that MC simulations can be used for this estimation.
Dose rates depend on photon energy and on the type of irradiator (geometry, radiation map, etc.), as seen from Fig. 7. The highest dose rate is observed for the Mark I-68, while being ~ 40% lower for the X-Rad320 at 320kVp. It has been shown that dose rates play an important role in the biological effects of radiation [38–40], and, in particular, for small animal irradiation [41, 42]. Furthermore, high energy photons deliver more dose per photon and unit of length, being higher for 137Cs than for x-rays (Fig. 9). The biological implications of these differences is out of the scope of this paper and it should be carefully assessed in small animal irradiation experiments.
In summary, our study implies that x-ray irradiation can deliver a similar dose distribution for soft-tissue than 137Cs irradiation. A correction is necessary for the doses in bone, which can be extracted from MC simulations. The difference in dose rate should also be evaluated in each experiment. These differences can be reduced by using the 320kVp irradiation program which minimizes the differences between soft-tissue and bone doses, and provides the highest dose rate, closer to that of the Mark I-68.
4.2. Monte Carlo-based organ-specific dosimetry
Our MC model was validated against soft-tissue dose measurements. The average dose in soft tissue as predicted by our MC model is compatible with the carcass measurement within 15% at all energies. The MC prediction for dose in bone is not compared to experimental data since a bone dose measurement is not available.
X-ray irradiation experiments commonly use the total absorbed dose in the mouse as their relevant parameter. This is often given by the estimations provided by the irradiator’s manufacturer or by in-situ dose measurements [4, 5]. We, along with others [29], have shown that the doses substantially vary organ to organ according to their density, composition, and structure. The difference is significant for x-ray irradiation between soft tissue and bone. Our MC model can be used in scenarios where organ-based dosimetry or micro-dosimetry is required for small animal irradiation studies.
4.3. Relevance of 3D-printed mouse phantom for in-situ calibration
The deviation from the target dose that we found in both irradiators, especially significant (35%) in the X-Rad320, stresses the need for this type of direct in-situ calibration. The RBPs can provide a direct measurement of the absorbed dose in soft tissue and be used for this purpose. There several factors that may be contributors to this discrepancy, such as inaccurate calibration of the apparatus, systematic effects (x-ray heel effect, amount of shielding in 137Cs source, etc.), inaccurate location of the subject in the radiation field, or effects of the passive shielding components like the rodent cage. The twelve RBP dose measurements (three different RBPs with three alanine pellets) performed for each irradiation program are compatible with each other, with a standard deviation no larger than 1.8Gy, and a relative uncertainty no larger than 6%. The accuracy in the estimation of the dose in the carcass is slightly better for the RBP than that provided by Dose-Map™. Furthermore, the RBP is a more compact dosimeter with the advantage that it can also be co-irradiated together with the subject for a direct measurement of the soft-tissue dose in each irradiation run. A limitation of the RBP is that it does not provide the dose absorbed in bone, which can be very different from soft tissue, as shown by our MC studies.
5. Conclusion
We measured the dose delivered in mice between the Mark I-68 137Cs irradiator and the X-Rad320 x-ray irradiator at three different voltages (160kVp, 225kVp, and 320kVp) using mouse carcasses implanted with alanine pellets. Organ-specific doses were calculated through a MC model that uses a realistic digital mouse phantom. The predicted doses deposited in soft-tissue agree well with our measurements. Our results show that the soft-tissue dose is very uniform across the different organs, independent of the irradiation method, which suggests that x-ray irradiation is a good candidate to substitute 137Cs irradiation for soft-tissue experiments. Regarding bone irradiation, there is a significant difference between bone dose and soft-tissue dose that can be addressed through MC simulation. Some differences in dose rate and dose per photon per unit length are observed across energies and irradiators, whose biological effects should be carefully considered in each small-animal irradiation experiment. 320-kVp irradiation showed the closest response to 137Cs irradiation in terms of dose uniformity across organs and dose rate. Finally, we found a significant discrepancy between the measured and target dose of up to −9% for 137Cs gamma rays and up to 35% for x-rays. This deviation can be controlled with the in-situ dose calibration provided by RBPs, that can be deployed and co-irradiated along with the subject to provide a direct measurement of the soft-tissue dose within a 6% precision.
Acknowledgments
This manuscript involved ex-vivo research compliant with the Institutional Animal Care and Use Program of the University of California, San Francisco. This work was supported by the National Nuclear Security Administration of the USA Department of Energy and funded through Sandia National Laboratories. All authors declare that they have no known conflicts of interest in terms of competing financial interests or personal relationships that could have an influence or are relevant to the work reported in this paper.
Appendix A. Materials included in GATE Monte Carlo model
Table A1.
Material properties as simulated in GATE. Fractional numbers correspond to the fraction by weight. Values for biological tissue extracted from [36].
| Material | Density | Composition | ||||||||||||
|---|---|---|---|---|---|---|---|---|---|---|---|---|---|---|
| Lead | 11.4 g/cm3 | Pb | ||||||||||||
| Aluminum | 2.7 g/cm3 | Al | ||||||||||||
| Cesium source | 4.0g/cm3 | CsCl | ||||||||||||
| Stainless Steel [32] | 8.0 g/cm3 | Fe0.7159Cr0.1818Ni0.0848Mg0.0175 | ||||||||||||
| Alanine | 1.17 g/cm3 | H6O2N1C1 | ||||||||||||
| Polyethylene | 0.96 g/cm3 | H2C1 | ||||||||||||
| H | C | N | O | Na | p | S | Ch | K | Ca | Sc | Mg | Fe | ||
| Lung | 0.26 g/cm3 | 0.103 | 0.105 | 0.031 | 0.749 | 0.002 | 0.002 | 0.003 | 0.003 | 0.002 | - | - | - | - |
| Body | 1.00g/cm3 | 0.112 | - | - | 0.888 | - | - | - | - | - | - | - | - | - |
| Intestine | 1.03 g/cm3 | 0.106 | 0.115 | 0.022 | 0.751 | 0.001 | 0.001 | 0.001 | 0.002 | 0.001 | - | - | - | - |
| Bone Marrow | 1.03 g/cm3 | 0.105 | 0.416 | 0.034 | 0.443 | - | - | 0.002 | - | - | - | - | - | - |
| Pancreas | 1.04g/cm3 | 0.106 | 0.169 | 0.022 | 0.694 | 0.002 | 0.002 | 0.001 | 0.002 | 0.002 | - | - | - | - |
| Brain | 1.04g/cm3 | 0.107 | 0.145 | 0.022 | 0.712 | 0.002 | 0.004 | 0.002 | 0.003 | 0.003 | - | - | - | - |
| Heart | 1.05 g/cm3 | 0.104 | 0.139 | 0.029 | 0.718 | 0.001 | 0.002 | 0.002 | 0.002 | 0.003 | - | - | - | - |
| Kidney | 1.05 g/cm3 | 0.103 | 0.132 | 0.03 | 0.724 | 0.002 | 0.002 | 0.002 | 0.002 | 0.002 | 0.001 | - | - | - |
| Blood | 1.06g/cm3 | 0.102 | 0.11 | 0.033 | 0.745 | 0.001 | 0.001 | 0.002 | 0.003 | 0.002 | - | - | - | 0.001 |
| Liver | 1.06g/cm3 | 0.102 | 0.139 | 0.03 | 0.716 | 0.002 | 0.003 | 0.003 | 0.002 | 0.003 | - | - | - | - |
| Spleen | 1.06g/cm3 | 0.103 | 0.113 | 0.032 | 0.741 | 0.001 | 0.003 | 0.002 | 0.002 | 0.003 | - | - | - | - |
| Spine Bone | 1.42 g/cm3 | 0.063 | 0.261 | 0.039 | 0.436 | 0.001 | 0.061 | 0.003 | 0.001 | 0.001 | 0.133 | - | 0.001 | - |
| Skull | 1.61 g/cm3 | 0.05 | 0.212 | 0.04 | 0.435 | 0.001 | 0.081 | 0.003 | - | - | 0.176 | - | 0.002 | - |
| Cortical | 1.85 g/cm3 | 0.047 | 0.144 | 0.042 | 0.447 | - | 0.105 | 0.003 | - | - | 0.210 | - | 0.002 | - |
| Rib Bone | 1.92 g/cm3 | 0.034 | 0.155 | 0.042 | 0.435 | 0.001 | 0.103 | 0.003 | - | - | 0.225 | - | 0.002 | - |
References
- [1].National Research Council et al. Radiation source use and replacement: abbreviated version. National Academies Press, 2008. [Google Scholar]
- [2].Scott BR et al. “A comparison of in vivo cellular responses to Cs-137 gamma rays and 320-kV X rays”. In: Dose-Response 11.4 (2013), dose–response. [DOI] [PMC free article] [PubMed] [Google Scholar]
- [3].Scott BR and Potter CA. “Stochastic threshold exponential (TE) model for hematopoietic tissue reconstitution deficit after radiation damage”. In: Dose-Response 12.3 (2014), dose–response. [DOI] [PMC free article] [PubMed] [Google Scholar]
- [4].Gibson Brian W et al. “Comparison of cesium-137 and X-ray irradiators by using bone marrow transplant reconstitution in C57BL/6J mice”. In: Comparative medicine 65.3 (2015), pp. 165–172. [PMC free article] [PubMed] [Google Scholar]
- [5].Gott Katherine M et al. “A comparison of Cs-137 γ rays and 320-kV X-rays in a mouse bone marrow transplantation model”. In: Dose-Response 18.2 (2020), p. 1559325820916572. [DOI] [PMC free article] [PubMed] [Google Scholar]
- [6].Andersen Anna Halling Folkmar et al. “Comparable human reconstitution following Cesium-137 versus X-ray irradiation preconditioning in immunodeficient NOG mice”. In: Plos one 15.10 (2020), e0241375. [DOI] [PMC free article] [PubMed] [Google Scholar]
- [7].Wittenborn Thomas Rea et al. “Comparison of gamma and x-ray irradiation for myeloablation and establishment of normal and autoimmune syngeneic bone marrow chimeras”. In: Plos one 16.3 (2021), e0247501. [DOI] [PMC free article] [PubMed] [Google Scholar]
- [8].Sibtain Amen, Morgan Andrew, and MacDougall Niall. Physics for clinical oncology. OUP Oxford, 2012. [Google Scholar]
- [9].Biglin Emma R et al. “Preclinical dosimetry: exploring the use of small animal phantoms”. In: Radiation Oncology 14.1 (2019), pp. 1–10. [DOI] [PMC free article] [PubMed] [Google Scholar]
- [10].Pedersen Kurt H et al. “Radiation biology irradiator dose verification survey”. In: Radiation Research 185.2 (2016), pp. 163–168. [DOI] [PubMed] [Google Scholar]
- [11].Aukett RJ et al. “The IPEMB code of practice for the determination of absorbed dose for x-rays below 300 kV generating potential (0.035 mm Al-4 mm Cu HVL; 10–300 kV generating potential)”. In: Physics in Medicine & Biology 41.12 (1996), p. 2605. [DOI] [PubMed] [Google Scholar]
- [12].Noblet C et al. “Underestimation of dose delivery in preclinical irradiation due to scattering conditions”. In: Physica Medica 30.1 (2014), pp. 63–68. [DOI] [PubMed] [Google Scholar]
- [13].Brady Samuel L. et al. “Characterization of a Cs-137 irradiator from a new perspective with modern dosimetric tools”. In: Health physics 97.3 (Sept. 2009), pp. 195–205. ISSN: 0017–9078. [DOI] [PMC free article] [PubMed] [Google Scholar]
- [14].Niroomand-Rad Azam et al. “Radiochromic film dosimetry: recommendations of AAPM radiation therapy committee task group 55”. In: Medical physics 25.11 (1998), pp. 2093–2115. [DOI] [PubMed] [Google Scholar]
- [15].Dancewicz OL et al. “Radiological properties of 3D printed materials in kilovoltage and megavoltage photon beams”. In: Physica Medica 38 (2017), pp. 111–118. [DOI] [PubMed] [Google Scholar]
- [16].Ma Xiangjie et al. “Classification of x-ray attenuation properties of additive manufacturing and 3D printing materials using Computed Tomography from 70 to 140 kVp”. In: Frontiers in Bioengineering and Biotechnology 9 (2021). [DOI] [PMC free article] [PubMed] [Google Scholar]
- [17].Jezierska Karolina et al. “The effect of ionising radiation on the physical properties of 3D-printed polymer boluses”. In: Radiation and environmental biophysics 60.2 (2021), pp. 377–381. [DOI] [PMC free article] [PubMed] [Google Scholar]
- [18].Zhang Haozhao et al. “Fabrication of an anthropomorphic heterogeneous mouse phantom for multimodality medical imaging”. In: Physics in Medicine & Biology 63.19 (2018), p. 195011. [DOI] [PubMed] [Google Scholar]
- [19].Patrik Brodin N et al. “Dosimetry Formalism and Implementation of a Homogenous Irradiation Protocol to Improve the Accuracy of Small Animal Whole-Body Irradiation Using a 137Cs Irradiator”. In: Health Physics 110.2 Suppl 1 (Feb. 2016), S26–38. ISSN: 1538–5159. [DOI] [PMC free article] [PubMed] [Google Scholar]
- [20].Kitchen AD et al. “Effect of gamma irradiation on the human immunodeficiency virus and human coagulation proteins”. In: Vox sanguinis 56.4 (1989), pp. 223–229. [DOI] [PubMed] [Google Scholar]
- [21].X-Rad320 X-ray Irradiator. https://precisionxray.com/system/x-rad320/. ”Accessed on 09.14.2022”.
- [22].Micke Andre, Lewis David F, and Yu Xiang. “Multichannel film dosimetry with nonuniformity correction”. In: Medical physics 38.5 (2011), pp. 2523–2534. [DOI] [PubMed] [Google Scholar]
- [23].DOSE INTERPRETATION OF CUSTOMER-IRRADIATED NIST TRANSFER DOSIME-TERS. https://www.nist.gov/programs-projects/calibration-services-high-dose-dosimetry. ”Accessed on 09.12.2022”.
- [24].Desrosiers Marc F, Forney Anne M, and Puhl James M. “A comparison of Harwell & FWT alanine temperature coefficients from 25 C to 80 C”. In: Journal of Research of the National Institute of Standards and Technology 117 (2012), p. 143. [DOI] [PMC free article] [PubMed] [Google Scholar]
- [25].Waldeland Einar and Malinen Eirik. “Review of the dose-to-water energy dependence of alanine and lithium formate EPR dosimeters and LiF TL-dosimeters–comparison with Monte Carlo simulations”. In: Radiation measurements 46.9 (2011), pp. 945–951. [Google Scholar]
- [26].Sarrut David et al. “Advanced Monte Carlo simulations of emission tomography imaging systems with GATE”. In: Physics in Medicine & Biology 66.10 (2021), 10TR03. [DOI] [PMC free article] [PubMed] [Google Scholar]
- [27].Agostinelli S et al. “GEANT4: A Simulation toolkit”. In: Nucl. Instrum. Meth A506 (2003), pp. 250–303. [Google Scholar]
- [28].Allison J et al. Recent developments in Geant4 Nuclear Instruments and Methods in Physics Research Section A: Accelerators, Spectrometers, Detectors and Associated Equipment 835, 186–225. 2016. [Google Scholar]
- [29].Belley Matthew D et al. “Toward an organ based dose prescription method for the improved accuracy of murine dose in orthovoltage x-ray irradiators”. In: Medical physics 41.3 (2014), p. 034101. [DOI] [PMC free article] [PubMed] [Google Scholar]
- [30].Kadri Omrane, Gharbi F, and Farah Khaled. “Monte Carlo improvement of dose uniformity in gamma irradiation processing using the GEANT4 code”. In: Nuclear Instruments and Methods in Physics Research Section B: Beam Interactions with Materials and Atoms 239.4 (2005), pp. 391–398. [Google Scholar]
- [31].Kadri O et al. “Application of GEANT4 code in gamma irradiation processing”. In: Int. J. Theor. Phys 14.1 (2009), pp. 1–15. [Google Scholar]
- [32].Abdel Aziz Ahmed H et al. “Application of (polyaniline/zeolite X) composite as anticorrosion coating for energy recovery devices in RO desalination water plants”. In: International Journal of Industrial Chemistry 10.2 (2019), pp. 175–191. [Google Scholar]
- [33].Bujila Robert, Omar Artur, and Poludniowski Gavin. “A validation of SpekPy: A software toolkit for modelling X-ray tube spectra”. In: Physica Medica 75 (2020), pp. 44–54. [DOI] [PubMed] [Google Scholar]
- [34].Poludniowski Gavin et al. “SpekCalc: a program to calculate photon spectra from tungsten anode x-ray tubes”. In: Physics in Medicine & Biology 54.19 (2009), N433. [DOI] [PubMed] [Google Scholar]
- [35].Segars W Paul and Tsui Benjamin MW. “MCAT to XCAT: The evolution of 4-D computerized phantoms for imaging research”. In: Proceedings of the IEEE 97.12 (2009), pp. 1954–1968. [DOI] [PMC free article] [PubMed] [Google Scholar]
- [36].Valentin Jack. “Basic anatomical and physiological data for use in radiological protection: reference values: ICRP Publication 89”. In: Annals of the ICRP 32.3–4 (2002), pp. 1–277. [PubMed] [Google Scholar]
- [37].Khan Faiz M and Gibbons John. Khan’s The Physics of Radiation Therapy. Vol. 45. 2020. [Google Scholar]
- [38].Hall Eric J and Brenner David J. “The dose-rate effect revisited: radiobiological considerations of importance in radiotherapy”. In: International Journal of Radiation Oncology* Biology* Physics 21.6 (1991), pp. 1403–1414. [DOI] [PubMed] [Google Scholar]
- [39].Rühm W et al. “Dose-rate effects in radiation biology and radiation protection”. In: Annals of the ICRP 45.1 suppl (2016), pp. 262–279. [DOI] [PubMed] [Google Scholar]
- [40].Brooks Antone L, Hoel David G, and Preston R Julian. “The role of dose rate in radiation cancer risk: evaluating the effect of dose rate at the molecular, cellular and tissue levels using key events in critical pathways following exposure to low LET radiation”. In: International journal of radiation biology 92.8 (2016), pp. 405–426. [DOI] [PMC free article] [PubMed] [Google Scholar]
- [41].Down JD et al. “Syngeneic and allogeneic bone marrow engraftment after total body irradiation: dependence on dose, dose rate, and fractionation”. In: Blood 77.3 (Feb. 1991), pp. 661–669. ISSN: 0006–4971. eprint: https://ashpublications.org/blood/article-pdf/77/3/661/604651/661.pdf. [PubMed] [Google Scholar]
- [42].Paunesku Tatjana et al. “Effects of low dose and low dose rate low linear energy transfer radiation on animals–review of recent studies relevant for carcinogenesis”. In: International Journal of Radiation Biology 97.6 (2021), pp. 757–768. [DOI] [PMC free article] [PubMed] [Google Scholar]


