

SUMMARY
The aims of the study were to provide data on chronic kidney disease (CKD) prevalence in rural population and to analyze the association with cardiovascular risk factors and aging. A random sample of 2193 farmers (1333 female (F) and 860 male (M), mean age 50.61±17.12) were enrolled. Questionnaire and clinical examination were conducted. Participants provided a spot urine and fasting blood sample. Estimated glomerular filtration rate (eGFR) was estimated using Chronic Kidney Disease Epidemiology Collaboration (CKD-EPI) equation. Subjects were classified according to the KDIGO guidelines. The overall prevalence of CKD (eGFR <60 mL/min/1.73 m2) was 8.83% (F vs. M 9.9% vs. 6.3%; p<0.001). Albuminuria (albumin-to-creatinine ratio >30 mg/g) was found in 8.45% (F vs. M p>0.05). Sharp increase in CKD prevalence was found to begin after the sixth decade (29.44% in subjects older than 65 years; F vs. M 30.9% vs. 26.8%; p<0.01). The strongest predictor factors for CKD were age >65 years (OR 22.12), hypertension (OR 6.53), albuminuria (OR 5.71), fasting blood glucose >7 mmol/L (OR 5.49), diabetes (OR 3.07), abdominal obesity (OR 2.05) and non-smoking (OR 0.41). In multivariate analysis, age (OR 1.13), female gender (OR 0.60) and diabetes (OR 1.75) were the independent predictor factors for CKD. In conclusion, CKD prevalence is high in rural population, being higher in women than in men. In both genders, eGFR significantly decreased with aging. Aging is a significant independent predictor of CKD.
Key words: Chronic kidney disease, Prevalence, Aging, Albuminuria, Epidemiology
Introduction
Chronic kidney disease (CKD) is one of the major global health burdens due to the high prevalence and associated risk of end-stage renal disease (ESRD). In addition, CKD is an independent risk factor for cardiovascular disease and premature deaths (1, 2). A recent meta-analysis reports on the age standardized global prevalence of CKD of 10.4% in men and 11.8% in women (2). According to the Global Burden of Disease Study, 956,200 deaths worldwide were caused by CKD. Importantly, an increase of 134.6% was observed between 1990 and 2013 (3). An increasing trend was also observed in CKD prevalence. The American National Health and Nutrition Examination Survey found the prevalence of CKD stages 1 to 4 to be significantly higher in the 1999-2004 period as compared with the 1988-1994 period (13.1% vs. 10%) (4). A cut-off of estimated glomerular filtration rate (eGFR) <60 mL/min/1.73 m2 was determined for defining CKD in an adult of any age and gender if persisting for at least 3 months of observation (5). It is recommended to use serum creatinine concentration to estimate GFR and transform it using the Chronic Kidney Disease Epidemiology Collaboration (CKD-EPI) equation (6). CKD is associated with enormous economic and financial burden. It has been estimated that high-income countries spend more than 2%-3% of annual health care budget for this disorder (7). Interestingly and importantly, total costs of the treatment of milder forms of CKD are much higher than total costs of treating ESRD. For instance, Medicare expenditures were 64 billion and 34 billion United States dollars for CKD and ESRD, respectively (8). The high prevalence of CKD is a consequence of the worldwide epidemics of hypertension, diabetes, and obesity. In addition, aging of the population contributes to this increased burden of CKD (9). As Glassock et al. underline, “graying of the globe” is a common mantra to describe the ever-growing segment of the world’s population (10). The prevalence of CKD defined as eGFR <60 mL/min/1.73 m2 significantly increases with aging (11-14). However, normal kidney senescence should be considered as GFR decline by about 6 to 7 mL/min/1.73 m2 per decade starting after age 35 to 40 years (15-17). Despite the fact that CKD is a global health concern, data on the prevalence of CKD and its association with risk factors in Croatia are lacking. Thus, the aim of our study was to provide data on CKD prevalence estimates according to the KDIGO recommendation in our rural population and to analyze its association with cardiovascular risk factors.
Patients, Materials and Methods
Patient data
This cross-sectional observational study (ENAH study) included 2,523 inhabitants from a rural area in the inland part of Croatia. All farmers older than 18 years were invited to participate and were examined on a door-to-door basis. Participation rate was 83%. Pregnant women, patients with terminal illness who were bed-ridden, patients with severe disability or those who had at least one limb amputated or immobilized, as well as mentally ill or those suffering from dementia were considered ineligible to enter the study protocol. Of the 2,523 subjects enrolled, some key data elements were missing in 330 subjects, and finally analysis was performed on a total of 2,193 villagers (860 men and 1333 women). Out of them 1,656 subjects provided first and second morning urine sample; 126 subjects were excluded because of unreliable urine specimens (specific gravity <1.002 or >1.030) and 30 because of acute urinary tract infection; thus, data on albuminuria were analyzed in 1500 subjects. Data collection including epidemiological questionnaire, medical history and clinical examination was conducted in participant homes by physicians and trained nurses. All study personnel were trained to collect survey and clinical information in a standardized manner. Participants completed an extensive survey, provided a spot urine and fasting blood sample. Body weight and height were measured and body mass index (BMI) was calculated. Abdominal obesity was defined as waist circumference >102 cm for male and >88 cm for female. Blood pressure was measured three times on the non-dominant arm by an Omron M6 device as per ESH/ECS guidelines. Hypertension was defined as blood pressure ≥140/90 mm Hg and/or use of antihypertensive drugs. Diabetes was defined as fasting blood glucose >7 mmol/L and/or use of antidiabetic drugs. CKD was defined as eGFR <60 mL/min/1.73 m2; CKD stages were classified according to the Kidney Disease Improving Global Outcomes guidelines (KDIGO) (5), as follows: stage 1 GFR = >90 mL/min/1.73 m2; stage 2 GFR = 60-89 mL/min/1.73 m2; stage 3A GFR = 45-59 mL/min/1.73 m2; stage 3B GFR = 30-44 mL/min/1.73 m2; stage 4 GFR = 15-29 mL/min/1.73 m2; and stage 5 GFR = <15 mL/min/1.73 m2. Albuminuria was defined as albumin-to-creatinine ratio (ACR) >30 mg/g. The study was approved by the Ethics Boards of the School of Medicine, University of Zagreb, National Institute of Public Health and Dr. Josip BenËeviÊ General Hospital, and all participants gave their written informed consent.
Methods
Fasting blood and morning urine samples were analyzed by using standard laboratory methods. About 15 mL of venous blood (4 mL in K2EDTA, blood collection tube for red blood cell count (RBC) and 8.5 mL in tube with Silica Clot Activator-SST for biochemistry tests; BD Diagnostic, Sparks, MD, USA) and 50 mL morning urine sample were collected in plastic container for each subject. Blood samples were centrifuged for 10 minutes at 3500 rpm within 2 hours of collection. All samples were transported the same day to the Department of Laboratory Diagnostics, Zagreb University Hospital Center, where they were analyzed immediately. RBC was determined according to the principle of laser light scattering technology on Cell Dyn Sapphire (Abbott Diagnostics, IL, USA) and Sysmex XE 5000 (Sysmex Europe GmbH, Norderstedt, Germany) analyzers. Serum creatinine and urine creatinine were measured on an Olympus 2700 analyzer using the Jaffé kinetic uncompensated method with continuous measurement (Beckman-Coulter, CA, USA). Calibration was performed using the same company calibrators traceable to IDMS method and Standard Reference Material (SRM) 909B, level 2, National Institute of Standards and Technology (NIST, USA) for serum and the NIST reference material SRM 914a (substance creatinine purity of 99.7±0.3%) for urine samples. Continuous internal quality control was performed throughout the study using quality control materials provided by the respective manufacturers. For CKD staging, urine albumin (U-Alb) was measured in the first morning sample by immunonephelometric assay (BN II nephelometer, Siemens Healthcare Diagnostics Inc., Tarrytown, NY, USA) standardized using primary ERM-DA470 calibrators with a method sensitivity of 3.0 mg/L. eGFR (mL/min/1.73 m2) was calculated by applying serum creatinine to CKD-EPI equations:
| Gender | Serum creatinine level (µmol/L) |
CKD-EPI equation (mL/min/1.73 m2) |
|---|---|---|
| Female | ≤62 | GFR = 144 x (Scr/0.7)-0.329 x (0.993)Age |
| >62 | GFR = 144 x (Scr/0.7)-1.209 x (0.993)Age |
|
| Male | ≤80 | GFR = 141 x (Scr/0.9)-0.411 x (0.993)Age |
| >80 | GFR = 141 x (Scr/0.9)-1.209 x (0.993)Age |
Statistical analysis
Statistical analysis was performed using SPSS version 23.0 (IBM Corp., USA). The normality of data distribution was tested using Kolmogorov-Smirnov test. Preliminary analyses were performed to ensure no violation of the assumptions of normality, linearity and homoscedasticity. Categorical data were expressed as numbers and frequencies. Correlations were obtained using Pearson’s test for normally distributed variables and Spearman rank correlation for non-normally distributed variables. Normally distributed variables were presented as means ± standard deviation and Student’s t-test for independent samples was used for comparisons between two groups. Non-normally distributed data were expressed as median and interquartile range and Mann-Whitney U-test was used on comparison between two groups. Categorical variables were compared using χ2-test. Univariate and multivariate logistic regression analyses were used to determine association between parameters and CKD. The level of statistical significance was set at p<0.05 (two-sided test).
Results
Characteristics of the study population are presented in Table 1. The mean age of the study population was 50.61±17.12 years. Only 38.53% of the population had BMI <25 kg/m2 and even 27.7% had BMI >30 kg/m2. Visceral obesity was detected in 24.15% of study subjects. Hypertension and diabetes were diagnosed in 55.18% and 12.63%, respectively. More than a quarter of the population (27.7%) were smokers. Women were older and more women than men were obese and had hypertension, while more men were current and ex-smokers in the whole group, as well as in the subgroup of subjects older than 65 years. Characteristics of the population older than 65 are shown in Table 2. The mean age of subjects older than 65 was 72.89±5.44 years. Obesity, visceral obesity, hypertension and diabetes were diagnosed in 30.31%, 40.77%, 87.46% and 19.86% of study subjects, respectively (Table 2). There were more obese women than obese men in older subgroup (37.4% vs. 17.4%). The overall prevalence of CKD (eGFR <60 mL/min/1.73 m2) was 8.83% and it was higher in women than in men (9.9% vs. 6.3%; p<0.001). Albuminuria was found in 8.45% of subjects without difference between men and women. The prevalence of CKD was significantly higher in subjects older than 65 (29.44%), and in this subgroup more women than men had eGFR <60 mL/min/1.73 m2 (30.9% vs. 26.8%; p<0.01). In older subjects, albuminuria was more present in men than in women (13.86% vs. 11.02%; p<0.001). The prevalence of CKD defined as eGFR <60 mL/min/1.73 m2 increased with aging both in men and women. A sharp increase in CKD prevalence began after the sixth decade, being higher in women than in men (Fig. 1A). Significant increase in the prevalence of albuminuria was observed after the seventh decade, being higher in men than in women (Fig. 1B). Table 3A shows unadjusted associations between demographic and clinical characteristics of the subjects and CKD defined as eGFR <60 mL/min/1.73 m2. The strongest predictor factors were age >65 years (OR 22.12), hypertension (OR 6.53), albuminuria (OR 5.71), fasting blood glucose >7 mmol/L (OR 5.49), diabetes (OR 3.07), abdominal obesity (OR 2.05) and non-smoking status (OR 0.41). Table 3B shows results of the same analyses for subjects older than 65. The strongest predictor factors in this subgroup were albuminuria (OR 2.49), fasting blood glucose >7 mmol/L (OR 2.43) and age (OR 1.13). On multivariate analysis, the independent predictor factors that remained in the model were age (OR 1.13), female gender (OR 0.60) and diabetes (OR 1.75), whereas in the subgroup of subjects older than 65 only age (OR 1.13) was the independent predictor of CKD (Table 4).
Table 1. Demographic and clinical characteristics of the whole group.
| Parameter | Whole group | Men | Women | p |
|---|---|---|---|---|
| %, (N) | 2193 | 39.3 (860) | 60.7 (1333) | |
| Age, years | 50.61±17.12 | 47.58±16.83 | 50.54±18.45 | <0.001 |
| Body weight, kg | 78.14±16.43 | 84.84±15.11 | 73.38±15.95 | <0.001 |
| Body height, cm | 168.26±9.78 | 176.4±7.69 | 162.99±7.3 | <0.001 |
| BMI, kg/m2 | 27.64±5.43 | 27.31±4.51 | 27.67±5.96 | 0.127 |
| BMI <25, % BMI 25-30, % BMI ≥30, % |
38.53 33.7 27.7 |
37.72 43.55 25.43 |
40.59 29.11 30.31 |
<0.001 |
| WC, cm | 94.51±13.93 | 97.19±11.91 | 92.71±14.99 | <0.001 |
| Abdominal obesity, % | 24.15 | 21.98 | 25.54 | <0.001 |
| Systolic blood pressure, mm Hg | 138.23±24.57 | 139.44±22.16 | 137.32±26.17 | 0.054 |
| Diastolic blood pressure, mm Hg | 82.74±12.73 | 83.04±12.4 | 82.29±13.13 | 0.208 |
| Hypertension, % | 55.18 | 52.21 | 57.1 | <0.001 |
| Diabetes, % | 12.63 | 12.21 | 12.9 | 0.681 |
| Current smokers, % Ex-smokers, % |
27.7 12.73 |
37.4 21.73 |
21.3 6.78 |
<0.001 |
| Pack/years | 15 (5-32) | 20 (10-39.5) | 6.75 (2.75-20) | <0.001 |
| Fasting blood glucose, mmol/L | 5.53±1.6 | 5.54±1.43 | 5.52±1.69 | 0.791 |
| Total cholesterol, mmol/L | 5.66±1.2 | 5.65±1.23 | 5.66±1.2 | 0.798 |
| HDL cholesterol, mmol/L | 1.56±0.38 | 1.48±0.4 | 1.61±0.37 | 0.001 |
| LDL cholesterol, mmol/L | 3.43±1.04 | 3.46±1.12 | 3.41±1.0 | 0.398 |
| Triglycerides, mmol/L | 1.59±1.37 | 1.76±1.80 | 1.47±0.94 | 0.001 |
| Serum creatinine, µmol/L | 80.41±25.31 | 92.82±45.63 | 74.94±34.24 | 0.001 |
| eGFR CKD-EPI | 85.90±19.14 | 87.72±18.05 | 84.61±19.36 | 0.001 |
| CKD prevalence % | 8.8 | 6.3 | 9.9 | 0.001 |
| eGFR ≥90 mL/min/1.73 m2 | 42.5 | 47.2 | 39.5 | |
| eGFR 60-89 mL/min/1.73 m2 | 48.7 | 45.6 | 50.6 | |
| CKD stage 3A eGFR 45-59 mL/min/1.73 m2 |
5.8 | 5.1 | 6.3 | |
| CKD stage 3B eGFR 30-44 mL/min/1.73 m2 |
2.2 | 1 | 2.9 | |
| CKD stage 4 eGFR 15-29 mL/min/1.73 m2 |
0.5 | 0.6 | 0.5 | |
| CKD stage 5 eGFR ≤15 mL/min/1.73 m2 |
0.3 | 0.5 | 0.2 | |
| ACR mg/g | 22.02±110.93 | 24.04±132.65 | 20.74±94.75 | 0.001 |
| Albuminuria, % | 8.45 | 8.42 | 8.49 | 0.116 |
BMI = body mass index; WC = waist circumference; HDL = high density lipoprotein; LDL = low density lipoprotein; eGFR= estimated glomerular filtration rate; CKD-EPI = Chronic Kidney Disease Epidemiology Collaboration equation; CKD = chronic kidney disease; ACR = albumin-to-creatinine ratio
Table 2. Demographic and clinical characteristics of subjects older than 65 years.
| Parameter | Whole group | Men | Women | p |
|---|---|---|---|---|
| %, (N) | 574 | 35.1 (202) | 64.2 (372) | |
| Age, years | 72.89±5.44 | 72.86±5.27 | 74.15±6.11 | 0.005 |
| Body weight, kg | 75.64±14.96 | 79.45±13.88 | 72.91±15.49 | <0.001 |
| Body height, cm | 163.1±9.54 | 171.86±8.33 | 158.34±6.69 | <0.001 |
| BMI, kg/m2 | 28.45±5.53 | 26.95±4.82 | 29.03±5.78 | <0.001 |
| BMI <25, % (n) BMI 25-30, % (n) BMI ≥30, % (n) |
34.49 35.19 30.31 |
37.6 45 17.4 |
32.8 29.8 37.4 |
<0.001 |
| WC, cm | 99.28±13.7 | 100.01±11.99 | 98.41±14.77 | 0.269 |
| Abdominal obesity, % | 40.77 | 24.75 | 49.46 | <0.001 |
| SBP, mm Hg | 155.64±25.62 | 154.91±23.82 | 155.26±26.26 | 0.876 |
| DBP, mm Hg | 85.91±13.98 | 84.48±13.53 | 86.7±13.94 | 0.068 |
| Hypertension, % | 87.46 | 82.7 | 90.1 | <0.015 |
| Diabetes, % | 19.86 | 16.83 | 21.51 | 0.218 |
| Current smokers, % Ex-smokers, % |
8.19 40.07 |
17.82 28.71 |
2.96 1.61 |
<0.001 |
| Pack years | 34.5 (20-70) | 40 (21.5-70) | 22.5 (7.75-60) | <0.001 |
| Fasting blood glucose, mmol/L | 6.18±2.03 | 6.17±2.13 | 6.19±1.98 | 0.923 |
| Total cholesterol, mmol/L | 5.94±1.21 | 5.69±1.11 | 6.07±1.24 | 0.003 |
| HDL cholesterol, mmol/L | 1.59±0.43 | 1.55±0.42 | 1.62±0.44 | 0.133 |
| LDL cholesterol, mmol/L | 3.61±1.03 | 3.49±0.97 | 3.67±1.05 | 0.105 |
| Triglycerides, mmol/L | 1.65±0.85 | 1.48±0.84 | 1.73±0.84 | 0.006 |
| Serum creatinine, µmol/L | 91.02±59.54 | 106.84±79.43 | 82.43±42.99 | 0.001 |
| eGFR CKD EPI | 67.31±16.55 | 68.94±17.19 | 66.41±16.16 | 0.080 |
| CKD prevalence % (n) | 29.44 | 26.8 | 30.9 | 0.01 |
| eGFR ≥90 mL/min/1.73 m2 | 5.05 | 7.4 | 3.8 | |
| eGFR 60-89 mL/min/1.73 m2 | 65.51 | 65.8 | 65.3 | |
| CKD stage 3A eGFR 45-59 mL/min/1.73 m2 |
16.16 | 19.8 | 18.8 | |
| CKD stage 3B eGFR 30-44 mL/min/1.73 m2 |
7.49 | 3 | 9.9 | |
| CKD stage 4 eGFR 15-29 mL/min/1.73 m2 |
2.09 | 2.5 | 1.9 | |
| CKD stage 5 eGFR ≤15 mL/min/1.73 m2 |
0.7 | 1.5 | 0.3 | |
| ACR mg/g | 40.88±131.71 | 54.89±184.03 | 33.84±94.91 | 0.05 |
| Albuminuria, % | 12.02 | 13.86 | 11.02 | 0.001 |
BMI = body mass index; SBP = systolic blood pressure; DBP = diastolic blood pressure; WC = waist circumference; HDL = high density lipoprotein; LDL = low density lipoprotein; eGFR= estimated glomerular filtration rate; CKD-EPI = Chronic Kidney Disease Epidemiology Collaboration equation; CKD = chronic kidney disease; ACR = albumin-to-creatinine ratio
Fig. 1.
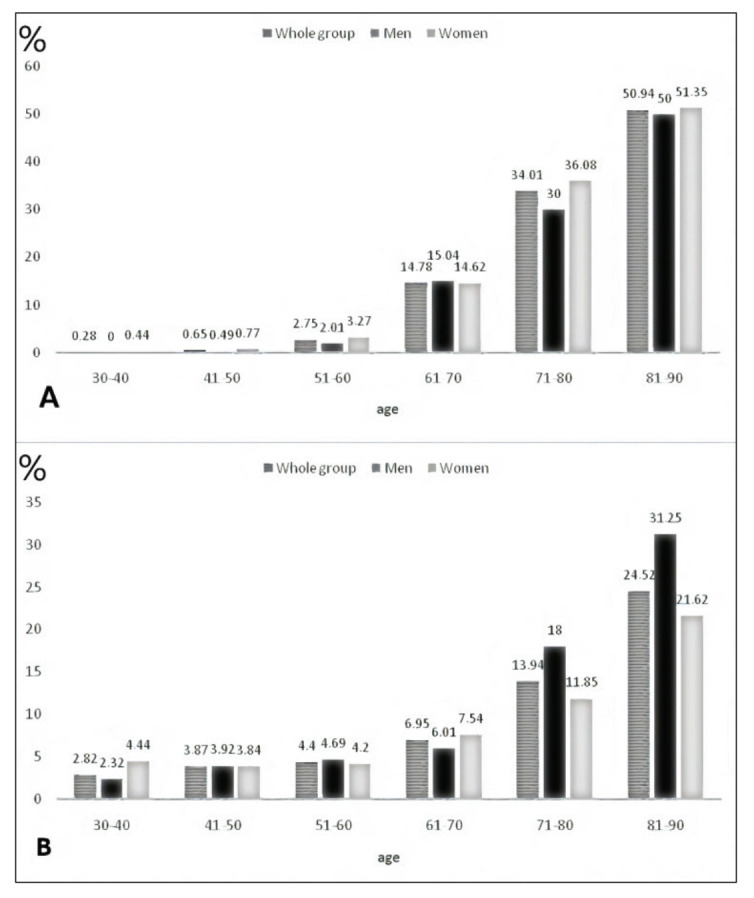
Prevalence of chronic kidney disease defined as estimated glomerular filtration rate (eGFR) <60 mL/min/1.73 m2 (A) and albuminuria (B) according to age groups.
Table 3A. Unadjusted associations between demographic or clinical characteristics and presence of chronic kidney disease (eGFR <60 mL/min/1.73 m2) in the whole group.
| Parameter | OR (95% CI) | p |
|---|---|---|
| Age >65 vs. <65 years | 22.12 (14.69-33.31) | <0.0001 |
| Age 40-65 vs. <40 years | 15.36 (2.07-113.82) | 0.0075 |
| Hypertension vs. normotension | 6.53 (4.22-10.10) | <0.0001 |
| Diabetes vs. absence | 3.07 (2.18-4.33) | <0.0001 |
| ACR >30 mg/g vs. <30 mg/g | 5.71 (3.79-8.59) | <0.0001 |
| Glucose >7 mmol/L vs. <7 mmol/L | 5.49 (3.62-8.31) | <0.0001 |
| Abdominal obesity vs. absence | 2.05 (1.42-2.95) | 0.0001 |
| Triglycerides >2.26 mmol/L vs. <2.26 mol/L | 1.90 (1.27-2.86) | 0.002 |
| Age, years | 1.15 (1.13-1.17) | <0.0001 |
| BMI, kg/m2 | 1.05 (1.02-1.08) | 0.0003 |
| WC, cm | 1.03 (1.02-1.04) | <0.0001 |
| SBP, mm Hg | 1.02 (1.01-1.02) | <0.0001 |
| Smokers vs. ex- or non-smokers | 0.41 (0.25-0.65) | 0.0002 |
| Gender, men vs. women | 0.67 (0.49-0.92) | 0.0138 |
BMI = body mass index; WC = waist circumference; eGFR= estimated glomerular filtration rate; CKD = chronic kidney disease; ACR = albumin-to-creatinine ratio; SBP= systolic blood pressure; DBP = diastolic blood pressure
Table 3B. Unadjusted associations between demographic or clinical characteristics and presence of chronic kidney disease (eGFR <60 mL/min/1.73 m2) in subjects older than 65.
| Parameter | OR (95% CI) | p |
|---|---|---|
| Age, years | 1.13 (1.09-1.18) | <0.0001* |
| DBP, mm Hg | 0.99 (0.97-1) | 0.0512 |
| ACR >30 mg/g vs. <30 mg/g | 2.49 (1.49-4.15) | 0.0005* |
| Glucose >7 mmol/L vs. <7 mmol/L | 2.43 (1.47-4.02) | 0.0005* |
| Triglycerides >2.26 mmol/L vs. <2.26 mmol/L | 1.78 (1.05-3.02) | 0.0314* |
| Diabetes vs. absence | 2.14 (1.4-3.27) | 0.0005* |
eGFR= estimated glomerular filtration rate; DBP = diastolic blood pressure; ACR = albumin-to-creatinine ratio; OR = odds ratio; 95% CI = 95% confidence interval; *p<0.05
Table 4. Independent predictors of chronic kidney disease (eGFR <60 mL/min/1.73 m2) in the multivariate logistic regression model.
| Parameter | OR (95% CI) | p |
|---|---|---|
|
Whole group Age, years Gender, men vs. women Diabetes vs. absence |
1.13 (1.1-1.17) 0.60 (0.31-0.92) 1.75 (1.01-3.05) |
<0.0001* 0.01376 0.0477* |
|
Older than 65 years Age, years Diabetes vs. absence |
1.13 (1.09-1.17) 1.82 (0.97-3.44) |
<0.0001* 0.0634 |
OR = odds ratio; 95% CI = 95% confidence interval; *p<0.05
Discussion
To our knowledge, this study is the first epidemiological survey on the prevalence of CKD using GFR estimated by CKD-EPI equation in adult Croatian population. The prevalence of CKD found in our study (8.8%) is in agreement with meta-analyses of epidemiological studies around the world (7.2%) (18). Recently, Hill et al. have reported on the CKD prevalence of 10.6% in the sixty-eight populations measuring CKD stages 3 to 5 (1). In this analysis, the CKD prevalence breakdown by stages was 7.6%, 0.4% and 0.1% for the CKD stage 3, 4 and 5, respectively (1). This is completely in agreement with our results where we found the prevalence of CKD stages 3, 4 and 5 to be 8.0%, 0.5% and 0.3%, respectively. In our cohort, the prevalence of CKD stages 3-5 was higher in women than in men (9.9% vs. 7.2%), which is in line with previous reports. In the systematic analysis of worldwide population-based data on the global burden of CKD in 2010, Mills et al. report on the CKD prevalence to be higher in women than in men (11.8% vs. 10.4%), with the same pattern observed in the high-income (9.6% vs. 8.6%) and low- and middle-income countries (12.5% vs. 10.6%) (2). Hills et al. observed the same results on the higher CKD prevalence in women than in men globally and when only CKD stages 3-5 were taken into account (14.6% vs. 12.8% and 12.1% vs. 8.1%, respectively) (1). The prevalence of CKD increased with age in our cohort, as also reported by all other authors (1, 2). In our group, a sharp increase in CKD prevalence was observed between the 5th and 6th decade of life (2.75% to 14.78%), as shown in Figure 1A. This rise was recorded both in men and in women (2.01% to 15.04% and 3.27% to 14.62%, respectively). A similar rise, although a decade earlier, was found in the systematic analyses conducted by Mills et al. for both men and women (3.0% to 9.7% and 4.0% to 13.1%, respectively) (2). There was no difference in CKD prevalence between men and women in younger age groups, but starting from the 7th decade of life, women had a significantly higher prevalence than men (36.08% vs. 30%). Mills et al. found that this pattern of age-related increase in CKD prevalence in both genders was consistent in high-income and low- and middle-income countries (2). A significant decline in GFR with aging in apparently healthy individuals was found by many authors (19-24). In healthy individuals aged 70-75 years, kidney contains 500,000 nephrons per kidney as compared with 1,000,000 nephrons per kidney in healthy adults aged 18-29 years (17). Thus, normal kidney senescence substantially contributes to GFR decline with aging. As shown in Table 2, CKD prevalence of 26.7% was found in the age subgroup of subjects older than 65, which is in concordance with the results from the Spain EPIRCE study (25.8%) and comparable to the reports from other European countries (25-27). In the older subgroup, CKD prevalence was higher in women than men (30.9% vs. 26.8%). It is acknowledged that high CKD prevalence, which is growing worldwide, is attributed mostly to the increase in diabetes, hypertension and obesity. In the systematic review and meta-analysis, Hill et al. found that the mean population age, prevalence of diabetes, prevalence of hypertension but not average BMI or prevalence of obesity were associated with CKD prevalence (1). The presence of smoking was associated with a decrease in the prevalence of CKD. In our cohort, univariate analyses showed albuminuria, fasting blood glucose >7 mmol/L, age and non-smoking status as the strongest predictors of CKD, while Otero et al. found age, obesity and previously diagnosed hypertension as the three independent predictors of CKD (25). Difference between our cohort and others could be explained with differences in several demographic and clinical characteristics in various study groups. For instance, there were significantly more hypertensive and diabetic patients in our group as compared with the Spain cohort (25). However, positive association of age and prevalence of CKD is common to all studies. Albuminuria is another marker of kidney damage which is acknowledged as a risk factor for the progression of CKD and cardiovascular diseases. The overall prevalence of albuminuria in our cohort was 8.45% with no gender differences, which is in line with the NHANES report, where the prevalence of 9.8% was found in adults aged ≥40 (28). Gradual increase of albuminuria was observed with aging. As found in the NHANES survey, the prevalence of microalbuminuria was 4.2%, 4.2% and 13.3% in the 40-49, 50-69 and >70 age groups, respectively. In our cohort, in the same age groups we observed very similar prevalence of microalbuminuria of 3.87%, 4.4% and 13.94%, respectively. Neither NHANES authors nor we found difference in the prevalence of albuminuria between men and women in total. However, NHANES authors found that there was difference with aging, with women > men in the 4th decade, men > women in the 5th and 6th decades, and then becoming equal at the age ≥70. In our cohort, as shown in Figure 1B, there was a difference with women > men in the 6th decade and men > women in the 7th and 8th decades of life.
Our study had several limitations. The first and most important one was the use of single measurements for laboratory tests, which prevented us to determine chronicity. According to the KDIGO guideline, the functional or structural disorder should last for >3 months before definition of CKD could be established. It should be remembered that serum creatinine concentrations are highly variable within individuals, up to 21% within a 2-week period (29). Nevertheless, the majority of studies which were included in the last systematic reports and meta-analyses had the same limitation. The same holds true for determination of albuminuria. However, in our cohort, we included only subjects with reliable urine samples, which was not always the case in other studies. That makes our results more reliable. Third, we used CKD-EPI equation in the elderly being aware that this formula was not validated in this population subgroup. However, most other authors did the same. Using BIS1 equation, which is validated in subjects older than 70, might provide different and probably more accurate results. This should be taken into account in further studies. Fourth, this was a sub-national study where only part of the rural population from inland Croatia were enrolled. Thus, these data should not be extrapolated to the whole population and nation-wide surveys on the CKD prevalence in Croatia are warranted. The strength of our study was a large sample size with a very good participation rate.
Our results are in agreement with the data published by other authors. The prevalence of CKD determined by CKD-EPI equation and using single creatinine measurement with cut-off eGFR value <60 mL/min/1.73 m2 is high in rural population with women being affected more than men. As observed by many authors, we also found older age, hypertension, diabetes, visceral obesity and non-smoking status as predictors of CKD. The CKD prevalence increased with aging in both genders and aging was the most important independent determinant of CKD. The question whether and when decreased eGFR in the elderly could be considered a disease and when this is only a biomarker of healthy aging is to be answered by further studies. Nevertheless, decreased GFR in the elderly should be considered a risk factor for contrast induced nephropathy and must be taken into account for proper drug dosing. However, for correct diagnosing of CKD and more precise estimation of CKD prevalence, we might use various equations in different subpopulations (for instance, BIS equations for the elderly), and/or as suggested by Delanaye et al., we should start using age-adapted definition of CKD (30, 31).
Acknowledgment
This study was supported by a grant from the Croatian Ministry of Science for the research project entitled Endemic Nephropathy in Croatia: Epidemiology, Diagnosis, Etiology (108-0000000329). The authors would like to thank the participants, local physicians and nurses for their support and help.
References
- 1.Hill NR, Fatoba ST, Oke JL, Hirst JA, O’Callaghan CA, Lasserson DS, et al. Global prevalence of chronic kidney disease – a systematic review and meta-analysis. PLoS One. 2016;11(7):e0158765. 10.1371/journal.pone.0158765 [DOI] [PMC free article] [PubMed] [Google Scholar]
- 2.Mills KT, Xu Y, Zhang W, Bundy J, Chen Ch, Kelly T, et al. A systematic analysis of world-wide population-based data on the global burden of chronic kidney disease in 2010. Kidney Int. 2015;88(5):950–7. 10.1038/ki.2015.230 [DOI] [PMC free article] [PubMed] [Google Scholar]
- 3.Chronic Kidney Disease Prognosis Consortium , Matsushita K, Van der Velde M, et al. Association of estimated glomerular filtration rate and albuminuria with all-cause and cardiovascular mortality in general population cohorts: a collaborative meta-analysis. Lancet. 2010;375(9731):2073–81. 10.1016/S0140-6736(10)60674-5 [DOI] [PMC free article] [PubMed] [Google Scholar]
- 4.Coresh J, Selvin E, Stevens LA, Manzi J, Kusek JW, Eggers P, et al. Prevalence of chronic kidney disease in the United States. JAMA. 2007;298(17):2038–47. 10.1001/jama.298.17.2038 [DOI] [PubMed] [Google Scholar]
- 5.Kidney Disease Improving Global Outcomes (KDIGO) CKD Work Group . KDIGO 2012 Clinical Practice Guideline for the evaluation and management of chronic kidney disease. Kidney Int Suppl. 2013;3:1–150. 10.7326/0003-4819-158-11-201306040-00007 [DOI] [Google Scholar]
- 6.Levey AS, Stevens LA, Schmid CH, Zhang YL, Castro AF, 3rd, Feldman HI, et al. A new equation to estimate glomerular filtration rate. Ann Intern Med. 2009;150(9):604–12. 10.7326/0003-4819-150-9-200905050-00006 [DOI] [PMC free article] [PubMed] [Google Scholar]
- 7.Liyanage T, Ninomiya T, Jha V, Neal B, Patrice HM, Okpechi I, et al. Worldwide access to treatment for end-stage kidney disease: a systematic review. Lancet. 2015;385(9981):1975–82. 10.1016/S0140-6736(14)61601-9 [DOI] [PubMed] [Google Scholar]
- 8.Chapter 9: Healthcare expenditures for persons with ESRD [Internet]. Ann Arbor: United States Renal Data System; 2017. Available from: https://www.usrds.org/2017/view/v2_09.aspx.
- 9.Jha V, Garcia-Garcia G, Iseki K, Li Z, Naicker S, Plattner B, et al. Chronic kidney disease: global dimension and perspectives. Lancet. 2013;382:260–72. 10.1016/S0140-6736(13)60687-X [DOI] [PubMed] [Google Scholar]
- 10.Glassock RJ, Delanaye P, Rule A. Should the definition of CKD be changed to include age-adapted GFR criteria? Yes. Kidney Int. 2020;97(1):34–7. 10.1016/j.kint.2019.08.033 [DOI] [PubMed] [Google Scholar]
- 11.Astor BC, Matsushita K, Gansevoort RT, Van der Velde M, Woodward M, Levey AS, et al. Lower estimated glomerular filtration rate and higher albuminuria are associated with mortality and end-stage renal disease: a collaborative meta-analysis of kidney disease population cohorts. Kidney Int. 2011;79(12):1331–40. 10.1038/ki.2010.550 [DOI] [PMC free article] [PubMed] [Google Scholar]
- 12.Benghanem Gharbi M, Elseviers M, Zamd M, Belghiti Alaoui A, Benahadi N, Trabelssi EH, et al. Chronic kidney disease, hypertension, diabetes, and obesity in the adult population of Morocco: how to avoid “over”- and “under”-diagnosis of CKD. Kidney Int. 2016;89(6):1363–71. 10.1016/j.kint.2016.02.019 [DOI] [PubMed] [Google Scholar]
- 13.Gansevoort RT, Correa-Rotter R, Hemmelgarn BR, Jafar TH, Lambers Heerspink HJ, Mann JF, et al. Chronic kidney disease and cardiovascular risk: epidemiology, mechanisms, and prevention. Lancet. 2013;382(9889):339–52. 10.1016/S0140-6736(13)60595-4 [DOI] [PubMed] [Google Scholar]
- 14.Ebert N, Jakob O, Gaedeke J, Van Der Giet M, Kuhlmann MK, Martus P, et al. Prevalence of reduced kidney function and albuminuria in older adults: the Berlin Initiative Study. Nephrol Dial Transplant. 2017;32(6):997–1005. 10.1093/ndt/gfw079 [DOI] [PubMed] [Google Scholar]
- 15.Denic A, Mathew J, Lerman LO, Lieske JC, Larson JJ, Alexander MP, et al. Single-nephron glomerular filtration rate in healthy adults. N Engl J Med. 2017;376(24):2349–57. 10.1056/NEJMoa1614329 [DOI] [PMC free article] [PubMed] [Google Scholar]
- 16.Denic A, Ricaurte L, Lopez CL, Narasimhan R, Lerman LO, Lieske JC, et al. Glomerular volume and glomerulosclerosis at different depths within the human kidney. J Am Soc Nephrol. 2019;30:1471–80. 10.1681/ASN.2019020183 [DOI] [PMC free article] [PubMed] [Google Scholar]
- 17.Denic A, Lieske JC, Chakkera HA, Poggio ED, Alexander MP, Singh P, et al. The substantial loss of nephrons in healthy human kidneys with aging. J Am Soc Nephrol. 2017;28(1):313–20. 10.1681/ASN.2016020154 [DOI] [PMC free article] [PubMed] [Google Scholar]
- 18.Zhang QL, Rothenbacher D. Prevalence of chronic kidney disease in population-based studies: systematic review. BMC Public Health. 2008;8:117. 10.1186/1471-2458-8-117 [DOI] [PMC free article] [PubMed] [Google Scholar]
- 19.Malmgren L, McGuigan FE, Berglundh S, Westman K, Christensson A, Åkesson K. Declining estimated glomerular filtration rate and its association with mortality and comorbidity over 10 years in elderly women. Nephron. 2015;130(4):245–55. 10.1159/000435790 [DOI] [PubMed] [Google Scholar]
- 20.Baba M, Shimbo T, Horio M, Ando M, Yasuda Y, Komatsu Y, et al. Longitudinal study of the decline in renal function in healthy subjects. PLoS One. 2015;10(6):e0129036. 10.1371/journal.pone.0129036 [DOI] [PMC free article] [PubMed] [Google Scholar]
- 21.Lindeman RD, Tobin J, Shock NW. Longitudinal studies on the rate of decline in renal function with age. J Am Geriatr Soc. 1985;33(4):278–85. 10.1111/j.1532-5415.1985.tb07117.x [DOI] [PubMed] [Google Scholar]
- 22.Kasiske BL, Anderson-Haag T, Israni AK, Kalil RS, Kimmel PL, Kraus ES, et al. A prospective controlled study of living kidney donors: three-year follow-up. Am J Kidney Dis. 2015;66(1):114–24. 10.1053/j.ajkd.2015.01.019 [DOI] [PMC free article] [PubMed] [Google Scholar]
- 23.Cohen E, Nardi Y, Krause I, Goldberg E, Milo G, Garty M, et al. A longitudinal assessment of the natural rate of decline in renal function with age. J Nephrol. 2014;27(6):635–41. 10.1007/s40620-014-0077-9 [DOI] [PubMed] [Google Scholar]
- 24.O’Sullivan ED, Hughes J, Ferenbach DA. Renal aging: causes and consequences. J Am Soc Nephrol. 2017;28(2):407–20. 10.1681/ASN.2015121308 [DOI] [PMC free article] [PubMed] [Google Scholar]
- 25.Otero A, de Francisco A, Gayoso P, García F, EPIRCE Study Group . Prevalence of chronic renal disease in Spain: results of the EPIRCE study. Nefrología. 2010;30(1):78–86. 10.3265/Nefrologia.pre2009.Dic.5732 [DOI] [PubMed] [Google Scholar]
- 26.Nitsch D, Felber D, Von Eckardstein A, Gaspoz JM, Downs SH, Leuenberger P, et al. Prevalence of renal impairment and its association with cardiovascular risk factors in a general population: results of the Swiss SAPALDIA study. Nephrol Dial Transplant. 2006;21(4):935–44. 10.1093/ndt/gfk021 [DOI] [PubMed] [Google Scholar]
- 27.Viktorsdottir O, Palsson R, Andresdottir MB, Aspelund T, Gudnason V, Indridason OS. Prevalence of chronic kidney disease based on estimated glomerular filtration rate and proteinuria in Icelandic adults. Nephrol Dial Transplant. 2005;20(9):1799–807. 10.1093/ndt/gfh914 [DOI] [PubMed] [Google Scholar]
- 28.Reed J, 3rd, Kopyt N. Prevalence of albuminuria in the U.S. adult population over the age of 40: results from the National Health and Nutrition Examination Survey (1999-2008). Internet J Nephrol. 2009;6(1) [Google Scholar]
- 29.Coresh J, Astor BC, McQuillan G, Kusek J, Greene T, Van Lente F, et al. Calibration and random variation of the serum creatinine assay as critical elements of using equations to estimate glomerular filtration rate. Am J Kidney Dis. 2002;39(5):920–9. 10.1053/ajkd.2002.32765 [DOI] [PubMed] [Google Scholar]
- 30.Schaeffner ES, Ebert N, Delanaye P, Frei U, Gaedeke J, Jakob O, et al. Two novel equations to estimate kidney function in persons aged 70 years or older. Ann Intern Med. 2012;157(7):471–81. 10.7326/0003-4819-157-7-201210020-00003 [DOI] [PubMed] [Google Scholar]
- 31.Delanaye P, Jager K, Bökenkamp A, Christensson A, Dubourg L, Eriksen B, et al. CKD: a call for an age-adapted definition. J Am Soc Nephrol. 2019;30(10):1785–805. 10.1681/ASN.2019030238 [DOI] [PMC free article] [PubMed] [Google Scholar]