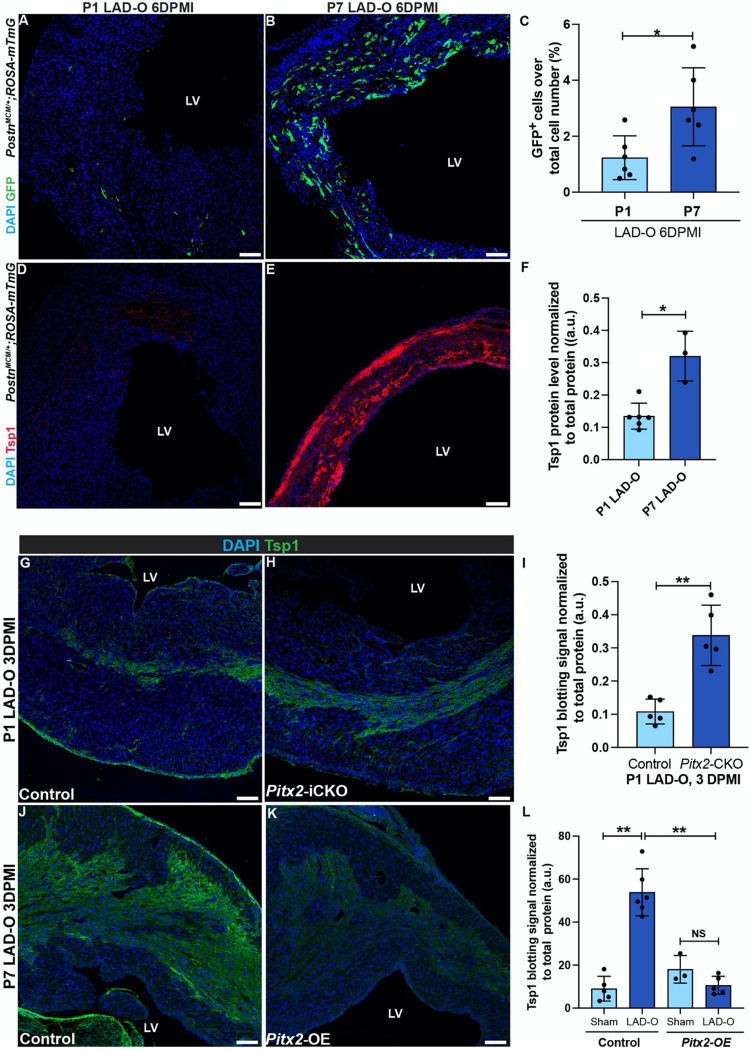
Figure 6. Pitx2 negatively regulates fibrosis by downregulating Tsp1 expression after MI.
(A, B) PostnMCM/+;ROSA-mTmG heart sections imaged for endogenous GFP at 6 DPMI after P1 (A) or P7 (B) LAD-O. Tamoxifen administrated daily at 1, 2, 3 and 5 DPMI. (C) GFP-positive cell ratio over total nuclei number. (D, E) PostnMCM/+;ROSA-mTmG heart sections stained for Tsp1 (red) and DAPI (blue) at 6 DPMI after P1 (D) or P7 (E) LAD-O. (F) Normalized band (immunoblotting) intensity of myocardial Tsp1 at 4 DPMI after P1 or P7 LAD-O. (G, H) Control (Mhccre-Ert) (G) and Pitx2-iCKO (Mhccre-Ert;Pitx2f/f) (H) Heart tissue stained for Tsp1 (green) and DAPI (blue) at 3 DPMI after P1 LAD-O. Tamoxifen was given at P0-P2. (I) Normalized band intensity of Tsp1 in control and Pitx2-iCKO left ventricle at 3 DPMI after P1 LAD-O. (J, K) Control (Mhccre-Ert) (J) and Pitx2-OE (Mhccre-Ert;Pitx2gof) (K) Hearts were stained for Tsp1 (green) and DAPI (blue) at 3 DPMI after P7 LAD-O. Tamoxifen was given at P6-P8. (L) Normalized band intensity of Tsp1 in control and Pitx2-OE left ventricle at 3 DPMI after P7 LAD-O. Error bars indicate SD. *, p<0.05; **, p<0.01. NS, not significant. LV, left ventricle. Scale bar, 100 μm (A, B, D, E, G, H, J, K).
See also Figure S6.

