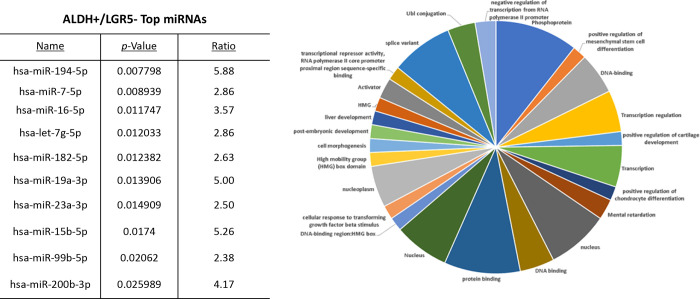
Figure 4. The top 10 miRNAs and functional analysis of predicted targeted genes in ALDH+/LGR5– cells.
The table lists the top 10 miRNAs expressed in ALDH+/LGR5− cells. miRNAs were ranked according to p-value <0.05 for statistical significance. The pie chart shows the functional classification identified by David analysis of the mRNAs predicted to be targeted by the miRNAs expressed in ALDH+/LGR5− cells. A summary of the functions of mRNAs predicted to be targeted by the miRNAs is given in Table S2.

