

Abstract
Transcription often occurs in bursts as gene promoters switch stochastically between active and inactive states. Enhancers can dictate transcriptional activity in animal development through the modulation of burst frequency, duration, or amplitude. Previous studies observed that different enhancers can achieve a wide range of transcriptional outputs through the same strategies of bursting control. For example, despite responding to different transcription factors, all even-skipped enhancers increase transcription by upregulating burst frequency and amplitude while burst duration remains largely constant. These shared bursting strategies suggest that a unified molecular mechanism constraints how enhancers modulate transcriptional output. Alternatively, different enhancers could have converged on the same bursting control strategy because of natural selection favoring one of these particular strategies. To distinguish between these two scenarios, we compared transcriptional bursting between endogenous and ectopic gene expression patterns. Because enhancers act under different regulatory inputs in ectopic patterns, dissimilar bursting control strategies between endogenous and ectopic patterns would suggest that enhancers adapted their bursting strategies to their trans-regulatory environment. Here, we generated ectopic even-skipped transcription patterns in fruit fly embryos and discovered that bursting strategies remain consistent in endogenous and ectopic even-skipped expression. These results provide evidence for a unified molecular mechanism shaping even-skipped bursting strategies and serve as a starting point to uncover the realm of strategies employed by other enhancers.
Introduction
In animal development, enhancers, cis-regulatory elements that can act at a distance to modulate the transcription of genes (Banerji et al., 1981, 1983; Gillies et al., 1983) orchestrate the formation of gene expression patterns that dictate animal body plans (Davidson, 2010; Franks, 1991; Lewis, 1978). At the single-cell level, transcription of most genes has been shown to occur in stochastic pulses, or bursts, of mRNA synthesis (Dar et al., 2012; Golding et al., 2005; McKnight & Miller, 1979; Raj et al., 2006; Senecal et al., 2014; Skupsky et al., 2010; Zenklusen et al., 2008), and patterned developmental genes are no exception (Berrocal et al., 2020; Bothma et al., 2014; Fukaya et al., 2016; Lammers et al., 2020; Zoller et al., 2018). Enhancers typically feature binding sites for several transcription factors proteins. Through these binding sites, enhancers can read out transcription factor concentration and modulate transcriptional bursting dynamics of the genes they regulate (Bothma et al., 2014, 2015; Chen et al., 2018; Fukaya et al., 2016; Small et al., 1992; Yuh et al., 1994).
Transcriptional bursting can be described by the two-state model of promoter activity (Lionnet & Singer, 2012; Peccoud & Ycart, 1995; Sanchez et al., 2013) that depicts bursts as the result of a gene promoter that switches stochastically between an inactive state, OFF, and an active state, ON, at a rate kon. When the promoter is in its ON state, it loads RNA Pol II molecules onto the gene at a rate r until, eventually, the promoter transitions back to the OFF state at a rate koff and mRNA synthesis stops (Figures 1A and 1B). In this model, there are multiple distinct ways that enhancers could modulate the rate of mRNA production by tuning transcriptional parameters. For instance, enhancers could upregulate transcription through an increase in burst frequency (kon, also defined as a decrease in the interval between bursts or kon−1), burst duration (koff−1) or burst amplitude (r), or any combination thereof. Recently, quantitative studies have revealed striking similarities in how disparate enhancers modulate these burst parameters to control gene expression. For example, using live-imaging and statistical modeling, we previously showed that the five enhancers that form the seven stripes of even-skipped (eve) expression in Drosophila melanogaster, despite each interacting with a different set of transcription factors, employ the same kinetic strategy to control the rate of mRNA synthesis: they modulate burst frequency and amplitude, while leaving burst duration largely unchanged (Berrocal et al., 2020). Similarly, a recent study employing single-molecule mRNA FISH suggested that the transcriptional control of various D. melanogaster gap genes is characterized by the shared modulation of burst frequency and duration, while burst amplitude remains constant (Zoller et al., 2018). These two examples suggest a surprising degree of unity—but also of diversity—in the way different enhancers interact with promoters to control transcriptional bursting.
Figure 1: Promoter activity in endogenous and ectopic regions of eve expression.

(A) According to the two-state model of promoter activity a gene promoter switches from the OFF (inactive) state to the ON (active) state at a rate kon. When ON, the promoter loads RNA Pol II molecules and synthesizes mRNA at a rate r. The promoter stochastically switches back to the OFF state at a rate koff . (B) The kon, koff, and r parameters define the average interval between bursts, average burst duration, and average burst amplitude, respectively. (C) eve stripes result from the interplay of various activators and repressors, for instance, wild-type eve stripe 2 is expressed through the interplay of the activators Bicoid and Hunchback with the repressors Giant and Krüppel. The latter define the anterior and posterior boundaries of eve stripe 2, respectively. (D) Here, we coupled the disruption of the eve stripe 1 enhancer with the disruption of the anterior repression of eve stripe 2 exerted by the gap repressor Giant to drive ectopic eve expression anteriorly and compare bursting parameters between endogenous and ectopic expression patterns. Figures 1C and 1D are based on (Levine, 2013) and (Peel et al., 2005).
Apparent regulatory unity between various enhancers could be the result of evolutionary adaptation of enhancers to the trans-regulatory inputs that they experience in their endogenous regions of activity. Under this model, we would expect to observe unified bursting strategies at endogenous regions of enhancer activity, while enhancers exposed to non-endogenous regulatory inputs could exhibit different bursting strategies than those observed within their canonical domains of activity. Alternatively, unified strategies of bursting control could result from constraints determined by the biochemistry of the transcriptional processes at enhancers and promoters. In this model, enhancers would control the same set of bursting parameters regardless of the identity and concentration of the input transcription factors at concentrations that enhancers have not encountered during their evolution.
To probe these two models in the context of D. melanogaster development, we used the eve gene as a case study. Specifically, we disrupted two of its enhancers to expand the transcriptional activity of the eve gene onto ectopic regions where enhancers dictate transcriptional bursting in the presence of combinations and concentrations of input transcription factors that D. melanogaster eve enhancers have not encountered in their evolution. We compared bursting parameters in endogenous (Figure 1C) and ectopic regions of eve expression (Figure 1D) and determined that, despite endogenous regions having a higher mean transcriptional output than ectopic regions of eve expression, nuclei in endogenous and ectopic regions modulate their transcriptional output through the same bursting strategies: a concerted increase in promoter kon and r, while koff remains largely unchanged. Our results suggest that eve enhancers have not adapted to yield particular bursting parameters within eve stripes and add further evidence for a unified molecular mechanism behind the modulation of eve transcriptional output. Our work serves as a starting point for uncovering the realm of possible bursting strategies employed by enhancers and opens new research avenues to investigate how these strategies are established at the molecular level.
Results
Mutating eve enhancers to generate ectopic expression patterns
We sought to determine whether eve enhancers regulate transcription by modulating the same set of bursting parameters in endogenous and ectopic eve expression regions. Specifically, we aimed to compare how eve enhancers drive transcriptional bursting in and out of the well-known seven endogenous eve stripes (Frasch & Levine, 1987; Hare et al., 2008).
As our starting point, we took a previously established BAC-based eve-MS2 reporter system (Berrocal et al., 2020) that carries a ~20 kb DNA fragment around the D. melanogaster eve coding region containing the five eve enhancers responsible for regulating the expression of the seven eve stripes, other cis-regulatory elements such as neuronal and muscular regulatory elements (Fujioka et al., 1999, 2013) that might influence eve stripe expression in early development (Fujioka et al., 1999, 2013), and the late element (LE) that upregulates eve expression in all stripes in response to the EVE protein (Fujioka et al., 1996; Jiang et al., 1991) (Figure 2A). We will refer to this construct as eveMS2-BAC (see SI section: DNA constructs and fly lines in Materials and Methods). The MS2 reporter system fluorescently labels nascent mRNA molecules resulting in sites of nascent transcription appearing as puncta whose fluorescence is proportional to the number of active RNA Pol II molecules. As a result, the system allows for the visualization of transcriptional bursting at single locus resolution, in real-time, in living embryos (Chubb et al., 2006; Ferguson & Larson, 2013; Garcia et al., 2013; Golding et al., 2005; Golding & Cox, 2004). When inserted into the D. melanogaster genome, eveMS2-BAC expresses in seven stripes that recapitulate the wild-type expression of eve (Figure 2B) (Berrocal et al., 2020) as observed by FISH and live-imaging experiments (Lammers et al., 2020; Lim et al., 2018; Luengo Hendriks et al., 2006).
Figure 2: Transcriptional dynamics of eveMS2-BAC variants.

(A) eveMS2 reporter construct variants used in this work. Boxes represent enhancers (e.g., eve stripe 2 enhancer is labeled as 2). LE is the eve late element. eveMS2-BAC is a reporter of wild-type eve expression. The eveS1wt-eveS2Gt- carries a deletion of three Giant binding sites within the eve stripe 2 minimal regulatory element (eveS2-MRE; (Small et al., 1992)), as indicated by the three red crosses over the stripe 2 enhancer, and as shown in the detail of eveS2-MRE; where triangles represent transcription factor-binding sites. The eveS1∆-eveS2wt carries a deletion of the stripe 1 enhancer. Finally, eveS1∆-eveS2Gt- combines the Giant binding site deletions from eveS1wt-eveS2Gt- with the stripe 1 enhancer deletion of eveS1∆-eveS2wt. (B) Left. Stills from a representative wild-type embryo at ~25 min and ~45 min into nuclear cycle 14 (nc14). Nuclei are labeled in red and transcription sites are labeled in green. Right. Kymograph of eve expression averaged over 5 eveMS2-BAC (wild-type) embryos. Time resolution along the y-axis is 20 seconds. The position of nuclei along the x-axis was calculated from various datasets, based on the inferred position of stripe centers, as described in the SI section: Generation of heatmaps in Figure 2 and Supplemental Figure 1 in Materials and Methods. MS2 fluorescence in arbitrary units (AU) along the x-axis was averaged from nuclei located within bins of 0.5% embryo length. (C) Left. eveS1wt-eveS2Gt- embryo at ~25 min and ~45 min into nc14. Right. Average eve-MS2 fluorescence from 6 eveS1wt-eveS2Gt- embryos. At ~25 min, some transcriptionally active nuclei in the inter-stripe region between eve stripe 1 and eve stripe 2 can still be detected (white arrows), while, in wild-type embryos, eve stripe 1 and 2 are completely separated by ~20 min into nc14. (D) Left. eveS1∆-eveS2wt embryo at ~25 min and ~45 min into nc14. Right. Average eve-MS2 fluorescence from 5 eveS1∆-eveS2wt embryos. eve stripe 1 is almost absent at ~25 min, but appears later, probably driven by activity of the eve late element. A dim eve stripe 0 is apparent (white arrows). (E) Left. eveS1∆-eveS2Gt- embryo at ~25 min and ~45 min into nc14. Right. Average eve-MS2 fluorescence from 6 eveS1∆-eveS2Gt- embryos. At ~25 min, there is a strong ectopic expression in the inter-stripe region between eve stripe 1 and eve stripe 2 (white arrow). At ~45 min, this ectopic inter-stripe expression has dimmed (white arrows), while eve stripe 0 becomes apparent.
To establish an ectopic eve expression pattern, we modified the eve reporter locus (Figure 2A) (Berrocal et al., 2020). Specifically, we aimed to create an anterior expansion of eve stripe 2 beyond its endogenous expression domain and into ectopic regions where we could study transcriptional bursting under inputs foreign to an eve enhancer, e.g., higher levels of the activator Bicoid and the repressor Giant (Gt) (Figure 1D). To make this possible, we leveraged the fact that the anterior boundary of eve stripe 2 is established through repression by Giant (Small et al., 1992). Classic work by Small et al. identified a minimal regulatory element of the eve stripe 2 enhancer (eveS2-MRE; Figure 2A) and found that deleting three Giant binding sites within this minimal enhancer produced a strong anterior expansion of eve stripe 2 in the context of a reporter driven by eveS2-MRE (Small et al., 1992).
We generated an eveMS2-BAC variant, where the three binding sites for Giant identified in the eveS2-MRE were disrupted on the complete eve stripe 2 enhancer (eveS1wt-eveS2Gt-) (Figure 2A and 2C). Live imaging experiments on eveS1wt-eveS2Gt- embryos showed only transient ectopic expression at the inter-stripe region between eve stripes 1 and 2. This transient inter-stripe expression lasts until 30–35 min into nc14; while inter-stripe expression between eve stripe 1 and eve stripe 2 disappears after ~20 min in wild-type embryos (compare Figure 2B and 2C; compare Supplemental Figure 1A and 1B). These eveS1wt-eveS2Gt- embryos did not produce the robust anterior expansion of eve stripe 2 described for the eveS2-MRE alone (Small et al., 1992). We attribute this muted anterior expansion in eveS1wt-eveS2Gt- embryos (Figure 2C) to the regulatory sequences not present in the original minimal eve stripe 2 reporter construct which might provide a buffering effect to the disruption of the three Giant binding sites (Lopez-Rivera et al., 2020).
In an attempt to expand the anterior ectopic domain of eveS1wt-eveS2Gt-, we sought to free its expression domain from any potential interference from eve stripe 1 expression. To make this possible, we deleted endogenous expression corresponding to the eve stripe 1 enhancer. Specifically, we generated a mutant version of eveMS2-BAC with the eve stripe 1 enhancer deleted (eveS1∆-eveS2wt) (Figure 2A and 2D; Supplemental Figure 1C). Unexpectedly, these embryos still exhibited a dim eve stripe 1 (~30% of embryo length) after ~30 min into nc14, perhaps due to the activity of the eve late element; and a dim additional anterior stripe that we refer to as eve stripe 0 (~20% embryo length) after ~25 min into nc14. The appearance of eve stripe 0 implies a repressive role of eve stripe 1 enhancer beyond the anterior boundary of eve stripe 1 (Figure 2D).
Finally, we coupled the three deletions of Gt-binding sites in the eve stripe 2 enhancer from eveS1wt-eveS2Gt- with the complete deletion of the eve stripe 1 enhancer in eveS1∆-eveS2wt to create eveS1∆-eveS2Gt- (Figure 2A and 2E; Supplemental Figure 1D). Surprisingly, eveS1∆-eveS2Gt- embryos revealed large ectopic regions of eve expression more complex than the sum of patterns displayed by the independent mutants described above. Beyond a stronger and longer-lasting inter-stripe expression between eve stripe 1 and eve stripe 2 than observed in eveS1wt-eveS2Gt-, eveS1∆-eveS2Gt- embryos exhibited the following notable features: a stronger-than-wild-type eve stripe 2 (located at ~40% of embryo length); the presence of eve stripe 1 (~30% of embryo length) and eve stripe 0 (~20% embryo length); and many eve-active nuclei in normally silent inter-stripe regions between eve stripe 2 and eve stripe 0 (Figure 2E). The fact that the knock-out of eve stripe 1 enhancer coupled with the disruption of Gt-binding sites in eve stripe 2 enhancer renders more ectopic expression on the anterior half of fruit fly embryos than the independent disruptions in eveS1∆-eveS2wt and eveS1wt-eveS2Gt- implies that the repressive activity of the eve stripe 1 enhancer synergizes with the repression that Giant exerts over the eve stripe 2 enhancer.
Taken together, our results suggest that the eve stripe 1 enhancer has a repressing role in the anterior half of fruit fly embryos that synergizes with the Giant repressor bound to the eve stripe 2 enhancer. This argues in favor of some kind of cross-activity between the eve stripe 1 and 2 enhancers that impacts eve expression in the anterior half of the embryo. eve stripe 1 enhancer might be also playing a role in the regulation of eve stripe 2, as Giant-binding site deletions in eve stripe 2 enhancer alone do not result in the stronger-than-wild-type eve stripe 2 observed in eveS1∆-eveS2Gt- embryos. In summary, coupling the disruption of Giant-binding sites in eve stripe 2 enhancer with the deletion of eve stripe 1 enhancer produces different mutant patterns than the sum of the individual mutants. Finally, regardless of the complex regulatory interactions uncovered by our enhancer mutants, our results indicate that the ectopic gene expression patterns driven by our eveS1∆-eveS2Gt- reporter provide an ideal scaffold for our investigations of the regulation of transcriptional bursting outside of endogenous embryo regions.
Bursting strategies are uniform across endogenous and ectopic eve-active nuclei
We determined the position of nuclei displaying active eve transcription and labeled them as endogenous if they were positioned within the boundaries of wild-type eve stripes (eve stripe 1, eve stripe 2, eve stripe 3, eve stripe 4); or as ectopic if they were located in the inter-stripe region between eve stripe 1 and eve stripe 2 (eve stripe 1–2) or in eve stripe 0 (in the far anterior) (Figure 3A) as described in Materials and Methods. eve stripe 1 expression in embryos with disrupted eve stripe 1 enhancer was considered endogenous, as we believe that this expression results from activity of the late element. All active nuclei in wild-type embryos were labeled as endogenous. Overall, ectopic regions show lower levels of mean MS2 fluorescence than endogenous regions, as is evident by comparing eve the interstripe 1–2 and eve stripe 0 against eve stripe 1, eve stripe 2, and eve stripe 3 in eveS1∆-eveS2Gt- embryos (Figure 2E, Right). This is perhaps due to the unavailability of optimal concentrations of transcription factors; e.g. a lack of activators or an excess of repressors with respect to the concentrations found in endogenous regions (Figure 1C and 1D).
Figure 3: Bursting parameter control is almost identical in endogenous and ectopic gene expression regions.
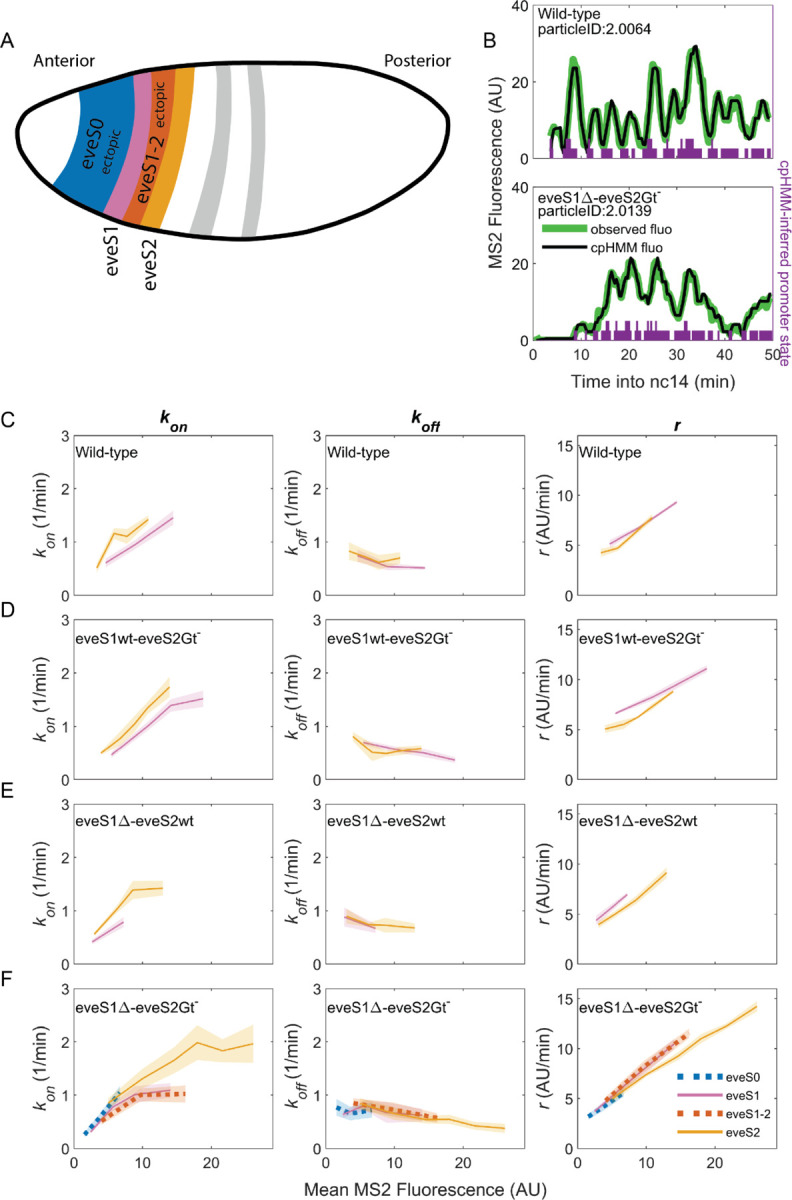
kon (left panels), koff ,(middle panels) and r (right panels) trends across stripes, estimated from nuclei binned by their mean MS2 fluorescence. (A) Position and color code of endogenous and ectopic stripes in the fruit fly embryo. Only eve stripe 0, 1, 1–2, and 2 are shown for clarity. Supplemental Figure 3 includes eve stripe 3, and 4. (B) MS2 fluorescent traces (green) and fit using the cpHMM model (black) from embryos of different genotypes. Transcription in Drosophila embryos occurs after DNA replication. Since replicated sister chromatids remain paired, each eve locus contains two promoters, and every one of them can be ON or OFF. Purple bars show cpHMM-inferred promoter state corresponding to the two sister chromatids within a transcription spot (Lammers et al., 2020). Absence of bars represents both sister promoters OFF; shorter bars represent 1 sister promoter ON; longer bars represent 2 sister promoters ON. We aggregated the active state of 1 and 2 sister promoters into a single ON state, which leads to an effective two-state model of promoter activity (see SI section: Inference of Bursting Parameters in Materials and Methods). Each point in the plots below was computed from ~40 fluorescent traces. (C) As previously observed in eve-MS2 wild-type embryos (Berrocal et al., 2020), nuclei in all stripes follow the same trends in bursting parameters. kon, the average rate at which the promoter switches from OFF to ON increases with increasing transcriptional initiation as reported by MS2 fluorescence. koff, the average rate at which a promoter switches from ON to OFF remains largely constant, and has a slight decrease in nuclei with the highest MS2 fluorescence values. r, the average rate at which active promoters increase their fluorescence, is higher in brighter nuclei. All stripes from (D) eveS1wt-eveS2Gt- and (E) eveS1∆-eveS2wt share the same bursting strategy. (F) The same trends occur in endogenous (eveS1 and eveS2; solid lines) and ectopic stripes (eveS0 and eveS1–2; dotted lines) of eveS1∆-eveS2Gt- embryos.
To uncover which bursting parameters are modulated to create each endogenous and ectopic stripes and interstripe regions, we need to extract the bursting parameters in each region. We computed bursting parameters for nuclei grouped by stripe and binned by transcriptional output (Supplemental Figure 2) in our four fly lines, with the following rationale. In the bursting model, the average rate of transcription initiation is described by the formula , where indicates the fraction of time the promoter spends in the ON state (Lammers et al., 2020). As enhancers and their inputs (e.g. transcription factors, chromatin state) define bursting parameters (kon, koff, r), nuclei of similar average transcriptional output within the same stripe should be driven by similar inputs acting over the same enhancer. Thus, these nuclei should show similar values of the bursting parameters kon, koff and r that satisfy the equation above. On the other hand, our model predicts that nuclei with different fluorescence must differ in at least one of their bursting parameter values (kon, koff and/or r).
The average MS2 fluorescence is a direct reporter of the average rate of transcriptional initiation. Single-cell MS2 fluorescence measurements reflect the transcriptional dynamics of individual promoters as they undergo transcriptional bursting (Figure 3B). However, the actual promoter states, or bursting parameters, underlying the transcriptional bursting remain ‘hidden’, as RNA Pol II molecules engage in elongation for several minutes (~140 sec for the MS2::yellow transcriptional unit in our reporter system) (Berrocal et al., 2020). As a result, MS2 fluorescence is observable even after the promoter switches to the OFF state, convolving the promoter switching dynamics with those of transcriptional elongation. Thus, we can only compute promoter states by inferring them from MS2 fluorescence over time. To infer hidden promoter states, we used a compound-state Hidden Markov Model (cpHMM) developed by (Lammers et al., 2020). By inferring the succession of activity states, cpHMM estimates rates of transitioning between the OFF and ON states (kon and koff) and the rate at which ON promoters load active RNA Pol II molecules (r).
Consistent with our previous work (Berrocal et al., 2020), we find that endogenous stripes in eveMS2-BAC wild-type embryos modulate their transcriptional output (mean MS2 fluorescence in wild-type embryos ranges from 2 to 15 AU) by tuning the average kon (from 0.5 to 1.5 OFF to ON promoter transitions per minute) and r (from an average fluorescence increase at a rate of 5 AU per minute to 10 AU per minute). The average koff value remains largely constant (0.5 ON to OFF promoter transitions per minute), with only a minor downregulation at high transcription outputs (Figure 3C). Thus, we confirm that eve-active nuclei in all wild-type stripes achieve higher levels of transcription by upregulating average bursting frequency (kon) and amplitude (r), while average burst duration (koff−1) remains largely the same.
eveS1wt-eveS2Gt- (Figure 3D) and eveS1∆-eveS2wt (Figure 3E) embryos did not yield enough ectopic nuclei for cpHMM inference. However, their endogenous stripes followed the same bursting strategy observed in wild-type embryos, regardless of whether stripes were activated by wild-type or mutant enhancers (see SI Section: Complementary Analysis of Bursting Parameters in Materials and Methods). We inferred bursting parameters across regions of endogenous and ectopic nuclei in eveS1∆-eveS2Gt- embryos (eve stripe 1–2 and eve stripe 0), as they yielded sufficient ectopic eve-active nuclei to support cpHMM inference. As noted previously, these embryos feature an eve stripe 2 with nuclei of higher transcriptional output than wild-type embryos (compare Figure 2B and 2E), and a large region of ectopic expression towards the embryo anterior. Despite these differences in transcriptional output, bursting parameters in endogenous and ectopic eve-active nuclei in eveS1∆-eveS2Gt- embryos follow the same trends as wild-type embryos (Supplemental Figure 3). In all regions–both endogenous and ectopic–enhancers increase transcription by increasing in kon and r, while koff remains largely constant (Figure 3F).
We performed an orthogonal cpHMM inference of bursting parameters by grouping nuclei in only two categories (endogenous and ectopic) (Supplemental Figure 4), instead of grouping them according to their stripe, and we observed that this approach renders the same results (see SI Section: Complementary Analysis of Bursting Parameters in Materials and Methods).
Taken together, our results show that all eve enhancers modulate their transcriptional output by increasing burst frequency (kon) and amplitude (r). koff, which shapes burst duration, remains largely constant, and shows a subtle drop as the mean MS2 fluorescence of nuclei increases. A wide range of transcriptional outputs result from these parameters. eve strategies of bursting control are robust to mutations on eve enhancers, and remain consistent in the presence of a myriad of inputs, including ectopic inputs different from those that shape the transcription of the seven canonical eve stripes.
Discussion
Over the last few years the ability to infer bursting parameters from fixed (Little et al., 2013; Xu et al., 2015) and live-imaging (Lammers et al., 2020) data in embryos has revealed several commonalities and differences in the strategies employed by different enhancers to modulate bursting parameters and create patterns of gene expression (Berrocal et al., 2020; Zoller et al., 2018). For example, despite the different inputs that regulate the activity of eve enhancers, all of them modulate the expression of the seven canonical eve stripes by upregulating burst frequency (kon) and amplitude (r), while burst duration (k −1) remains largely constant and shows only a minor increase in nuclei of high transcriptional output (Berrocal et al., 2020). Since the seven eve stripes are largely controlled by independent enhancers that respond to unique combinations of transcription factors, it was still unclear whether eve enhancers employ the same bursting strategy in ectopic regions, in the presence of trans-regulatory environments different from those that exist in their wild-type regions of expression.
Different bursting strategies between endogenous and ectopic regions of eve expression would suggest a selective pressure on eve enhancers that favors the observed bursting strategies at their canonical expression domains. On the other hand, unified bursting strategies in endogenous and ectopic regions point towards a common molecular mechanism, constrained by the biochemistry of enhancer-promoter interaction, which shapes the observed bursting parameters independent of changing trans-regulatory environments.
In this work, we compared bursting parameters (kon, koff, r) between endogenous and ectopic regions of eve expression to test between those two hypotheses. Specifically, we performed live imaging of eve-enhancer activity and bursting parameter inference in D. melanogaster embryos expressing wild-type and mutant versions of our BAC-based eveMS2 reporter system. Our observations argue in favor of the second hypothesis, as we observe a unified strategy of bursting control wherever eve enhancers are active, regardless of the ectopic or endogenous inputs that regulate their activity. In summary, despite changing trans-regulatory environments and mutations in enhancer sequence, eve enhancers act through a single promoter and upregulate transcriptional bursting in endogenous and ectopic expression regions. It is important to note that the modulation of burst frequency and amplitude is not the only possible bursting control strategy. Indeed, (Zoller et al., 2018) observed that Drosophila gap genes, controlled by independent promoters and enhancers, modulate bursting through a common strategy; an increase in frequency and duration, while burst amplitude remains unchanged. These findings hint at an opportunity to classify enhancers and promoters in families whose members employ the same strategy of bursting control and rely on a common molecular mechanism to regulate their target genes.
In the light of our results, two molecular mechanisms coupled to enhancer activity could be behind the unified bursting strategies of eve enhancers. First, the observed common modulation of bursting parameters might result from general constraints imposed by the transcriptional machinery at enhancers or promoters. Previous work showed that topological dynamics of bacterial chromosomes brought by transcriptional activity shape bursting in bacteria (Chong et al., 2014); while histone acetylation of the circadian promoter Bmal1 modulates burst frequency in mammalian cells (Nicolas et al., 2018). Furthermore, (Gorski et al., 2008) observed that the dynamics of RNA Pol I–subunit assembly affect transcriptional output. The dynamic nature of transcription factor “hubs” (Mir et al., 2017; Tsai et al., 2017) in transcriptionally active enhancers of D.melanogaster embryos (Mir et al., 2018) may impact transcriptional bursting as well.
The second possibility is that the eve promoter, which is shared by all eve enhancers and distant regulatory elements, constrains the regulatory strategy of even-skipped. Recent studies using MS2 live imaging (Pimmett et al., 2021; Yokoshi et al., 2022) have described a fundamental role of core promoter elements, such as the TATA box, the initiator element, and the downstream core promoter element in shaping transcriptional bursting in genes of D. melanogaster embryos. Further experiments, exploring the bursting strategies that result from swapping promoters in constructs carrying the eve enhancers could elucidate whether the eve promoter is responsible for establishing the eve regulatory strategy.
Both possibilities suggest that a molecular mechanism coupled to eve transcription restricts the landscape of bursting strategies available to eve enhancers. Our results indicate that eve bursting strategies are a fundamental property of enhancers and promoters—and not the result of changing trans-regulatory environments—and show that eve enhancers merely act as knobs, robust to mutations, that tune transcriptional output levels by modulating bursting through a largely fixed koff and shifting r and kon.
An ectopic pattern of particular interest is the novel eve stripe 0 brought by the deletion of the eve stripe 1 enhancer. This new stripe shows that mutations on existing eve enhancers can generate novel gene expression patterns through the same bursting strategies employed by the other eve stripes. Since expression patterns in embryonic development shape the formation and identity of animal body plans (Akam, 1983; Davidson, 2010; Lewis, 1978), the appearance of new expression patterns may constitute a critical driver of evolution (Rebeiz et al., 2011).
Supplementary Material
Acknowledgements
This work was supported by an HHMI Investigator award to MBE. HGG was supported by the Burroughs Wellcome Fund Career Award at the Scientific Interface, the Sloan Research Foundation, the Human Frontiers Science Program, the Searle Scholars Program, the Shurl and Kay Curci Foundation, the Hellman Foundation, the NIH Director’s New Innovator Award (DP2 OD024541–01), NSF CAREER Award (1652236), an NIH R01 Award (R01GM139913) and the Koret-UC Berkeley-Tel Aviv University Initiative in Computational Biology and Bioinformatics. HGG is also a Chan Zuckerberg Biohub Investigator. NCL was supported by the NIH Genomics and Computational Biology training grant 5T32HG000047–18. AB was supported by a University of California Institute for Mexico and the United States (UC MEXUS) Doctoral Fellowship.
References
- Akam M. E. (1983). The location of Ultrabithorax transcripts in Drosophila tissue sections. The EMBO Journal, 2(11), 2075–2084. 10.1002/j.1460-2075.1983.tb01703.x [DOI] [PMC free article] [PubMed] [Google Scholar]
- Banerji J., Olson L., & Schaffner W. (1983). A lymphocyte-specific cellular enhancer is located downstream of the joining region in immunoglobulin heavy chain genes. In Cell (Vol. 33, Issue 3, pp. 729–740). 10.1016/0092-8674(83)90015-6 [DOI] [PubMed] [Google Scholar]
- Banerji J., Rusconi S., & Schaffner W. (1981). Expression of a beta-globin gene is enhanced by remote SV40 DNA sequences. Cell, 27(2 Pt 1), 299–308. 10.1016/0092-8674(81)90413-x [DOI] [PubMed] [Google Scholar]
- Berrocal A., Lammers N. C., Garcia H. G., & Eisen M. B. (2020). Kinetic sculpting of the seven stripes of the gene. eLife, 9. 10.7554/eLife.61635 [DOI] [PMC free article] [PubMed] [Google Scholar]
- Berrocal A., Lammers N. C., Garcia H. G., & Eisen M. B. (2023). Unified bursting strategies in ectopic and endogenous even-skipped expression patterns - Supplemental Data [Data set]. In Unified bursting strategies in ectopic and endogenous even-skipped expression patterns. 10.5281/zenodo.7204096 [DOI] [Google Scholar]
- Bothma J. P., Garcia H. G., Esposito E., Schlissel G., Gregor T., & Levine M. (2014). Dynamic regulation of eve stripe 2 expression reveals transcriptional bursts in living Drosophila embryos. Proceedings of the National Academy of Sciences of the United States of America, 111(29), 10598–10603. 10.1073/pnas.1410022111 [DOI] [PMC free article] [PubMed] [Google Scholar]
- Bothma J. P., Garcia H. G., Ng S., Perry M. W., Gregor T., & Levine M. (2015). Enhancer additivity and non-additivity are determined by enhancer strength in the Drosophila embryo. eLife, 4. 10.7554/eLife.07956 [DOI] [PMC free article] [PubMed] [Google Scholar]
- Chen H., Levo M., Barinov L., Fujioka M., Jaynes J. B., & Gregor T. (2018). Dynamic interplay between enhancer–promoter topology and gene activity. Nature Genetics, 50(9), 1296–1303. 10.1038/s41588-018-0175-z [DOI] [PMC free article] [PubMed] [Google Scholar]
- Chong S., Chen C., Ge H., & Xie X. S. (2014). Mechanism of transcriptional bursting in bacteria. Cell, 158(2), 314–326. 10.1016/j.cell.2014.05.038 [DOI] [PMC free article] [PubMed] [Google Scholar]
- Chubb J. R., Trcek T., Shenoy S. M., & Singer R. H. (2006). Transcriptional pulsing of a developmental gene. Current Biology: CB, 16(10), 1018–1025. 10.1016/j.cub.2006.03.092 [DOI] [PMC free article] [PubMed] [Google Scholar]
- Dar R. D., Razooky B. S., Singh A., Trimeloni T. V., McCollum J. M., Cox C. D., Simpson M. L., & Weinberger L. S. (2012). Transcriptional burst frequency and burst size are equally modulated across the human genome. Proceedings of the National Academy of Sciences of the United States of America, 109(43), 17454–17459. 10.1073/pnas.1213530109 [DOI] [PMC free article] [PubMed] [Google Scholar]
- Davidson E. H. (2010). The Regulatory Genome: Gene Regulatory Networks In Development And Evolution. Elsevier. https://play.google.com/store/books/details?id=F2ibJj1LHGEC [Google Scholar]
- Ferguson M. L., & Larson D. R. (2013). Measuring transcription dynamics in living cells using fluctuation analysis. Methods in Molecular Biology , 1042, 47–60. 10.1007/978-1-62703-526-2_4 [DOI] [PMC free article] [PubMed] [Google Scholar]
- Franks R. R. (1991). Cis-Regulatory Elements Required for a Lineage-Specific Gene Expression in the Sea Urchin Embryo. In American Zoologist (Vol. 31, Issue 3, pp. 490–492). 10.1093/icb/31.3.490 [DOI] [Google Scholar]
- Frasch M., & Levine M. (1987). Complementary patterns of even-skipped and fushi tarazu expression involve their differential regulation by a common set of segmentation genes in Drosophila. Genes & Development, 1(9), 981–995. https://www.ncbi.nlm.nih.gov/pubmed/2892761 [DOI] [PubMed] [Google Scholar]
- Fujioka M., Emi-Sarker Y., Yusibova G. L., Goto T., & Jaynes J. B. (1999). Analysis of an even-skipped rescue transgene reveals both composite and discrete neuronal and early blastoderm enhancers, and multi-stripe positioning by gap gene repressor gradients. Development , 126(11), 2527–2538. https://www.ncbi.nlm.nih.gov/pubmed/10226011 [DOI] [PMC free article] [PubMed] [Google Scholar]
- Fujioka M., Miskiewicz P., Raj L., Gulledge A. A., Weir M., & Goto T. (1996). Drosophila Paired regulates late even-skipped expression through a composite binding site for the paired domain and the homeodomain. Development , 122(9), 2697–2707. https://www.ncbi.nlm.nih.gov/pubmed/8787744 [DOI] [PubMed] [Google Scholar]
- Fujioka M., Sun G., & Jaynes J. B. (2013). The Drosophila eve insulator Homie promotes eve expression and protects the adjacent gene from repression by polycomb spreading. PLoS Genetics, 9(10), e1003883. 10.1371/journal.pgen.1003883 [DOI] [PMC free article] [PubMed] [Google Scholar]
- Fukaya T., Lim B., & Levine M. (2016). Enhancer Control of Transcriptional Bursting. Cell, 166(2), 358–368. 10.1016/j.cell.2016.05.025 [DOI] [PMC free article] [PubMed] [Google Scholar]
- Garcia H. G., Tikhonov M., Lin A., & Gregor T. (2013). Quantitative imaging of transcription in living Drosophila embryos links polymerase activity to patterning. Current Biology: CB, 23(21), 2140–2145. 10.1016/j.cub.2013.08.054 [DOI] [PMC free article] [PubMed] [Google Scholar]
- Gillies S. D., Morrison S. L., Oi V. T., & Tonegawa S. (1983). A tissue-specific transcription enhancer element is located in the major intron of a rearranged immunoglobulin heavy chain gene. In Cell (Vol. 33, Issue 3, pp. 717–728). 10.1016/0092-8674(83)90014-4 [DOI] [PubMed] [Google Scholar]
- Golding I., & Cox E. C. (2004). RNA dynamics in live Escherichia coli cells. Proceedings of the National Academy of Sciences of the United States of America, 101(31), 11310–11315. 10.1073/pnas.0404443101 [DOI] [PMC free article] [PubMed] [Google Scholar]
- Golding I., Paulsson J., Zawilski S. M., & Cox E. C. (2005). Real-time kinetics of gene activity in individual bacteria. Cell, 123(6), 1025–1036. 10.1016/j.cell.2005.09.031 [DOI] [PubMed] [Google Scholar]
- Gorski S. A., Snyder S. K., John S., Grummt I., & Misteli T. (2008). Modulation of RNA polymerase assembly dynamics in transcriptional regulation. Molecular Cell, 30(4), 486–497. 10.1016/j.molcel.2008.04.021 [DOI] [PMC free article] [PubMed] [Google Scholar]
- Hare E. E., Peterson B. K., Iyer V. N., Meier R., & Eisen M. B. (2008). Sepsid even-skipped enhancers are functionally conserved in Drosophila despite lack of sequence conservation. PLoS Genetics, 4(6), e1000106. 10.1371/journal.pgen.1000106 [DOI] [PMC free article] [PubMed] [Google Scholar]
- Harrison M. M., Li X.-Y., Kaplan T., Botchan M. R., & Eisen M. B. (2011). Zelda binding in the early Drosophila melanogaster embryo marks regions subsequently activated at the maternal-to-zygotic transition. PLoS Genetics, 7(10), e1002266. 10.1371/journal.pgen.1002266 [DOI] [PMC free article] [PubMed] [Google Scholar]
- Jiang J., Hoey T., & Levine M. (1991). Autoregulation of a segmentation gene in Drosophila: combinatorial interaction of the even-skipped homeo box protein with a distal enhancer element. Genes & Development, 5(2), 265–277. https://www.ncbi.nlm.nih.gov/pubmed/1671662 [DOI] [PubMed] [Google Scholar]
- Lammers N. C., Galstyan V., Reimer A., Medin S. A., Wiggins C. H., & Garcia H. G. (2020). Multimodal transcriptional control of pattern formation in embryonic development. Proceedings of the National Academy of Sciences of the United States of America, 117(2), 836–847. 10.1073/pnas.1912500117 [DOI] [PMC free article] [PubMed] [Google Scholar]
- Levine M. (2013). Computing away the magic? [Review of Computing away the magic?]. eLife, 2, e01135. 10.7554/eLife.01135 [DOI] [PMC free article] [PubMed] [Google Scholar]
- Lewis E. B. (1978). A gene complex controlling segmentation in Drosophila. Nature, 276(5688), 565–570. 10.1038/276565a0 [DOI] [PubMed] [Google Scholar]
- Lim B., Fukaya T., Heist T., & Levine M. (2018). Temporal dynamics of pair-rule stripes in living Drosophila embryos. Proceedings of the National Academy of Sciences of the United States of America, 115(33), 8376–8381. 10.1073/pnas.1810430115 [DOI] [PMC free article] [PubMed] [Google Scholar]
- Lionnet T., & Singer R. H. (2012). Transcription goes digital. EMBO Reports, 13(4), 313–321. 10.1038/embor.2012.31 [DOI] [PMC free article] [PubMed] [Google Scholar]
- Little S. C., Tikhonov M., & Gregor T. (2013). Precise developmental gene expression arises from globally stochastic transcriptional activity. Cell, 154(4), 789–800. 10.1016/j.cell.2013.07.025 [DOI] [PMC free article] [PubMed] [Google Scholar]
- Lopez-Rivera F., Foster Rhoades O. K., Vincent B. J., Pym E. C. G., Bragdon M. D. J., Estrada J., DePace A. H., & Wunderlich Z. (2020). A mutation in the Drosophila melanogaster eve stripe 2 minimal enhancer is buffered by flanking sequences. G3: Genes, Genomes, Genetics, 10(12), 4473–4482. https://academic.oup.com/g3journal/article-abstract/10/12/4473/6048697 [DOI] [PMC free article] [PubMed] [Google Scholar]
- Luengo Hendriks C. L., Keränen S. V. E., Fowlkes C. C., Simirenko L., Weber G. H., DePace A. H., Henriquez C., Kaszuba D. W., Hamann B., Eisen M. B., Malik J., Sudar D., Biggin M. D., & Knowles D. W. (2006). Three-dimensional morphology and gene expression in the Drosophila blastoderm at cellular resolution I: data acquisition pipeline. Genome Biology, 7(12), R123. 10.1186/gb-2006-7-12-r123 [DOI] [PMC free article] [PubMed] [Google Scholar]
- McKnight S. L., & Miller O. L. Jr. (1979). Post-replicative nonribosomal transcription units in D. melanogaster embryos. Cell, 17(3), 551–563. 10.1016/0092-8674(79)90263-0 [DOI] [PubMed] [Google Scholar]
- Mir M., Reimer A., Haines J. E., Li X.-Y., Stadler M., Garcia H., Eisen M. B., & Darzacq X. (2017). Dense Bicoid hubs accentuate binding along the morphogen gradient. Genes & Development, 31(17), 1784–1794. 10.1101/gad.305078.117 [DOI] [PMC free article] [PubMed] [Google Scholar]
- Mir M., Stadler M. R., Ortiz S. A., Hannon C. E., Harrison M. M., Darzacq X., & Eisen M. B. (2018). Dynamic multifactor hubs interact transiently with sites of active transcription in Drosophila embryos. eLife, 7. 10.7554/eLife.40497 [DOI] [PMC free article] [PubMed] [Google Scholar]
- Nicolas D., Zoller B., Suter D. M., & Naef F. (2018). Modulation of transcriptional burst frequency by histone acetylation. Proceedings of the National Academy of Sciences of the United States of America, 115(27), 7153–7158. 10.1073/pnas.1722330115 [DOI] [PMC free article] [PubMed] [Google Scholar]
- Peccoud J., & Ycart B. (1995). Markovian Modeling of Gene-Product Synthesis. Theoretical Population Biology, 48(2), 222–234. 10.1006/tpbi.1995.1027 [DOI] [Google Scholar]
- Peel A. D., Chipman A. D., & Akam M. (2005). Arthropod segmentation: beyond the Drosophila paradigm. Nature Reviews. Genetics, 6(12), 905–916. 10.1038/nrg1724 [DOI] [PubMed] [Google Scholar]
- Pimmett V. L., Dejean M., Fernandez C., Trullo A., Bertrand E., Radulescu O., & Lagha M. (2021). Quantitative imaging of transcription in living Drosophila embryos reveals the impact of core promoter motifs on promoter state dynamics. In Cold Spring Harbor Laboratory (p. 2021.01.22.427786). 10.1101/2021.01.22.427786 [DOI] [PMC free article] [PubMed] [Google Scholar]
- Raj A., Peskin C. S., Tranchina D., Vargas D. Y., & Tyagi S. (2006). Stochastic mRNA synthesis in mammalian cells. PLoS Biology, 4(10), e309. 10.1371/journal.pbio.0040309 [DOI] [PMC free article] [PubMed] [Google Scholar]
- Rebeiz M., Jikomes N., Kassner V. A., & Carroll S. B. (2011). Evolutionary origin of a novel gene expression pattern through co-option of the latent activities of existing regulatory sequences. Proceedings of the National Academy of Sciences of the United States of America, 108(25), 10036–10043. 10.1073/pnas.1105937108 [DOI] [PMC free article] [PubMed] [Google Scholar]
- Sanchez A., Choubey S., & Kondev J. (2013). Stochastic models of transcription: from single molecules to single cells. Methods , 62(1), 13–25. 10.1016/j.ymeth.2013.03.026 [DOI] [PubMed] [Google Scholar]
- Senecal A., Munsky B., Proux F., Ly N., Braye F. E., Zimmer C., Mueller F., & Darzacq X. (2014). Transcription factors modulate c-Fos transcriptional bursts. Cell Reports, 8(1), 75–83. 10.1016/j.celrep.2014.05.053 [DOI] [PMC free article] [PubMed] [Google Scholar]
- Skupsky R., Burnett J. C., Foley J. E., Schaffer D. V., & Arkin A. P. (2010). HIV Promoter Integration Site Primarily Modulates Transcriptional Burst Size Rather Than Frequency. In PLoS Computational Biology (Vol. 6, Issue 9, p. e1000952). 10.1371/journal.pcbi.1000952 [DOI] [PMC free article] [PubMed] [Google Scholar]
- Small S., Blair A., & Levine M. (1992). Regulation of even-skipped stripe 2 in the Drosophila embryo. The EMBO Journal, 11(11), 4047–4057. https://www.ncbi.nlm.nih.gov/pubmed/1327756 [DOI] [PMC free article] [PubMed] [Google Scholar]
- Tsai A., Muthusamy A. K., Alves M. R., Lavis L. D., Singer R. H., Stern D. L., & Crocker J. (2017). Nuclear microenvironments modulate transcription from low-affinity enhancers. eLife, 6. 10.7554/eLife.28975 [DOI] [PMC free article] [PubMed] [Google Scholar]
- Venken K. J. T., Carlson J. W., Schulze K. L., Pan H., He Y., Spokony R., Wan K. H., Koriabine M., de Jong P. J., White K. P., Bellen H. J., & Hoskins R. A. (2009). Versatile P[acman] BAC libraries for transgenesis studies in Drosophila melanogaster. Nature Methods, 6(6), 431–434. 10.1038/nmeth.1331 [DOI] [PMC free article] [PubMed] [Google Scholar]
- Venken K. J. T., He Y., Hoskins R. A., & Bellen H. J. (2006). P[acman]: a BAC transgenic platform for targeted insertion of large DNA fragments in D. melanogaster. Science, 314(5806), 1747–1751. 10.1126/science.1134426 [DOI] [PubMed] [Google Scholar]
- Xu H., Sepúlveda L. A., Figard L., Sokac A. M., & Golding I. (2015). Combining protein and mRNA quantification to decipher transcriptional regulation. Nature Methods, 12(8), 739–742. 10.1038/nmeth.3446 [DOI] [PMC free article] [PubMed] [Google Scholar]
- Yokoshi M., Kawasaki K., Cambón M., & Fukaya T. (2022). Dynamic modulation of enhancer responsiveness by core promoter elements in living Drosophila embryos. Nucleic Acids Research, 50(1), 92–107. 10.1093/nar/gkab1177 [DOI] [PMC free article] [PubMed] [Google Scholar]
- Yuh C.-H., Ransick A., Martinez P., Britten R. J., & Davidson E. H. (1994). Complexity and organization of DNA-protein interactions in the 5′-regulatory region of an endoderm-specific marker gene in the sea urchin embryo. Mechanisms of Development, 47(2), 165–186. 10.1016/0925-4773(94)90088-4 [DOI] [PubMed] [Google Scholar]
- Zenklusen D., Larson D. R., & Singer R. H. (2008). Single-RNA counting reveals alternative modes of gene expression in yeast. In Nature Structural & Molecular Biology (Vol. 15, Issue 12, pp. 1263–1271). 10.1038/nsmb.1514 [DOI] [PMC free article] [PubMed] [Google Scholar]
- Zoller B., Little S. C., & Gregor T. (2018). Diverse Spatial Expression Patterns Emerge from Unified Kinetics of Transcriptional Bursting. Cell, 175(3), 835–847.e25. 10.1016/j.cell.2018.09.056 [DOI] [PMC free article] [PubMed] [Google Scholar]
Associated Data
This section collects any data citations, data availability statements, or supplementary materials included in this article.