. 2023 Feb 16;12:e80918. doi: 10.7554/eLife.80918

Figure 4. Clustering and gene analysis.

(A) Gene expression dot plot. The size of the dots shows how much of a cluster expresses a gene; the colour shows how much of the expression of a gene is confined to a cluster (see Materials and methods). The genes mentioned in the text are enboxed. The clusters lacking highly specific gene expression were not included. (B-C) The average shape and texture (see Materials and methods) of (B) rhabdomeric photoreceptors (cluster 8.1) and (C) the enteric neurons (cluster 8.3). (D) Localisation of the enteric neurons (pink) in the midgut volume (grey). Left: frontal view and right: side view.

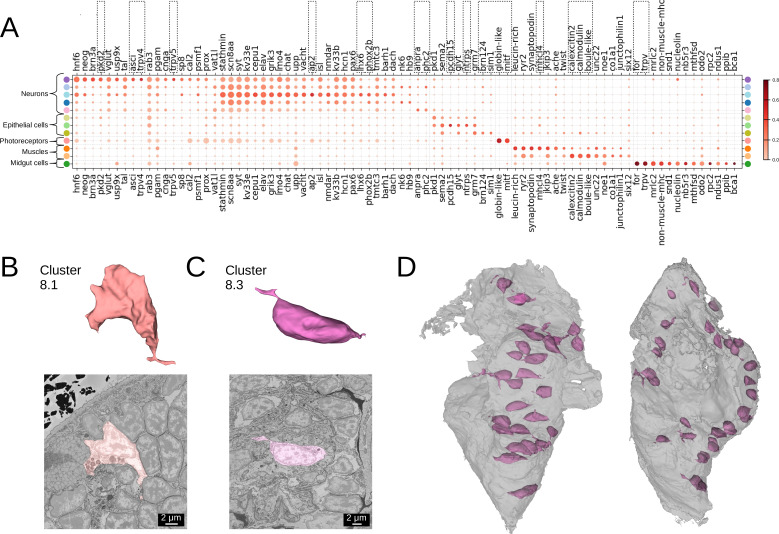
Figure 4.

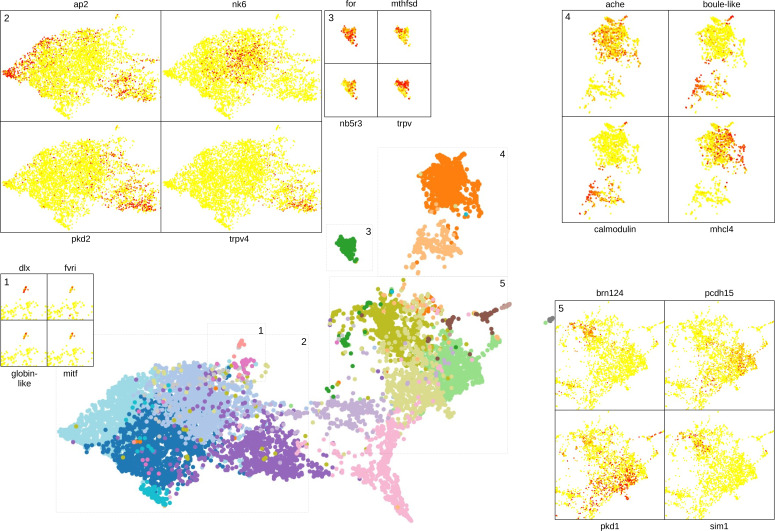
Figure 4—figure supplement 1. Clustering and gene analysis.

Figure 4—figure supplement 1.

Some of the genes shown to be differentially expressed in neuron, midgut, muscle, and epithelial clusters and in the photoreceptor cells are visualised on the UMAP representation.
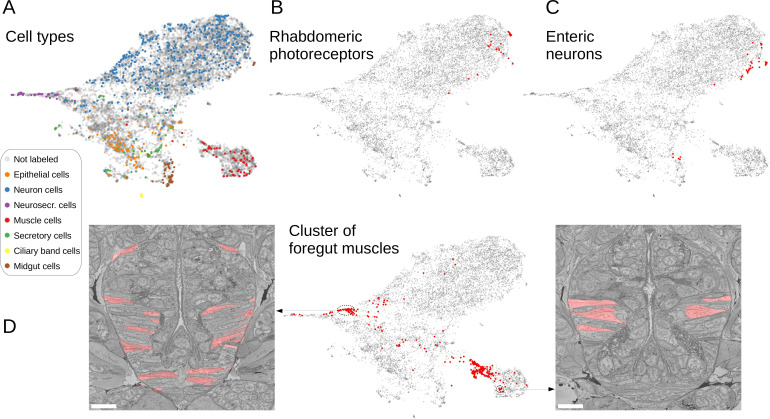
Figure 4—figure supplement 2. Comparing MorphoFeatures to a set of manually defined features from Vergara et al., 2021.

Figure 4—figure supplement 2.

(A) The set of manually defined features is visualised in 2D using UMAP. The cells for which annotations are available are visualised in respective colours. (B and C) The MorphoFeatures cluster of (B) the rhabdomeric photoreceptors and (C) enteric neurons is visualised on the UMAP representation of the manually defined features, showing a bigger spread of cells across the morphological space. (D) The MorphoFeatures cluster of the foregut muscles is split into multiple groups on the UMAP representation of the manually defined features. For two groups, cells are visualised in the animal volume, showing similarity of the cells comprising them. Scale bars: 10μm.