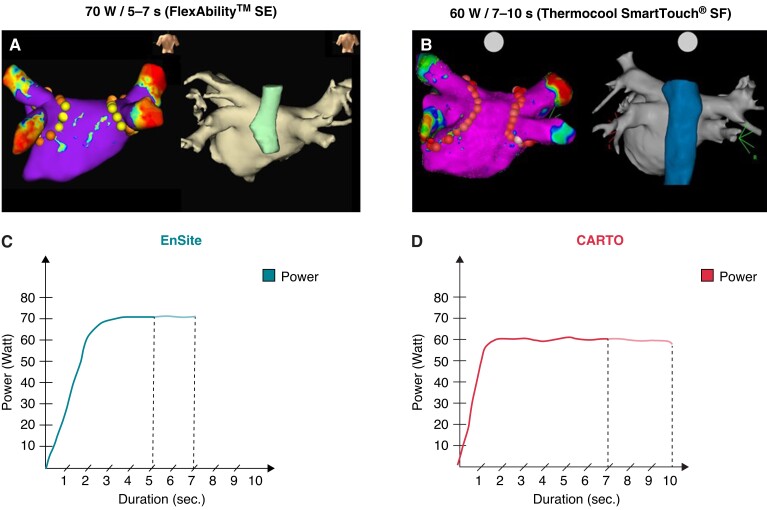
Figure 1.
Representative images showing electroanatomic maps (A–B) and vHPSD ablation settings (C–D) for the FlexAbility™ SE and the Thermocool SmartTouch® SF catheter. Voltage maps (0.05–0.5 mV) of the left atrium (LA) with ablation tags and corresponding CT reconstruction of the LA and oesophagus are shown in posterior-anterior view. Yellow ablation tags in A demonstrate the location of reduced RF application duration on the posterior wall.

