Abstract
Complex bidirectional cross talk between adipocytes and adipose tissue immune cells plays an important role in regulating adipose function, inflammation, and insulin responsiveness. Adipocytes secrete the pleiotropic cytokine IL-6 in response to both inflammatory and catabolic stimuli. Previous studies have suggested that IL-6 secretion from adipocytes in obesity may promote adipose tissue inflammation. Here, we investigated catabolic stimulation of adipocyte IL-6 secretion and its impact on adipose tissue immune cells. In obesity, catecholamine resistance reduces cAMP-driven adipocyte IL-6 secretion in response to catabolic signals. By restoring adipocyte catecholamine sensitivity in obese adipocytes, amlexanox stimulates adipocyte-specific IL-6 secretion. We report that in this context, adipocyte-secreted IL-6 activates local macrophage STAT3 to promote Il4ra expression, thereby sensitizing them to IL-4 signaling and promoting an anti-inflammatory gene expression pattern. Supporting a paracrine adipocyte to macrophage mechanism, these effects could be recapitulated using adipocyte conditioned media to pretreat bone marrow–derived macrophages prior to polarization with IL-4. The effects of IL-6 signaling in adipose tissue are complex and context specific. These results suggest that cAMP-driven IL-6 secretion from adipocytes sensitizes adipose tissue macrophages to IL-4 signaling.
Graphical Abstract
Introduction
Chronic low-grade inflammation has been implicated in many of the common comorbidities associated with obesity, including type 2 diabetes and nonalcoholic steatohepatitis. The noncanonical IκB kinases IKKε and TBK1 are induced by chronic inflammation in adipocytes and perpetuate obesity by affecting catecholamine resistance via the activation of phosphodiesterase-3B (1–4). Treatment of obese mice with amlexanox, a dual-specificity inhibitor of IKKε and TBK1, results in improved metabolic health via weight loss and resolution of white adipose tissue (WAT) inflammation (2). By restoring cAMP signaling in adipocytes, amlexanox also promotes the expression of interleukin-6 (IL-6) (5). IL-6 is a pleotropic cytokine with a complex role in obesity and WAT inflammation. While IL-6 levels are associated with an increased risk of diabetes in obese individuals (6–8), Il6 knockout (KO) mice are protected from age-associated obesity and diet-induced metabolic dysfunction (9,10), and IL-6 signaling in macrophages has an anti-inflammatory impact in obese WAT (11,12). The specific contribution of adipocyte-secreted IL-6 is unclear. One study observed proinflammatory trans-signaling in obese WAT (13), while another observed no effect (14). Catabolically stimulated adipocyte IL-6 secretion has not been investigated.
In this study, we found that in vivo amlexanox treatment resulted in an IL-6–dependent Tyr705 phosphorylation of STAT3 (pY705 STAT3) in adipose tissue macrophages (ATMs). The activation of STAT3 in macrophages resulted in upregulation of Il4ra and sensitization to IL-4 signaling. This effect could be recapitulated in vitro by treating bone marrow–derived macrophages (BMDMs) with conditioned media from adipocytes treated with amlexanox. In vivo amlexanox treatment sensitized ATMs to IL-4 in a macrophage STAT3–dependent manner.
Research Design and Methods
Animals
The following strains of mice from The Jackson Laboratory were bred for littermate-controlled experiments: C57BL/6J (Research Resource Identifier [RRID]: IMSR_JAX:000664) Stat3 floxed (RRID: IMSR_JAX:016923), LysM-cre (RRID: IMSR_JAX:004781), Adipoq-cre (RRID: IMSR_JAX:010803), and Il6 KO (RRID: IMSR_JAX:002650). Obesity was induced by a high-fat diet with 45% of calories from fat (D12451; Research Diets), starting at 6–10 weeks of age. Amlexanox was administered by daily oral gavage at a dose of 25 mg/kg to preconditioned male mice after 13–14 weeks on a high-fat diet. Mice were housed in a specific pathogen–free facility with a 12-h light, 12-h dark cycle and given free access to food and water. All animal use was approved by the institutional animal care and use committees of the University of California, San Diego; University of Michigan; and Weill Cornell Medicine.
Stromal vascular cells (SVCs) and mature adipocytes were isolated from WAT by centrifugation following collagenase digestion. Serum IL-6 levels were quantified using a Mouse IL-6 Quantikine ELISA kit (SM6000B; R&D Systems) with 50 μL of serum or media.
Cells
3T3-L1 Media Conditioning
RPMI media from differentiated 3T3-L1s treated with 100 μmol/L amlexanox or vehicle were collected after 4 h. Conditioned media were incubated with IL-6 neutralizing antibody (IL-6NA) 10 μg/mL (MAB406 [R&D Systems]; RRID: AB_2233899) or normal goat IgG control antibody 10 μg/mL (AB-108-C [R&D Systems]; RRID: AB_354267) for 15 min.
BMDM
Dispersed bone marrow cells from 6–8-week-old male mice were placed in culture media (10% FBS, 20 ng/mL macrophage colony–stimulating factor [315-02; Peprotech], 20 mmol/L HEPES, 2 mmol/L L-glutamine, and 1 mmol/L sodium pyruvate in RPMI). On day 6, cells were incubated with 50 ng/mL IL-6 (406-ML-025; R&D Systems) or conditioned culture media prior to the addition of 10 ng/mL IL-4 (404-ML-025/CF; R&D Systems) on day 7.
FACS
WAT macrophages identified as CD45+, CD11c+, Emr1+, CD31− were sorted into triazole for gene expression analysis. Each animal was sorted separately. BMDM identity was confirmed by Emr1 and CD11b dual positivity. The following antibodies were purchased from Thermo Fisher Scientific: FC block (CD16/32) (14-0161-82; RRID: AB_467133), FITC-conjugated anti-CD45(30-F11) (11-0451-82; RRID: AB_465050), Pacific Blue–conjugated anti-CD45(30-F11) (MCD4528; RRID: AB_10373710), Brilliant Violet–conjugated anti-CD45 (103147; RRID: AB_2564383), phycoerythrin (PE)-conjugated anti-CD64 (12-0641-82; RRID: AB_2735014), allophycocyanin (APC)-conjugated anti-RRID: AB_469346), Percp-Cy5–conjugated anti-CD3 (45-0031-82; RRID: AB_1107000), PE-Cy7–conjugated anti-CD31 (25-0311-82; RRID: AB_2716949), APC-Cy7–conjugated anti-LysG (25-9668-82; RRID: AB_2811793), and eFluor-450–conjugated pY705 STAT3 (48-9033-42; RRID: AB_2574121). The following antibodies were purchased from BioLegend: APC-Cy7–conjugated anti-CD11c (117324; RRID: AB_830649), APC-conjugated anti-Emr1 (123116; RRID: AB_893481), APC/Fire-conjugated anti-CD11b (101262; RRID: AB_2572122), and PE/Cy7-conjugated anti-CD31 (102418; RRID: AB_830757). Alexa Fluor 647–conjugated anti-CLEC10A/CD301 was from Novus Biologicals (64874AF647; RRID: AB_2915978). Stained cells were analyzed or sorted by flow cytometry on a MoFlo Astrios cell sorter (Beckman Coulter) at the University of Michigan Flow Cytometry Core or on the BD FACSAria II at the University of California, San Diego, Flow Cytometry Core in Moores Cancer Center.
Western Blot Analysis
The following primary antibodies were purchased from Cell Signaling Technology: pY705 STAT3 1:1,000 (9145; RRID: AB_2491009), STAT3 1:4,000 (9139; RRID: AB_331757), STAT6 (9362; RRID: AB_2271211), pY641 STAT6 1:1,000 (56554; RRID: AB_2799514), β-tubulin 1:1,000 (2146; RRID: AB_2210545), and p38 1:1,000 (9212; RRID: AB_330713). The following secondary antibodies were purchased from Thermo Fisher Scientific: goat anti-mouse 1:10,000 (31430; RRID: AB_228307) and goat anti-rabbit 1:10,000 (31460; RRID: AB_228341).
Immunohistochemistry
After blocking with 5% goat serum, slides were incubated overnight with 1:200 anti-pY705 STAT3 and detected with 3,3′-diaminobenzidine (DAB) after washing.
Gene Expression Analysis
Real-time PCR with Power SYBR Green was performed using the QuantStudio 5 Real-Time PCR system (Applied Biosystems) and quantified using an internal standard curve with Arbp as the control gene.
Data and Resource Availability
All data generated or analyzed during this study are included in the published article (and its online supplementary files). No applicable resources were generated or analyzed during the current study.
Results
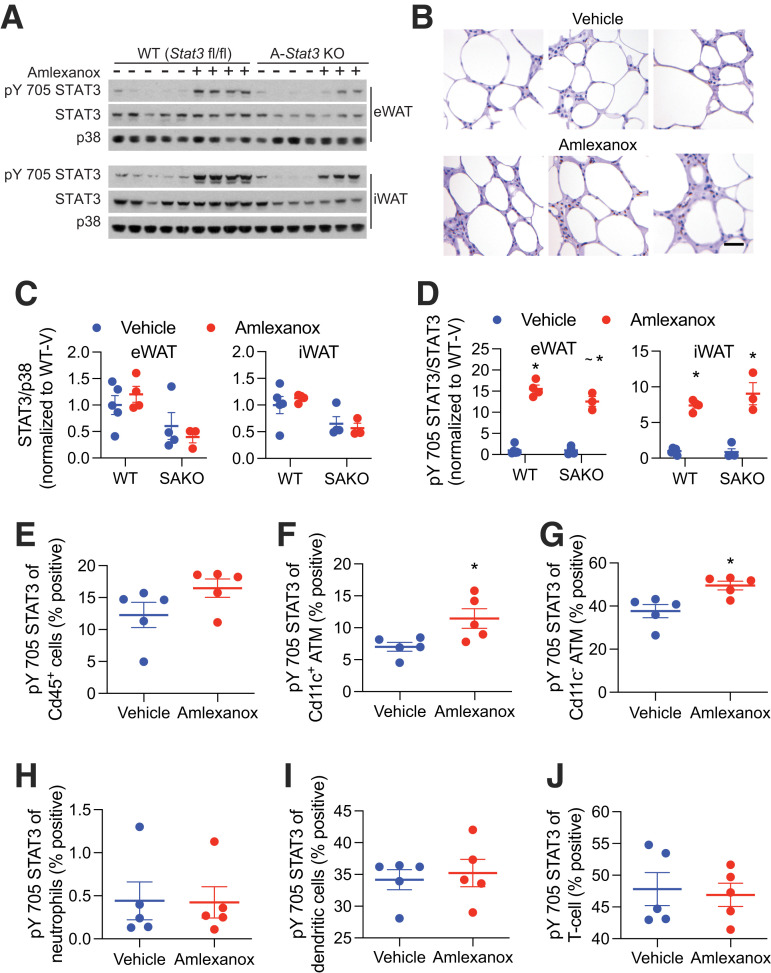
Amlexanox treatment of obese mice acutely promotes adipocyte IL-6 secretion via cAMP signaling (15). Four hours after oral gavage with amlexanox, when serum IL-6 levels peak, pY705 STAT3 is elevated in WAT (Fig. 1A). Immunohistochemical analysis revealed many pY705 STAT3–positive nuclei in crown-like structures (Fig. 1B). KO of STAT3 in adipocytes significantly reduced total WAT levels of STAT3 (Fig. 1A and C). The remaining STAT3, attributable to nonadipocyte cells, was similarly phosphorylated (Fig. 1A and D). To investigate STAT3 phosphorylation in immune cells, SVCs were collected and analyzed for pY705 STAT3 by FACS. Amlexanox specifically increased pY705 STAT3 in both Cd11c+ and Cd11c− ATMs (Fig. 1E–G). No STAT3 activation was observed in neutrophils, dendritic cells, or T cells (Fig. 1H–J). The mechanism of specificity for macrophages is not clear.
Figure 1.
STAT3 phosphorylation in adipose cells after amlexanox treatment. Experiments were performed 4 h after gavage with 25 mg/kg amlexanox or vehicle control in obese male mice aged 20–24 weeks. A: Western blot analysis of STAT3 and pY705 STAT3 in epididymal (eWAT) and inguinal WAT (iWAT) of Stat3 adipocyte-specific KO (SAKO) mice and floxed littermate controls. B: Immunohistochemical analysis of pY705 STAT3 brown DAB staining. Slides were also stained with hematoxylin and eosin. Tissues were harvested and immediately fixed after 52 h of amlexanox treatment by daily oral gavage (n = 3 per treatment). Scale bar = 50 μm. C: Quantification of STAT3 over p38 levels in eWAT and iWAT. The effect of genotype is significant in both tissues at P < 0.01 by two-way ANOVA. D: Quantification of pY705 STAT3 over total STAT3 levels in eWAT and iWAT. *P < 0.05 vehicle vs. amlexanox within genotype; ∼P < 0.05 WT vs. KO within the treatment group. E–J: FACS analysis of the percent positivity for pY705 STAT3 in SVC populations (n = 5 per treatment): all Cd45+ immune cells (E); proinflammatory ATMs Cd45+, Cd64+, and Cd11cHigh (F); anti-inflammatory ATMs Cd45+, Cd64+, and Cd11cLow (G); neutrophilsCd45+ and Ly6G+ (H); dendritic cells Cd45+, Cd64−, and Cd11c+ (I); and T cells Cd45+ and Cd3+ (J). Statistical significance determined by post hoc analysis after significant two-way ANOVA. *P < 0.05 by Student t test vehicle vs. amlexanox. V, vehicle.
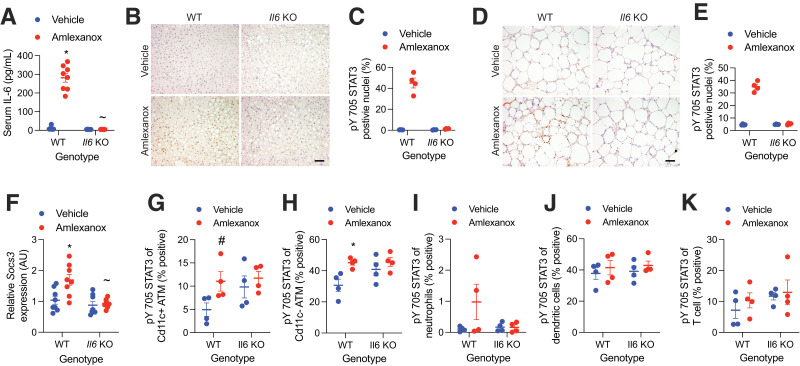
To determine dependence on IL-6, we used whole-body Il6 KO animals. While littermate controls demonstrated elevated serum IL-6 following amlexanox treatment, IL-6 levels were undetectable in the Il6 KO animals (Fig. 2A). Hepatic STAT3 is activated by adipocyte-secreted IL-6 following amlexanox treatment (15). As expected, amlexanox treatment induced hepatic pY705 STAT3 in the wild-type (WT) but not Il6 KO livers (Fig. 2B and C). Staining for pY705 STAT3 was prominent in crown-like structures from WT but not Il6 KO WAT (Fig. 2D and E). Accordingly, Socs3, a STAT3 target gene, was elevated in the WAT by amlexanox treatment only in WT mice (Fig. 2F). The increase in macrophage pY705 STAT3 by amlexanox was dependent on IL-6, as it was not observed in ATMs from Il6 KO mice (Fig. 2G–K). The presence of pY705 STAT3 in the Il6 KO ATMs may be mediated by another IL-6 family cytokine, none of which are induced by amlexanox (Supplementary Fig. 1).
Figure 2.
STAT3 activation in adipose tissue immune cells is IL-6 dependent. Experiments were performed 4 h after gavage with 25 mg/kg amlexanox or vehicle control in obese Il6 KO and WT littermate control male mice aged 20–24 weeks. A: Serum IL-6 levels (n = 8 per group). B–E: Immunohistochemical analysis of pY705 STAT3 (brown DAB staining). Slides also stained with hematoxylin and eosin. Tissues were harvested and immediately fixed 4 h after gavage. Liver is shown in B and C and WAT in D and E. Panels B and D show representative images from each genotype and treatment (scale bar = 100 μm), and panels C and E show the percentage of positive nuclei in sections from four animals per condition (three fields of view with ∼200 nuclei each were averaged for each animal). F: Relative expression of Socs3 in WAT (n = 8 per group). G–K: FACS analysis of the percent positivity of pY705 STAT3 in SVC populations (n = 4 per group): proinflammatory ATMs Cd45+, Cd64+, and Cd11cHigh (G); anti-inflammatory ATMs Cd45+, Cd64+, and Cd11cLow (H); neutrophils Cd45+ and Ly6G+ (I); dendritic cells Cd45+, Cd64−, and Cd11c+ (J); and T cells Cd45+ and Cd3+ (K). Statistical significance determined by post hoc analysis after significant two-way ANOVA. *P < 0.05 vehicle vs. amlexanox within genotype; ∼P < 0.05 WT vs. KO within treatment group; #P < 0.05 vehicle vs. amlexanox within genotype using Fisher exact test. AU, arbitrary unit.
IL-6 stimulation in macrophages activates STAT3-mediated expression of Il4ra, thereby sensitizing the cells to the anti-inflammatory effects of IL-4 (11,12). Using BMDMs, we confirmed that IL-6 treatment increased Il4ra expression and pY641 STAT6 in response to IL-4 treatment (Supplementary Fig. 2A and B). IL-6 pretreatment increased the induction of Arg1 and suppression of Il1b expression by IL-4 (Supplementary Fig. 2C and D).
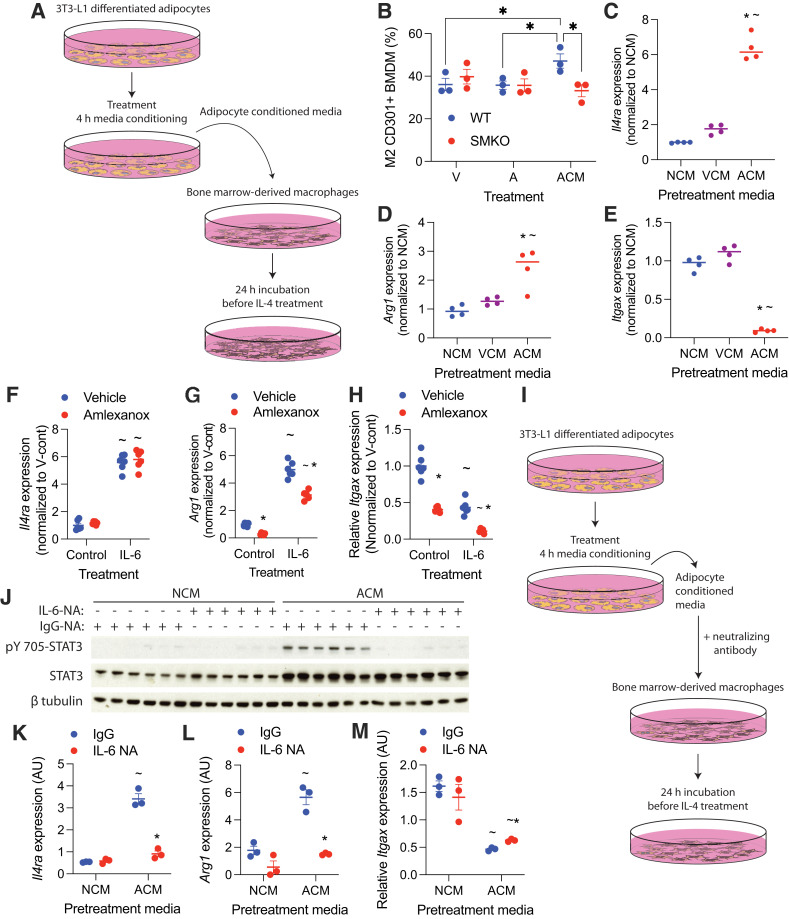
To determine whether IL-6 secreted from amlexanox-treated adipocytes may function as a paracrine signal to ATMs, we treated BMDMs with conditioned media from amlexanox-treated 3T3-L1 adipocytes (Fig. 3A). Amlexanox conditioned media (ACM), but not direct amlexanox treatment, increased the percentage of CD301+ cells in BMDM polarized with IL-4 (Fig. 3B). While conditioned media from adipocytes treated with vehicle conditioned media (VCM) did not significantly increase Il4ra expression in BMDMs, ACM increased Il4ra expression sixfold over nonconditioned media (NCM) (Fig. 3C). ACM, but not VCM, increased Arg1 and decreased Itgax expression in BMDM polarized with IL-4 (Fig. 3D and E). Importantly, ACM did not promote CD301+ macrophages in Stat3 KO BMDMs (from LysM-cre–driven myeloid cell–specific Stat3 KO [SMKO] mice), indicating that the effects of the ACM on macrophage polarization were mediated through STAT3 (Fig. 3B). Direct amlexanox treatment did not promote Il4ra or Arg1 expression in BMDMs, either alone or in combination with IL-6 treatment (Fig. 3F and G), while Itgax expression was additively suppressed both by IL-6 and amlexanox (Fig. 3H).
Figure 3.
Adipocyte-secreted IL-6 sensitizes macrophages to IL-4. Adipocyte conditioned media was generated by treating adipocytes with 100 μmol/L amlexanox in RPMI medium for 4 h. Direct treatment of BMDMs with amlexanox was also performed with 100 μmol/L amlexanox. A: Schematic of adipocyte media conditioning and treatment of BMDMs. B: Percent CD301+ staining of F4/80, CD11b dual-positive BMDM treated with amlexanox directly, or ACM (n = 3 per group). *P < 0.05, comparison indicated by line. C–E: Gene expression in BMDMs pretreated with NCM, VCM, or ACM for 24 h before the addition of IL-4 for another 24 h (n = 4 per group). *P < 0.05 ACM vs. VCM; ∼P < 0.05 ACM vs. NCM. F–H: Gene expression in BMDMs treated with 50 ng/mL IL-6 with and without amlexanox, normalized to the VCM (n = 6 per group). *P < 0.05 vehicle vs. amlexanox; ∼P < 0.05 control vs. IL-6. I: Schematic of adipocyte media conditioning with neutralizing antibodies and administration to BMDMs. J–M: BMDMs treated with VCM or ACM in which IL-6 was neutralized with IL-6NA or IgG control. *P < 0.05 IgG vs. IL-6NA; ∼P < 0.05 ACM vs. NCM. J: Western blot analysis of pY705 STAT3; β-tubulin serves as a loading control (n = 3 per group). Statistical significance determined by post hoc analysis after significant ANOVA. A, amlexanox; AU, arbitrary unit; V, vehicle; V-cont, vehicle control.
To confirm that IL-6 in the ACM mediates the effects of amlexanox, we treated the conditioned media with IL-6NA or IgG antibody control (Fig. 3I and Supplementary Fig. 3). Neutralization of IL-6 prevented the induction of pY705 STAT3 and blocked the induction of Il4ra in BMDMs treated with ACM (Fig. 3J and K). Accordingly, neutralization of IL-6 in the ACM blocked its ability to promote Arg1 expression in IL-4–polarized macrophages and attenuated the suppression of Itgax expression (Fig. 3L and M). These results suggest that IL-6 secreted from amlexanox-stimulated adipocytes sensitizes macrophages to IL-4 signaling.
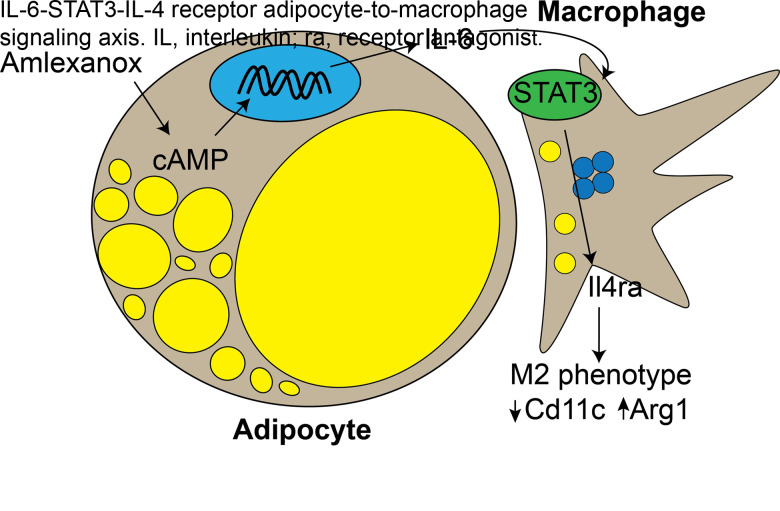
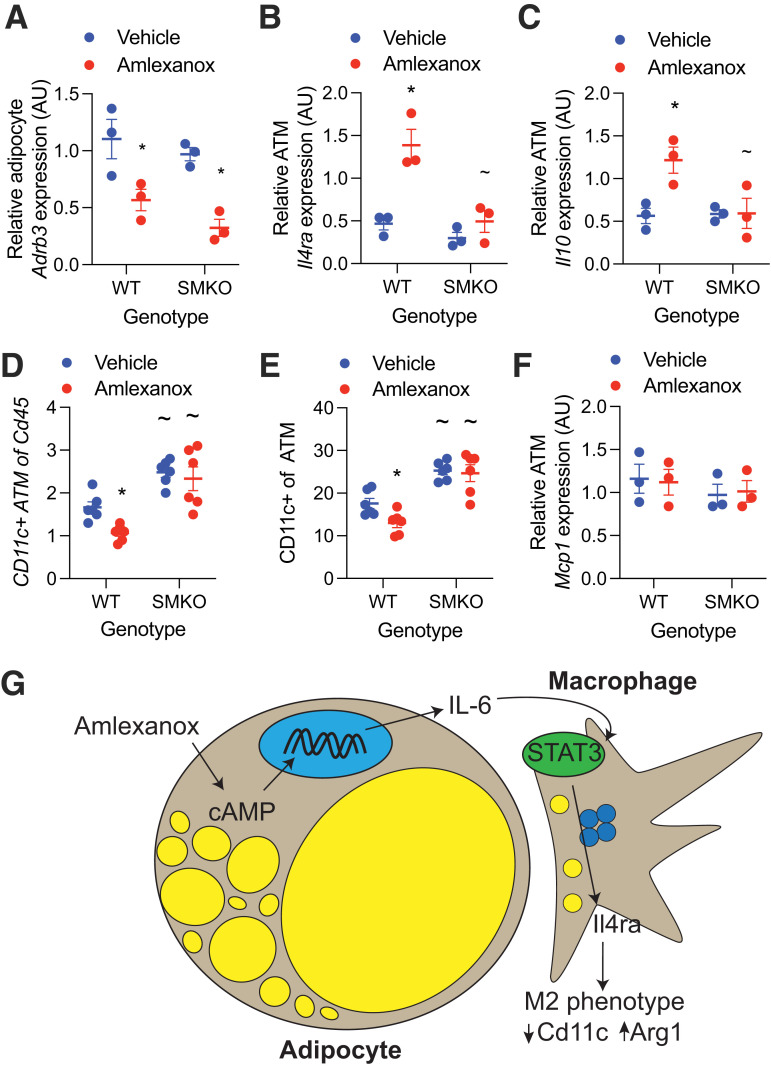
To determine whether in vivo amlexanox treatment results in similar IL-4 sensitization in ATMs, we measured gene expression in mature adipocytes and ATMs isolated from mice 8 h after a single dose of amlexanox or vehicle control. The reduction in Adrb3 expression (due to feedback inhibition) by amlexanox treatment was significant in both the WT and SMKO mature adipocytes, with no significant differences between the genotypes (Fig. 4A). Amlexanox induced Il4ra expression in WT but not SMKO ATMs (Fig. 4B). Consistent with sensitization to IL-4 signaling in vivo, amlexanox treatment increased the expression of Il10 in ATMs from WT but not SMKO WAT (Fig. 4C). The frequency of proinflammatory Cd11c+ ATMs decreased 52 h after amlexanox treatment in WT but not SMKO mice, again indicating dependence on macrophage STAT3 (Fig. 4D and E). Notably, we did not observe any change in the expression of macrophage recruiting factor Mcp1 in the adipocytes from mice treated with amlexanox versus vehicle control (Fig. 4F). These data support a model in which adipocyte-secreted IL-6 resulting from oral amlexanox treatment plays a paracrine role activating local macrophage STAT3, which in turn upregulates the expression of Il4ra, thereby increasing the sensitivity of the macrophages to IL-4 signaling (Fig. 4G).
Figure 4.
In vivo sensitization of macrophages to IL-4 by amlexanox requires STAT3. A–C: Obese male mice aged 20–24 weeks were treated with 25 mg/kg amlexanox or vehicle control. After 4 h, the eWAT was collected and digested with collagenase (n = 3 per group). A: Quantitative PCR analysis of Adrb3 expression in mature adipocytes from epididymal fat. B and C: Quantitative PCR analysis of gene expression in epididymal ATMs (Cd45+, F4/80+, Cd11b+, and Cd3−) isolated by FACS from SVCs. D and E: FACS analysis of SVCs isolated from the epididymal fat of obese male mice aged 20–24 weeks treated with 25 mg/kg amlexanox or vehicle control for 52 h (n = 6 per group). Macrophages defined as CD45+, F4/80+, CD11b+, and Cd3− cells. D: CD11c+ macrophages as a percentage of CD45+ cells. E: CD11c+ macrophages as a percentage of total macrophages. F: Quantitative PCR analysis of Mcp1 expression in mature adipocytes from epididymal fat (n = 3 per group). G: Schematic of oral amlexanox treatment and activation of this adipocyte-to-macrophage communication axis. Statistical significance determined by post hoc analysis after significant two-way ANOVA. *P < 0.05 vehicle vs. amlexanox within genotype; ∼P < 0.05 WT vs. KO within treatment group. AU, arbitrary unit.
Discussion
The role of IL-6 in adipose tissue inflammation and metabolic health is complex. Adding to this complexity are numerous cellular sources of IL-6 in WAT (13,16). IL-6 is a pleotropic cytokine whose production is stimulated by a variety of signaling pathways. In adipocytes, IL-6 secretion can be stimulated by inflammatory nuclear factor-κB signaling or catabolic cAMP signaling downstream of catecholamine stimulation. Studies in obese adipocyte–specific Il6 KO mice have suggested that adipocyte-secreted IL-6 promotes WAT inflammation or has no net effect (13,14,17). Obese adipocytes primarily secrete IL-6 downstream of inflammatory, but not catabolic, stimulation due to increased nuclear factor-κB signaling and catecholamine resistance (3,4,18,19). To probe the impact of catabolic IL-6 secretion from adipocytes in the context of obesity, we used amlexanox treatment, which reverses intracellular catecholamine resistance to stimulate IL-6 secretion in obese adipocytes (2,4). We observed that amlexanox-stimulated IL-6 secretion from adipocytes activates STAT3 in ATMs, sensitizing them to IL-4 by upregulating the expression of IL4ra. Previous studies have reported direct anti-inflammatory effects of amlexanox (20–22), but direct amlexanox treatment in BMDMs did not activate STAT3 or sensitize them to IL-4 treatment. We did observe a direct additive effect of amlexanox to suppress Itgax expression in BMDMs. However, the in vivo impact of amlexanox to acutely reduce the percentage of CD11c+ ATMs depended on macrophage STAT3. While our results suggest an anti-inflammatory effect of amlexanox-induced IL-6 secretion from adipocytes, there are likely multiple pathways by which amlexanox affects WAT inflammation in obese animals. One limitation of these studies is the exclusive use of amlexanox to induce catabolic adipocyte IL-6 secretion. Additional studies are required to determine whether this signaling axis is active in other physiological/pathophysiological contexts when adipocytes are catabolically activated.
Article Information
Acknowledgments. The authors thank the University of Michigan Flow Cytometry Core; VA San Diego Healthcare System Flow Cytometry Research Core; University of California, San Diego, Flow Cytometry Core in Moores Cancer Center; and University of Michigan Cancer Center Research Histology Laboratory. The authors also thank Brian Zamarron and Carey Lumeng from the University of Michigan for assistance in designing the FACS antibody panels.
Funding. This work was supported by National Institutes of Health grant R01DK126944 (to S.M.R.) and American Diabetes Association grant 1-19-JDF-012 (to S.M.R). D.L. was supported by the University of Michigan Undergraduate Research Opportunity Program Summer Biomedical and Life Sciences Fellowship. J.C. was supported by the Perrigo Undergraduate Summer Fellowship. W.X. was supported by Austrian Science Fund grants SFB LIPTOX F3018, P27108, P28882, and DK-MCD W1226 and the Austrian Marshall Plan Scholarship.
Duality of Interest. No potential conflicts of interest relevant to this article were reported.
Author Contributions. D.L., B.D., J.Z., P.E.B.-C., J.H.D., W.X., J.C., and S.M.R. contributed to the investigation. D.L., B.D., J.Z., P.E.B.-C., J.H.D., J.C., and S.M.R. contributed to the formal analysis. D.L. and S.M.R. designed the methodology. B.D., J.Z., P.E.B.-C., J.H.D., and S.M.R. reviewed and edited the manuscript. B.D., J.H.D., and S.M.R. wrote the original draft of the manuscript. S.M.R. conceptualized the study and provided visualization and supervision. S.M.R. is the guarantor of this work and, as such, had full access to all the data in the study and takes responsibility for the integrity of the data and the accuracy of the data analysis.
Footnotes
This article contains supplementary material online at https://doi.org/10.2337/figshare.21637169.
D.L. and B.D. contributed equally.
J.Z. is currently affiliated with Trutino Biosciences, San Diego, CA.
J.H.D. is currently affiliated with Virginia Tech Carilion School of Medicine, Roanoke, VA.
J.C. is currently affiliated with Department of Orthopedic Surgery, Henry Ford Hospital, Detroit, MI.
References
- 1. Arkan MC, Hevener AL, Greten FR, et al. IKK-beta links inflammation to obesity-induced insulin resistance. Nat Med 2005;11:191–198 [DOI] [PubMed] [Google Scholar]
- 2. Reilly SM, Chiang SH, Decker SJ, et al. An inhibitor of the protein kinases TBK1 and IKK-ɛ improves obesity-related metabolic dysfunctions in mice. Nat Med 2013;19:313–321 [DOI] [PMC free article] [PubMed] [Google Scholar]
- 3. Chiang SH, Bazuine M, Lumeng CN, et al. The protein kinase IKKepsilon regulates energy balance in obese mice. Cell 2009;138:961–975 [DOI] [PMC free article] [PubMed] [Google Scholar]
- 4. Mowers J, Uhm M, Reilly SM, et al. Inflammation produces catecholamine resistance in obesity via activation of PDE3B by the protein kinases IKKε and TBK1. eLife 2013;2:e01119. [DOI] [PMC free article] [PubMed] [Google Scholar]
- 5. Reilly SM, Abu-Odeh M, Ameka M, et al. FGF21 is required for the metabolic benefits of IKKε/TBK1 inhibition. J Clin Invest 2021;131:e145546. [DOI] [PMC free article] [PubMed] [Google Scholar]
- 6. Kern PA, Ranganathan S, Li C, Wood L, Ranganathan G. Adipose tissue tumor necrosis factor and interleukin-6 expression in human obesity and insulin resistance. Am J Physiol Endocrinol Metab 2001;280:E745–E751 [DOI] [PubMed] [Google Scholar]
- 7. Bastard JP, Maachi M, Van Nhieu JT, et al. Adipose tissue IL-6 content correlates with resistance to insulin activation of glucose uptake both in vivo and in vitro. J Clin Endocrinol Metab 2002;87:2084–2089 [DOI] [PubMed] [Google Scholar]
- 8. Pradhan AD, Manson JE, Rifai N, Buring JE, Ridker PM. C-reactive protein, interleukin 6, and risk of developing type 2 diabetes mellitus. JAMA 2001;286:327–334 [DOI] [PubMed] [Google Scholar]
- 9. Matthews VB, Allen TL, Risis S, et al. Interleukin-6-deficient mice develop hepatic inflammation and systemic insulin resistance. Diabetologia 2010;53:2431–2441 [DOI] [PubMed] [Google Scholar]
- 10. Wallenius V, Wallenius K, Ahrén B, et al. Interleukin-6-deficient mice develop mature-onset obesity. Nat Med 2002;8:75–79 [DOI] [PubMed] [Google Scholar]
- 11. Mauer J, Chaurasia B, Goldau J, et al. Signaling by IL-6 promotes alternative activation of macrophages to limit endotoxemia and obesity-associated resistance to insulin. Nat Immunol 2014;15:423–430 [DOI] [PMC free article] [PubMed] [Google Scholar]
- 12. Braune J, Weyer U, Hobusch C, et al. IL-6 regulates M2 polarization and local proliferation of adipose tissue macrophages in obesity. J Immunol 2017;198:2927–2934 [DOI] [PubMed] [Google Scholar]
- 13. Han MS, White A, Perry RJ, et al. Regulation of adipose tissue inflammation by interleukin 6. Proc Natl Acad Sci U S A 2020;117:2751–2760 [DOI] [PMC free article] [PubMed] [Google Scholar]
- 14. Whitham M, Pal M, Petzold T, et al. Adipocyte-specific deletion of IL-6 does not attenuate obesity-induced weight gain or glucose intolerance in mice. Am J Physiol Endocrinol Metab 2019;317:E597–E604 [DOI] [PubMed] [Google Scholar]
- 15. Reilly SM, Ahmadian M, Zamarron BF, et al. A subcutaneous adipose tissue-liver signalling axis controls hepatic gluconeogenesis. Nat Commun 2015;6:6047. [DOI] [PMC free article] [PubMed] [Google Scholar]
- 16. Fain JN. Release of interleukins and other inflammatory cytokines by human adipose tissue is enhanced in obesity and primarily due to the nonfat cells. Vitam Horm 2006;74:443–477 [DOI] [PubMed] [Google Scholar]
- 17. Navia B, Ferrer B, Giralt M, et al. Interleukin-6 deletion in mice driven by aP2-Cre-ERT2 prevents against high-fat diet-induced gain weight and adiposity in female mice. Acta Physiol (Oxf) 2014;211:585–596 [DOI] [PubMed] [Google Scholar]
- 18. Jensen MD, Haymond MW, Rizza RA, Cryer PE, Miles JM. Influence of body fat distribution on free fatty acid metabolism in obesity. J Clin Invest 1989;83:1168–1173 [DOI] [PMC free article] [PubMed] [Google Scholar]
- 19. Bougnères P, Stunff CL, Pecqueur C, Pinglier E, Adnot P, Ricquier D. In vivo resistance of lipolysis to epinephrine. A new feature of childhood onset obesity. J Clin Invest 1997;99:2568–2573 [DOI] [PMC free article] [PubMed] [Google Scholar]
- 20. Han Y, Hou R, Zhang X, et al. Amlexanox exerts anti-inflammatory actions by targeting phosphodiesterase 4B in lipopolysaccharide-activated macrophages. Biochim Biophys Acta Mol Cell Res 2020;1867:118766. [DOI] [PubMed] [Google Scholar]
- 21. Makino H, Saijo T, Ashida Y, Kuriki H, Maki Y. Mechanism of action of an antiallergic agent, amlexanox (AA-673), in inhibiting histamine release from mast cells. Acceleration of cAMP generation and inhibition of phosphodiesterase. Int Arch Allergy Appl Immunol 1987;82:66–71 [DOI] [PubMed] [Google Scholar]
- 22. Quan MY, Song XJ, Liu HJ, et al. Amlexanox attenuates experimental autoimmune encephalomyelitis by inhibiting dendritic cell maturation and reprogramming effector and regulatory T cell responses. J Neuroinflammation 2019;16:52. [DOI] [PMC free article] [PubMed] [Google Scholar]


