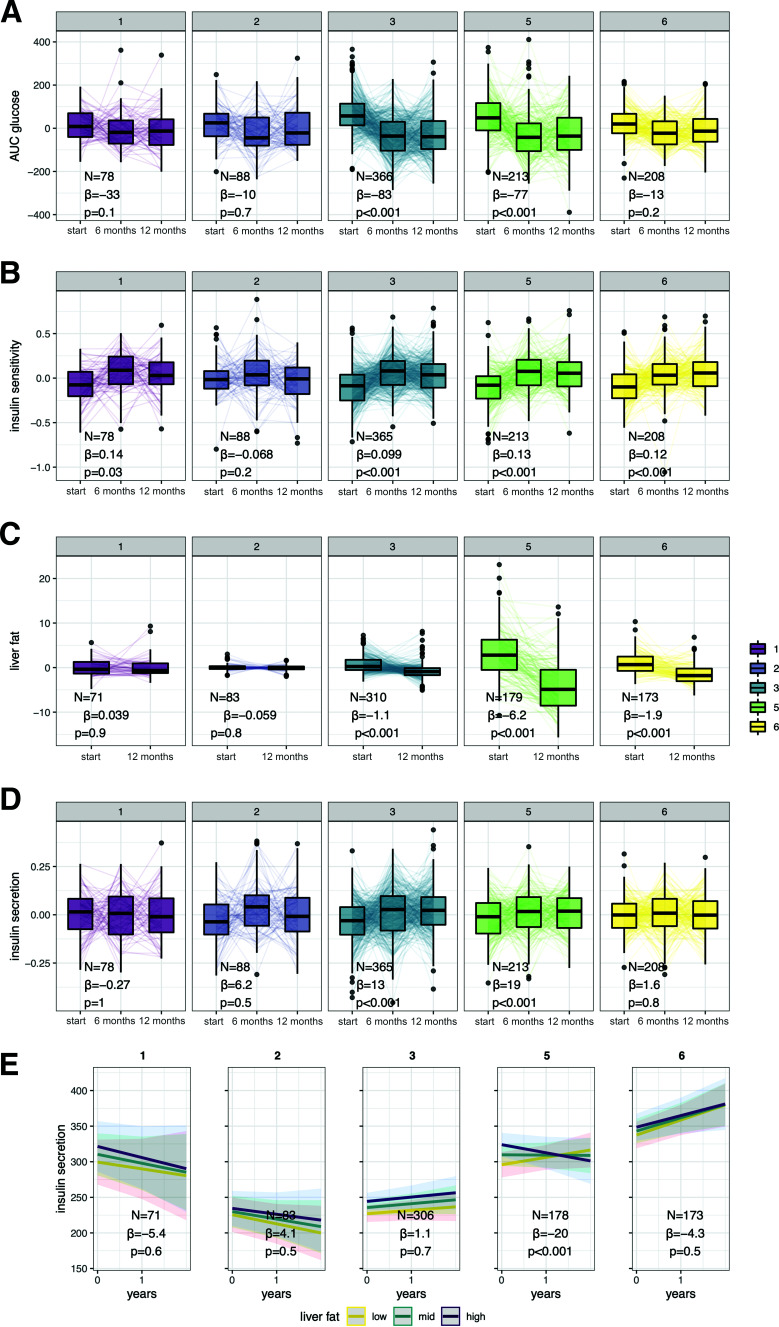
Figure 1.
Cluster-specific change of glycemia (A), insulin sensitivity (B), liver fat (C), and insulin secretion (D) during LI with influence of liver fat on change of insulin secretion during LI (E). Subpanels 1–6 indicate the respective prediabetes clusters. Traits are shown as residuals from generalized linear mixed models adjusted for sex, age, BMI, time × intervention (control, conventional, or intensive), and in the case of insulin secretion, additionally for insulin sensitivity as fixed effects. Effect sizes (β) and P values are provided for the term time. Cluster-wise interactions between hepatic fat content and time in generalized linear mixed models are shown as marginal effects by plotting the modeled change of insulin secretion for low (mean − SD), mid (mean) and high (mean + SD) hepatic fat content. Effect sizes (β) and P values are provided for the interaction between liver fat and time.

