We demonstrated the use of a prototype home optical coherence tomography device coupled with image analysis software and compared it with manual human grading. Automated assessment of optical coherence tomography images acquired using the prototype home optical coherence tomography device showed excellent agreement with manual human grading for retinal fluid detection and quantification.
Key words: automated analysis, home-monitoring, neovascular age-related macular degeneration, optical coherence tomography, quantitative assessment, retinal fluid
Purpose:
To evaluate a prototype home optical coherence tomography device and automated analysis software for detection and quantification of retinal fluid relative to manual human grading in a cohort of patients with neovascular age-related macular degeneration.
Methods:
Patients undergoing anti-vascular endothelial growth factor therapy were enrolled in this prospective observational study. In 136 optical coherence tomography scans from 70 patients using the prototype home optical coherence tomography device, fluid segmentation was performed using automated analysis software and compared with manual gradings across all retinal fluid types using receiver-operating characteristic curves. The Dice similarity coefficient was used to assess the accuracy of segmentations, and correlation of fluid areas quantified end point agreement.
Results:
Fluid detection per B-scan had area under the receiver-operating characteristic curves of 0.95, 0.97, and 0.98 for intraretinal fluid, subretinal fluid, and subretinal pigment epithelium fluid, respectively. On a per volume basis, the values for intraretinal fluid, subretinal fluid, and subretinal pigment epithelium fluid were 0.997, 0.998, and 0.998, respectively. The average Dice similarity coefficient values across all B-scans were 0.64, 0.73, and 0.74, and the coefficients of determination were 0.81, 0.93, and 0.97 for intraretinal fluid, subretinal fluid, and subretinal pigment epithelium fluid, respectively.
Conclusion:
Home optical coherence tomography device images assessed using the automated analysis software showed excellent agreement to manual human grading.
Age-related macular degeneration is a highly prevalent disease of the central retina affecting people aged 60 years or older.1 An advanced form of the disease, known as neovascular age-related macular degeneration (nAMD), can result in sudden and irreversible loss of central vision if left untreated.2 Since 2006, however, outcomes for patients with nAMD have improved owing to the advent of anti-vascular endothelial growth factor (VEGF) therapy.3
Advances in anti-VEGF therapies have been complemented by technological advances in ocular imaging. Optical coherence tomography (OCT), now the mainstay of ocular imaging, is the primary tool in the diagnosis and management of nAMD.4 Specifically, OCT allows for the identification of retinal fluid, a key biomarker of disease activity in nAMD. Importantly, treatment decisions in nAMD are made in accordance with a qualitative assessment of its presence.4,5
Ophthalmological society treatment guidelines for nAMD recommend regular anti-VEGF injections until visual acuity has stabilized and disease monitoring thereafter to ensure optimal outcomes.3,5,6 This approach, although effective, results in significant treatment and monitoring burdens for both patients and clinics.7 However, with the advent of deep learning-based approaches, fully automated analysis of OCT images can accurately identify important biomarkers of nAMD activity/progression, such as intraretinal fluid (IRF), subretinal fluid (SRF), and subretinal pigment epithelium (sub-RPE) fluid, potentially alleviating the disease-monitoring difficulty.8–10
A home-based OCT system, with self-scanning, coupled with an image analysis software has the potential to offer near real-time monitoring for patients with nAMD. Such a solution could detect an immediate need for anti-VEGF retreatment, thereby optimizing visual outcomes and lessening the disease-monitoring burden for the patients, their caregiver(s), and the clinic. Within this context, we report on the detection and quantification of three retinal fluid types acquired using a prototype home OCT device in a patient population undergoing treatment for nAMD.
Methods
Study Design, Population, and Setting
This prospective observational study involved patients with active and nonactive nAMD at the Luigi Sacco Hospital, University of Milan, Milan, Italy. The inclusion criteria included patients aged 50 years or older with a diagnosis of nAMD in at least one eye. Patients may have completed a loading dose of three monthly intravitreal anti-VEGF injections, receiving their previous injection within 3 months of the screening visit; the study eye may exhibit exudative age-related macular degeneration with the presence of SRF, IRF, and/or sub-RPE fluid.
The exclusion criteria were as follows: a documented history of advanced retinal disease other than nAMD, diagnosed cataracts or other media opacities that may affect clear images of the retina, eye surgery in the previous 2 months, patients currently on eye drops related to a previous eye surgery, and any advanced eye disease that would affect the acquisition of retinal images. This study adhered to the tenets of the Declaration of Helsinki and was approved by the Institutional Review Board of the Italian Ministry of Health. All patients gave written informed consent.
Optical Coherence Tomography Device
The prototype home OCT device is a spectral domain OCT developed by OCT Health LLC (OCT Health LLC, Sacramento, CA) using a light source of 840 nm. The device runs at a rate of 20,000 A-scans per second (20 KHz). The two different scan patterns acquired were line and star scans centered at the fovea. The line scan involves five horizontal B-scans evenly separated over a 6 × 3 mm lateral field of view (FOV), and each B-scan comprises 700 A-scans of 3-mm depth. A star scan comprises six radial B-scans evenly separated over a 6 × 6 mm lateral FOV; each B-scan comprised 512 A-scans, also of 3-mm depth. For the home OCT device, scans were obtained without dilation of the eyes.
Study Procedures
Demographic and clinical data including age, sex, best-corrected visual acuity, and diagnosis of nAMD and other conditions were recorded. Enrolled patients underwent a brief training period with the home OCT device and then captured the image themselves in the clinical setting. The procedure involves the patient looking into the eye piece, finding the fixation target, and waiting for an audible cue before sitting back. During each acquisition, 20 repeated line scan volumes or 20 repeated star scan volumes were captured. For each of these, the two best volumes were chosen for analysis based on their signal-to-noise ratio, resulting in some redundancy in the data. Optical coherence tomography spectral domain Spectralis (Heidelberg Engineering, Heidelberg, Germany) and Cirrus 5,000 (Carl Zeiss Meditec, Dublin, CA) OCT devices were used after pupil dilatation to obtain a standard clinical scan of the study eyes.
For the Cirrus, a volume of 128 B-scans comprising 512 A-scans of length 1,024 pixels were acquired over a 6 × 6 mm FOV. Using the Spectralis, a volume of 97 B-scans, comprising 512 A-scans each of length 496 pixels were acquired over the same FOV. In addition, the Spectralis' automatic retinal tracking mode was used to ensure that all B-scans were acquired with averaging and minimal eye movement over the imaging area of interest. The default of five B-scans per frame was applied. Clinical readings including assessing the type of neovascularization and presence/absence of activity and fluid using the clinical devices were performed by two retina specialists (M.C. and G.S.) at the time of the patient visit.
Image Processing and Interpretation
Manual grading
Using the Orion OCT analysis software (Voxeleron LLC, Austin, TX), the volume of the eye was automatically segmented and converted to the Digital Imaging and Communications in Medicine format in support of the manual definition of the inner limiting membrane and Bruch membrane to define the vitreous, the extent of the retinal tissue (including fluid), and the location below the Bruch membrane comprising the choroid and scleral regions.
Using a custom labeling tool developed in MATLAB (Mathworks, Natick, MA), the IRF, SRF, and sub-RPE fluid areas were manually segmented on a per B-scan basis. Based on a signal-to-noise ratio quality metric, a minimum of two volumes per patient eye evaluated were used. Images were graded by J.O. with final review and approval from M.C. and G.S.
Automated Grading
Layer segmentation was performed using the existing Orion software, previously described,11 and the results were automatically exported as binary masks for comparisons using the Dice similarity coefficient (DSC), which measures the degree of agreement between the automated segmentation (A) and the ground truth (B), based on the area of overlap: DSC .
These automatically generated binary masks were additionally used as input to the deep learning approach previously validated for use with swept source OCT12 to segment the fluid regions. This U-Net like architecture13 - an autoencoder with skip connections - takes as input both the OCT B-scans and a retinal layer segmentation mask from Orion and has been successfully applied to similar image segmentation tasks.14
Learning is based on minimizing the model's loss, where the loss function weights categorical cross entropy with the DSC. A 10-fold cross-validation was used to evaluate all scans from all patient eyes, where, importantly, folds were stratified by the patient. The optimizer's initial learning rate (ILR) was set to 0.5, which changed every nth iteration such that at epoch i, the learning rate used was given as:
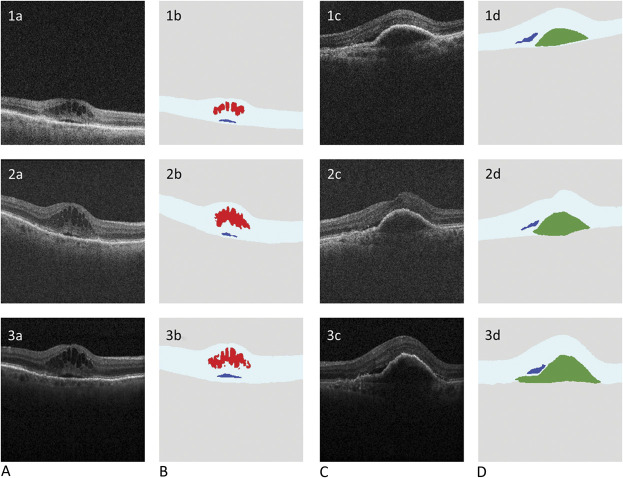
Where d, the drop fraction was set at 0.95, resulting in an exponential decay of the initial learning rate that stabilized to a minimum near 400 epochs. Training was set to stop if the loss score stopped decreasing for 40 epochs. The optimizer used was Adadelta.15 OCT images, manual fluid segmentations, and layer and fluid segmentations from the fully automated pipeline are shown in Figure 1. Figure 2 shows a qualitative comparison between the prototype home OCT device and both the clinical devices (Cirrus, Zeiss; Spectralis, Heidelberg).
Fig. 1.
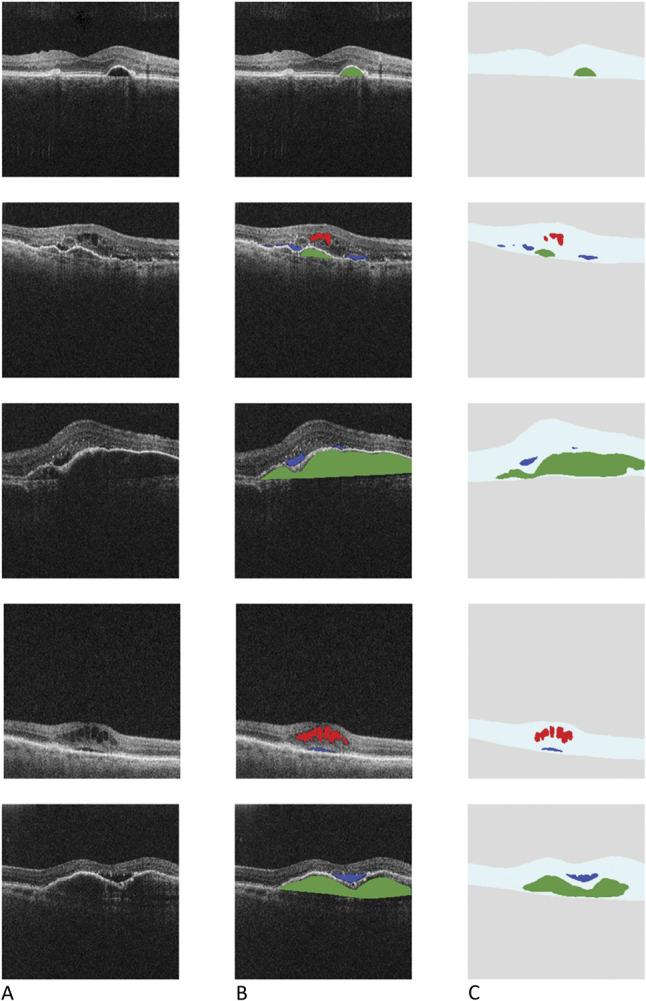
A. Scans from the home OCT device. B. Ground-truth labeling: scans from the home OCT device showing manual human grading/delineation of IRF (red), SRF (blue), and sub-RPE fluid (green). C. Scans from the home OCT device processed using the automated analysis software showing retinal layer and fluid segmentation—IRF (red), SRF (blue), and sub-RPE fluid (green).
Fig. 2.
Rows 1, 2, and 3 show example home OCT, cirrus, and Spectralis images, respectively, all at approximately the same location. Columns A and C are the original OCT image. Columns B and D show their respective, automatic segmentations (akin to Figure 1, Column C). No ground-truth labeling of the clinical devices was performed, and these results are just shown for qualitative comparison.
Statistical Analysis
Sensitivity and specificity along with precision and recall were based on finding the optimal point on the receiver-operating characteristic curve using the Youden16 index. The repeatability of the central subfield thickness (inner limiting membrane to the Bruch membrane) was performed using the percentage coefficient of variation and the intraclass correlation coefficient. An intraclass correlation coefficient of ≥0.75 is recommended as excellent reliability.17,18
The correlation of fluid reported by the automated algorithm for each patient eye relative to the ground truth was summarized using the coefficient of determination. If both the automated algorithm and manual grading report no fluid for a given fluid type, data for that fluid type were not included in the correlation analysis. However, when the manual grading reports nonzero fluid, regardless of whether the algorithm reports zero or nonzero fluid, the correlation between the two assessments was included. Bland–Altman plots for each fluid type were used to quantify the agreement with manual grading. To assess the accuracy of localization, the DSCs were plotted using a box and whisker method to gauge the areas delineated by the algorithm precisely.
Results
Demographics
A total of 70 patients with a mean (SD) age of 76.8 (9.3) years, including 31 (44%) female and 39 (56%) male patients, and a mean best-corrected visual acuity of 0.5 (Snellen equivalent of 20/63) in both eyes were enrolled and imaged. The demographics, clinical diagnosis, and best-corrected visual acuity of the study participants are summarized in Table 1. Among 70 patients, 136 eyes were successfully scanned using the home OCT device. Only four fellow eyes were not scanned owing to blindness and other factors.
Table 1.
Demographic Characteristics and Clinical Diagnosis of Patients With nAMD
| Baseline Characteristics | Total Patients N = 70 |
| Demographics | |
| Age (mean ± SD), years | 76.84 ± 9.31 |
| Female, n (%) | 31 (44%) |
| Male, n (%) | 39 (56%) |
| Clinical characteristics | |
| IRF presence | 52 eyes |
| SRF presence | 51 eyes |
| Sub-RPE fluid presence | 5 eyes |
| BCVA, mean (SD); Snellen equivalent | 0.58 (0.92); 20/76 |
BCVA, best-corrected visual acuity; IRF, intraretinal fluid; nAMD, neovascular age-related macular degeneration; SD, standard deviation; SRF, subretinal fluid; sub-RPE, subretinal pigment epithelium.
Layer Segmentation With Automated Versus Manual Grading
The mean DSC of 0.969 with an SD of 0.019 across all scans for automated layer segmentation represented excellent agreement to manual gradings. Moreover, without the use of ground truth data, repeatability, which involves measurement of the central subfield thickness (between the inner limiting membrane and the Bruch membrane averaged over a 1-mm diameter circle centered at the fovea), was tested using the percentage coefficient of variation and intraclass correlation coefficient for all patients with ≥2 volumes selected for analysis. An intraclass correlation coefficient of ≥0.75 signifies excellent reliability. Intraclass correlation coefficient data are summarized in Table 2.
Table 2.
Repeatability Test for Central Subfield Thickness Measurements: COV and ICC
| Types of Scans | No. of Scans | Average COV | ICC | LB | UB |
| Both | 197 | 8.0% | 0.82 | 0.76 | 0.86 |
| Line scans | 126 | 5.9% | 0.90 | 0.83 | 0.95 |
| Star scans | 116 | 7.8% | 0.82 | 0.57 | 0.93 |
COV, coefficient of variation; ICC, intraclass correlation coefficient; LB, lower boundary; UB, upper boundary
Fluid Detection With Automated Grading
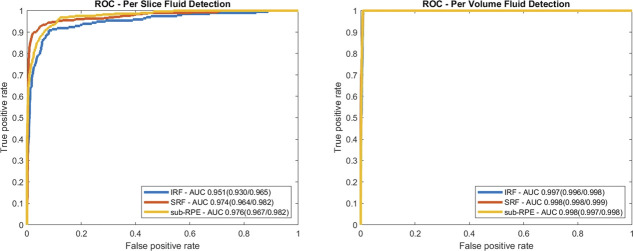
Using ground truth segmentations, where labeling of a given fluid in a B-scan indicates presence, the entire data set was evaluated for each fluid type classified on a per B-scan and per volume basis. Sensitivity and specificity, along with precision by fluid type on a per B-scan and per volume basis, are summarized in Table 3. Fluid detection on a per B-scan basis had area under receiver-operating characteristic curves of 0.951, 0.974, and 0.976 for IRF, SRF, and sub-RPE fluid, respectively, as shown in Figure 3A. The area under receiver-operating characteristic curves for IRF, SRF, and sub-RPE fluid were 0.997, 0.998, and 0.998, respectively, on a per volume basis as shown in Figure 3B.
Table 3.
Sensitivity, Specificity, and Precision (Positive Predictive Value) by Fluid Type on B-Scan and Volume Basis
| Fluid Type | Sens (%) | Per B-Scan | Per Volume | |||
| Spec (%) | Precision | Sens (%) | Spec (%) | Precision | ||
| IRF | 67.77 | 98.26 | 0.772 | 45.37 | 99.87 | 0.713 |
| SRF | 86.12 | 98.61 | 0.780 | 62.96 | 99.90 | 0.676 |
| Sub-RPE fluid | 70.00 | 99.06 | 0.806 | 57.41 | 99.80 | 0.750 |
IRF, intraretinal fluid; Sens, sensitivity; Spec, specificity; SRF, subretinal fluid; sub-RPE, subretinal pigment epithelium.
Fig. 3.
Receiver-operating characteristic curve depicting fluid detection based on the (A) per B-scan and on a (B) per volume basis for each fluid type. Area under ROC curves are given in the legend, with 95% confidence intervals shown in parentheses. AUC, area under the curve; IRF, intraretinal fluid; ROC, receiver-operating characteristic; SRF, subretinal fluid; sub-RPE, subretinal pigment epithelium.
Fluid Quantification With Automated Versus Manual Grading
Correlation of fluid reported by the automated analysis software for each patient eye relative to the ground truth for nonzero fluid areas was performed to quantify the fluid by subtype. The coefficient of determination, as shown in Figure 4A, for IRF, SRF, and sub-RPE fluid were 0.81, 0.93, and 0.97, respectively, when the manual grading reports nonzero fluid areas for each fluid type. The Bland–Altman plots for each fluid type were performed to quantify the agreement. The Bland–Altman plots for each fluid type (shown in Figure 4B) show area measures in square millimeters. In these Bland–Altman plots, IRF showed the narrowest limits of agreement at 0.45 mm2; followed by SRF was 0.50 mm2; and sub-RPE fluid was 1.0 mm2.
Fig. 4.
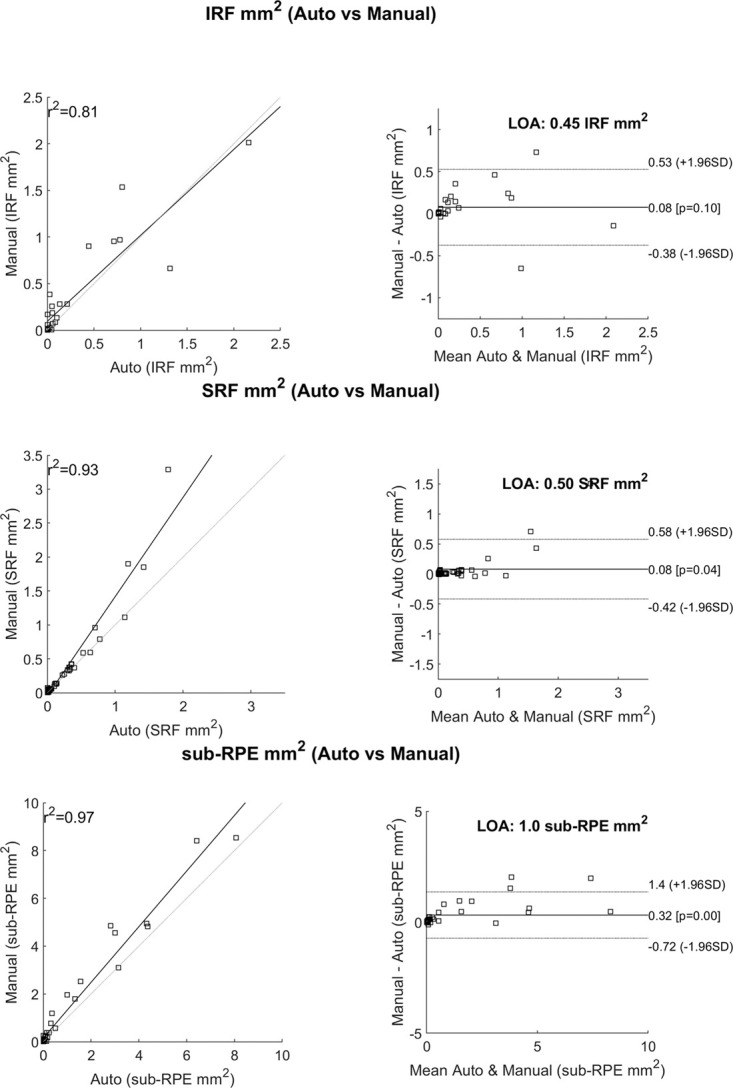
A. Correlations between the automated analysis software and the manual grading. This only reports cases that were nonzero according to the manual grading. B. Bland–Altman plots showing the line of agreement for each fluid type. IRF, intraretinal fluid; R2, coefficient of determination; SRF, subretinal fluid; sub-RPE, subretinal pigment epithelium.
In Figure 5A, coefficient of determination for IRF, SRF, and sub-RPE fluid were 0.75, 0.92, and 0.96, respectively, when the manual grading reports the fluid amount above the median value for each fluid type from patients with nonzero fluid areas. In Figure 5B, the limits of agreement for IRF, SRF and sub-RPE were 0.63 mm2, 0.69 mm2, and 1.2 mm2, respectively. No systematic discrepancies, such as larger error with increased volume, were observed. The distribution of fluid by type is shown in Figure 6.
Fig. 5.
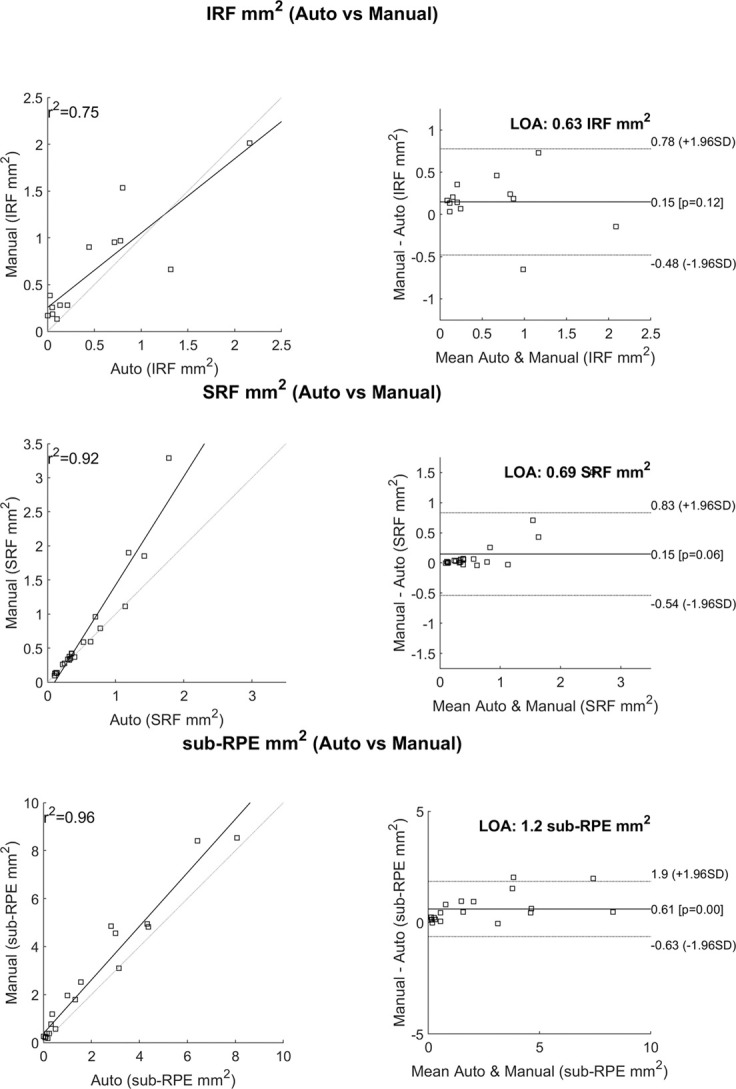
A. Correlations between the automated analysis software and manual grading. This only reports cases that had areas above the median values of the manually graded fluid areas. B. Bland–Altman plots showing the line of agreement for each fluid type. IRF, intraretinal fluid; R2, coefficient of determination; SRF, subretinal fluid; sub-RPE, subretinal pigment epithelium.
Fig. 6.
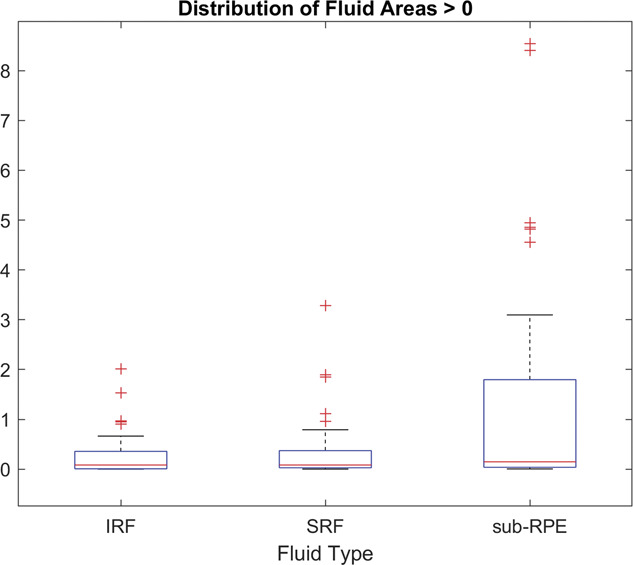
Distribution of manually graded fluid areas for each fluid type. The 50th percentile (medial) is shown as a red horizontal line for each. These median values were used as the threshold to study the correlation to automated gradings shown in Figure 5. IRF, intraretinal fluid; SRF, subretinal fluid; sub-RPE, subretinal pigment epithelium.
There were two patient eye exclusions from this analysis: one due to severe epiretinal membrane and the other based on at least one B-scan being outside of the FOV during acquisition.
The distribution of DSC scores for each fluid type is shown in Figure 7 and includes all labeled B-scans where the fluid area was >0.01 mm2. The mean, median, and SD for the DSC scores for each fluid were as follows: 0.654, 0.725, and 0.215 for IRF; 0.750, 0.811, and 0.176 for SRF; and 0.744, 0.809, and 0.211 for sub-RPE fluid, respectively (Table 4).
Fig. 7.
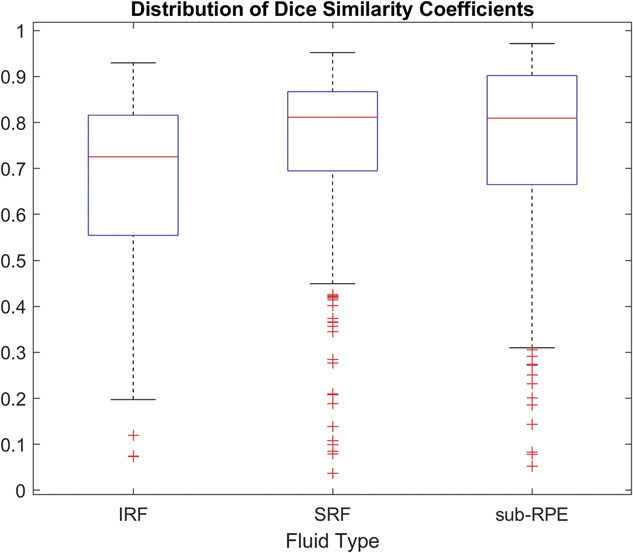
Distribution of DSCs for each fluid type with manual grading where fluid areas were >0.01 mm2. IRF, intraretinal fluid; SRF, subretinal fluid; sub-RPE, subretinal pigment epithelium.
Table 4.
Mean (SD) Dice Coefficient Scores for IRF, SRF, and Sub-RPE Fluid
| Mean | SD | |
| IRF | 0.65 | 0.21 |
| SRF | 0.75 | 0.18 |
| Sub-RPE fluid | 0.74 | 0.21 |
Discussion
This study reports on the detection and quantification of retinal fluid using a prototype home OCT device coupled with an automated analysis software versus manual human grading. The analysis software achieved a high degree of accuracy for retinal layer segmentation, retinal fluid detection, and retinal fluid quantification across all retinal fluid types in comparison with manually generated measurements.
Although efforts to bring OCT technology into the home for the purpose of self-monitoring of retinal disease have been ongoing for some time, limited data are available on the validation of their use in the home versus standard-of-care setting, and, more importantly, on their ability to improve visual outcomes. To date, the most notable example is the Notal Vision Home OCT.19,20
Chakravarthy et al21 reported on the accuracy of the Notal Analyzer software (NOA) (Notal Vision; Tel Aviv-Yafo, Israel), the image interpretation software, to detect disease activity (presence of retinal fluid) in spectral domain OCT volume scans of patients with nAMD from a clinical image repository. They reported an extremely high concordance between the NOA assessments and assessments by three independent retinal specialists in relation to the detection of lesion activity in nAMD (retinal specialist grading vs. NOA: accuracy, 91% [95% confidence interval, CI, ±7%]; sensitivity, 92% [95% CI, ±6%]; specificity, 91% [95% CI, ±6%]). The study used the Cirrus OCT device.
More recently, the real-world, home-based performance of the Notal Vision Home OCT device with the NOA has been assessed in four patients as part of a prospective and longitudinal pilot study.22 For retinal fluid detection, the agreement between NOA and human grading was 94.7%; and 87.9% of the 240 self-imaging attempts were successful, i.e., a scan of sufficient quality for analysis.
Although this study is preliminary in nature and not without limitations, an excellent correlation between manual retinal fluid assessments and those performed using the automated analysis software are reported. A key strength of this study is that it involved a large study population. All images were captured by the patients themselves after initial training on the use of the prototype home OCT device. Given the high level of repeatability that we report, it is reasonable to conclude that the image quality acquired using the home OCT device was more than adequate to allow automated segmentation by the analysis software.
Human factors data associated with the device, i.e., usability, have not been reported, although it was generated. After watching a video and brief training, patients were able to self-scan in 100% of the study eyes and 94% of the fellow eyes. Four fellow eyes could not be self-scanned owing to significant blindness in those eyes. A full assessment of the human factors will be reported in a later publication.
In addition, although patients did successfully capture the OCT images themselves unassisted using the home OCT device, this was not performed in a home environment but in the clinic. Specifically, patients first watched a training video on how to use the device. They were then given hands-on instructions after which they captured a test image. After this, they captured a second image, unassisted, and this was the image used for analysis.
Although the chosen scan patterns were sufficient, this study has allowed the determination of more optimal scan patterns, which should allow improvements to the overall performance of the analysis software in the future. Twenty volumes are acquired during one capture at the same location. The initial justification for this assumed a low yield, but this was not the case and resulted in redundant data, much of which was not analyzed. Furthermore, the resulting interslice spacing in this prototype was too high (0.75 mm for line scans) for the scans to be considered truly volumetric, resulting in the reporting of fluid areas per B-scan instead of an overall fluid volume. A future implementation using a denser, more isotropic scan pattern should be better and thereby facilitate true volumetric analysis.
In conclusion, this prospective study of a heterogenous nAMD patient population who performed self-imaging using a prototype home OCT device (in a clinical setting) with minimal training showed excellent agreement between the automated analysis of the home OCT images versus manual grading for retinal fluid detection and quantification. This is an important foundation for future studies of the prototype home OCT device and highlights its potential to detect the need for anti-VEGF retreatment outside the clinic. In doing so, it has the potential to lessen the disease-monitoring burden for the patients, their caregiver(s), and the clinic, and to improve visual outcomes for patients with nAMD.
Acknowledgments
The authors thank Mark Kirby (Novartis Ireland Limited, Dublin, Ireland) and Saraladevi Selvam (Novartis Healthcare Pvt. Ltd., Hyderabad, India) for their medical writing and editorial assistance toward the development of this article.
Footnotes
No funding was received from the National Institutes of Health (NIH), Wellcome Trust, Howard Hughes Medical Institute (HHMI).
G. Staurenghi: Heidelberg Engineering, Centervue, Carl Zeiss Meditec, Allergan, Apellis, Bayer, Boehringer, Genentech, Graybug, Novartis, Roche for consultation Heidelberg Engineering, Optos, Optovue, Quantel Medical, Centervue, Carl Zeiss Meditec, Alcon, Allergan, Apellis, Bayer, Boehringer, Genentech, Novartis, Roche for clinical trials. Ocular Instruments for patent. S. Verdooner: Employees (OCTHealth LLC), Patent (OCTHealth LLC). J. D. Oakley: Employees (Voxeleron LLC), Patent (Voxeleron LLC). D. Russakoff: Employees (Voxeleron LLC), Patent (Voxeleron LLC). J. Seaman: Employee Novartis. J. Sahni: Employee Novartis. C. D. Bianchi: None. M. Cozzi: Novartis, Heidelberg Engineering, Bayer AG, Zeiss Meditec AG, Nidek Co. J. Rogers: Employees (OCTHealth LLC), Patent (OCTHealth LLC). A. J. Brucker: None.
Contributor Information
Steven Verdooner, Email: sverdooner@neurovision.com.
Daniel B. Russakoff, Email: daniel@voxeleron.com.
Alexander J. Brucker, Email: brucker@retinajournal.com.
John Seaman, Email: john.seaman@novartis.com.
Jayashree Sahni, Email: jayashreesahni@yahoo.co.uk.
Carlo D. BIANCHI, Email: carlodomenico.bianchi@gmail.com.
Mariano Cozzi, Email: mariano.cozzi88@gmail.com.
John Rogers, Email: john@spectraml.com.
Giovanni Staurenghi, Email: stefo.staurenghi@gmail.com.
References
- 1.Wong WL, Su X, Li X, et al. Global prevalence of age-related macular degeneration and disease burden projection for 2020 and 2040: a systematic review and meta-analysis. Lancet Glob Health 2014;2:e106–e116. [DOI] [PubMed] [Google Scholar]
- 2.Ricci F, Bandello F, Navarra P, et al. Neovascular age-related macular degeneration: therapeutic management and new-upcoming approaches. Int J Mol Sci 2020;21:8242. [DOI] [PMC free article] [PubMed] [Google Scholar]
- 3.Schmidt-Erfurth U, Chong V, Loewenstein A, et al. Guidelines for the management of neovascular age-related macular degeneration by the European Society of Retina Specialists (EURETINA). Br J Ophthalmol 2014;98:1144–1167. [DOI] [PMC free article] [PubMed] [Google Scholar]
- 4.Schmidt-Erfurth U, Waldstein SM. A paradigm shift in imaging biomarkers in neovascular age-related macular degeneration. Prog Retin Eye Res 2016;50:1–24. [DOI] [PubMed] [Google Scholar]
- 5.Kodjikian L, Parravano M, Clemens A, et al. Fluid as a critical biomarker in neovascular age-related macular degeneration management: literature review and consensus recommendations. Eye (Lond) 2021;35:2119–2135. [DOI] [PMC free article] [PubMed] [Google Scholar]
- 6.Age-Related Macular Degeneration PPP 2019. Available at: https://www.aao.org/preferred-practice-pattern/age-related-macular-degeneration-ppp. [Google Scholar]
- 7.Prenner JL, Halperin LS, Rycroft C, et al. Disease burden in the treatment of age-related macular degeneration: findings from a time-and-motion study. Am J Ophthalmol 2015;160:725–731.e1. [DOI] [PubMed] [Google Scholar]
- 8.Schlegl T, Waldstein SM, Bogunovic H, et al. Fully automated detection and quantification of macular fluid in OCT using deep learning. Ophthalmology 2018;125:549–558. [DOI] [PubMed] [Google Scholar]
- 9.Ting DSW, Pasquale LR, Peng L, et al. Artificial intelligence and deep learning in ophthalmology. Br J Ophthalmol 2019;103:167–175. [DOI] [PMC free article] [PubMed] [Google Scholar]
- 10.Wilson M, Chopra R, Wilson MZ, et al. Validation and clinical applicability of whole-volume automated segmentation of optical coherence tomography in retinal disease using deep learning. JAMA Ophthalmol 2021;139:964–973. [DOI] [PMC free article] [PubMed] [Google Scholar]
- 11.Alex V, Motevasseli T, Freeman WR, et al. Assessing the validity of a cross-platform retinal image segmentation tool in normal and diseased retina. Sci Rep 2021;11:21784. Available at: 10.1038/s41598-021-01105-9. [DOI] [PMC free article] [PubMed] [Google Scholar]
- 12.Oakley JD, Sodhi SK, Russakoff DB, Choudhry N. Automated deep learning-based multi-class fluid segmentation in swept-source optical coherence tomography images. bioRxiv 2020. Available at: https://www.biorxiv.org/content/10.1101/2020.09.01.278259v1. [Google Scholar]
- 13.Ronneberger O, Fischer P, Brox T. U-Net: Convolutional Networks for Biomedical Image Segmentation. Springer, Cham: Springer International Publishing; 2015:234–241. [Google Scholar]
- 14.Sodhi SK, Pereira A, Oakley JD, et al. Utilization of deep learning to quantify fluid volume of neovascular age-related macular degeneration patients based on swept-source OCT imaging: the ONTARIO study. PLoS One 2022;17:e0262111. doi: 10.1371/journal.pone.0262111. [DOI] [PMC free article] [PubMed] [Google Scholar]
- 15.Method AAALR. ADADELTA: An Adaptive Learning Rate Method. https://arxiv.org/abs/1212.5701 [Google Scholar]
- 16.Youden WJ. Index for rating diagnostic tests. Cancer 1950;3:32–35. [DOI] [PubMed] [Google Scholar]
- 17.Cicchetti DV. Guidelines, criteria, and rules of thumb for evaluating normed and standardized assessment instruments in psychology. Psychol Assess 1994;6:284–290. [Google Scholar]
- 18.Koo TK, Li MY. A guideline of selecting and reporting intraclass correlation coefficients for reliability research. J Chiropr Med 2016;15:155–163. [DOI] [PMC free article] [PubMed] [Google Scholar]
- 19.Keenan TDL, Chakravarthy U, Loewenstein A, et al. Automated quantitative assessment of retinal fluid volumes as important biomarkers in neovascular age-related macular degeneration. Am J Ophthalmol 2021;224:267–281. [DOI] [PMC free article] [PubMed] [Google Scholar]
- 20.Keenan TDL, Clemons TE, Domalpally A, et al. Retinal specialist versus artificial intelligence detection of retinal fluid from OCT: age-related eye disease study 2: 10-year follow-on study. Ophthalmology 2021;128:100–109. [DOI] [PMC free article] [PubMed] [Google Scholar]
- 21.Chakravarthy U, Goldenberg D, Young G, et al. Automated identification of lesion activity in neovascular age-related macular degeneration. Ophthalmology 2016;123:1731–1736. [DOI] [PubMed] [Google Scholar]
- 22.Keenan TDL, Goldstein M, Goldenberg D, et al. Prospective, longitudinal pilot study: daily self-imaging with patient-operated home OCT in neovascular age-related macular degeneration. Ophthalmol Sci 2021;1:100034. [DOI] [PMC free article] [PubMed] [Google Scholar]


