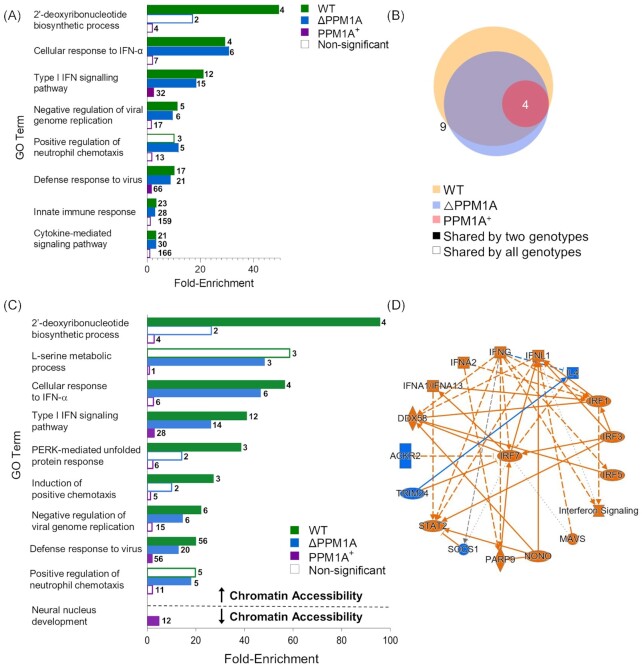
Figure 2.
Mtb infection induces changes to chromatin accessibility that are enriched in type I IFN regulatory pathways. (A) GO term enrichment analysis was conducted using GREAT with significant differential peaks in WT, △PPM1A, and PPM1A+ macrophages following Mtb infection. GO terms with FDR < 0.05 were considered significant. GO terms were ranked by enrichment and the top 5 nonredundant terms from each genotype were included. Numbers in bold beside each bar indicate the number of genes that contribute to the enrichment of each pathway. Many of the top 5 nonredundant terms overlapped between genotypes. (B) Venn diagram displaying common significant GO terms between WT, △PPM1A, and PPM1A+ macrophages after Mtb infection. (C) Separate GO enrichment analysis was conducted for chromatin regions where accessibility increased or decreased. Significant DAR in each genotype were split into two groups based on whether chromatin accessibility increased (log2FC > 1) or decreased (log2FC < 1). GO terms were ranked and plotted as in (A). The top 5 nonredundant pathways, where possible, are shown for each genotype. (D) Ingenuity pathway analysis was conducted on all significant DAR for Mtb-infected WT, △PPM1A, and PPM1A+ macrophages. The radial summary graph of DAR in WT macrophages is shown. The nodes and edges are colour coded by predicted activation or inhibition: orange represents ‘predicted activation’ (node) or ‘leads to predicted activation’ (edge), and blue represents ‘predicted inhibition’ (node) or ‘leads to inhibition’ (edge). Arrows represent activation, causation, or modification, and perpendicular lines represent inhibition. Solid lines represent direct interactions, dashed lines represent indirect interactions, and dotted lines represent inferred correlation from machine-based learning. The shapes of the nodes are represented as follows: ovals represent transcription regulators, squares represent cytokines, rectangles represent g-protein-coupled receptors, diamonds represent enzymes, hexagons represent canonical pathways, spheres represent ‘other’. Additional radial summary graphs for △PPM1A and PPM1A+ macrophages are shown in Fig. S5.

