

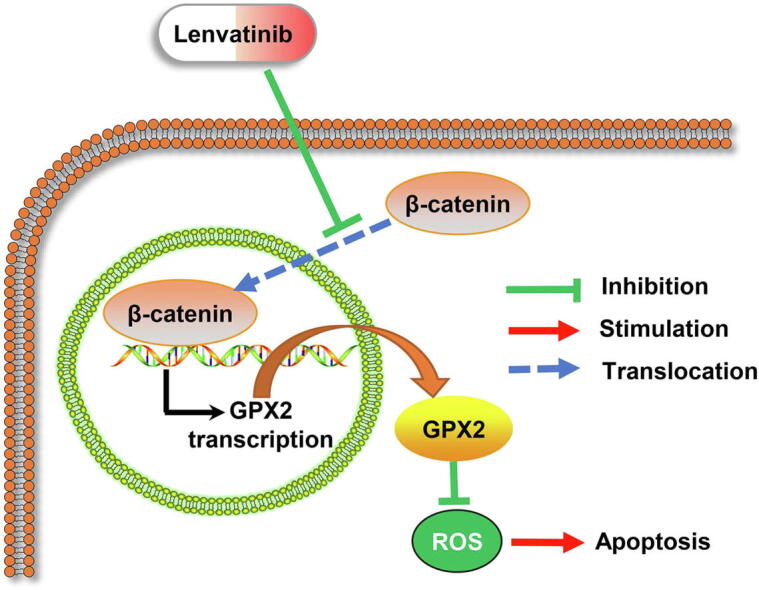
Graphical abstract
Keywords: Lenvatinib, GPX2, Hepatocellular carcinoma, Apoptosis, ROS
Highlights
-
•
Lenvatinib inhibits GPX2 expression and induces ROS related apoptosis in HCC.
-
•
High expression of GPX2 is an independent risk factor for overall survival in HCC.
-
•
Lenvatinib induces cell apoptosis through inhibiting β-catenin/GPX2 axis in HCC.
-
•
GPX2 levels could predict lenvatinib sensibility for HCC patients.
Abstract
Introduction
Lenvatinib has recently become available as the first-line therapy for advanced hepatocellular carcinoma (HCC), but its molecular mechanism in HCC remains largely unknown.
Objectives
The current study aims to identify the molecular mechanisms of lenvatinib in HCC.
Methods
Gene expression microarrays, flow cytometry, western blot, qRT-PCR, immunohistochemistry and immunofluorescence were used to study the response of HCC cells to lenvatinib. Xenograft tumor of Huh7 cells was also established to detect the effect of lenvatinib in vivo.
Results
Herein, we found that lenvatinib could induce apoptosis via increasing reactive oxygen species (ROS) levels in HCC cells. Then, microarray analysis and qRT-PCR results confirmed that GPX2 was a vital target for lenvatinib against HCC. Loss and gain function of experiment showed that regulating GPX2 levels markedly affected the lenvatinib-induced ROS levels and apoptosis in HCC cells. In addition, analyses of The Cancer Genome Atlas database and the qRT-PCR results in our cohort both showed that GPX2 markedly overexpressed in tumor tissues and correlated with poor overall survival in HCC. Mechanistically, our findings further demonstrated that GPX2 was a downstream gene regulated by β-catenin, while lenvatinib could prevent nuclear translocation of β-catenin and further inhibit GPX2 expression in HCC cells. More importantly, the correlation of GPX2 expression with lenvatinib response was further analyzed in 22 HCC patients who received lenvatinib therapy, and the results showed that the objective response rate (ORR) in patients with low GPX2 expression was 44.4% (4/9), while the ORR in patients with high GPX2 levels was only 7.7% (1/13).
Conclusion
Our findings indicated that GPX2 plays an important role in lenvatinib-induced HCC cell apoptosis, which might serve as a biomarker for instruction of lenvatinib therapy in HCC patients.
Introduction
Since most hepatocellular carcinoma (HCC) patients are diagnosed at late stage and loss the chance of radical resection, the application of targeted drugs in recent years has brought new hope for improving the prognosis of these patients. Sorafenib was the first approved targeted drug for advanced HCC in 2007 [1], [2]. Over the past decade, many targeted drugs have been tested in HCC [3], [4], [5], but only lenvatinib (approved as first line) and regorafenib (approved as second line) got positive results in the global phase 3 trials. Lenvatinib, whose targets included FGFR1-4, VEGFR1-3, PDGFRα, and KIT [6], [7], [8], was first approved for treatment of advanced thyroid cancer. A recent phase 3 clinical study revealed that lenvatinib showed non-inferior to sorafenib in overall survival in advanced HCC, and it has recently become available as a first-line therapy for HCC in many countries [9]. However, the mechanisms of lenvatinib in preclinical studies are limited. It is worthwhile to clarify its molecular mechanisms and identify the predictive biomarkers of lenvatinib therapy against HCC.
Reactive oxygen species (ROS) such as hydrogen peroxide are generated from reduction-oxidation reactions. Low levels of ROS in cells is essential for the regulation of cell survival, while excessive levels of ROS can induce cellular damage and promote cell death through oxidative stress [10]. Therefore, regulation of ROS in cancer cells may represent a viable strategy for cancer therapy [11]. Studies showed that increased ROS levels could enhance radiotherapy sensitivity in breast cancer and lung cancer [12], [13]. Targeted drugs (like erlotinib or sorafenib) were also proved to increase ROS levels and induce cell apoptosis in lung cancer and HCC [14], [15], [16]. A recent study revealed that lenvatinib dose-dependently increased apoptosis in anaplastic thyroid cancer (ATC) cells via increasing the caspase-3 activity [17]. However, the precise molecular mechanisms involved in lenvatinib induced HCC cell apoptosis need to be further elucidated.
The anti-oxidant enzyme glutathione peroxidase (GPX) family protects cell survival through reducing the intracellular ROS levels [18]. GPXs have been widely investigated to be involved in the progression of various cancers. Recently, researchers proved that GPX4 is an essential regulator of ferroptosis which could induce cancer cell death [19], and others found that targeting the GPX1 by Vitamin D could suppress tumor progression in salivary adenoid cystic carcinoma [20]. Previous studies also suggested that overexpression of GPX2 was detected in colorectal cancer and HCC [21], [22], [23]. In addition, Xu et al. found that lipopolysaccharide (LPS) could inhibit GPX2 and GPX4 expression and further led to increased ROS production in gastric cancer. Another study demonstrated that lenvatinib could upregulate TLR4 expression, the receptor of LPS, and then induced apoptosis in HepG2 cell [24], [25]. Therefore, targeting GPXs and reducing ROS levels might be possible mechanisms of lenvatinib in HCC.
In the present study, we detected that lenvatinib induced cell apoptosis and increased intracellular ROS levels in four HCC cell lines. Then, we demonstrated that GPX2 was an important regulator of ROS and could be markedly inhibited by lenvatinib in HCC cells. Furthermore, we found that GPX2 was significantly overexpressed in HCC tumor tissues, and high expression of GPX2 in HCC cells were more resistance to lenvatinib. Moreover, our results showed that inhibiting GPX2 could increase ROS levels and enhance the anti-tumor effect of lenvatinib. Therefore, our results indicated that GPX2 plays a crucial role in lenvatinib against HCC.
Methods
Cell culture and reagents
Huh7 and HepG2 cells were purchased from the Cell Bank of the Chinese Academy of Sciences (Shanghai, China). PLC/PRF5 and Hep3B cells were obtained from ATCC (Manassas, VA, USA). HCC cells were cultured in DMEM (Gibco BRL, USA) containing 10% fetal bovine serum (Biological Industries, Israel) in a humidified incubator at 37 ℃. Lenvatinib were purchased from APExBIO chemicals.
Microarray experiments
Huh7 cells were treated with lenvatinib for 48 h, while the control group was treated with the solvent of lenvatinib. The microarray analysis was performed by KangChen Bio-Tech, and the samples were hybridized on the GeneChip Array (8 × 60 K, ArrayStar, USA). The top ten upregulated and downregulated mRNA altered significantly in both samples were listed in Table S1.
Patients and tissue samples
A total of 95 paired HCC tumor tissues and corresponding adjacent normal tissues were collected at Sun Yat-Sen Memorial Hospital between 2014 and 2017. The clinic pathological characteristics of the patients included in this study were shown in Table S2. Another cohort of 22 HCC patients who underwent surgical resection and tumor recurred after operation were recommended to receive lenvatinib therapy. Among these 22 patients, 8 patients received lenvatinib alone, 6 patients received lenvatinib plus anti-PD-1 therapy, 4 patients received lenvatinib combined with locoregional treatment of transarterial chemoembolization (TACE), 2 patients received lenvatinib plus anti-PD-1 and TACE, 1 patient received lenvatinib combined with TACE and radiofrequency ablation (RFA), 1 patient received lenvatinib combined with radiotherapy. The total therapeutic regimens were shown in Table S3. The response assessment was evaluated using contrast-enhanced CT or MRI every 8–12 weeks after the initiation with lenvatinib according to the modified Response Evaluation Criteria in Solid Tumor (mRECIST).
Flow cytometry to detect intracellular ROS and cell apoptosis
Reactive oxygen species (ROS) assay kit (Beyotime, China) was used to detect the intracellular ROS levels. Briefly, cells were cultured in 12-well plates treated with 20 or 40 μmol/L of lenvatinib for 48 h. Then, the cells were incubated with 2,7-Dichlorodi-hydrofluorescein diacetate (DCFH-DA) for 20 min. The fluorescence intensity of ROS was analyzed by flow cytometry. Cell apoptosis was detected by the flow cytometry using the Annexin V-FITC and propidium iodide (PI).
HCC xenograft models
For the in vivo experiments, some studies have shown the anti-tumor effect of lenvatinib against HCC. A previous study demonstrated that lenvatinib at 3, 10, 30 mg/kg inhibited the in vivo growth of HCC xenograft tumors [26]. Recently, another study found that the combination of lenvatinib (10 mg/kg) and anti-PD-1 antibody showed better tumor growth inhibition and survival in the mouse model [27]. Referring to these literatures, we finally chose the dose of 10 and 30 mg/kg/d in our experiment. Huh7 cells (5 × 10⁶) in culture medium were injected into the flank of the BALB/c nude mice. When the diameter of tumors grew to 5 mm, mice were randomly grouped into three groups (6 mice/group) and administered as the following treatment: control group, 10 mg/kg/d and 30 mg/kg/d of lenvatinib groups. After two weeks’ treatment, the mice were sacrificed and the xenograft tumors were removed and weighed.
Immunohistochemistry (IHC)
The immunohistochemistry analyses were performed as previously described. Briefly, after dewaxing and rehydration, the sections were retrieved by boiling in EDTA for 15 min, and then the sections were neutralized with H2O2 for 10 min. After that, the sections were blocked with goat serum (CWBIO) for 30 min, and further incubated with primary antibody overnight. The next day, HRP-conjugated Goat anti- mouse/rabbit IgG (Dako Corporation, USA) were then added to the sections. Finally, the sections were stained with Diaminobenzidine tetrahydrochloride and hematoxylin. The IHC results were assessed by two researchers according to the score criteria described previously [28].
Ethics statement
All sample tissues collection was approved by the ethics committee of the Sun Yat-Sen Memorial Hospital of Sun Yat-Sen University. Animal experiments were approved by the Bioethics Committee of Sun Yat-Sen University and were performed according to the National Institutes of Health guidelines (No. SYSU-IACUC-2020-B1016).
Statistical analysis
Data analyses were conducted by SPSS software (version 20.0). Student’s t-test or two-way analysis of variance (ANOVA) with Bonferroni correction was applied to compare the statistical difference between different groups. Simple and multiple Cox proportional hazard regression analyses were used to analyze the risk factors for overall survival (OS) and recurrence-free survival (RFS) in HCC patients. Kaplan–Meier method and log‐rank test was used to evaluate survival curves with different levels of GPX2 in HCC patients. The Chi-square test was used to analyse the correlation between the expression of GPX2 and lenvatinib response. *P < 0.05 was considered statistically significant.
Results
Lenvatinib induced ROS related apoptosis and inhibited tumor growth in HCC
To evaluate the cytotoxicity of lenvatinib against HCC, we treated four HCC cells (HepG2, PLC/PRF5, Huh7 and Hep3B) with various concentrations of lenvatinib for 48 h. Cell viability dose-dependently decreased in all the four HCC cells, in which Huh7 and Hep3B cells were more sensitive to lenvatinib than HepG2 and PLC/PRF5 cells (Fig. S1A–D). Then, we investigated the level of apoptosis in these four HCC cells treated with lenvatinib by flow cytometry. The results showed that 20 and 40 μmol/L of lenvatinib both significantly induced apoptosis in Huh7 and Hep3B cells (Fig. 1B and Fig. S1F). However, the results in HepG2 and PLC/PRF5 cells showed that 20 μmol/L of lenvatinib had a limited role on inducing apoptosis (Fig. 1A and Fig. S1E). Similar results were also found in the intracellular ROS levels that lenvatinib markedly increased the ROS levels in Huh7 and Hep3B cells, but not HepG2 and PLC/PRF5 cells (Fig. 1C–D and Fig. S1G–H). We also examined the anti-tumor activity of lenvatinib against HCC in vivo, and the results in Fig. 1E and 1F showed that lenvatinib at concentrations of 10 and 30 mg/kg/d both displayed effective anti-tumor effect on Huh7 xenografts. The tumor weight in 10 and 30 mg/kg lenvatinib group were 64.5% and 29.6% to that of control group, respectively (Fig. 1G).
Fig. 1.

Lenvatinib induced ROS related apoptosis and inhibited tumor growth in HCC. (A-B) HepG2 and Huh7 cells were treated with 20 or 40 μmol/L of lenvatinib for 48 h, and then incubated with Annexin Ⅴ-FITC and Propidium Iodide, cell apoptosis was measured by flow cytometry. (C–D) Flow cytometry to detect the fluorescence intensity of the DCF which reflected the intracellular ROS levels after treatment of 20 or 40 μmol/L of lenvatinib for 48 h in HepG2 and Huh7 cells. (E) The mice were treated with intra-gastric administration of vehicle, lenvatinib (10 mg/kg/d) or lenvatinib (30 mg/kg/d) for two weeks. The photograph showed the dissected tumors from each group. (F) The tumor growth curves were created for each group by measuring tumor volumes every three days. (G) The weight of dissected tumors showed that lenvatinib could marked inhibited the growth of Huh7 cells in vivo. Data represents the mean ± SD of three independent experiments, statistical evaluation of the data was analyzed by two-way analysis of variance (ANOVA) with Bonferroni correction. *P < 0.05; P > 0.05, ns: no significance.
Lenvatinib inhibited the expression of GPX2 in HCC cells
To explore the targets of lenvatinib in HCC, we examined the transcriptome of Huh7 cells exposed to lenvatinib (40 μmol/L, 48 h) with microarrays. We identified 634 differentially expressed mRNA, including 343 upregulated and 291 downregulated genes. The hierarchical clustering heatmap showed the top 20 mostly increased and decreased mRNAs in Fig. 2A, among which the anti-oxidant enzyme glutathione peroxidase 2 (GPX2) was one of the most downregulated genes with over 22-fold change. Then, we detected the RNA level of GPX2 in the four HCC cells. The results revealed that HepG2 and PLC/PRF-5 exhibited much higher levels of GPX2 than that of Hep3B and Huh7 cells (Fig. 2B). Additionally, qRT-PCR and western blot further confirmed that lenvatinib could dose-dependently downregulate GPX2 expression in HCC cells (Fig. 2C–D). Next, the IHC results proved that lenvatinib markedly inhibited GPX2 expression in vivo. In addition, the percentage of Ki-67-positive cells were also decreased a lot in the groups treated with lenvatinib (Fig. 2E–F).
Fig. 2.

Lenvatinib markedly inhibited GPX2 expression in HCC. (A) Unsupervised hierarchical clustering of the top ten upregulated and downregulated mRNAs expressed in the lenvatinib treated group compared with the control group. (B) qRT-PCR to detect GPX2 expression in four HCC cells. (C) qRT-PCR results showed that lenvatinib markedly suppressed GPX2 expression in Huh7 and the other three HCC cells. (D) Western blot assay demonstrated that lenvatinib could inhibit the GPX2 expression in all the four HCC cells. (E) Represent images of the resected tumors stained with GPX2 and Ki-67 in each group from the xenograft tumors. (F) The results showed that lenvatinib markedly suppressed GPX2 expression and reduced the positive stained of Ki-67 protein. Data represents the mean ± SD of the IHC score of six independent animals for each group. (Scale bars in 2E: 200 μm; inserts: 50 μm). Statistical evaluation of the data was analyzed by two-way analysis of variance (ANOVA) with Bonferroni correction (C and F). *P < 0.05; P > 0.05, ns: no significance.
The expression of GPX2 was upregulated in HCC tissues and correlated with poor overall survival
We analyzed the TCGA database and revealed that GPX2 was markedly over-expressed in various types of digestive system tumors, including HCC (Fig. S2A–B). Then, we further validated the expression of GPX2 in our cohort. The results in Fig. 3A demonstrated that GPX2 was significantly upregulated in HCC tumor tissues. Besides, we also conducted Kaplan-Meier analysis for overall survival (OS) and recurrence free survival (RFS), and the results revealed that patients with higher levels of GPX2 correlated with poorer OS and RFS (Fig. 3B–C). Moreover, Cox regression analysis demonstrated that GPX2 expression, BCLC stage and microvascular invasion were independent risk factors of OS in HCC (Table 1), while only BCLC stage was independent risk factors of RFS in HCC (Table 2).
Fig. 3.

GPX2 was highly expressed in HCC tissues and conferred to lenvatinib resistance in HCC. (A) The mRNA level of GPX2 in 95 paired HCC tissues and corresponding adjacent normal tissues by qRT-PCR. (B) Kaplan-Meier analysis showed that higher expression of GPX2 was correlated with poorer overall survival. (C) Kaplan-Meier analysis showed that higher expression of GPX2 was significantly correlated with earlier recurrence in our cohort. (D–E) qRT-PCR and western blot results showed that GPX2 was markedly inhibited by GPX2 specific siRNA in HepG2 cells, and GPX2 was significantly upregulated by lentivirus vector carrying the GPX2 gene in Huh7 cells. (F) Flow cytometry to detect the DCF showed that si-GPX2 markedly enhanced the ROS levels in HepG2 cells, while up-regulating of GPX2 could decrease the ROS levels in Huh7 cells. (G) HepG2 cells were transfected with si-GPX2 and then treated with 20 or 40 μmol/L of lenvatinib for 48 h. The results showed that HepG2 cells were more sensitive to lenvatinib after down-regulation of GPX2. (H) Similar experiment showed that Huh7 cells were more resistant to lenvatinib after up-regulation of GPX2. Data represents the mean ± SD of three independent experiments. Statistical evaluation of the data was assessed using Student’s t-test (A, D and F) and two-way analysis of variance (ANOVA) with Bonferroni correction (G and H). *P < 0.05; P > 0.05, ns: no significance.
Table 1.
Cox Proportional Hazard Regression Analysis of various prognostic characteristics for OS (overall survival) in patients with HCC.
|
Simple regression analysis (OS) |
Multiple regression analysis (OS) |
|||||
|---|---|---|---|---|---|---|
| β (SE) | HR (95% CI) | P value | β (SE) | HR (95% CI) | P value | |
| Age | 0.603 (0.332) | 1.827 (0.953–3.502) | 0.069 | |||
| Gender | −0.246 (0.480) | 0.782 (0.305–2.003) | 0.609 | |||
| AFP(μg/L) | 0.759 (0.328) | 2.137 (1.124–4.062) | 0.021 | 0.241 (0.347) | 1.272 (0.645–2.510) | 0.487 |
| Child-Pugh | 0.372 (0.604) | 1.450 (0.444–4.739) | 0.538 | |||
| HBV infection | −0.434 (0.368) | 0.648 (0.315–1.332) | 0.238 | |||
| BCLC stage | 1.306 (0.368) | 3.690 (1.795–7.585) | <0.001 | 1.130(0.505) | 3.096 (1.151–8.326) | 0.025 |
| TNM stage | 0.897 (0.249) | 2.453 (1.506–3.997) | <0.001 | 0.460 (0.404) | 1.585 (0.718–3.496) | 0.254 |
| Histological grade | 0.212 (0.227) | 1.236 (0.793–1.928) | 0.349 | |||
| Tumor size | 1.261 (0.445) | 3.527 (1.473–8.445) | 0.005 | −0.526 (0.676) | 0.591 (0.157–2.222) | 0.436 |
| GPX2 expression | 0.659 (0.324) | 1.933 (1.025–3.645) | 0.042 | 0.694 (0.342) | 2.002 (1.023–3.917) | 0.043 |
| Vascular invasion | 1.469 (0.528) | 4.346 (1.545–12.224) | 0.005 | 1.088 (0.543) | 2.968 (1.023–8.610) | 0.045 |
Abbreviation: β, regression coefficient; SE, standard error; HR, Hazard Ratio; CI, Confidence Interval.
Table 2.
Cox Proportional Hazard Regression Analysis of various prognostic characteristics for RFS (recurrence-free survival) in patients with HCC.
|
Simple regression analysis (RFS) |
Multiple regression analysis (RFS) |
|||||
|---|---|---|---|---|---|---|
| β (SE) | HR (95% CI) | P value | β (SE) | HR (95% CI) | P value | |
| Age | 0.121 (0.282) | 1.129 (0.649–1.961) | 0.668 | |||
| Gender | −0.303 (0.378) | 0.739 (0.352–1.550) | 0.423 | |||
| AFP(μg/L) | 0.463 (0.248) | 1.589 (0.977–2.583) | 0.062 | |||
| Child-Pugh | 0.614 (0.434) | 1.848 (0.789–4.327) | 0.157 | |||
| HBV infection | 0.308 (0.344) | 1.360 (0.692–2.671) | 0.372 | |||
| BCLC stage | 0.961 (0.226) | 2.613 (1.679–4.049) | <0.001 | 0.826 (0.304) | 2.284 (1.259–4.141) | 0.007 |
| TNM stage | 0.605 (0.171) | 1.831 (1.309–2.562) | <0.001 | 0.064 (0.279) | 1.066 (0.617–1.842) | 0.819 |
| Histological grade | 0.185 (0.178) | 1.203 (0.849–1.705) | 0.299 | |||
| Tumor size | 0.943 (0.304) | 2.567 (1.414–4.662) | 0.002 | 0.096 (0.442) | 1.101 (0.463–2.517) | 0.828 |
| GPX2 expression | 0.367 (0.247) | 1.444 (0.889–2.344) | 0.138 | |||
| Vascular invasion | 0.726 (0.311) | 2.067 (1.124–3.802) | 0.019 | 0.460 (0.314) | 1.584 (0.855–2.933) | 0.143 |
Abbreviation: β, regression coefficient; SE, standard error; HR, Hazard Ratio; CI, Confidence Interval.
GPX2 played an important role in ROS related apoptosis induced by lenvatinib in HCC cells
To explore its important role in HCC, GPX2 was markedly inhibited by GPX2 specific siRNA in HepG2 cells, and significantly upregulated by lentivirus vector carrying the GPX2 gene (Fig. 3D–E). We furtherly explored the role of GPX2 and ROS related apoptosis in HCC cells. The results demonstrated that downregulating GPX2 markedly increased the ROS levels in HepG2 cells, while overexpression of GPX2 significantly decreased the ROS levels in Huh7 cells (Fig. 3F). Moreover, we found that inhibiting the expression of GPX2 could sensitize HepG2 cells to lenvatinib, while Huh7 cells with overexpression of GPX2 became more resistant to lenvatinib (Fig. 3G–H). Taken together, these results suggested that HCC cells with high levels of GPX2 were more resistant to lenvatinib.
Lenvatinib suppressed GPX2 expression by preventing nuclear translocation of β-catenin
Previous researches have demonstrated that β-catenin could directly activate the promoter of GPX2 in HepG2 cells [29]. To explore the regulation of β-catenin/GPX2 axis, we found a GEO dataset (GSE94858), which explored the gene expression profiling of HepG2 cells after knockdown of β-catenin. By analyzing the GSE94858 with the GEO2R, we found that GPX2 was significantly downregulated after knockdown of β-catenin (Fig. 4A). qRT-PCR results confirmed that specific knockdown of β-catenin significantly decreased GPX2 mRNA levels in HepG2 cells, while overexpression of β-catenin markedly increased GPX2 mRNA levels in Huh7 cells (Fig. 4B–C). In addition, we also confirmed that the mRNA level of β-catenin (CTNNB1) was markedly upregulated in HCC tissues by analyses of the TCGA database (Fig. 4D). Moreover, we also detected that lenvatinib significantly suppressed GPX2 expression, while overexpression of β-catenin markedly impaired its effect on GPX2 inhibition in HCC cells (Fig. 4E). To investigate whether lenvatinib could modulate the activation of β-catenin, we used western blot and immunofluorescence to detect the nuclear translocation of β-catenin. The results demonstrated that lenvatinib prevented the nuclear translocation of β-catenin in HepG2 and Huh7 cells (Fig. 4F–G).
Fig. 4.

Lenvatinib regulate β-catenin/GPX2 axis in HCC cells. (A) Analyses of GEO database (GSE94858) showed that specific siRNA of β-catenin marked suppressed CTNNB1 expression. (B–C) Our results further confirmed that GPX2 expression was markedly inhibited by si-β-catenin in HepG2 cells, while upregulated β-catenin increased GPX2 expression in Huh7 cells. (D) Analyses of the TCGA database showed that CTNNB1 was significantly overexpressed in HCC tissues compared with adjacent normal tissues. (E) The western blot results revealed that lenvatinib inhibited GPX2 expression through modulating β-catenin. (F) The nuclear and cytoplasm proteins were collected for western blot analysis. The results showed that β-catenin levels in the nuclear were marked decreased after the treatment of lenvatinib in both HepG2 and Huh7 cells. (G) Immunofluorescence detection demonstrated that lenvatinib could prevent the nuclear translocation of β-catenin in HepG2 and Huh7 cells. Scale bars: 40 μm. Data represents the mean ± SD of three independent experiments. Statistical evaluation of the data was assessed using Student’s t-test (B-D). P > 0.05, ns: no significance.
β-catenin drove GPX2 expression and decreased lenvatinib sensitivity in HCC cells
Since the above results demonstrated that GPX2 could modulate ROS levels, we also explored the regulation of β-catenin and ROS levels in HCC cells. The results revealed that downregulating β-catenin markedly increased the ROS levels in HepG2 cells, while upregulating β-catenin significantly decreased the ROS levels in Huh7 cells (Fig. 5A–B). In addition, to explore β-catenin and the sensibility of lenvatinib in HCC cells, HepG2 cells were transfected with siRNA (si-β-catenin) and then treated with lenvatinib. The results demonstrated that inhibiting β-catenin could markedly enhance the cell apoptosis in HepG2 cells, while increasing β-catenin impaired the anti-tumor effect of lenvatinib in Huh7 cells (Fig. 5C–D). The illustrative model of Fig. 5E showed that lenvatinib induced ROS related apoptosis by regulating the β-catenin/GPX2 axis.
Fig. 5.

β-catenin regulated ROS levels and decreased lenvatinib sensitivity in HCC cells. (A–B) Flow cytometry results demonstrated that si-β-catenin could increase ROS levels in HepG2 cells, while LV-β-catenin could decrease ROS levels in Huh7 cells. (C) Flow cytometry results revealed that lenvatinib at the dose of 20 μmol/L had limited effect on cell apoptosis in HepG2 cells, while down-regulation of β-catenin marked enhanced the anti-tumor effect of lenvatinib against HepG2 cells. (D) The results demonstrated that overexpression of β-catenin impaired the anti-tumor effect of lenvatinib against Huh7 cells. (E) Illustrative model showed the proposed mechanism that lenvatinib induced ROS related apoptosis by regulating the β-catenin/GPX2 axis. Statistical evaluation of the data was assessed using Student’s t-test (A-B) and two-way analysis of variance (ANOVA) with Bonferroni correction (C–D). *P < 0.05; P > 0.05, ns: no significance.
Low expression of GPX2 in HCC tissues conferred better efficiency to lenvatinib treatment in patients
To further explore the treatment response to lenvatinib and the GPX2 levels in HCC patients, we analyzed the expression of GPX2 in 22 patients who received lenvatinib treatment. The evaluation of the lenvatinib efficiency using CT or MRI was performed every 8–12 weeks according to mRECIST. Based on mRECIST criteria, one patient achieved complete response (CR), four patients achieved partial response (PR), nine patients achieved stable disease (SD), and eight patients achieved progression disease (PD), respectively. Taken together, the objective response rate (ORR) in our cohort was 22.7% and the disease control rate (DCR) was 63.6%. To our interest, 44.4% (4/9) of HCC patients with low GPX2 were responders (CR + PR), while most patients (12/13) with high GPX2 were non-responders (SD + PD) (Fig. 6). Therefore, these findings suggested that GPX2 might be a biomarker for predicting the efficiency of lenvatinib in HCC patients.
Fig. 6.

High levels of GPX2 expression correlated with poor efficiency to lenvatinib treatment in HCC patients. (A). Representative immunohistochemical images of GPX2 protein expression in HCC specimens (left). Images of CT or MR scans before and after therapy of lenvatinib in HCC patients. (Red arrow point for the lesions in the liver, and yellow arrow point for the tumor thrombus in vascular). (B) Correlation analysis of GPX2 expression and lenvatinib efficiency in our cohort. (C) Percentage changes of the diameters of lesions after lenvatinib treatment compared with baseline according to mRECIST. The Chi-square test was used to analyse the correlation between the expression of GPX2 and lenvatinib response. (For interpretation of the references to colour in this figure legend, the reader is referred to the web version of this article.)
Discussion
In the present study, we found that lenvatinib could increase ROS levels and induce cells apoptosis via inhibiting GPX2 expression in HCC cells. HCC cells with high levels of GPX2 were more resistant to lenvatinib. We also found that GPX2 was overexpressed in HCC tissues in the TCGA database and our cohort of HCC patients. In addition, we demonstrated that GPX2 was a downstream gene regulated by β-catenin. Mechanistically, our results showed that the mechanism of lenvatinib against HCC might be through preventing the nuclear translocation of β-catenin, and targeting β-catenin or GPX2 could enhance the effect of lenvatinib against HCC.
Sorafenib served as the only first-line targeted drug for nearly ten years, and recently lenvatinib became the second targeted drug as first-line therapy for HCC. The questions about how to choose the targeted drugs for HCC patients needed further discussion. Compared with sorafenib, lenvatinib might display its superior anti-tumor effect through targeting FGFRs [6], [30]. Increasing evidences suggested that FGF signaling pathways were commonly activated in HCC and contributed to sorafenib resistance [31], [32], [33]. Recently, studies demonstrated that lenvatinib displayed selective anti-proliferative activity in HCC cells with high levels of FGF19, and higher FGFR4 expression could serve as biomarkers for combined therapy of lenvatinib plus anti-PD-1 [26], [27]. More interestingly, our microarray gene expression analysis in Huh7 cells exposed to lenvatinib also demonstrated that FGF19 was significantly downregulated (data not shown). These findings suggested that FGF19 might be one of the molecular biomarkers for choosing targeted drugs in HCC patients.
As a first-line therapy for HCC, lenvatinib is now widely applied in clinics and prolongs the prognosis of advanced HCC patients. Lenvatinib was recommended orally for unresectable HCC patients at 12 mg/day for ≥60 kg and 8 mg/day for <60 kg [9], [34]. However, the results of REFLECT trial and real-world studies showed that the ORR was less than 30% [9], [35]. Therefore, exploring the potential biomarkers to predict the therapy response and to guide the selection of dosage of lenvatinib are urgently needed. The present study demonstrated that lenvatinib could dose-dependently suppress GPX2 expression in HCC cells, but only relative high dose of lenvatinib could induced cell apoptosis in HepG2 and PLC/PRF5 cells (with high levels of GPX2). Our results confirmed that HCC cells with high expression of GPX2 were more resistant to lenvatinib. In addition, we also conducted a retrospective analysis of 22 lenvatinib-treated recurrent HCC patients. Consistent with previous studies, the ORR in our cohort was 22.7% (5/22) for all the patients. It means that there are over 70% of HCC patients who could not benefit from the treatment of lenvatinib. To our interest, the results showed that the ORR was 44.4% (4/9) in patients who expressed lower levels of GPX2, while the ORR was only 7.7% (1/13) in patients who expressed higher levels of GPX2. These results provide evidence that those HCC patients with low levels of GPX2 might benefit from lenvatinib treatment, while those patients with high expression of GPX2 should be suggested with higher dosage of lenvatinib or combined therapy to improve the prognosis.
The oncogenic role of GPX2 has been documented in various cancers and is associated with tumor progression [36], [37]. It was reported that GPX2 levels were associated with metastasis formation and resistance to current systemic therapy in colorectal cancer, and increasing ROS levels through targeting GPX2 may be an effective anti-tumor therapy [22]. Others also showed that YAP promoted ROS accumulation through downregulation of GPX2, thus triggering cell growth inhibition in lung squamous cell carcinoma [21]. In addition, researchers demonstrated that GPX2 was upregulated in HCC tumor tissues and associated with early hepatocarcinogenesis [23]. Our study also proved that GPX2 was overexpressed in HCC tumor tissues by analyses of the TCGA database and the qRT-PCR results in our cohort of HCC patients. We further showed that GPX2 played an important role in ROS-mediated regulation of cell apoptosis in HCC. To the best of our knowledge, this is the first study to demonstrate the correlation between GPX2 inhibition and ROS related apoptosis in HCC.
Inhibiting degradation of β-catenin could accumulate its nuclear translocation and interacts with the transcription factors (TCF/LEF) to regulate target genes [38]. Activation of Wnt/β-catenin pathway is highly involved in the progression of HCC. The present study also confirmed the oncogenic role of CTNNB1 in HCC tissues by analysis the TCGA database. It was reported that β-catenin/TCF4 directly bind to the promoter of GPX2 in HepG2 cells [29], which was consistent with our result that GPX2 was a target of β-catenin by loss and gain function of experiment. We also demonstrated that lenvatinib could prevent the nuclear translocation of β-catenin in HCC cells. The current data revealed a potential mechanism of lenvatinib, and demonstrated its ability to inactive β-catenin in HCC.
In conclusion, our study demonstrated that GPX2 plays an important role in lenvatinib against HCC, which might serve as a biomarker for lenvatinib treatment for HCC patients. Moreover, this finding also provides evidence to further evaluate the potential application of anti-GPX2 therapy combined with lenvatinib for improving the survival of HCC patients. Since the limited HCC samples we collected, the exact role of GPX2 in lenvatinib sensibility still needs further investigation, and we will keep focusing on this issue in our future studies.
Compliance with Ethics Requirements
All sample tissues collection was approved by the ethics committee of the Sun Yat-Sen Memorial Hospital of Sun Yat-Sen University. Animal experiments were approved by the Bioethics Committee of Sun Yat-Sen University and were performed according to the National Institutes of Health guidelines, the approval number is SYSU-IACUC-2020-B1016.
Declaration of Competing Interest
The authors declare that they have no known competing financial interests or personal relationships that could have appeared to influence the work reported in this paper.
Acknowledgments
Acknowledgements
This work was supported by grants from the National Natural Science Foundation of China (No. 81972263, 82072714 and 82103221), the program of Guangdong Provincial Clinical Research Center for Digestive Diseases (2020B1111170004) and China Postdoctoral Science Foundation (2020M683094).
Authors’ contributions
YJC and CZS designed the experiment and provided funding for the project; WLT and KLZ conducted most of the experiments and wrote the paper; XMC and YCW collected the clinical tissues; ZQX and LY analyzed the data and prepared all the figures. SCZ edited and reviewed the manuscript. All the authors have read and approved the final manuscript.
Footnotes
Peer review under responsibility of Cairo University.
Supplementary data to this article can be found online at https://doi.org/10.1016/j.jare.2022.03.012.
Contributor Information
Yajin Chen, Email: chenyaj@mail.sysu.edu.cn.
Changzhen Shang, Email: shchzh2@mail.sysu.edu.cn.
Appendix A. Supplementary material
The following are the Supplementary data to this article:
References
- 1.Cheng A.-L., Kang Y.-K., Chen Z., Tsao C.-J., Qin S., Kim J.S., et al. Efficacy and safety of sorafenib in patients in the Asia-Pacific region with advanced hepatocellular carcinoma: a phase III randomised, double-blind, placebo-controlled trial. Lancet Oncol. 2009;10(1):25–34. doi: 10.1016/S1470-2045(08)70285-7. [DOI] [PubMed] [Google Scholar]
- 2.Llovet J.M., Ricci S., Mazzaferro V., Hilgard P., Gane E., Blanc J.-F., et al. Sorafenib in advanced hepatocellular carcinoma. N Engl J Med. 2008;359(4):378–390. doi: 10.1056/NEJMoa0708857. [DOI] [PubMed] [Google Scholar]
- 3.Johnson P.J., Qin S., Park J.-W., Poon R.T.P., Raoul J.-L., Philip P.A., et al. Brivanib versus sorafenib as first-line therapy in patients with unresectable, advanced hepatocellular carcinoma: results from the randomized phase III BRISK-FL study. J Clin Oncol. 2013;31(28):3517–3524. doi: 10.1200/JCO.2012.48.4410. [DOI] [PubMed] [Google Scholar]
- 4.Cainap C., Qin S., Huang W.-T., Chung I.J., Pan H., Cheng Y., et al. Linifanib versus Sorafenib in patients with advanced hepatocellular carcinoma: results of a randomized phase III trial. J Clin Oncol. 2015;33(2):172–179. doi: 10.1200/JCO.2013.54.3298. [DOI] [PMC free article] [PubMed] [Google Scholar]
- 5.Cheng A.-L., Kang Y.-K., Lin D.-Y., Park J.-W., Kudo M., Qin S., et al. Sunitinib versus sorafenib in advanced hepatocellular cancer: results of a randomized phase III trial. J Clin Oncol. 2013;31(32):4067–4075. doi: 10.1200/JCO.2012.45.8372. [DOI] [PubMed] [Google Scholar]
- 6.Cabanillas M.E., Habra M.A. Lenvatinib: Role in thyroid cancer and other solid tumors. Cancer Treat Rev. 2016;42:47–55. doi: 10.1016/j.ctrv.2015.11.003. [DOI] [PubMed] [Google Scholar]
- 7.Tohyama O., Matsui J., Kodama K., Hata-Sugi N., Kimura T., Okamoto K., et al. Antitumor activity of lenvatinib (e7080): an angiogenesis inhibitor that targets multiple receptor tyrosine kinases in preclinical human thyroid cancer models. J Thyroid Res. 2014;2014:1–13. doi: 10.1155/2014/638747. [DOI] [PMC free article] [PubMed] [Google Scholar]
- 8.Okamoto K., Kodama K., Takase K., Sugi N.H., Yamamoto Y., Iwata M., et al. Antitumor activities of the targeted multi-tyrosine kinase inhibitor lenvatinib (E7080) against RET gene fusion-driven tumor models. Cancer Lett. 2013;340(1):97–103. doi: 10.1016/j.canlet.2013.07.007. [DOI] [PubMed] [Google Scholar]
- 9.Kudo M., Finn R.S., Qin S., Han K.-H., Ikeda K., Piscaglia F., et al. Lenvatinib versus sorafenib in first-line treatment of patients with unresectable hepatocellular carcinoma: a randomised phase 3 non-inferiority trial. Lancet. 2018;391(10126):1163–1173. doi: 10.1016/S0140-6736(18)30207-1. [DOI] [PubMed] [Google Scholar]
- 10.Redza-Dutordoir M., Averill-Bates D.A. Activation of apoptosis signalling pathways by reactive oxygen species. Biochim Biophys Acta. 2016;1863(12):2977–2992. doi: 10.1016/j.bbamcr.2016.09.012. [DOI] [PubMed] [Google Scholar]
- 11.Cui Q., Wang J.-Q., Assaraf Y.G., Ren L., Gupta P., Wei L., et al. Modulating ROS to overcome multidrug resistance in cancer. Drug Resist Updat. 2018;41:1–25. doi: 10.1016/j.drup.2018.11.001. [DOI] [PubMed] [Google Scholar]
- 12.Pajic M., Froio D., Daly S., Doculara L., Millar E., Graham P.H., et al. miR-139-5p Modulates Radiotherapy Resistance in Breast Cancer by Repressing Multiple Gene Networks of DNA Repair and ROS Defense. Cancer Res. 2018;78(2):501–515. doi: 10.1158/0008-5472.CAN-16-3105. [DOI] [PubMed] [Google Scholar]
- 13.Xie J., Li Y., Jiang K.e., Hu K., Zhang S., Dong X., et al. CDK16 Phosphorylates and Degrades p53 to Promote Radioresistance and Predicts Prognosis in Lung Cancer. Theranostics. 2018;8(3):650–662. doi: 10.7150/thno.21963. [DOI] [PMC free article] [PubMed] [Google Scholar]
- 14.Coriat R., Nicco C., Chéreau C., Mir O., Alexandre J., Ropert S., et al. Sorafenib-induced hepatocellular carcinoma cell death depends on reactive oxygen species production in vitro and in vivo. Mol Cancer Ther. 2012;11(10):2284–2293. doi: 10.1158/1535-7163.MCT-12-0093. [DOI] [PubMed] [Google Scholar]
- 15.Shao Z., Jiang S., Cheng Z. Erlotinib induces the human non-small-cell lung cancer cells apoptosis via activating ROS-dependent JNK pathways. Cancer Med. 2016;5(11):3166–3175. doi: 10.1002/cam4.881. [DOI] [PMC free article] [PubMed] [Google Scholar]
- 16.Houessinon A., François C., Sauzay C., Louandre C., Mongelard G., Godin C., et al. Metallothionein-1 as a biomarker of altered redox metabolism in hepatocellular carcinoma cells exposed to sorafenib. Mol Cancer. 2016;15(1) doi: 10.1186/s12943-016-0526-2. [DOI] [PMC free article] [PubMed] [Google Scholar]
- 17.Bocci G., Di Desidero T., Elia G., Ruffilli I., Ragusa F., Orlandi P., et al. Lenvatinib exhibits antineoplastic activity in anaplastic thyroid cancer in vitro and in vivo. Oncol Rep. 2018;39(5):2225–2234. doi: 10.3892/or.2018.6306. [DOI] [PubMed] [Google Scholar]
- 18.Brigelius-Flohé R., Maiorino M. Glutathione peroxidases. Biochim Biophys Acta. 2013;1830(5):3289–3303. doi: 10.1016/j.bbagen.2012.11.020. [DOI] [PubMed] [Google Scholar]
- 19.Yang W., SriRamaratnam R., Welsch M., Shimada K., Skouta R., Viswanathan V., et al. Regulation of ferroptotic cancer cell death by GPX4. Cell. 2014;156(1-2):317–331. doi: 10.1016/j.cell.2013.12.010. [DOI] [PMC free article] [PubMed] [Google Scholar]
- 20.Huang Zhiquan, Liu Yeqing, Huang Zixian, Li Haifeng, Gan Xiangfeng, Shen Zhuojian. 1,25-Dihydroxyvitamin D3 alleviates salivary adenoid cystic carcinoma progression by suppressing GPX1 expression through the NF-κB pathway. Int J Oncol. 2016;48(3):1271–1279. doi: 10.3892/ijo.2016.3341. [DOI] [PubMed] [Google Scholar]
- 21.Huang H., Zhang W., Pan Y., Gao Y., Deng L., Li F., et al. YAP suppresses lung squamous cell carcinoma progression via deregulation of the DNp63-GPX2 axis and ROS accumulation. Cancer Res. 2017;77(21):5769–5781. doi: 10.1158/0008-5472.CAN-17-0449. [DOI] [PubMed] [Google Scholar]
- 22.Emmink B.L., Laoukili J., Kipp A.P., Koster J., Govaert K.M., Fatrai S., et al. GPx2 suppression of H2O2 stress links the formation of differentiated tumor mass to metastatic capacity in colorectal cancer. Cancer Res. 2014;74(22):6717–6730. doi: 10.1158/0008-5472.CAN-14-1645. [DOI] [PubMed] [Google Scholar]
- 23.Suzuki S., Pitchakarn P., Ogawa K., Naiki-Ito A., Chewonarin T., Punfa W., et al. Expression of glutathione peroxidase 2 is associated with not only early hepatocarcinogenesis but also late stage metastasis. Toxicology. 2013;311(3):115–123. doi: 10.1016/j.tox.2013.07.005. [DOI] [PubMed] [Google Scholar]
- 24.Sasaki R., Kanda T., Fujisawa M., Matsumoto N., Masuzaki R., Ogawa M., et al. Different Mechanisms of Action of Regorafenib and Lenvatinib on Toll-Like Receptor-Signaling Pathways in Human Hepatoma Cell Lines. Int J Mol Sci. 2020;21(9):3349. doi: 10.3390/ijms21093349. [DOI] [PMC free article] [PubMed] [Google Scholar]
- 25.Xu L., Gong C., Li G., Wei J., Wang T., Meng W., et al. Ebselen suppresses inflammation induced by Helicobacter pylori lipopolysaccharide via the p38 mitogen-activated protein kinase signaling pathway. Mol Med Rep. 2018;17(5):6847–6851. doi: 10.3892/mmr.2018.8641. [DOI] [PubMed] [Google Scholar]
- 26.Matsuki M., Hoshi T., Yamamoto Y., Ikemori-Kawada M., Minoshima Y., Funahashi Y., et al. Lenvatinib inhibits angiogenesis and tumor fibroblast growth factor signaling pathways in human hepatocellular carcinoma models. Cancer Med. 2018;7(6):2641–2653. doi: 10.1002/cam4.1517. [DOI] [PMC free article] [PubMed] [Google Scholar]
- 27.Yi C., Chen L., Ling Z., Liu L., Shao W., Zhang R., et al. Lenvatinib Targets FGFR4 to Enhance Antitumor Immune Response of Anti-PD-1 in Hepatocellular Carcinoma. Hepatology. 2021 doi: 10.1002/hep.31921. [DOI] [PubMed] [Google Scholar]
- 28.Tan W., Luo X., Li W., Zhong J., Cao J., Zhu S., et al. TNF-alpha is a potential therapeutic target to overcome sorafenib resistance in hepatocellular carcinoma. EBioMedicine. 2018 doi: 10.1016/j.ebiom.2018.12.047. [DOI] [PMC free article] [PubMed] [Google Scholar]
- 29.Banning A., Brigelius-Flohé R. Activation of the glutathione peroxidase 2 (GPx2) promoter by beta-catenin. Biol Chem. 2007;388(10):1027–1033. doi: 10.1515/BC.2007.137. [DOI] [PubMed] [Google Scholar]
- 30.Kudo M. Lenvatinib May Drastically Change the Treatment Landscape of Hepatocellular Carcinoma. Liver Cancer. 2018;7(1):1–19. doi: 10.1159/000487148. [DOI] [PMC free article] [PubMed] [Google Scholar]
- 31.Teng Y., Zhao H., Gao L., Zhang W., Shull A.Y., Shay C. FGF19 Protects Hepatocellular Carcinoma Cells against Endoplasmic Reticulum Stress via Activation of FGFR4-GSK3β-Nrf2 Signaling. Cancer Res. 2017;77(22):6215–6225. doi: 10.1158/0008-5472.CAN-17-2039. [DOI] [PubMed] [Google Scholar]
- 32.Wang X., Tang Y., Huang S., Hu C.A., Teng Y. FGF19/FGFR4 signaling contributes to the resistance of hepatocellular carcinoma to sorafenib. J Exp Clin Cancer Res. 2017;36(1):8. doi: 10.1186/s13046-016-0478-9. [DOI] [PMC free article] [PubMed] [Google Scholar]
- 33.Miura S., Mitsuhashi N., Shimizu H., Kimura F., Yoshidome H., Otsuka M., et al. Fibroblast growth factor 19 expression correlates with tumor progression and poorer prognosis of hepatocellular carcinoma. BMC Cancer. 2012;12(1) doi: 10.1186/1471-2407-12-56. [DOI] [PMC free article] [PubMed] [Google Scholar]
- 34.Tamai T., Hayato S., Hojo S., Suzuki T., Okusaka T., Ikeda K., et al. Dose finding of Lenvatinib in subjects with advanced hepatocellular carcinoma based on population pharmacokinetic and exposure-response analyses. J Clin Pharmacol. 2017;57(9):1138–1147. doi: 10.1002/jcph.917. [DOI] [PMC free article] [PubMed] [Google Scholar]
- 35.Lee J., Sung P.S., Yang H., Lee S.K., Nam H.C., Yoo S.H., et al. A real-world comparative analysis of lenvatinib and Sorafenib as a salvage therapy for transarterial treatments in unresectable HCC. J Clin Med. 2020;9(12):4121. doi: 10.3390/jcm9124121. [DOI] [PMC free article] [PubMed] [Google Scholar]
- 36.Naiki T., Naiki-Ito A., Asamoto M., Kawai N., Tozawa K., Etani T., et al. GPX2 overexpression is involved in cell proliferation and prognosis of castration-resistant prostate cancer. Carcinogenesis. 2014;35(9):1962–1967. doi: 10.1093/carcin/bgu048. [DOI] [PubMed] [Google Scholar]
- 37.Lei Z., Tian D., Zhang C., Zhao S., Su M. Clinicopathological and prognostic significance of GPX2 protein expression in esophageal squamous cell carcinoma. BMC Cancer. 2016;16(1) doi: 10.1186/s12885-016-2462-3. [DOI] [PMC free article] [PubMed] [Google Scholar]
- 38.Rebouissou S., Franconi A., Calderaro J., Letouzé E., Imbeaud S., Pilati C., et al. Genotype-phenotype correlation of CTNNB1 mutations reveals different ß-catenin activity associated with liver tumor progression. Hepatology. 2016;64(6):2047–2061. doi: 10.1002/hep.28638. [DOI] [PubMed] [Google Scholar]
Associated Data
This section collects any data citations, data availability statements, or supplementary materials included in this article.