

Abstract
Chemically inducible dimerization (CID) uses a small molecule to induce binding of two different proteins. CID tools like the FKBP/FRB/rapamycin system have been widely employed to probe molecular events inside and outside cells. While various CID tools are available, chemically inducible trimerization (CIT) does not exist, due to inherent challenges in designing a chemical that simultaneously binds three proteins with high affinity and specificity. Here, we developed CIT by rationally splitting FRB and FKBP. Cellular and structural datasets showed efficient trimerization of split pairs of FRB or FKBP with full length FKBP or FRB, respectively, by rapamycin. CIT rapidly induced tri-organellar junctions, and perturb intended membrane lipids exclusively at select membrane contact sites. By conferring one additional condition to what is achievable with CID, CIT expands the types of manipulation in single live cells, to address cell biology questions otherwise intractable, and engineer cell functions for future synthetic biology applications.
Introduction
Chemically inducible dimerization (CID) uses a bifunctional small molecule to bring together two proteins with high affinity, specificity and fast kinetics1,2. CID systems such as the rapamycin-dependent FKBP-FRB heterodimerization (Fig. 1a) exerts tight spatiotemporal control over local protein concentrations by oligomerization3 or by rapidly translocating a protein of interest to or from a desired site of action4, 5. Such strategies have enabled signal parsing of a given protein from the noise of other cell signaling pathways, leading to discoveries in cell migration, endocytosis, transcription, and translation1, 2, 6. The seconds-to-minutes timescale offers a further advantage: CID strategies are less susceptible to genetic compensation that sometimes plague knockdown or knockout methods. When used as a building block for rewiring circuits in a bottom-up approach, CID systems have created fast, translation-independent synthetic logic gates in mammalian cells7. Over the years, CID has become a widely-used, easily generalizable chemical biology tool with promising clinical impact8.
Figure 1: Rational CIT design and sFRB overexpression in cells.
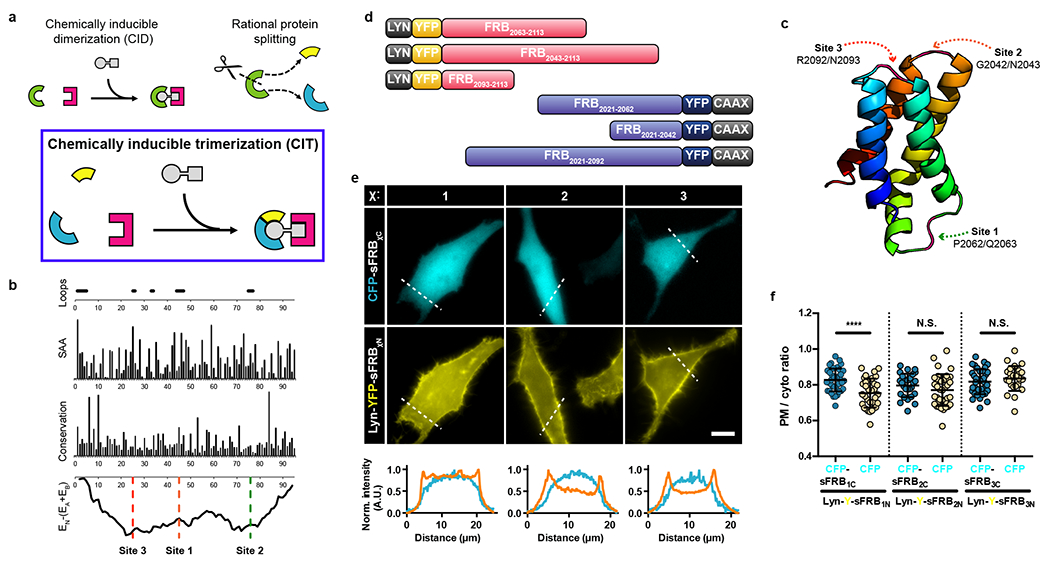
(a) CID proteins FRB (green arc) sites generates FRB protein halves (yellow and blue). Split FRB halves and FKBP form three components of CIT. Rapamycin brings them together. (b) Computationally analysis to determine split sites for FRB domain only. Loop areas with high solvent accessibility area (SAA), low conservation and favorable split energy profiles were chosen. (c) FRB structure (PDB ID: 1AUE) consists of 4 α-helices; split sites 1, 2 and 3 all reside in linker regions between α-helices. (d) Examples of sFRB fusion protein design. Lyn or CAAX motifs target sFRBs to the PM. (e) Co-overexpression of sFRB protein pairs in HeLa cells. N-terminal sFRB halves (sFRB1N, sFRB2N, sFRB3N) are PM localized by Lyn and C-terminal sFRB halves (sFRB1C, sFRB2C, sFRB3C) are cytosolic. Linescans below show normalized PM (orange) and cytosolic (blue) signal intensity. (f) Pre-association between sFRB halves. PM-to-cytosolic ratios derived from linescans of cytosolic sFRB1C, sFRB2C, and sFRB3C co-expressed with PM-targeted sFRB1N, sFRB2N, and sFRB3N respectively compared to CFP alone. Data are presented as mean values +/− SD. From left to right: 39, 33, 27, 39, 36, and 26 cells; 3 independent experiments each. Two-tailed Student’s t test assuming equal variance was used, p-values indicated in graph. Scale bar, 10 μm.
While there have been hundreds of applications of CID, no rapidly inducible trimerization system has been developed to our knowledge. While the concept of trimerization has been demonstrated previously, for instance, with guide RNA as a trigger to trimerization of split Cas9 proteins and a specific DNA site 9, we sought to develop a tool with modularity and broad applicability. Indeed, examples of transient or stable trimerization in biology exist, including but not limited to trimeric G proteins10, inner ear epithelial cell junctions11, and MHC-antigen-TCR complexes governing T-cell selection12. Engineering chemically inducible trimerization (CIT) could address biologically relevant questions, and expand the palette of what is achievable with chemical biology.
In theory, CIT should comprise of three unique protein components that can be brought together by a tri-functional small molecule. However, trimerization is difficult to achieve, as recruiting an additional protein doubles the possible bound states of the small molecule compared to dimerization (Supplementary Fig. 1). Efficient trimerization requires that the trimeric complex be the most favorable state over other less bound configurations. For efficient CID, positive cooperativity is essential: once a CID protein binds rapamycin, the resulting rapamycin-protein complex binds the second protein with > thousand-fold higher affinity than rapamycin alone13. This unique cooperativity is mediated through electrostatic interactions at the FKBP-rapamcycin-FRB interface14. Because engineering de novo proteins with appropriate small molecule-dependent surface interactions should be highly challenging, we instead exploited the special properties of the FKBP-FRB CID system to achieve trimerization.
We present a novel CIT system whose components comprise split FRB and FKBP proteins (Fig. 1a). Candidate split proteins were computationally determined and characterized for their efficacy of trimerization in cells. Formation of the trimer in vitro was assessed by X-ray crystallography. CIT was used to target cytosolic proteins to inter-organelle membrane junctions and induce tri-organellar ER-plasma membrane-mitochondria contacts. Finally, we used CIT to locally alter phosphoinositide composition of ER-plasma membrane junctions. Altogether, CIT has small components that trimerize with fast kinetics in a rapamycin-inducible manner, expanding the variety of perturbations possible in the chemical biology toolkit.
Results
Design of split FRB and FKBP
We determined FRB and FKBP candidate split sites through rational design. We selected FRB (human mTOR residues 2021–2113) with a T2098L mutation, which makes it otherwise unstable unless bound to chemical ligands or FKBP15, to decrease recombination potential after protein splitting (Fig. 1b). FRB T2098L can also recognize rapamycin analogue AP21967, which unlike rapamycin does not bind MTOR pathways, and could be used in in vivo biological studies without toxicity16, 17. In splitting FRB, we avoided its four alpha helices, crucial residues for FRB-FKBP-rapamycin stabilization (L2031, S2035, Y2038, F2039, T2098L, W2101, D2102, and Y2105)14, and regions of high conservation in the three FRB loops (Fig. 1c and Supplementary Fig. 2a,b). The SPELL algorithm18 was used to pinpoint candidate split sites in FRB through computational analysis. All loops selected for splitting (Fig. 1b,c and Supplementary Fig. 2a) show low evolutionary conservation with Kullback-Leibler conservation scores < 2 and have solvent accessible area values > 30 Å2 (Fig. 1b)18,19,20. Split energy profile determined by computing energy of the split parts relative to native energy of the intact protein (Fig. 1b) shows the three FRB loops residing in two major energy wells, which suggest FRB halves split at these sites are less likely to pre-associate18. Split sites for FKBP were also determined in this manner (Supplementary Fig. 4a,b). Hereafter, split FRB or FKBP proteins are abbreviated as sFRB or sFKBP. Each split site is numbered in terms of likelihood of success based on computational analysis; sFRB1, sFRB2 and sFRB3 refer to pairs of sFRB proteins split at sites 1, 2 or 3, with split site 1 most likely to succeed. The N- or C-terminal half of a given sFRB protein pair is sFRBχN or sFRBχC, χ being the split site number.
We generated plasmids of N-terminal fluorophore-tagged sFRB proteins and observed cytosolic expression in transfected HeLa cells (Supplementary Fig. 2c). We also generated Lyn or CAAX tagged-sFRB fusion proteins, all of which correctly localized to the plasma membrane (PM) (Fig. 1d). To determine extent of possible pre-association between sFRB pairs, we used the Lyn motif to target sFRBχN to the PM, and observed the localization of corresponding cytosolic sFRBχC across all three split sites (χ = 1, 2, 3). Higher PM/cytosol ratios occurred between Lyn-Y-sFRB1N and CFP-sFRB1C compared to Lyn-Y-sFRB1N and CFP alone (Fig. 1e,f 0.83 ± 0.01 vs. 0.75 ± 0.01, p < 0.0001). In contrast, cytosolic CFP-sFRB2N and sFRB3N PM/cytosol ratios did not differ from CFP alone (0.80 ± 0.01 vs. 0.77 ± 0.01, 0.82 ± 0.01 vs. 0.84 ± 0.01, respectively), suggesting the sFRB1 pair has higher tendency to pre-associate. This approach to designing split sites, validating cytosolic protein expression, and generating membrane-anchored protein was also applied to sFKBP.
Characterization of split FRB
The sFRB protein pairs were tested for their ability to bind FKBP in a rapamycin-inducible manner to achieve CIT. We co-expressed cytosolic FKBP with PM-localized sFRB pairs in HeLa cells. If functional, rapamycin would shift FKBP localization from the cytosol to the PM (Fig. 2a). sFRB pairs were localized to the PM with Lyn and CAAX tags (Fig. 1d). Upon rapamycin addition, all three sFRB pairs recruited mCh-FKBP to the PM, comparable to full length (FL) FRB (Fig. 2b). Changes in cell linescans reflect the cytosol-to-PM localization shift pre- and 9 mins post-rapamycin administration (Fig. 2b). Percent change in mCh-FKBP PM/cytosol ratios derived from linescans was positive for all sFRB pairs tested; values were not significantly different between sFRB1, sFRB2, and sFRB3 and FL FRB (p = 0.613, 0.057, 0.579 respectively, Fig. 2c). However, no sFRBC half could recruit FKBP to the PM without co-expression of its cognate sFRBN half and vice versa (p < 0.0001 for all cases, Fig. 2c). These results suggest that with rapamycin addition, PM-localized sFRB halves are as efficient as full length FRB in recruiting FKBP, but each sFRB half cannot independently recruit FKBP. However, without FKBP overexpression, sFRB halves can still dimerize (Supplementary Fig. 3), as shown by rapamycin-dependent recruitment of cytosolic sFRBχC to PM-localized Lyn-YFP-sFRBχN (χ = 1, 2, 3). This is most likely due to endogenous FKBP-rapamycin complexes in the cell 21, and/or due to rapamycin alone bringing sFRB pairs together. sFKBP pairs were also screened, and 3 out of 4 split sites (χ = 1, 2, 3) could recruit FRB (Fig. 3f and Supplementary Fig. 4).
Figure 2: Characterization of FKBP recruitment extent and kinetics by sFRB after rapamycin addition.
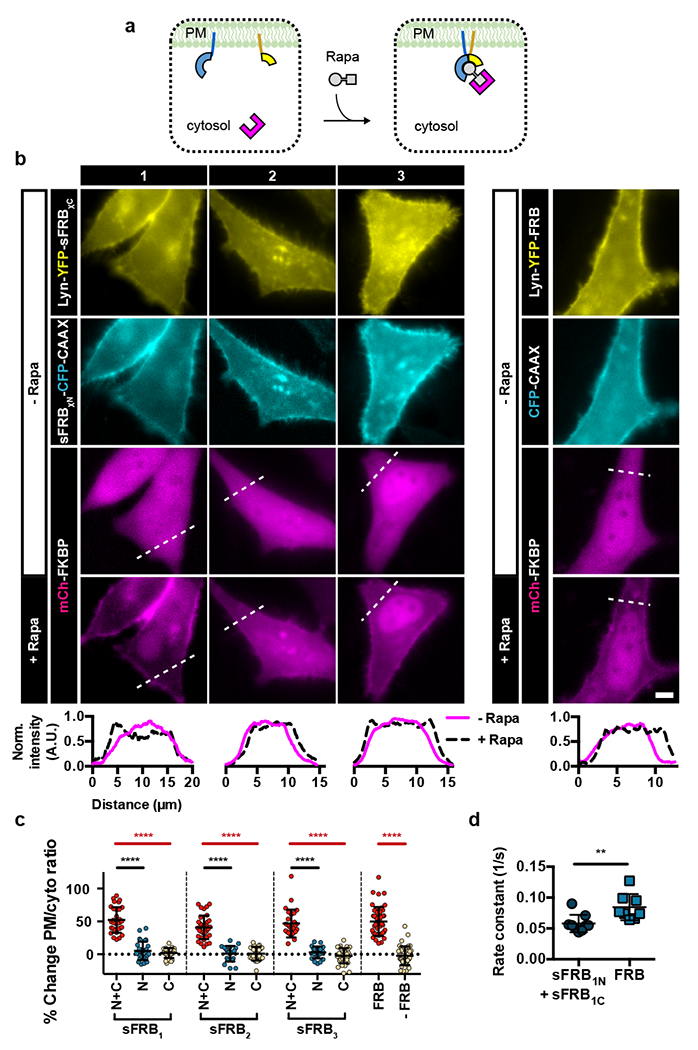
(a) Experimental setup for FKBP recruitment efficacy by sFRBs. sFRB N-terminal and C-terminal halves are PM-targeted by CAAX or Lyn respectively and co-expressed with FKBP. Cytosol-to-PM translocation by FKBP indicates successful recruitment. (b) Translocation of FKBP from cytosol to PM in HeLa cells co-expressing PM-targeted sFRB1, sFRB2, sFRB3 pairs and full length FRB. Pre-rapamycin; top 3 rows. 9 min post-rapamycin; bottom row. Linescans show corresponding normalized intensity of mCh-FKBP signal. (c) Percent change in mCh-FKBP PM-to-cytosolic ratio pre- and post-rapamycin addition. FKBP recruitment by sFRB pairs (N + C) compared to N or C-terminal halves only (N or C), full length FRB or no FRB in FKBP recruitment. Data are presented as mean values +/− SD. From left to right: n = 31, 29, 24, 34, 20, 24, 27, 23, 34, 47, and 43 cells; 3-6 independent experiments each. Two-tailed Student’s t-test assuming equal variance was used, p-values indicated in graph. (d) FKBP recruitment rate constants derived from exponential regression of cytosolic FKBP signal decay imaged with confocal microscopy over 10 s intervals. sFRB1C + sFRB1N and FRB groups use identical plasmid constructs as leftmost and rightmost columns respectively in (b). Data are presented as mean values +/− SD. From left to right: n = 9 and 8 cells; 4-5 independent experiments each. Two-tailed Student’s t-test assuming equal variance was used, p-values indicated in graph. Scale bar, 5 μm.
Figure 3: Crystal structure of the split and unsplit FKBP·rapamycin·FRB (T2098L) complexes.
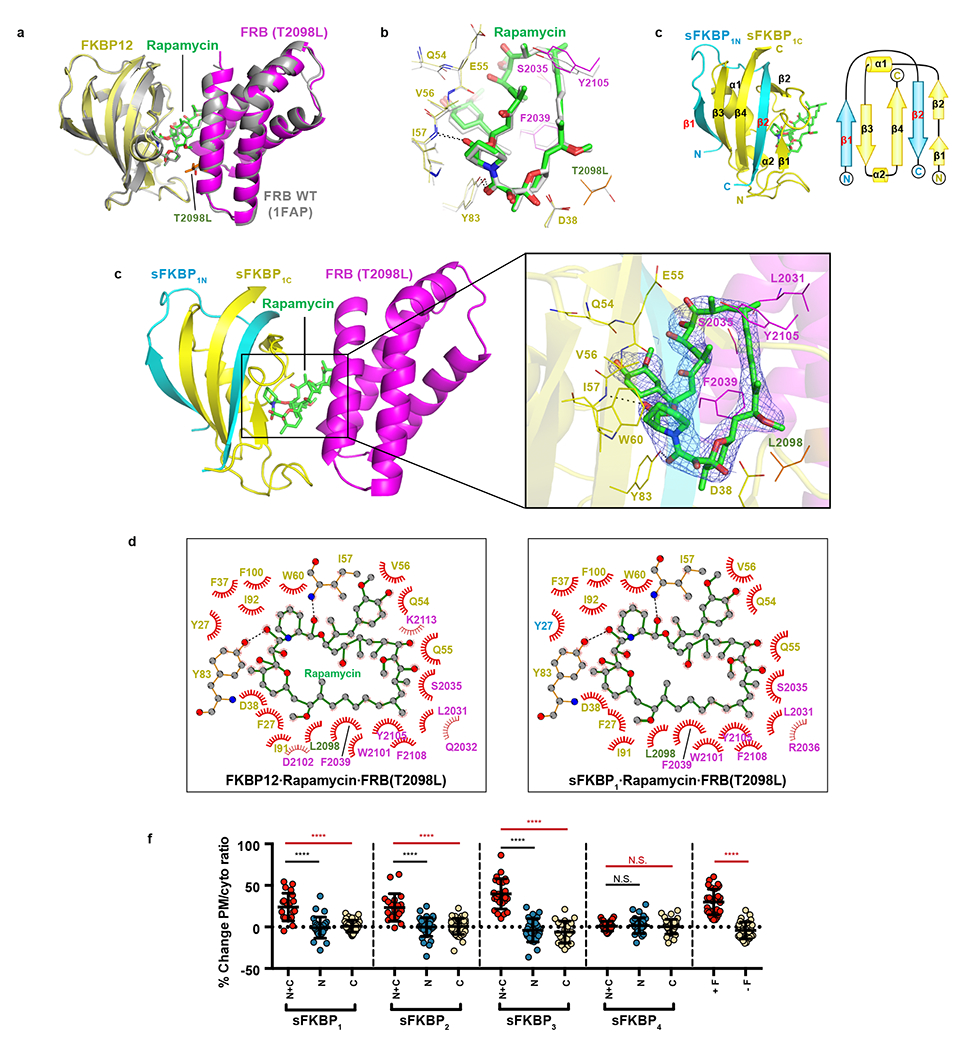
(a) Superimposition of FKBP12·rapamycin·FRB (T2098L) complex crystal structure (yellow, green and magenta) with that of FKBP12·rapamycin·FRB (wild type; PDB ID: 1FAP, gray). T2098L is shown in orange. (b) Zoom-in view of the rapamycin-interacting region of FKBP12·rapamycin·FRB complexes (color-coded as in panel a). Hydrogen bonds are shown as dashes. (c) Ribbon (left) and topology (right) diagrams of the sFKBP1N (cyan), FKBP1C (yellow) and rapamycin (green) complex. (d) Crystal structure of sFKBP1·rapamycin·FRB (T2098L). Left, sFKBP1 (cyan and yellow), rapamycin (green) and FRB (T2098L, magenta) is depicted as a ribbon diagram. Right, Electron density of rapamycin. Rapamycin is depicted as a stick model with a 2Fo-Fc electron density (blue mesh) contoured at 1.5 σ. Residues of sFKBP1C (yellow) and FRB (T2098L) (magenta) involved in the interaction with rapamycin are labeled and shown as a line model. (e) LIGPLOT diagrams showing critical contacts around rapamycin. Left, FKBP12·rapamycin·FRB (T2098L). Right, sFKBP1·rapamycin·FRB (T2098L). Rapamycin (green) and key residues of unsplit (left) and split (right) FKBP proteins (yellow; Y27 of sFKBP1N in cyan) and those of FRB (magenta; T2098L in orange) are depicted in a ball and stick model. Carbon, nitrogen and oxygen are gray, blue and red balls, respectively. Hydrogen bond and hydrophobic interaction is shown in a black dashed line and a red arc of a circle, respectively. (f) Percent change in FRB-mCh PM-to-cytosolic ratio pre- and post-rapamycin addition. Each sFKBP pair (N + C) is compared with N or C-terminal halves only (N or C), full length FKBP or no FKBP in FRB recruitment. Data are presented as mean values +/− SD. From left to right: n = 21, 28, 38, 20, 39, 38, 25, 25, 21, 28, 32, 33, 29 and 31 cells; 3 – 13 independent experiments each. Two-tailed Student’s t-test assuming equal variance used, p-values indicated in graph.
Kinetics of cytosolic FKBP translocation to the PM was determined from exponential regression of cytosolic FKBP intensity decay. The rate constant of cytosolic FKBP signal decay with FL FRB was significantly higher than with the sFRB1 pair (0.085 ± 0.0075 s−1 versus 0.058 ± 0.0047 s−1, p = 0.008; Fig. 2d), indicating that sFRB1 has slower FKBP recruitment kinetics after rapamycin addition. The timescale of FKBP recruitment by the sFRB1 pair, however, still falls within the minutes range. To test for irreversibility, cells expressing PM-localized Lyn-YFP-sFRBχN, cytosolic CFP-sFRBχC (χ = 1, 2, 3) and cytosolic mCh-FKBP were incubated with rapamycin for 30 mins. Samples were then washed 10x, and cells showing trimerization were imaged over 30 mins (Supplementary Fig. 5a). No appreciable decrease in PM/cytosol ratio was detected for either CFP-sFRBχ or mCh-FKBP (Supplementary Fig. 5b), indicating that sFRB CIT systems are practically irreversible, similar to CID. To test for orthogonality, we assessed sFRBN with sFRBC halves split at different sites for rapamycin-based FKBP binding. sFRB pairs are non-orthogonal, but three additional sFRB pairs (sFRB1N/sFRB3C, sFRB2N/sFRB1C, sFRB2N/sFRB3C) were identified to trimerize with FKBP (Supplementary Fig. 6).
Structural validation of split FKBP
First, we solved the crystal structure of the FKBP12·rapamycin·FRB (T2098L) complex to examine whether the T2098L affects the overall conformation and/or the interaction with rapamycin. The crystal structure of FKBP12·rapamycin·FRB (T2098L) determined at 2.20 Å resolution (Fig. 3a) shows only 0.61 Å of the average root-mean-square deviation (RMSD) for Cα atoms to the wild-type FRB-containing complex (PDB ID: 1FAP), indicating that the both structures are in almost perfect agreement. Also, the major interactions between FRB (T2098L), FKBP12 and rapamycin were the same as in the wild-type FRB·FKBP12·rapamycin complex (Fig. 3b). Hence, we confirmed that the T2098L mutation of FRB does not affect the overall conformation and the interactions with rapamycin.
Next, we attempted to purify sFRBχ and sFKBPχ fragments and reconstitute their complexes to structurally validate our split strategy. We could purify sFKBP1N as an MBP fusion protein by an E. coli expression system although we could not obtain the sFRBχN fragments as a soluble protein. Therefore, we aimed to structurally validate whether sFKBP1N and sFKBP1C form a functional sFKBP1 complex. First, we observed that sFKBP1N and sFKBP1C can form a stoichiometric sFKBP1 complex at 10 μM, dependent on the addition of rapamycin (Supplementary Fig. 7). We then solved crystal structures of sFKBP1·rapamycin and sFKBP1·rapamycin·FRB (T2098L) complexes at 2.92–3.11 Å resolution (Fig. 3c,d). In both structures, sFKBP1N and sFKBP1C formed the same secondary structure as FKBP12, showing only 0.38 and 0.42 Å of the average RMSD for Cα atoms to the corresponding region of the intact FKBP12 protein, respectively. The interactions between sFKBP1 and rapamycin are completely conserved in both structures. Finally, the overall structure of sFKBP1·rapamycin·FRB (T2098L) shows only 0.79 Å of the average RMSD to the intact FKBP12·rapamycin·FRB (T2098L) complex, without disrupting hydrogen bonds and major hydrophobic interactions to FRB and rapamycin (Fig. 3e). These results indicate that, in vitro, split FKBP fragments form a functional FKBP protein which is structurally indistinguishable to intact FKBP protein.
CIT at organelle membrane junction sites
Membrane contact sites (MCS) or junctions are regions of close inter-organellar membrane apposition where unique signaling can occur4,22,23. MCS are widespread among almost all membrane-bound organelles24,25, and local MCS molecular tethers and actuators26 regulate processes ranging from calcium27,28,29 and lipid transport30 to organelle fission31,32. Most MCS regulate multiple functions, and local MCS proteins play compensatory roles, such that few MCS have been completely ablated by the knock-down or knock-out of a single gene33. These confounding conditions make rapidly inducible perturbation attractive for studying MCS, as supported by prior studies4, 22, 23, 34. As proof-of-principle, we used CIT to target cytosolic protein to ER-mitochondria and ER-PM MCS, demonstrating its potential as a generalizable recruitment-based screen for MCS function (Fig. 4a).
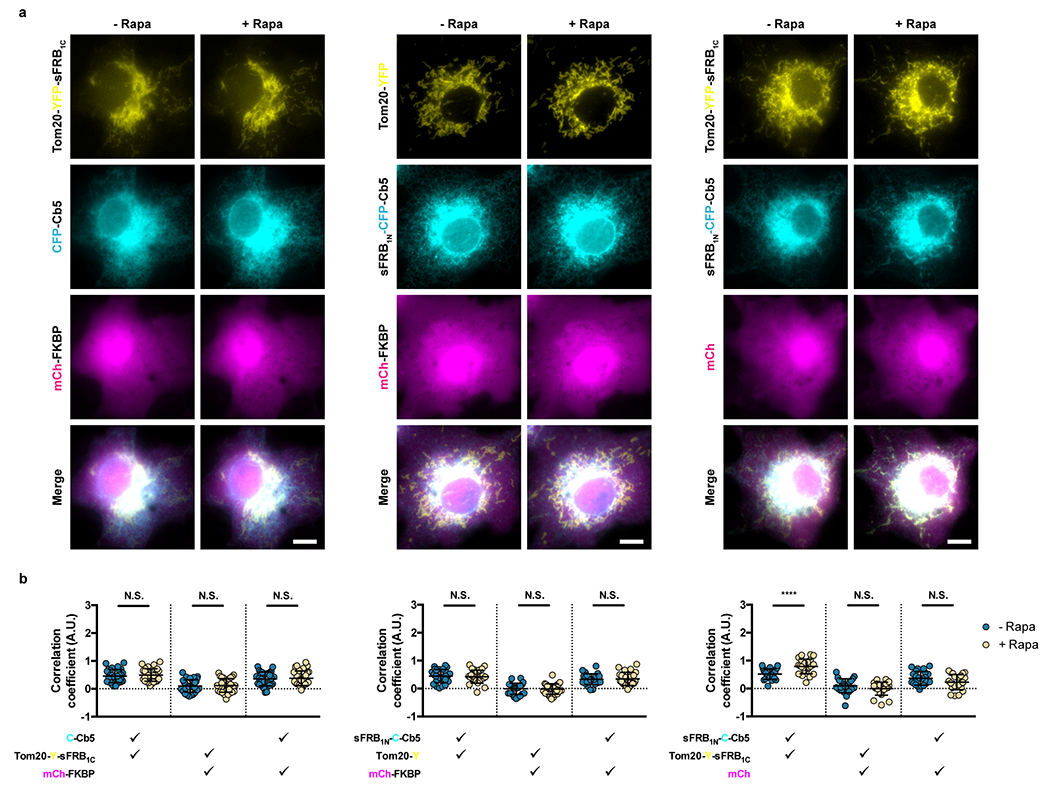
Figure 4: CIT-based recruitment of cytosolic protein to ER-PM and ER-mitochondria MCS.
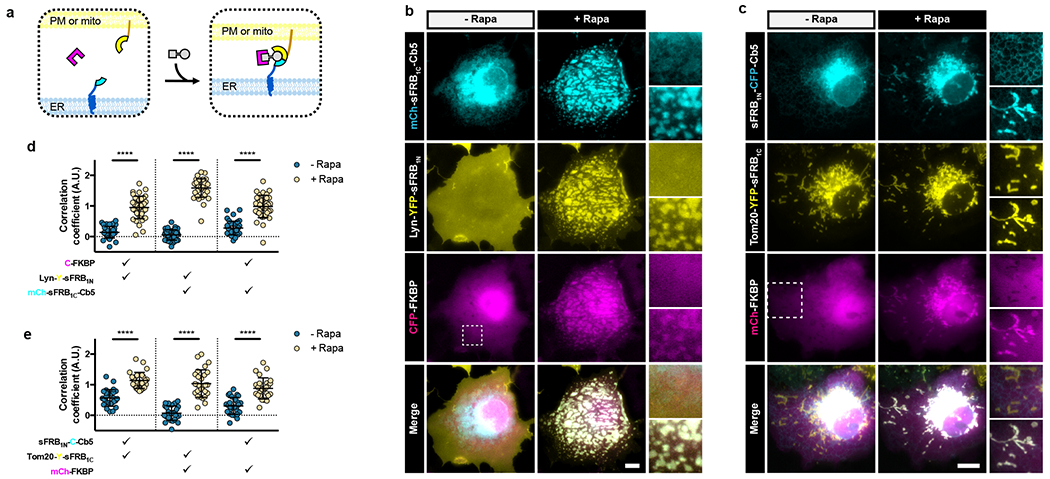
(a) Targeting cytosolic FKBP (magenta) to ER-PM or ER-mitochondria MCS. sFRB halves (cyan and yellow) targeted to two organelles recruit FKBP in a rapamycin-dependent manner. (b) Cos-7 cells expressing mCh-sFRB1C-Cb5, Lyn-Y-sFRB1N and CF pre- and 12 min post-rapamycin for CF recruitment at ER-PM MCS. (c) Cos-7 cells expressing sFRB1N-C-Cb5, Tom20-Y-sFRB1C, and CF pre- and 12 min post-rapamycin for CF recruitment at ER-mitochondria MCS. (d, e) Trimerization quantification between the 3 signals pre- and post-rapamycin. Check marks specify each combination of two wavelengths used in calculating pairwise Fisher’s transformation of Pearson’s correlation coefficients. Data are presented as mean values +/− SD. Two-tailed Student’s t-test assuming equal variance was used to compare correlations pre- and post- 100 nM rapamycin, p-values indicated in graph. (d) n = 38 cells, 3 independent experiments. (e) n = 27 cells, 3 independent experiments. Scale bars, 10 μm.
To recruit cytosolic protein to ER-PM junctions, we co-expressed PM-targeted sFRB1N (Lyn-CFP-sFRB1N) and ER-targeted sFRB1C (YFP-sFRB1C-Cb5) with cytosolic mCh-FKBP (Fig. 4a). After rapamycin addition, ER and PM tethering formed patches that colocalize with mCh-FKBP (Fig. 4b and Supplementary Video 1). Pairwise image correlation between all three image wavelengths all significantly increased after rapamycin (p <0.0001, Fig. 4d), suggesting that the CIT system can recruit cytosolic protein to the ER-PM MCS. When we removed sFRB1N (using Lyn-CFP only) or sFRB1C (using only YFP-Cb5), trimerization could not be observed (Extended Data Fig. 1a,b, left and center) with no increase in image correlation coefficients between all three signals. However, when mCh alone was expressed instead of mCh-FKBP, ER-PM tethering still occurred, albeit with no mCh recruitment to the site, and the image correlation coefficient between the ER and PM signals significantly increased (Extended Data Fig. 1a,b, right).
We also used sFKBP to recruit cytosolic FRB-mCh to ER-PM junctions. Cells showed undetectable or prominent FRB-mCh recruitment at ER-PM junctions pre- and 1 h post-rapamycin addition (Extended Data Fig. 2a,b, respectively). Imaging showed slower cytosolic protein recruitment compared to sFRB trimerization (12 mins vs. 1 h, Supplementary Video 1 vs. Supplementary Video 2). Pairwise image correlation significantly increased between ER and PM channels (p<0.0001), cytosolic FRB-mCh and ER channels (p=0.030), and not significantly between cytosolic FRB-mCh and PM channels (p=0.16) (Extended Data Fig. 2c). Because sFKBP was less efficient compared to sFRB in targeting cytosolic proteins to ER-PM junctions, we decided to continue with only sFRB for MCS applications.
We also applied sFRB CIT to ER-mitochondria junctions. Complimentary sFRB pairs were expressed on the ER (sFRB1N-CFP-Cb5) and mitochondria (Tom20-YFP-sFRB1C), and post-rapamycin addition translocated mCh-FKBP to ER-mitochondria MCS (Fig. 4c and Supplementary Video 3). Pairwise image correlation coefficients increased for all three wavelengths, indicating successful trimerization (p <0.0001 all cases; Fig. 4e). Likewise, removal of sFRB1N (Lyn-YFP) and sFRB1C (mCh-Cb5) yielded no translocation of mCh-FKBP to ER-mitochondria MCS after rapamycin addition (Extended Data Fig. 3a,b, left and center), whereas removal of FKBP resulted in increased co-localization between the ER and mitochondria components, without co-localization of mCh (Extended Data Fig. 3a,b, right).
CIT induces tri-organellar membrane contact sites
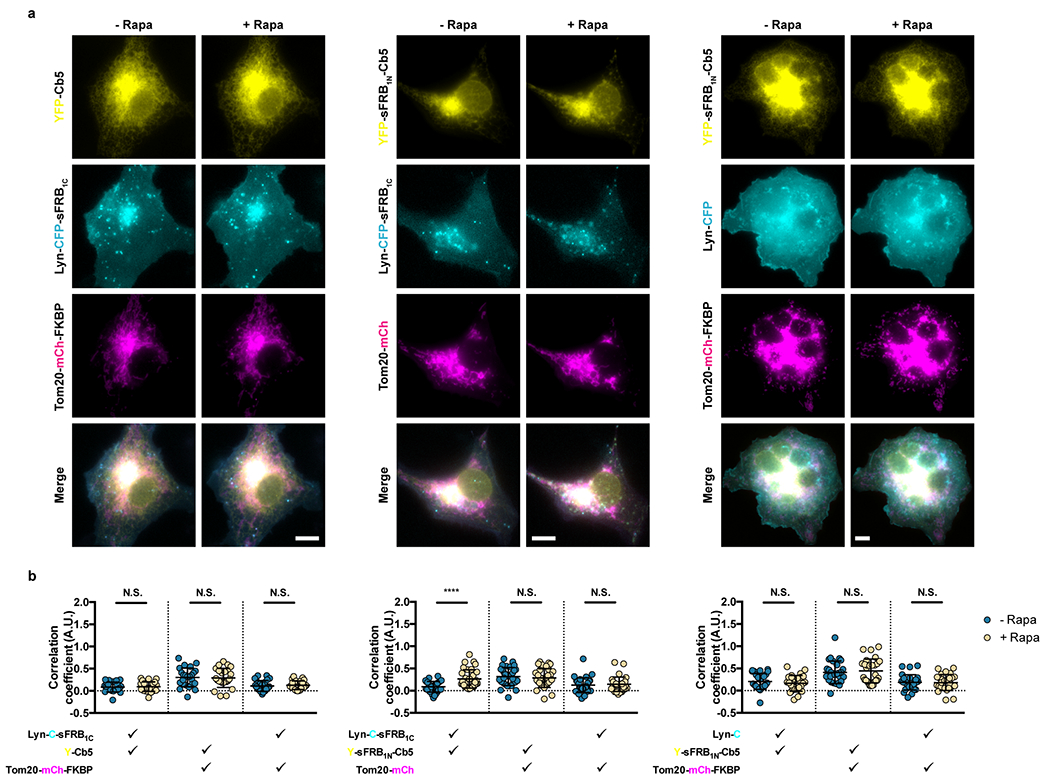
Multi-spectral imaging has revealed that ER-mitochondria MCS makes frequent contact with Golgi, peroxisomes, and lipid droplets, hinting at tri-organellar MCS25. ER-mitochondria MCS also marks regions of autophagosome formation35. We therefore speculated that a tri-organelle ER-PM-mitochondria junction site could exist due to the existence of ER-PM, ER-mitochondria, and PM-mitochondria MCS, and their shared function in Ca2+ signaling. Using CIT to determine if a tri-organellar junction could be synthetically formed between the PM, ER and mitochondria, we co-expressed sFRB1C localized to the PM (Lyn-CFP-sFRB1C), sFRB1N to the ER (YFP-sFRB1N-Cb5) and FKBP to the mitochondria (Tom20-mCh-FKBP) in Cos-7 cells (Fig. 5a-c). Fifteen minutes post-rapamycin addition, PM, ER and mitochondrial signals colocalized (Fig. 5b,c and Supplementary Video 4); all correlation coefficients increased (p < 0.0001; Fig. 5d). When sFRB1C, sFRB1N, or FKBP were each removed, trimerization no longer occurred post-rapamycin (Extended Data Fig. 4a,b, left and right), but removal of FKBP still resulted in colocalization of ER-PM signals (Extended Data Fig. 4a,b, center). These results show that CIT can induce PM-ER-mitochondria tethering, and serves as a detection method for potential tri-organellar MCS formation between three organelles.
Figure 5: Tri-organellar junction formation by CIT.
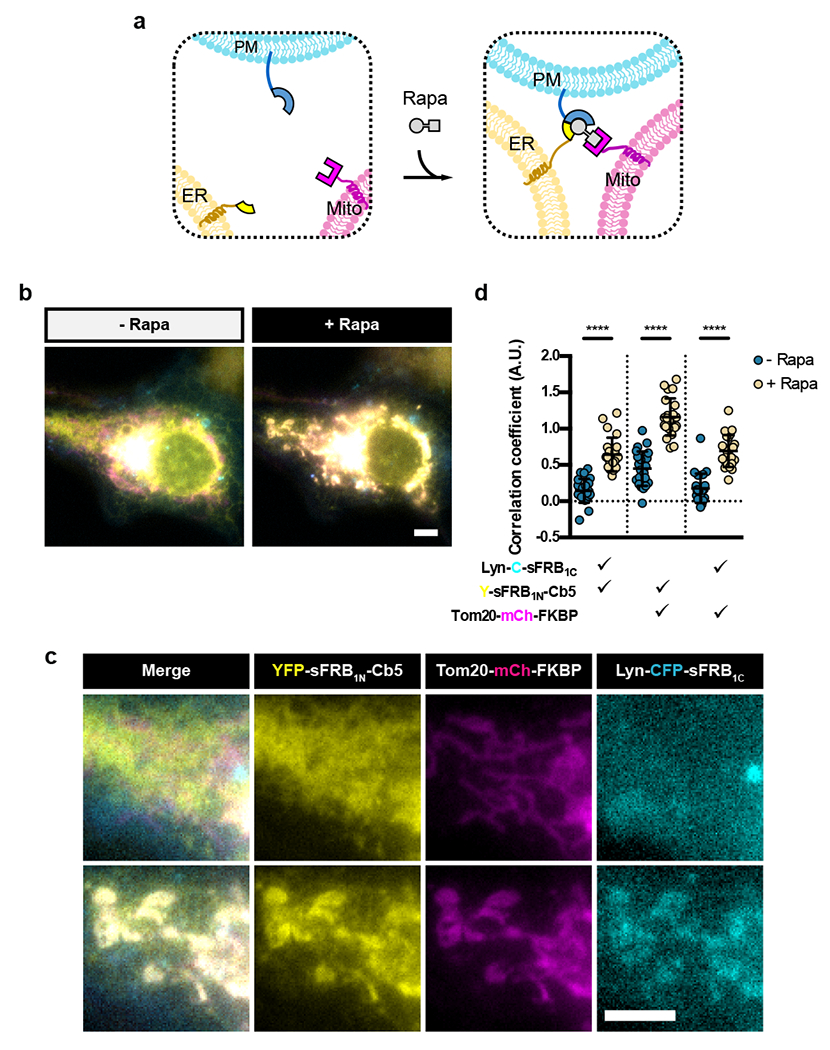
(a) Trimerization of CIT components targeted to ER, mitochondria and PM by rapamycin. (b, c) Cos-7 cell expressing Y-sFRB1N-Cb5, Tom20-mCh-FKBP and Lyn-C-sFRB1C pre- and 15 mins post-rapamycin. (d) Quantification of trimerization extent through pairwise correlation of Fisher’s transformation of Pearson’s correlation coefficient between three wavelengths. Data are presented as mean values +/− SD. Two-tailed Student’s t-test assuming equal variance was used to compare correlations pre- and post- 100 nM rapamycin, p-values indicated in graph. n = 23 cells; 4 independent experiments. Scale bars, 5 μm.
Localized PI(4,5)P2 depletion at ER-PM junctions
Functions of ER-PM MCS include Ca2+ re-entry and lipid homeostasis, with focus shifting to the latter in recent years36. One major topic in the field is the regulation of secondary lipid messenger PI(4,5)P2 (PIP2) and its precursor PI(4)P. PM resident PIP2 and its precursor PI(4)P levels are often in flux during signal transduction. ER-PM junctions serve as a bridge connecting the PM and ER, where local proteins regulate PM lipid homeostasis by using the ER as a reservoir or a sink, depending on the needs of the PM23, 34, 37. While methods exist to perturb PM lipid composition or locally deplete PIP2 from the PM38, the means of perturbing lipids only at ER-PM junctions have yet to be established.
To achieve local PIP2 depletion, we co-expressed PM-localized sFRB1N (Lyn-Clover-FRB1N), ER-localized sFRB1C (iRFP-FRB1C-Cb5), cytosolic CFP-FKBP fused to 5-phosphatase INP54P (331) (CF-INP54P), and PIP2 biosensor mRuby-PH-PLCδ in Cos-7 cells (Fig. 6a). After rapamycin addition, CF-INP54P was recruited to ER-PM junctions, with a marked pattern of reduction in mRuby-PH-PLCδ intensity (Fig.6b, left, and Supplementary Video 5). In contrast, recruitment of INP54P phosphatase-dead mutant CF-INP54P D281A, or CF alone did not reduce mRuby-PH-PLCδ intensity (Fig.6b, center and left, and Supplementary Videos 6 and 7, respectively). Line-scan analysis (Fig. 6c) further confirmed the PIP2 depletion confined to the ER-PM junctions (grey shades). Interestingly, PIP2 levels in the regions outside ER-PM contact sites remained intact, accordingly forming a sharp gradient of PIP2 immediately outside the junctions. Junctional PIP2 reduction occurred in areas of high (teal dashed squares, Fig. 6b) compared to low ER-PM junction formation (orange dashed squares) 5 min after CF-INP54P recruitment by rapamycin, reflected in percent change in mRuby-PH-PLCδ intensity in the respective regions (p < 0.0001, Fig. 6d). CF-INP54P D281A recruitment to ER-PM rich regions only slightly decreased mRuby-PH-PLCδ intensity relative to outside these regions (p = 0.0358, Fig. 6d). CF recruitment to ER-PM rich regions did not significantly change mRuby-PH-PLCδ intensity compared to outside these regions (p = 0.5189, Fig. 6d). The same analysis conducted over time indicates that junctional PIP2 reduction took place as early as 2 mins after INP54P recruitment with rapamycin (Extended Data Fig. 5), and with continued decrease in PIP2 levels even after 10 mins. Lack of PIP2 reduction in CF-INP54P D281A and CF controls further suggests that molecular crowding effects of CIT has minimal impact on the ability of mRuby-PH-PLCδ to detect PIP2. These results collectively demonstrate that CIT-based recruitment of INP54P can locally deplete PIP2 at ER-PM junctions.
Figure 6: CIT induces local PI(4,5)P2 depletion at ER-PM MCS.
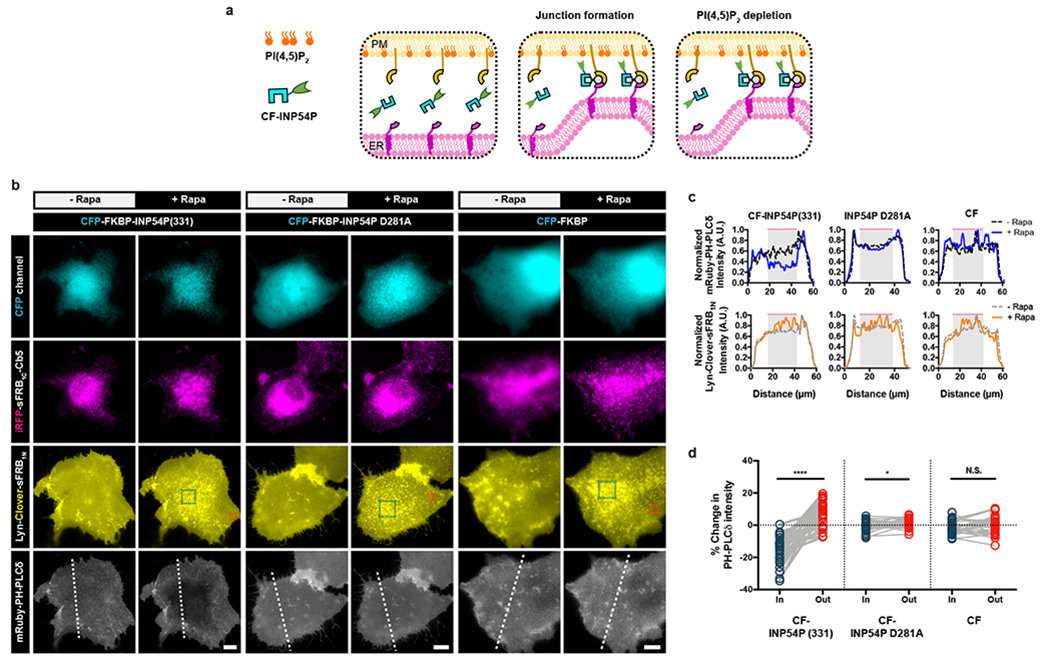
(a) Schematic of CIT-induced PI(4,5)2 depletion. CF-INP54P is recruited to ER-PM MCS by ER and PM localized sFRB halves. Upon junction formation (middle panel), INP54P accesses PM PI(4,5)P2 leading to local PI(4,5)P2 depletion (right panel). (b) Comparing effects of ER-PM MCS recruitment of functional CF-INP54P (331) against phosphatase-dead mutant CF-INP54P (D281A) and CF alone. Cos-7 cells also express Lyn-Clover-sFRB1N, iRFP-sFRB1C-Cb5 and mRuby PH-PLCδ, a PI(4,5)P2 biosensor. Time-lapse epifluorescence microscopy taken pre- and 5 mins post- rapamycin addition. Teal and orange dotted boxes indicate regions inside and outside ER-PM MCS respectively. (c) Normalized intensity of mRuby PH-PLCδ PI(4,5)P2 biosensor linescans from (b). Gray shaded regions with dotted magenta lines indicate high ER-PM junction formation. (d) Intensities of mRuby PH-PLCδ PI(4,5)P2 biosensor of user-defined regions of interest inside and outside ER-PM MCS. Analyzed with two-tailed paired Students t-test assuming equal variance, p-values indicated in graph. Pairs from left to right: n = 28, 25, and 23 cells; 4 independent experiments each. Scale bar, 10 μm.
Discussion
In this study we designed, developed and implemented the first known CIT system by rationally splitting proteins of the FKBP/FRB CID system. The CIT tool is small, robust, and trimerizes on a timescale of seconds-to-minutes. CIT responds to one chemical stimulus, and has clear trimeric stoichometry according to crystallography results. We used CIT to rapidly target cytosolic protein exclusively to ER-PM and ER-mitochondria MCS, induce tri-organellar ER-mitochondria-PM junctions and locally deplete PIP2 at ER-PM MCS. We believe that our ability to achieve CIT is attributed to the unique cooperativity of the FKBP/FRB CID. This efficient CIT system would be otherwise highly difficult to achieve de novo, as engineering sequential cooperativity at protein interfaces would be necessary.
As FKBP binding affinity for rapamycin is over 10,000-fold higher than FRB (0.2 nM vs. 26 μM) 13, we believe that sFRB CIT is first achieved by formation of FKBP-rapamycin complexes, followed by sFRB halves binding. For the sFKBP system, our crystallization data show that rapamycin can dimerize sFKBP1 halves in the absence of FRB. Gel filtration analysis indicates sFKBP1 dimerizes saturatively at a protein concentration of 10 μM in the presence of rapamycin (Supplementary Fig. 7), suggesting that the dissociation constant, switchable by rapamycin, between FKBP1N and sFKBP1C is less than a single digit micromolar concentration. We believe that in the sFKBP system, rapamycin brings together sFKBP with micromolar affinity, and then sFKBP-rapamycin complex recruits full length FRB. Our results suggest that the prevalent mechanism of trimerization for both sFRB and sFKBP CIT systems involves an initial complex formation of FKBP-rapamycin or sFKBP-rapamycin complexes, followed by the binding of sFRB or FRB respectively.
Components of sFRB and sFKBP CIT systems are small; sFRB1N and sFRB1C are 5 kDa and 6.3 kDa respectively. While sFRBχN and sFRBχC halves do not function orthogonally, we discovered three additional sFRB pairs (sFRB1N/sFRB3C, sFRB2N/sFRB1C, sFRB2N/sFRB3C) that trimerize with FKBP. In total, we generated 6 sFRB pairs capable of trimerization, increasing the likelihood of successful CIT implementation across biological systems. Further, the high degree of similarity between WT FRB and FRB T2098L in our crystallization data suggests that that WT or other FRB variants may be split similarlh to generate additional CIT systems which respond to various rapamycin analogues.
Depletion of PIP2 at ER-PM junctions (Fig. 6) catalyzes further investigation of local PIP2 depletion at the ER-PM junction compared to global PIP2 depletion at the PM; it may provide insight into the relationship between lipid transfer and Ca2+ entry at the ER-PM junction, as they share common players such as PIP2 and PI(4)P. Additionally, the tri-organellar PM-ER-mitochondria junction formed through CIT indirectly suggests that these three organelles have the potential of interacting. In the future, CIT can be a powerful tool to validate and perturb other tri-organellar MCS, such as the ER-mitochondria-Golgi junction25.
In all, we developed a trimerization tool capable of cell signaling manipulation in new ways. MCS targeting in this study demonstrated the enhanced spatiotemporal specificity CIT has over CID. We see potential for the tool beyond its role in future screens for studying MCS. Hundreds of available and validated CID-based actuators can now be readily retrofitted with CIT components to modulate various cell signaling pathways 1, 2, 6, including kinase modulation 39, and produce increasingly sophisticated, tunable switches and logic gates. Trimerization is also a common mechanism in nature, and CIT-based mimicry may deduce the significance of trimerization in these systems. By introducing a third component to be recruited to two others with one chemical stimulus, CIT introduces a new tool to chemical, synthetic and cell biology toolkits.
Online Methods
Cell culture and transfection
HeLa and Cos-7 cells were maintained at 37°C, 5% CO2 and 95% humidity in Dulbecco’s modified Eagle’s medium (DMEM) supplemented with 10% FBS and 1% Pen/strep (Gibco). The day prior to imaging, cells were detached with 5% Trypsin-EDTA (Gibco) and harvested for reverse transfection with FuGENE HD (Promega). As a general rule, co-transfection of split and unsplit proteins used a split protein to unsplit protein plasmid ratio of 20:1 for sFRB CIT experiments and a ratio of 10:1 for sFKBP CIT. Prior to imaging, cell medium in samples was replaced with DPBS containing Ca2+ and Mg2+ for imaging < 30 mins or fresh DMEM growth media for imaging > 30 mins. Cells were transfected with constructs at adjusted relative plasmid ratios and incubated for 16-24h prior to imaging.
DNA plasmid construction
Constructs used to determine working split proteins were based off Clontech C1 and N1 backbones with various fluorophores. A 5xSAGG flexible linker oligo was annealed was inserted between KpnI and SalI restriction sites of both C1 and N1 backbones. Lyn or CAAX oligo DNA fragments were subsequently annealed and ligated into C1 or N1 backbones containing 5xSAGG linkers. Then, FRB or FKBP fragments were cloned and inserted between KpnI and BamHI or HindIII and SalI for C1 and N1 vectors respectively. To obtain non-Lyn or CAAX versions of the proteins, the portion containing fluorescent protein with split FRB or FKBP fragments were cut and pasted into C1 or N1 backbone vectors lacking Lyn or CAAX. YFP-sFRB1N-Cb5 was generated by deletion mutagenesis of previously reported YFP-FRB-Cb54. ER-targeting sequence Cb5 was amplified by PCR and subcloned into a sFRB1N-C backbone from sFRB1N-C-Cb5 to generate sFRB1N-C-Cb5. CF-INP54P (331) and CF-INP54P (D281A) were from a previous report 40. All plasmids were verified by Sanger sequencing.
Live-cell imaging
Most imaging was conducted on a IX71 microscope (Olympus) with a 63x objective (and 1.6x zoom) and an ORCA-Flash4.0 LT Digital CMOS camera (Hamamatsu). Rate constant of FKBP recruitment by sFRB1 was imaged at 10 s intervals with a spinning disc confocal, inverted Axiovert 200 (Zeiss) with a 40x objective and an Orca ER CCD camera (Hamamatsu). Both microscopes were driven by Metamorph 7.5 imaging software (Molecular Devices). Four-color imaging in Fig. 4 was conducted with an Eclipse Ti microscope (Nikon) with a 60x objective (and 1.5x zoom) and a Zyla 4.2 sCMOS camera (Andor), driven by NIS Elements software (Nikon). Unless otherwise indicated imaging was done at 1-3 min intervals for 12-30 mins, at times with between 3-5 0.5 um-spaced z positions. Images analyzed and shown are from a single plane, and not maximum intensity projections. Microscopy experiments applying CIT to membrane contact sites were conducted at 37°C, 5% CO2 and humidity with a stage top incubation system (Tokai Hit).
Analysis of PM-to-cytosol ratio
PM-to-cytosol ratio was determined through line-scan analysis. Lines through cells were drawn to 1) avoid the nucleus and 2) maximize the two membrane signals on both sides of the cell. Two PM (p1, p2) locations based on peak intensities (I) along the lines-can were determined visually. The cytosol was defined as midpoint location (m) between p1 and p2. A moving average of 3 was used to determine signal intensity at p1 and p2, and a moving average of 5 at the cytosol location. Then PM-to-cytosol ratio was determined for each PM location, and then averaged. Percent change was determined from PM to cytosol ratio values before and after rapamycin treatment.
Analysis of recruitment rate
Averaged intensities from 3 regions of interest (ROI’s) from the cytosol were used to generate exponential decay curves. Averaged intensity timepoints with exponential decay trends were selected for line fitting with an exponential regression to determine the exponential recruitment coefficient. R2 values were all > 0.88.
Analysis of trimerization with Fisher’s transform of Pearson’s correlation coefficient
3 ROI’s about 50 x 50 pixels were manually positioned for each cell to determine Pearson’s correlation using FIJI. ROIs were chosen include enough background and organelle to mitigate false correlations. Due to organelle movement and deformation, different ROI’s were selected for the same cell before and after rapamycin addition. Pairwise Pearson’s correlation (between ROI1 and ROI2) was determined among three channels using the built-in MATLAB function corr2, and averaged between 3 ROI’s. Fisher’s transform was performed to normalize Pearson’s correlation coefficient for later statistical analysis. The result is altogether referred to as correlation coefficient.
Statistical analysis and data visualization
Unless otherwise stated, most statistical analysis was done with unpaired, two-tailed Student’s T-test assuming equal distributions. A paired, two-tailed Student’s T-test was used in Fig. 6c. PRISM 6 software was used for statistical analysis and data visualization.
Split site prediction
Split sites were determined by selecting non-evolutionarily conserved solvent accessible loops. The Stride program 41 was used to calculate the solvent accessible areas (SAA). Loops exceeding 30 Å2 were selected as potential split sites. Sequence conservation as indicated by Kullback-Liebler conservation scores was determined with MISTIC 42 and FKBP domain and FRB domain sequences used were obtained from PFAM server 43 (Finn 2014). Loops with Kullback-Leibler conservation scores less than 2 were selected as potential split sites. The difference between the native energy of the intact protein and the sum of the energies of the split proteins at a given split site - the split energy - was calculated using the MEDUSA scoring function 44 (Yin 2007). Energy wells were indicative of split sites in this study, which differs from the previous implementation of SPELL, which targeted regions outside energy wells 45. The original SPELL study looked for split proteins sites which minimized the destabilization as these proteins were then fused to a known destabilizer domain (iFKBP) 45. This approach ensures the prevention of the split part association in the absence of rapamycin.
Crystallography
Protein expression and purification
For structural analysis, cDNA encoding the sFKBP1N (residues 1–32 of human FKBP12) was amplified by PCR and subcloned into a pET28a(+) derivative vector, which has a maltose binding protein (MBP)-encoding sequence inserted after an N-terminal polyhistidine tag. The construct contained a tobacco etch virus (TEV) protease recognition site at the junction between polyhistidine tag and the MBP sequences. Recombinant sFKBP1N protein was expressed in E. coli BL21 (DE3) cells in LB broth at 37 °C until the OD600 reached 0.8, at which point the temperature was shifted to 18 °C. Protein expression was induced by addition of isopropyl-β-D-thiogalactopyranoside to a final concentration of 250 μM. The cultures were grown for an additional 20 hrs and harvested by centrifugation. Cell pellets were resuspended in 50 mM Tris-HCl buffer (pH 7.0) containing 500 mM NaCl, 20 mM imidazole and 10% glycerol. Cells were lysed by sonication and clarified by centrifugation. The cell lysate was loaded onto a HisTrap HP column (GE Healthcare), and eluted with 50 mM Tris-HCl buffer (pH 7.0) containing 500 mM NaCl, 500 mM imidazole and 10% glycerol. The N-terminal histidine tag was cleaved by incubating with TEV protease overnight at 4 °C. The protein was further purified using a HiLoad Superdex 200 16/60 size-exclusion column (GE Healthcare) equilibrated with 20 mM Tris-HCl buffer (pH 8.0) containing 150 mM NaCl and 5 mM DTT. The sFKBP1C (residues 33–108 of human FKBP12) was expressed and purified essentially as the same as sFKBP1N, except an N-terminal His-SUMO tag was fused instead of the polyhistidine and MBP. The His-SUMO tag was cleaved by SUMO protease overnight at 4 °C. The purified sFKBP1N and sFKBP1C proteins were mixed in a 1:2 molar ratio, and then the mixture was added to a 1 μM rapamycin solution in 20 mM Tris-HCl buffer (pH 8.0) containing 150 mM NaCl, 5 mM DTT and 10% DMSO. The sFKBP1N, sFKBP1c and rapamycin mixture was filtered and loaded onto a Superdex 200 Increase 10/300 GL column (GE Healthcare) equilibrated with 20 mM Tris-HCl buffer (pH 8.0) containing 150 mM NaCl and 5 mM DTT. The eluted peak fractions of sFKBP1·rapamycin complex were pooled and concentrated to 40 mg/ml. For binding analysis, 100 μM MBP-sFKBP1N and 10 μM SUMO-sFKBP1c were mixed in 20 mM Tris-HCl buffer (pH 8.0) containing 150 mM NaCl, 5 mM DTT, and 10% DMSO in the presence or absence of 10 μM rapamycin. The samples were loaded on the Superdex 200 Increase 10/300 GL column, and fractions eluted around 13.8 and 15.4 ml were analyzed by SDS-PAGE. The cDNAs encoding human FKBP12 (residues 1–108) and FKBP12·rapamycin binding (FRB) domain encompassing residues 2021–2113 of human mTOR (T2098L) were subcloned into pET28a(+) containing an N-terminal polyhistidine-GST tag. The FKBP12 and FRB mutant proteins were expressed and purified essentially as the same as sFKBP1N. The His-GST tag was cleaved by TEV protease overnight at 4 °C.
Crystallization, data collection and structure determination
Crystallization was performed by the sitting-drop vapor-diffusion method at 20 °C. Crystals of sFKBP1·rapamycin appeared by mixing equal volumes of a 40 mg/ml sFKBP1·rapamycin complex solution and a reservoir solution of 100 mM Na-HEPES buffer (pH 7.5) containing 20% (w/v) PEG 8000. FKBP12·rapamycin·FRB (T2098L) complex was prepared by mixing them at an equimolar ratio and incubating for 60 min on ice. Crystals of FKBP12·rapamycin·FRB (T2098L) appeared at 100 mM cacodylic acid buffer (pH 6.5) containing 350 mM zinc acetate and 8% (w/v) isopropanol. sFKBP1·rapamycin·FRB (T2098L) complex was prepared in the same manner as FKBP12·rapamycin·FRB (T2098L). Crystals of sFKBP1·rapamycin·FRB (T2098L) appeared at 100 mM Tris-HCl buffer (pH 7.0) containing 200 mM calcium acetate and 20% (w/v) PEG 3000. All crystals were briefly soaked in a cryoprotectant drop composed of the reservoir solution supplemented with 20% glycerol and then flash-cooled in liquid nitrogen for X-ray diffraction data collection. The datasets were collected at 1.000 Å, 100 K on the beamline BL26B2 at SPring-8 (Harima, Japan) or the beamline X06DA at the Swiss Light Source (Villigen, Switzerland). They were processed using the XDS 46 and scaled using AIMLESS supported by other programs of the CCP4 suite 47. Crystal structures were determined by molecular replacement using MOLREP 48 with the FKBP12·rapamycin·FRB structure (PDB ID: 1FAP) and the MBP structure (PDB ID: 1ANF) as the search models. Model building was accomplished with Coot 49, and structural refinement was performed with REFMAC 50 and PHENIX 51. The Ramachandran statistics are as follows: 96.0% favored, 4.0% allowed for sFKBP1·rapamycin; 97.2% favored, 2.8% allowed for FKBP12·rapamycin·FRB (T2098L); and 96.8% favored, 3.2% allowed for sFKBP1·rapamycin·FRB (T2098L). The data collection and refinement statistics are summarized in Supplementary Table 1. The structural models in the figures were depicted using PyMOL version 1.8 software (Schrödinger, LLC). Two-dimensional interaction plots were carried out with LIGPLOT 52.
Extended Data
Extended Data Figure 1: Negative controls for cytosolic FKBP recruitment to ER-PM MCS.
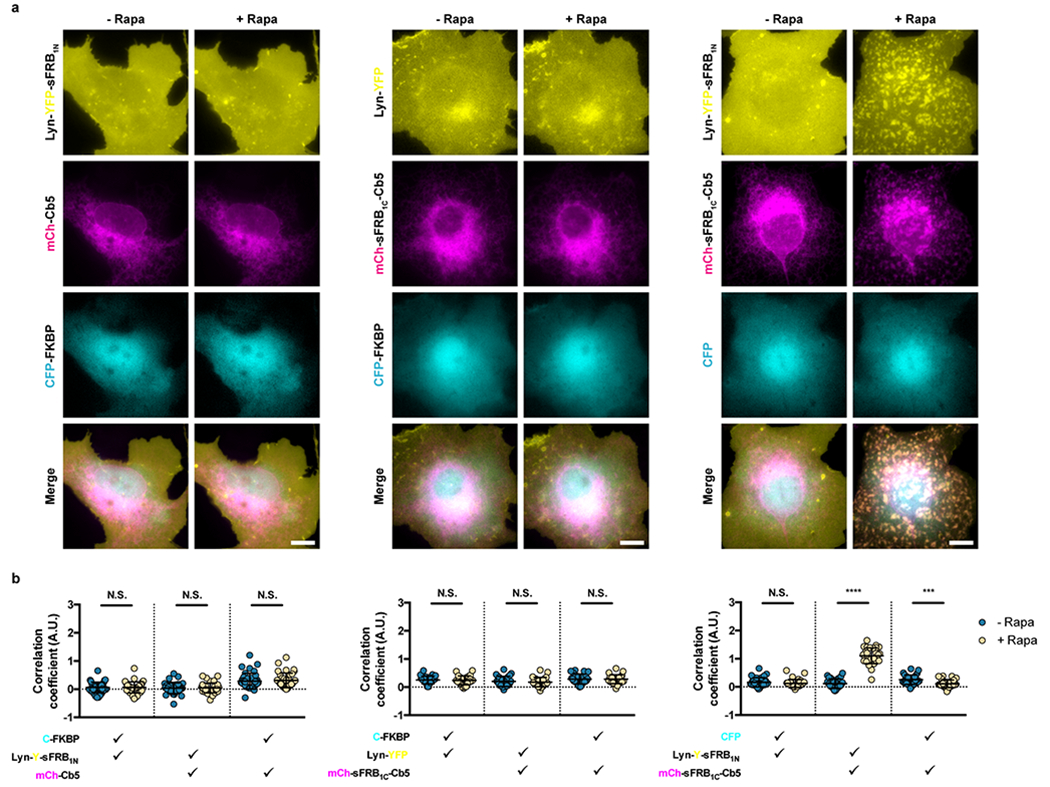
(a) Assessing contributions of each CIT component in CFP-FKBP recruitment to ER-PM MCS; left, middle and center panels correspond to constructs lacking ER, PM, and cytosolic CIT components. (b) Quantifying trimerization between the 3 signals pre- and post- 100 nM rapamycin. Check marks specify each combination of two wavelengths used in calculating pairwise Fisher’s transformation of Pearson’s correlation coefficients. Data are presented as mean values +/− SD. Two-tailed Student’s t-test assuming equal variance was used to compare correlations pre- and post-rapamycin. Fom left to right: n = 38, 27, and 32 cells; 3 independent experiments each. Scalebar, 10 μm. (***/****; p < 0.001/0.0001)
Extended Data Figure 2: sFKBP-based CIT recruitment of cytosolic FRB to ER-PM MCS.
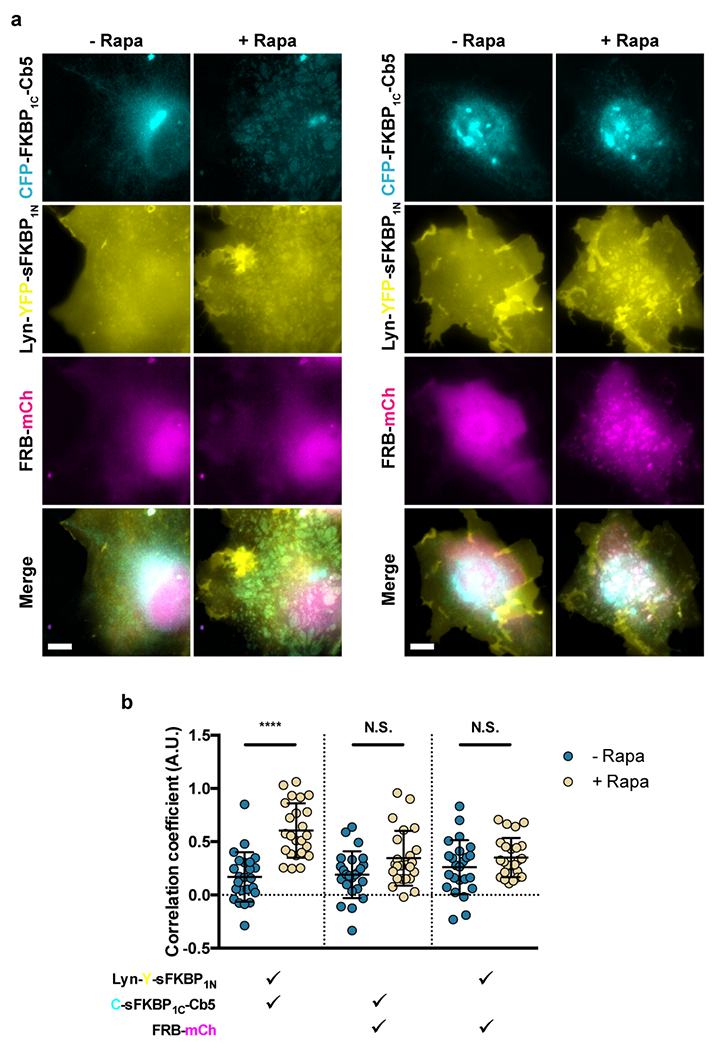
(a, b) Recruitment of mCh-FRB to ER-PM junctions by ER and PM targeted sFKBP1N and sFKBP1C, pre- and 1 h post- 100 nM rapamycin addition. FRB-mCh recruitment can be (a) undetectable or (b) prominent. (c) Quantifying trimerization between the 3 signals pre- and post-rapamycin. Check marks specify each combination of two wavelengths used in calculating pairwise Fisher’s transformation of Pearson’s correlation coefficients. Data are presented as mean values +/− SD. Two-tailed Student’s t-test assuming equal variance was used to compare correlations pre- and post-rapamycin. From left to right: n = 24 cells; 3 independent experiments each. Scalebar, 10 μm. (****; p < 0.0001)
Extended Data Figure 3: Negative controls for cytosolic FKBP recruitment to ER-mitochondria MCS.
(a) Assessing contributions of each CIT component in CFP-FKBP recruitment to ER-mitochondria MCS; left, middle and center panels correspond to constructs lacking ER, mitochondria, and cytosolic CIT components. (b) Quantifying trimerization between the 3 signals pre- and post- 100 nM rapamycin. Check marks specify each combination of two wavelengths used in calculating pairwise Fisher’s transformation of Pearson’s correlation coefficients. Data are presented as mean values +/− SD. Two-tailed Student’s t-test assuming equal variance was used to compare correlations pre- and 12 mins post-rapamycin. From left to right: n = 32, 26, and 24 cells; 3 independent experiments each. Scalebar, 10 μm. (****; p < 0.0001)
Extended Data Figure 4: Negative controls for CIT-induced ER-mitochondria-PM tri-organellar membrane contact sites (MCS).
(a) Assessing contributions of each CIT component in tri-organellar MCS formation; left, middle and center panels correspond to constructs lacking ER, mitochondria, and PM CIT components. (b) Quantifying trimerization between the 3 signals pre- and post- 100 nM rapamycin. Check marks specify each combination of two wavelengths used in calculating pairwise Fisher’s transformation of Pearson’s correlation coefficients. Data are presented as mean values +/− SD. Two-tailed Student’s t-test assuming equal variance was used to compare correlations pre- and 15 mins post-rapamycin. From left to right: n = 24, 32 and 28 cells; 3 independent experiments each. Scalebar, 10 μm. (****; p < 0.0001)
Extended Data Figure 5: PIP2 biosensor intensity at ER-PM junction sites over time.
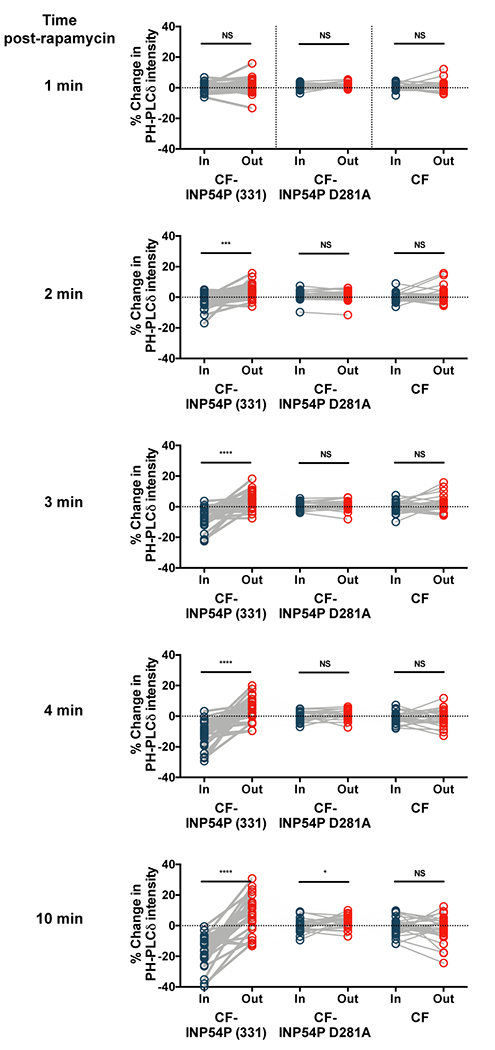
Intensities of mRuby PH-PLCδ PIP2 biosensor of user defined regions of interest inside and outside ER-PM MCS at 1, 2, 3, 4 and 10 min after 100 nM rapamycin. Significance analyzed with two-tailed paired Students t-tests assuming equal variance. From left to right: n = 28, 25 and 23 cells; 4 independent experiments each. (*/***/****; p < 0.05/0.001/0.0001)
Supplementary Material
Acknowledgements
We thank Luca Bertozzi and Sarah Thompson for help with plasmid generation. We thank Robert DeRose, Xinyi Y. Zhou, and Yuta Nihongaki for proofreading the manuscript. We thank Hideaki Niwa (RIKEN), Naoki Sakai (RIKEN), and the staff at the BL26B2 beamline (Proposal No. 20190047) of SPring-8 (Harima, Japan) and the X06DA beamline (Proposal No. 20171001) of the Swiss Light Source, Paul Scherrer Institut (Villigen, Switzerland) for their help in X-ray diffraction data collection. We acknowledge support from the National Institutes for Health (5R01GM123130 to T.I., and 5R01GM123247 and 1R35 GM134864 to N.V.D.), the Passan Foundation to N.V.D., the DoD DARPA (HR0011-16-C-0139 to T.I.), and the PRESTO program of the Japan Science and Technology Agency to T.U. (No. JPMJPR12A3) and T.I (No. JPMJPR12A5), and a Grant-in-Aid for Scientific Research (B) to T.U. (No. 16H05089) from the Japan Society for the Promotion of Science.
Footnotes
Competing Interests
There is an ongoing disclosure associated with the CIT tools.
Data Availability
The data that support the findings of this study are available from the corresponding authors upon reasonable request.
References
- 1.Fegan A, White B, Carlson JC & Wagner CR Chemically controlled protein assembly: techniques and applications. Chem Rev 110, 3315–3336 (2010). [DOI] [PubMed] [Google Scholar]
- 2.DeRose R, Miyamoto T & Inoue T Manipulating signaling at will: chemically-inducible dimerization (CID) techniques resolve problems in cell biology. Pflugers Arch 465, 409–417 (2013). [DOI] [PMC free article] [PubMed] [Google Scholar]
- 3.Spencer DM, Wandless TJ, Schreiber SL & Crabtree GR Controlling signal transduction with synthetic ligands. Science 262, 1019–1024 (1993). [DOI] [PubMed] [Google Scholar]
- 4.Komatsu T et al. Organelle-specific, rapid induction of molecular activities and membrane tethering. Nat Methods 7, 206–208 (2010). [DOI] [PMC free article] [PubMed] [Google Scholar]
- 5.Haruki H, Nishikawa J & Laemmli UK The anchor-away technique: rapid, conditional establishment of yeast mutant phenotypes. Mol Cell 31, 925–932 (2008). [DOI] [PubMed] [Google Scholar]
- 6.Putyrski M & Schultz C Protein translocation as a tool: The current rapamycin story. FEBS Lett 586, 2097–2105 (2012). [DOI] [PubMed] [Google Scholar]
- 7.Miyamoto T et al. Rapid and orthogonal logic gating with a gibberellin-induced dimerization system. Nat Chem Biol 8, 465–470 (2012). [DOI] [PMC free article] [PubMed] [Google Scholar]
- 8.Stanton BZ, Chory EJ & Crabtree GR Chemically induced proximity in biology and medicine. Science 359 (2018). [DOI] [PMC free article] [PubMed] [Google Scholar]
- 9.Ma D, Peng S & Xie Z Integration and exchange of split dCas9 domains for transcriptional controls in mammalian cells. Nat Commun 7, 13056 (2016). [DOI] [PMC free article] [PubMed] [Google Scholar]
- 10.Lambright DG et al. The 2.0 A crystal structure of a heterotrimeric G protein. Nature 379, 311–319 (1996). [DOI] [PubMed] [Google Scholar]
- 11.Higashi T & Miller AL Tricellular junctions: how to build junctions at the TRICkiest points of epithelial cells. Mol Biol Cell 28, 2023–2034 (2017). [DOI] [PMC free article] [PubMed] [Google Scholar]
- 12.Hennecke J & Wiley DC T cell receptor-MHC interactions up close. Cell 104, 1–4 (2001). [DOI] [PubMed] [Google Scholar]
- 13.Banaszynski LA, Liu CW & Wandless TJ Characterization of the FKBP.rapamycin.FRB ternary complex. J Am Chem Soc 127, 4715–4721 (2005). [DOI] [PubMed] [Google Scholar]
- 14.Choi J, Chen J, Schreiber SL & Clardy J Structure of the FKBP12-rapamycin complex interacting with the binding domain of human FRAP. Science 273, 239–242 (1996). [DOI] [PubMed] [Google Scholar]
- 15.Stankunas K et al. Rescue of degradation-prone mutants of the FK506-rapamycin binding (FRB) protein with chemical ligands. Chembiochem 8, 1162–1169 (2007). [DOI] [PubMed] [Google Scholar]
- 16.Liberles SD, Diver ST, Austin DJ & Schreiber SL Inducible gene expression and protein translocation using nontoxic ligands identified by a mammalian three-hybrid screen. Proc Natl Acad Sci U S A 94, 7825–7830 (1997). [DOI] [PMC free article] [PubMed] [Google Scholar]
- 17.Bayle JH et al. Rapamycin analogs with differential binding specificity permit orthogonal control of protein activity. Chem Biol 13, 99–107 (2006). [DOI] [PubMed] [Google Scholar]
- 18.Dagliyan O et al. Computational design of chemogenetic and optogenetic split proteins. Nat Commun 9, 4042 (2018). [DOI] [PMC free article] [PubMed] [Google Scholar]
- 19.Dagliyan O et al. Engineering extrinsic disorder to control protein activity in living cells. Science 354, 1441–1444 (2016). [DOI] [PMC free article] [PubMed] [Google Scholar]
- 20.Dagliyan O, Dokholyan NV & Hahn KM Engineering proteins for allosteric control by light or ligands. Nat Protoc 14, 1863–1883 (2019). [DOI] [PMC free article] [PubMed] [Google Scholar]
- 21.Belshaw PJ, Schoepfer JG, Liu KQ, Morrison KL & Schreiber SL Rational Design of Orthogonal Receptor-Ligand Combinations. Angewandte Chemie-International Edition in English 34, 2129–2132 (1995). [Google Scholar]
- 22.Varnai P, Toth B, Toth DJ, Hunyady L & Balla T Visualization and manipulation of plasma membrane-endoplasmic reticulum contact sites indicates the presence of additional molecular components within the STIM1-Orai1 Complex. J Biol Chem 282, 29678–29690 (2007). [DOI] [PubMed] [Google Scholar]
- 23.Dickson EJ et al. Dynamic formation of ER-PM junctions presents a lipid phosphatase to regulate phosphoinositides. J Cell Biol 213, 33–48 (2016). [DOI] [PMC free article] [PubMed] [Google Scholar]
- 24.Phillips MJ & Voeltz GK Structure and function of ER membrane contact sites with other organelles. Nat Rev Mol Cell Biol 17, 69–82 (2016). [DOI] [PMC free article] [PubMed] [Google Scholar]
- 25.Valm AM et al. Applying systems-level spectral imaging and analysis to reveal the organelle interactome. Nature 546, 162–167 (2017). [DOI] [PMC free article] [PubMed] [Google Scholar]
- 26.Prinz WA Bridging the gap: membrane contact sites in signaling, metabolism, and organelle dynamics. J Cell Biol 205, 759–769 (2014). [DOI] [PMC free article] [PubMed] [Google Scholar]
- 27.Luik RM, Wang B, Prakriya M, Wu MM & Lewis RS Oligomerization of STIM1 couples ER calcium depletion to CRAC channel activation. Nature 454, 538–542 (2008). [DOI] [PMC free article] [PubMed] [Google Scholar]
- 28.Liou J et al. STIM is a Ca2+ sensor essential for Ca2+-store-depletion-triggered Ca2+ influx. Curr Biol 15, 1235–1241 (2005). [DOI] [PMC free article] [PubMed] [Google Scholar]
- 29.Rizzuto R et al. Close contacts with the endoplasmic reticulum as determinants of mitochondrial Ca2+ responses. Science 280, 1763–1766 (1998). [DOI] [PubMed] [Google Scholar]
- 30.Levine T & Loewen C Inter-organelle membrane contact sites: through a glass, darkly. Curr Opin Cell Biol 18, 371–378 (2006). [DOI] [PubMed] [Google Scholar]
- 31.Friedman JR et al. ER tubules mark sites of mitochondrial division. Science 334, 358–362 (2011). [DOI] [PMC free article] [PubMed] [Google Scholar]
- 32.Rowland AA, Chitwood PJ, Phillips MJ & Voeltz GK ER contact sites define the position and timing of endosome fission. Cell 159, 1027–1041 (2014). [DOI] [PMC free article] [PubMed] [Google Scholar]
- 33.Helle SC et al. Organization and function of membrane contact sites. Biochim Biophys Acta 1833, 2526–2541 (2013). [DOI] [PubMed] [Google Scholar]
- 34.Zewe JP, Wills RC, Sangappa S, Goulden BD & Hammond GR SAC1 degrades its lipid substrate PtdIns4P in the endoplasmic reticulum to maintain a steep chemical gradient with donor membranes. Elife 7 (2018). [DOI] [PMC free article] [PubMed] [Google Scholar]
- 35.Hamasaki M et al. Autophagosomes form at ER–mitochondria contact sites. Nature 495, 389–393 (2013). [DOI] [PubMed] [Google Scholar]
- 36.Saheki Y & De Camilli P Endoplasmic Reticulum-Plasma Membrane Contact Sites. Annu Rev Biochem 86, 659–684 (2017). [DOI] [PubMed] [Google Scholar]
- 37.Chang CL & Liou J Phosphatidylinositol 4,5-Bisphosphate Homeostasis Regulated by Nir2 and Nir3 Proteins at Endoplasmic Reticulum-Plasma Membrane Junctions. J Biol Chem 290, 14289–14301 (2015). [DOI] [PMC free article] [PubMed] [Google Scholar]
- 38.Idevall-Hagren O, Dickson EJ, Hille B, Toomre DK & De Camilli P Optogenetic control of phosphoinositide metabolism. Proc Natl Acad Sci U S A 109, E2316–2323 (2012). [DOI] [PMC free article] [PubMed] [Google Scholar]
- 39.Karginov AV, Ding F, Kota P, Dokholyan NV & Hahn KM Engineered allosteric activation of kinases in living cells. Nat Biotechnol 28, 743–747 (2010). [DOI] [PMC free article] [PubMed] [Google Scholar]
- 40.Suh BC, Inoue T, Meyer T & Hille B Rapid chemically induced changes of PtdIns(4,5)P2 gate KCNQ ion channels. Science 314, 1454–1457 (2006). [DOI] [PMC free article] [PubMed] [Google Scholar]
- 41.Heinig M & Frishman D STRIDE: a web server for secondary structure assignment from known atomic coordinates of proteins. Nucleic Acids Research 32, W500–W502 (2004). [DOI] [PMC free article] [PubMed] [Google Scholar]
- 42.Colell EA, Iserte JA, Simonetti FL & Marino-Buslje C MISTIC2: comprehensive server to study coevolution in protein families. Nucleic Acids Research 46, W323–W328 (2018). [DOI] [PMC free article] [PubMed] [Google Scholar]
- 43.Finn RD et al. Pfam: the protein families database. Nucleic Acids Research 42, D222–D230 (2014). [DOI] [PMC free article] [PubMed] [Google Scholar]
- 44.Yin SY, Ding F & Dokholyan NV Eris: an automated estimator of protein stability. Nature Methods 4, 466–467 (2007). [DOI] [PubMed] [Google Scholar]
- 45.Dagliyan O et al. Computational design of chemogenetic and optogenetic split proteins. Nature Communications 9 (2018). [DOI] [PMC free article] [PubMed] [Google Scholar]
- 46.Kabsch W Automatic Processing of Rotation Diffraction Data from Crystals of Initially Unknown Symmetry and Cell Constants. J Appl Crystallogr 26, 795–800 (1993). [Google Scholar]
- 47.Winn MD et al. Overview of the CCP4 suite and current developments. Acta Crystallogr D 67, 235–242 (2011). [DOI] [PMC free article] [PubMed] [Google Scholar]
- 48.Vagin A & Teplyakov A Molecular replacement with MOLREP. Acta Crystallographica Section D-Biological Crystallography 66, 22–25 (2010). [DOI] [PubMed] [Google Scholar]
- 49.Emsley P, Lohkamp B, Scott WG & Cowtan K Features and development of Coot. Acta Crystallographica Section D-Biological Crystallography 66, 486–501 (2010). [DOI] [PMC free article] [PubMed] [Google Scholar]
- 50.Murshudov GN, Vagin AA & Dodson EJ Refinement of macromolecular structures by the maximum-likelihood method. Acta Crystallogr D 53, 240–255 (1997). [DOI] [PubMed] [Google Scholar]
- 51.Adams PD et al. PHENIX: a comprehensive Python-based system for macromolecular structure solution. Acta Crystallogr D 66, 213–221 (2010). [DOI] [PMC free article] [PubMed] [Google Scholar]
- 52.Laskowski RA & Swindells MB LigPlot+: multiple ligand-protein interaction diagrams for drug discovery. J Chem Inf Model 51, 2778–2786 (2011). [DOI] [PubMed] [Google Scholar]
Associated Data
This section collects any data citations, data availability statements, or supplementary materials included in this article.
Supplementary Materials
Data Availability Statement
The data that support the findings of this study are available from the corresponding authors upon reasonable request.