

Abstract

Pre-equilibrium reaction kinetics enable the overall rate of a catalytic reaction to be orders of magnitude faster than the rate-determining step. Herein, we demonstrate how pre-equilibrium kinetics can be applied to breaking the linear free-energy relationship (LFER) for electrocatalysis, leading to rate enhancement 5 orders of magnitude and lowering of overpotential to approximately thermoneutral. This approach is applied to pre-equilibrium formation of a metal-hydride intermediate to achieve fast formate formation rates from CO2 reduction without loss of selectivity (i.e., H2 evolution). Fast pre-equilibrium metal-hydride formation, at 108 M–1 s–1, boosts the CO2 electroreduction to formate rate up to 296 s–1. Compared with molecular catalysts that have similar overpotential, this rate is enhanced by 5 orders of magnitude. As an alternative comparison, overpotential is lowered by ∼50 mV compared to catalysts with a similar rate. The principles elucidated here to obtain pre-equilibrium reaction kinetics via catalyst design are general. Design and development that builds on these principles should be possible in both molecular homogeneous and heterogeneous electrocatalysis.
Introduction
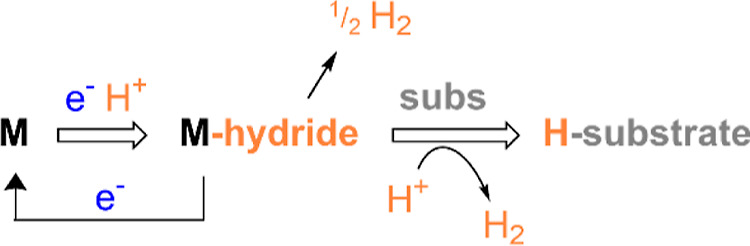
Metal-hydrides are key intermediates in a broad scope of chemistries including solar fuels and organic transformations for commodity and fine chemical synthesis. However, electrocatalytic approaches involving metal-hydride intermediates are universally plagued by a competition between desired product formation (hydride transfer to substrate), and competitive reaction of the hydride intermediate with the protons that are needed in solution to generate the hydride intermediate [via electron-transfer (ET) and proton-transfer (PT) steps, Scheme 1].
Scheme 1. Three Common Pathways for the Metal–Hydride Reaction.
An example situation where these competing reactions have been studied is in C–H bond formation with CO2 and the interest in that chemistry derives from its potential applications in solar fuel chemistry.1−8 Desired products include formate, methanol, ethanol, or ethylene which all contain C–H bonds; but H2 formation is an ongoing challenge. Contributions from a number of research groups have demonstrated that we can use catalyst design for thermochemical control of reaction chemistry to achieve selectivity for C–H bond formation over H2 evolution.9−16 However, that approach does not necessarily produce fast rates for C–H bond formation with CO2.17 Approaches to enhancing the reaction rate for C–H bond formation with CO2 are needed, and have primarily used reaction conditions, rather than catalyst design to achieve improvements: successful examples of this approach include stabilization of transition states for hydride transfer to CO2 by choice of the solvent,18−25 use of hydride-transfer mediators,26 or additions of base or alcohol.27,28
We have previously demonstrated that the large metal carbonyl clusters promote hydride formation with rate 108 M–1 s–1.29−31 We believe that this fast rate has two possible origins. The multiple metal–metal bonds in the clusters serve as multiple sites for protonation, and this should provide a kinetic boost to the rate of cluster-hydride formation.30,31 In addition, the high anionic charges, 3– or 4–, on the clusters promote PT: while the delocalized structures of the clusters enable access to modest reduction potentials relative to single-metal site electrocatalysts, at a given formal oxidation state or overall charge.32
A remaining challenge is to design a complete catalytic cycle competent for solar fuel chemistry or chemical synthesis which has fast hydride formation without H2 production. Pre-equilibrium kinetic schemes have been reported as a tool for optimizing rates in O2 reduction,33 in hydride formation chemistries,34 and in CO2 reduction to CO.35 Pre-equilibrium dynamics of intermediate formation in a catalytic cycle often impact a subsequent rate. As an example, PT transfer rates to two-electron reduced [CoCp(dxpe)(NCCH3)]2+ complexes [Cp = cyclopentadienyl, dxpe = 1,2-bis(di(aryl/alkyl)phosphino)ethane] can be controlled by the equilibrium constant for dissociation of MeCN from Co prior to PT,34 and pre-equilibrium kinetics of CO2 binding to iron(0) porphyrin enhance the observed apparent rate constant for CO formation, under reaction conditions where the thermodynamics for C–O bond-breaking are favorable.35 Fast H2 evolution by iron porphyrin also proceeds with a pre-equilibrium kinetic scheme involving fast Fe-hydride formation.36,37
When conceiving of the work reported herein, we reasoned that fast formation of (H-1)3– at significant concentrations will boost the formate formation rate by orders of magnitude if (H-1)3– is formed with very fast rate to enable a pre-equilibrium reaction mechanism. According to the pre-equilibrium approximation, which can be used in the case of a fast initial chemical step in a catalytic cycle, the observed rate of a possible formate formation reaction should scale with the equilibrium constant (K1) for pre-equilibrium hydride formation (Scheme 2), according to eq 1
| 1 |
where kobs (s–1) is the observed rate of reaction, K1 is the equilibrium constant for formation of (H-1)3–, k2 (M–1 s–1) is the rate for hydride transfer to CO2, and [CO2] (M) is the concentration of CO2. We further noted during this experimental design that the fast pre-equilibrium chemical step should offer a kinetically derived lowering of the overpotential for the reaction because a fast chemical step following ET results in the anodic shift of the reduction peak potential of any electrocatalyst.
Scheme 2. Proposed CO2 Reduction Mechanism by 13–

Herein, we demonstrate that formate is generated at an overpotential of 10 mV and with the rate of 1.2 × 10³ M–1 s–1 using 13– in 0.1 M Bu4NBF4 MeCN/H2O (95:5) (Calculation S1). We can also use stronger acids than water to enhance K1, and with anisidinium tetrafluoro borate, it is generated at an overpotential of 64 mV with the rate of 5.07 × 10² M–1 s–1. The well-understood mechanistic origin of this result from the pre-equilibrium mechanism provides a roadmap for future catalyst design. In principle, any electrocatalytic reaction can be designed with a view to achieving pre-equilibrium intermediate formation to overcome slow rates that might be associated with thermochemically controlled rates for selectivity in subsequent chemical steps using heterogeneous or homogeneous electrocatalysis.
Results and Discussion
To study catalysis by 13–, we prepared samples of (PhCH2NMe3)2[Co11C2(CO)23] (12–) following a previously published method (PhCH2NMe3+ = benzyl ammonium cation).38 The CV of 0.05 mM 12– recorded in 0.1 M Bu4NBF4 MeCN solution under 1 atm N2 shows three reversible redox couples with E1/2 = −0.2, −0.57, and −0.95 V versus SCE which were assigned as the 11–/2–, 12–/3–, and 13–/4– couples, respectively (Figure S1).31,38 For experiments probing the catalytic activity of 13–, this species is generated in the CV measurement in all discussions below starting from 12–. When solutions of 0.05 mM 12– in 0.1 M Bu4NBF4 MeCN were titrated with water, the current density, jp, at −1.054 V increased linearly up to 4% (2.2 M) H2O after which the changes in jp were very small (Figure 1 left). This increase in jp suggests that a catalytic reaction is occurring. CV of 0.05 mM 12– collected under 1 atm CO2 in 0.1 M Bu4NBF4 MeCN/H2O (95:5) showed a further increase in jp at −1.054 V, relative to the CV collected under 1 atm N2, and this suggests that a catalytic reaction has occurred where hydride is transferred to CO2 to afford formate (Figure 1 left). Current enhancements consistent with catalytic formate formation were also observed using anisidinium tetrafluoroborate (AnsdH+) as the source of H+ (Figure 1 right).
Figure 1.

CV of 0.05 mM 12– in 0.1 M Bu4NBF4 MeCN solution (black): (left) in 0.1 M Bu4NBF4 MeCN/H2O (95:5) under 1 atm N2 (red); in 0.1 M Bu4NBF4 MeCN/H2O (95:5) under 1 atm CO2 (blue). (right) with 5.1 mM AnsdH+ under 1 atm N2 (red) and with 0.25 mM AnsdH+ under 1 atm CO2 (blue). Inset: Plot of j versus [H2O] under 1 atm CO2.
The most acidic proton source in solutions of CO2-saturated 0.1 M Bu4NBF4 MeCN/H2O (95:5) is carbonic acid produced from 0.24 M CO2 in MeCN/H2O and that has pKa = 17.03.39,40 The pKa of AnsdH+ in MeCN is 11.86.41 The waveforms obtained with MeCN/H2O (95:5) or with AnsdH+ are different. Catalysis with water is observed at similar potential as the reduction potential for 13–/4–, whereas catalysis using AnsdH+ as the proton source is observed at a potential more anodic than the reduction of 13–. A possible mechanistic origin of these waveforms is discussed later, along with the determination of kobs.
Characterization of Formate
Controlled potential electrolysis (CPE) experiments carried out under both 1 atm N2 and 1 atm CO2 were performed to identify the product in the CV experiments. CPE experiments −1.13 V over 40 min were followed by analysis of the head space using gas chromatography with thermal conductivity detector (GC-TCD) and analysis of the solution using proton NMR spectroscopy. Using 5% H2O as the proton source in MeCN solutions, we determined that the Faradaic efficiency (FE) for formate and H2 production are 75(5) and 15(2) %, respectively (Table S1, Figures S2–S4, see the Supporting Information for experimental details). CPE experiments performed using AnsdH+ as the source of protons under 1 atm CO2 were run at −0.9 V, and those yielded formate and H2 with FE of 70(8) and 25(3)%, respectively (Table S1, Figures S2 and S3). No CO2-reduced products were detected by proton NMR when the CPE experiments were carried out under 1 atm N2 or in the absence of 12– under 1 atm CO2. To confirm the carbon source, isotopically labelled 13CO2 was used for CPE experiments, and the 13C{1H} NMR spectrum collected of the CPE solution showed a peak at 172.9 ppm which conclusively indicates that formate was produced from CO2 during electrocatalysis (Figure S3D). CPE experiments run with the used electrodes from CPE experiments containing 12–, and those also produced no carbon-containing products. SEM–EDX measurements performed on used electrodes revealed no deposited Co on the glassy carbon (Figure S5).
Mechanistic Studies of Hydride Formation
Our first step toward understanding the mechanism for formate formation by 13– was to measure the rate for catalyst-hydride, (H-1)3–, formation (k1, Scheme 2) in MeCN/H2O (95:5) under both N2 and CO2 atmospheres, where clusters of H2O–MeCN (under N2 and CO2) and/or carbonic acid (under CO2), respectively, are the proton sources for (H-1)3– formation. Use of low [H+] in CV experiments accesses a kinetic region where the (H-1)3– formation rate is measured based on the shift in peak potential: with low [H+], the follow-up chemical steps in the catalytic cycle are suppressed, and a small return wave is observed in the CV at ∼−0.72 V (Figure 2).
Figure 2.

CVs of 0.1 mM 12– in 0.1 M Bu4NBF4 MeCN/H2O (99.3:0.7). (left) Under 1 atm N2 at variable scan rates (starting from bright green 0.2, 0.3, 0.4, 0.5, 0.6, 0.7, 0.8, 0.9, 1.2, 1.4, and 1.6 V s–1); CV in black is for 12– without added H2O. (right) Under 1 atm CO2 at variable scan rates (starting from red trace 0.8, 1.2, 1.6, 2, 3, 4, 5, and 6 V s–1). Insets: plots of (Ep – E1/2) (F/RT) vs ln(υ). The red line is a linear fit with slope fixed at −0.5.
Accordingly, we collected CVs of 0.1 mM 12– with 0.7% (0.38 mM) H2O in 0.1 M Bu4NBF4 MeCN under N2 and under CO2 at 100 mV/s (Figure 2). Under N2, the reductive peak potential Ep,c shifted from E1/2 anodically by 100 mV relative to CVs lacking H2O, which suggests a fast rate for PT following the ET. The 13–/4– redox couple is also observed at a consistent potential in these CVs, which suggests that some of the 12– is regenerated from (H-1)3– in a reaction with protons during the CV experiment, and some of the (H-1)3– remains and is oxidized at −0.72 V on the return scan.
For a chemical reaction that proceeds ET, the peak potentials (Ep) shift anodically relative to the formal potential of 13–/4– (E1/2). The kinetic information is contained in the “peak shift”, ΔEp (where ΔEp = Ep – E1/2) according to 2(42,43)
| 2 |
where R is ideal gas constant (8.314 J mol–1K–1), T is temperature (K), F is Faraday’s constant (C mol–1), k1 is the second-order rate constant of the PT reaction (s–1), and other symbols were defined earlier. Due to the fast catalysis following the formation of (H-1)3– (vide infra), eq 2 is potentially a little inaccurate in this situation, and therefore, we also determined a value for k1 using a foot-of-the wave analysis (FOWA),44,45 so that the two measurements can be compared.
Experimentally, k1 can be obtained by recording Ep – E1/2 as a function of υ, and we performed this experiment with a ratio of [H+]/[12–] = 3800, where Ep – E1/2 is already ∼150 mV due to the fast PT step. A plot of (Ep – E1/2)F/RT vs ln(υ) according to eq 2 gave k1 = 3.9 × 10⁵ M–1 s–1 under 1 atm N2 (Table 1, Figure 2 left, Calculation S2). The same experiment was repeated under 1 atm CO2, and a higher rate of 1.2 × 10⁷ M–1 s–1 was observed for k1 (Table 1, Figure 2 right, Calculation S2). This higher rate for k1 is consistent with carbonic acid as the proton source, which has lower pKa than H2O as the proton source in MeCN. The value of k1 measured using AnsdH+ as the proton source was the same (within error) under 1 atm of N2 or CO2 and is 3 × 10⁸ M–1 s–1 (Table 1, Figures 2, S6, Calculation S2). FOWA of CV traces collected under catalytic conditions yielded values for k1 that are in good agreement with the peak-shift analysis (Calculation S2, Table 1, Figure S7).
Table 1. Thermodynamic and Kinetic Data for (H-1)3– Formation by 13–a.
| [H+]/mM | pKa | Epc/V | Epc/2/V | k1b/M–1 s–1 |
|---|---|---|---|---|
| H2O, N2 (380) | –0.85 | 0.80 | 3.9 × 10⁵(1.9 × 10⁵)c | |
| H2O, CO2 (380) | 17.03 | –0.83 | –0.78 | 1.2 × 10⁷(1 × 10⁷)c |
| AnsdH+, N2 (0.15) | 11.8 | –0.81 | –0.76 | 3 × 10⁸d,e |
| AnsdH+, CO2 (0.25) | 11.8 | –0.81 | –0.76 | 4.6 × 10⁸e |
Measured in 0.1 mM Bu4NBF4 MeCN with H2O or AnsdH+ under 1 atm CO2 or N2.
k1 calculated using peak shift analysis (Calculation S2).
Calculated using FOWA analysis (Calculation S2).
Value from ref (31).
Overlap of peak with 12–/3– couple precluded FOWA.
Catalytic Formate Formation Rate and Mechanism
Our next effort toward understanding the effects of pre-equilibrium kinetics on formate production by 12– was to characterize the chemistry under reaction conditions that promote turnover in the catalytic cycle. CV experiments were performed with varied [12–] in 0.1 M Bu4NBF4 MeCN under CO2, and the acid source was either 5% (2.77 M) H2O or 2 mM AnsdH+ (Figure 3). In each case, a linear correlation between jc versus [12–] was observed, and this indicates that formate production is of first order in [12–]. Similarly, the reaction is of first order with respect to [H+] under 1 atm CO2 when either H2O or AnsdH+ is the source of H+ (Figure S8).
Figure 3.

CVs of 12– with (0.05, 0.06, 0.77, 0.09, 0.11-, and 0.12 mM H+, colors) in 0.1 M Bu4NBF4 MeCN under CO2, at 100 mV/s and using the GC electrode. (left) with 5% H2O as the source of H+. Inset: plot of jc versus [12–], at −1.054 V. (right) with 2 mM AnsdH+ as the source of H+. Inset: plot of jc vs [12–], at −0.82 V. Red lines are linear fit to the data, and black CV trace has no added H+.
The rate of formate formation by 12– (kobs, s–1) can be obtained using a fast scan CV measurement of the limiting current (ilim).46,47 The experiment is performed with excess substrate relative to the catalyst to achieve ilim, which is independent of the scan rate due to mutual compensation of substrate depletion during catalysis and diffusion. These reaction conditions also lead to the form of eq 1, where neither [13–] or [H+] influences kobs. Analysis of ilim to measure the rate of formate formation under 1 atm CO2 was performed using the same two sources of protons as mentioned above: CO2-saturated H2O and AnsdH+, in 0.1 M Bu4NBF4 MeCN solution (Calculation S4, Figure 4). In addition, the kobs values obtained were corrected for the measured FE which are 75 and 70% for formate under 1 atm CO2, in MeCN/H2O (95:5) and MeCN with added AnsdH+, respectively. Therefore, the values for kobs are 296 and 142 s–1, respectively, in MeCN/H2O (95:5) and MeCN with added AnsdH+, under 1 atm CO2 (Table 1).
Figure 4.

Forward CV traces of (top left) 0.06 mM 12– in 0.1 M Bu4NBF4 MeCN/H2O (95:5) under 1 atm CO2 at the scan rate = 0.1, 0.2, 0.4, 0.6, 0.9, 1.2, 1.5, 2, 3, 4, 6, 8, 12, 14, 18, 21, and 22 V/s; and (bottom left) 3.5 mM AnsdH+ and 0.2 mM 12– in 0.1 M Bu4NBF4 MeCN under CO2 at various scan rates: 0.3, 0.5. 0.7, 0.8, 1.2, 1.8, 2.5, 3, 4, 5, 5.5, 6, 7, and 8 V/s. (Right) Plots of jmax vs υ at potentials negative to −1.08 V (top) and −0.82 (bottom), after subtraction of the background current value.
A comparison of the data collected with low [H+] (Figure 2) and with high [H+] for catalytic conditions (Figure 4) provides some information about the mechanism for formate formation with either H2O or AnsdH+ and how those mechanisms may differ slightly as a function of the proton source. As described earlier, under reaction conditions with low [H+], there is an anodic shift in Ep,c(13–/4–) due to the folfast PT reaction which affords (H-1)3– from 14–. The anodic shift in Ep,c(13–/4–) from E1/2 is 140 and 100 mV with H2O or AnsdH+, respectively, under 1 atm CO2 (Table 1). As the [H+] increases, the catalytic current response with H2O gradually shifts cathodically, whereas the response under AnsdH+ remains at Ecat/2 = −0.78 V (Table 2). Both of these behaviors are common in molecular electrocatalysis and indicate nuances in the reaction mechanism. With AnsdH+, the constant value of Ecat/2 over a wide range for [H+] simply suggests that the mechanism for formate formation (or background H2 evolution) is unchanged even as the concentration of (H-1)3– available in solution increases with increased [H+] (Scheme 2). When H2O/carbonic acid is the proton source, then at higher [H+], Ecat/2 for 12– shifts cathodically so that Ecat/2 ∼ E1/2 at [H+]max. Water (or carbonic acid) is a weaker acid than AnsdH+ by 5 pKa units. The cathodic shift in Ecat/2 with increased [H+] may therefore arise from a competing bimolecular evolution of H2 as has been described in prior reports by us31 and by others (Scheme 1).48 It is also possible that more negative potentials are needed to drive hydride transfer from (H-1)3– to CO2 under the solution conditions containing 5% H2O; perhaps due to lower solubility of CO2, CO2 equilibria with H2CO3 and HCO3–, or relative solvation of the substrate in solution.
Table 2. Thermodynamic and Kinetic Data for Formate Formation by 13–a.
| [H+]/mM | Ecat/2/V | K1b | kobsc/s–1 | kcatc/M–1 s–1 |
|---|---|---|---|---|
| H2O, CO2 (2800) | –1.01 | 15.8 | 296 | 1.2 × 10³ |
| AnsdH+, CO2 (3.8) | –0.78 | 5.5 × 10¹² | 142 | 5.1 × 10² |
Measured in 0.1 mM Bu4NBF4 MeCN with excess H2O (carbonic acid) or AnsdH+, under 1 atm CO2. E1/2 (13–/4–) = −0.95 V versus SCE.
See Calculation S3 for K1.
kobs obtained from the fast scan method (Calculation S4); values are corrected for the FE of formate (Table S1).
Pre-equilibrium Effects on Catalysis
The formate formation rate catalyzed by 12– (kobs) is orders of magnitude slower than the rate for formation of the intermediate (H-1)3– (k1) (vide supra). Therefore, the formation of (H-1)3– can be considered as a pre-equilibrium step with both a forward and reverse rate constant, k1 and k–1, and an equilibrium constant, K1 = k1/k–1 (Scheme 2). A key feature of the pre-equilibrium mechanism is that kobs is enhanced linearly according to the magnitude of K1: that is a “normal” mechanism would have kobs = k2[CO2], but the pre-equilibrium mechanism has kobs = K1k2[CO2] (eq 1, and the terms and units were defined earlier).
Even at very low ratios of [H+]/[12–] under 1 atm CO2, the 13–/4– redox couple is irreversible, and therefore, we cannot determine K1 using an electrochemical measurement (Figure 3 right).49 However, we can estimate a value for K1 if we know the pKa value for (H-1)3– and the pKa values for the proton sources used for catalysis, which are CO2 saturated H2O and AnsdH+. We determined the pKa value for (H-1)3– as 24.6 using infra-red spectroelectrochemical titrations of 14– with acid sources (Calculation S5, Figure S9). We then used thermochemical cycles to determine the values for K1 from the pKa values of (H-1)3–, CO2 saturated water, and AnsdH+ (Calculation S3). The values of K1 were determined as 15.8 and 5.5 × 10¹², when CO2 saturated water or AnsdH+ are used as the proton source, respectively.50−52 Using the experimentally determined value for k1, this calculation further provides an estimate of k–1 as 1.2 × 10⁴ and 5.4 × 10⁻⁵ M–1 s–1, when CO2 saturated water or AnsdH+ are used as the proton source, respectively, since K1 = k1/k–1. According to these estimates, K1 > 1, and we should expect that the pre-equilibrium formation of (H-1)3– enhances kobs relative to k2 (eq 1, Scheme 2).
Catalyst Benchmarking
As mentioned in the introduction, we predicted that two features of the catalyst performance (rate and overpotential) will be enhanced by the pre-equilibrium reaction kinetics, relative to reports of formate formation by other molecular catalysts. These two effects are nicely illustrated using a Tafel style plot where the TOF (which is equivalent to kobs above) is plotted as log10(TOF/s–1) versus overpotential (V). On this plot, formate formation by 13– is illustrated using both AnsdH+ and H2O as the source of protons (Figure 5). Overpotential is defined as
| 3 |
where η is overpotential (mV), ECO2 is the thermodynamic potential for reduction of CO2 into formate under standard conditions (mV), and Ecat/2 is the potential at which the catalytic current density reaches half of its maximum current (icat/2 and see Calculation S1).53
Figure 5.

Tafel-style plot: Log10[(TOF/s–1) (EF)2] vs overpotential (η) at Ecat/2, for selected molecular CO2 to HCO2– reduction catalysts. Details of calculations and parameters used to construct the plot are shown in Table S2 and references therein. η = ECO2/HCOO– – Ecat/2.
Kinetic enhancements to k1 result in a low overpotential for the catalytic reaction at 64 mV using 13– in MeCN/AnsdH+. Specifically, E1/2 for 13– is −0.95 V, but Ecat/2 is −0.78 V, and the 170 mV anodic shift in Ecat/2 has a kinetic origin in the extremely fast PT rate and formation of (H-1)3–, at 3 × 10⁸ M–1 s–1. Another example of a very fast formate forming catalyst is [(bipy)Co(PyS)2]+ which has TOF similar to 13– while the overpotential remains pinned to the value of E1/2 so that the overpotential for formate formation is 110 mV.54
A plot of Log10(TOF/s–1) versus Ecat/2 for molecular catalysis of CO2 to formate shows a linear correlation (Figure 6). Absent kinetic effects, a linear free-energy relationship (LFER) should exist between Log(TOF/s–1) and hydricity (free energy for loss of hydride, ΔGH–) over a series of catalysts.55 It is also known that ΔGH– scales roughly with Ecat/2 and pKa of the catalytic hydride intermediate over a series of catalysts having similar mechanism, and this relationship underlies a rough correlation between Log10(TOF/s–1) and Ecat/2. Given that the structure of 13– is different than the structure of the single-site metal catalysts that comprise most of the catalysts in Figures 5 and 6, it is possible that 13– does not fall on the ΔGH– versus Ecat/2 correlation line for those compounds. Therefore, we include a brief discussion using ΔGH– as a benchmark against related catalysts to complement the observations in Figure 6.
Figure 6.

LFER between Log(TOF/s–1) and Ecat/2 for selected molecular electrocatalysts {12–, [Fe4N(CO)12]1–,20,25 [Fe4N(CO)11(PPh3)]−,56 [FeN5Cl2]+,57 [FeP4N2]2+,58 [Co(imino-bpy)]2+,59 [(bipy)Co(PyS)2]+,54 CpCoPCy2NBn2I2,18 [Ni(qpdt)2]−,60 [Pt(depe)2]+,15,16 Ir(POCOP),22 and [Mn(bipy)(CO)3]/Fe–S}.26 Data for this plot, see Table S2. The blue shadow highlights correlation of Log10[(TOF/s–1)(FEHCOO–)2] with Ecat/2.
To assess the driving force for hydride transfer from (H-1)3– to CO2, we first determined ΔGH– for (H-1)3–. The ΔGH- was obtained from the pKa for (H-1)3– using a thermochemical cycle, and it is 41.1 ± 2.6 kcal mol–1 in MeCN when using an organic acid as the source of protons (Calculation S5, Figure S9).61−64 The ΔGH– for formate in MeCN is 44 kcal mol–1,11 and that suggests that reaction of (H-1)3– with CO2 to give 12– and HCOO– is favorable by 2.9 kcal mol–1 which is relatively close to thermoneutral. Other example catalysts which have hydricity close to thermoneutral for C–H bond formation with CO2 include [Fe4N(CO)11(PPh3)]−,56 Pt(dmpe)2,14 and [(bipy)Co(PyS)2]+,52 which have ΔGH– estimated at 45, 41.4, and 38 kcal mol–1, respectively. We note that the hydricity for [H-Fe4N(CO)11(PPh3)]− and [H–Pt(dmpe)2] was determined experimentally, and for [(bipy)Co(PyS)2]+, a theoretical estimate was made.14,54,56 The catalysts 13– and [Pt(dmpe)2]2+ have near-identical hydricity in MeCN but 13– produces formate with a rate that is 5 orders of magnitude faster as a result of the pre-equilibrium reaction mechanism. Another direct comparison involves [(bipy)Co(PyS)2]+, which has hydricity 3.1 kcal mol–1 stronger than 13–, and yet, the two catalyst exhibit inverted rates: 1.2 × 10³ M–1 s–1 for 13–(65,66) and 98.2 M–1 s–1 for [(bipy)Co(PyS)2]+ in MeCN, which we also attribute to the pre-equilibrium kinetics of (H-1)3– formation.
Catalyst Design for a Pre-Equilibrium Mechanism
These findings illustrate how clusters, or more generally nano-sized materials with delocalized electronic structure, can be employed to enhance the reaction rate of the first chemical step in the catalytic cycle to achieve the pre-equilibrium mechanism. The active catalyst, 13–, has 3- charge while retaining a very modest reduction potential of −0.95 V. The low potential, despite the high anionic molecular charge, likely arises from low reorganization energy associated with the delocalized bonding in the metal–metal bonded cluster; the fast PT to afford (H-1)3– may be promoted by the high anionic charge on intermediate 14–, by the large array of almost-identical surface sites that are available to react with the proton, and by a low reorganization energy for the PT. In any electrochemically driven catalytic cycle, a fast chemical step following ET will lower the overpotential for catalysis, as defined in eq 3, since Ecat/2 is kinetically shifted by the fast chemical step.
Using the cluster structure to achieve a pre-equilibrium mechanism has further advantages beyond the lowered overpotential described in the preceding paragraph. Following generation of the intermediate, in this case (H-1)3–, there is now just one reactive site on the catalytic intermediate, and thus, the selectivity of the second chemical step remains under thermochemical control with a rate that is enhanced by the pre-equilibrium value of K1 according to eq 1.
Regarding future applications of the pre-equilibrium mechanism to enhance the electrocatalyst performance, there are a few obvious scenarios that come to mind. The establishment of the pre-equilibrium depends on the reactivity of both the catalyst (more precisely, the catalyst following a redox event) and the substrate that is required for intermediate formation. These will be discussed separately. Regarding the catalyst: heterogeneous and nano-scale catalysts possess delocalized structures and multiple reactive surface sites similar to the clusters described herein and should be amenable to design of pre-equilibrium mechanisms for solar fuel chemistry. Molecular catalysts, likewise, are promising candidates, and proton relays are a structure type in this category that is well-known to be effective in fast and low overpotential H2 evolution from protons. Beyond, proton reduction, new strategies in molecular chemistry must provide multiple sites for specific substrate binding or site specificity, and possible ideas in this area include incorporation of H-bond accepting or -donating functional groups that are chosen with a pKa value that is not suitable for proton relay behavior. A nucleophilic molecular catalyst is another obvious approach, but that is not a good one since it also results in high energy (very cathodic potentials in the case of reduction) for the catalytic turnover.
Regarding the substrate: in this work, the substrate needed for intermediate formation was a proton, and the proton activity is easily changed (and benchmarked according to the pKa scale) to promote a large equilibrium constant (K1: see eq 1, Scheme 2). The tuning of substrates such as CO2, CO, or N2 may be a little more challenging, but strategies are known which can drive fast catalyst/substrate interactions that have high equilibrium constants. As examples, Lewis acid co-catalysts are known to polarize overall non-polar molecules including N2 and CO2, just like the anion associated with a proton changes its pKa value and activity. Other mechanisms for tuning the reactivity of substrates include use of heterogeneous or homogeneous electrocatalysts with chemically inequivalent bind sites to polarize incoming substrates, to serve as ET sites, and to stabilize intermediates and enhance K1.
It is apparent from the foregoing discussion that many of the catalyst design strategies reported by researchers in the heterogeneous and homogeneous electrocatalysis and solar fuel communities may already be drawing on pre-equilibrium reaction mechanisms to achieve high performance through tuning of the catalyst, substrate, or both. Recognition of those pre-equilibrium mechanisms will result in better control and further enhanced performance because it can guide tuning of elementary steps in the catalytic cycles. Alternatively, minor adjustments to the substrate choice or catalyst design may induce pre-equilibrium mechanisms from existing catalytic cycles that involve successive ET and chemical reaction steps.
Conclusions
In this report, we described a general strategy for use of the pre-equilibrium reaction mechanism to enhance the reaction rate. This was illustrated for formate formation from CO2 and catalyzed by [Co11C2(CO)23]3– (13–). Relative to the known LFER for Log10(TOF/s–1) versus Ecat/2 for reported catalysts, the reaction rate to form formate was enhanced by 5 orders of magnitude, and the overpotential was lowered by 100 mV. Specific to the example demonstrated herein, pre-equilibrium metal-hydride formation led to the enhanced catalyst performance. Selectivity for formate formation (over H2 formation or other CO2 reduction products) arises from the thermoneutral hydride transfer elementary chemical step, whereas pre-equilibrium kinetic effects originate in the hydride formation at 3 × 10⁸ M–1 s–1. A rationale for the observed rates and selectivity were discussed in this report, in relation to the nano-scale structure of 13– and the choice of the proton source which both promote the pre-equilibrium reaction mechanism. In addition, the generality and clearly understood origin of the effects presented herein can be applied broadly to the design of homogeneous and heterogeneous catalysts, and possible strategies to achieve this in future efforts were discussed.
Acknowledgments
This manuscript is based upon work supported by the Department of Energy, Office of Science, Basic Energy Sciences with award number DE-SC0016395. We thank the Keck Imaging facility and Dr. A. Karsai for assistance with SEM–EDX.
Supporting Information Available
The Supporting Information is available free of charge at https://pubs.acs.org/doi/10.1021/jacs.2c10942.
Experimental methods, calculations, CPE results, CV measurements, and details of electrochemical analysis (PDF)
The authors declare no competing financial interest.
Supplementary Material
References
- Nitopi S.; Bertheussen E.; Scott S. B.; Liu X.; Engstfeld A. K.; Horch S.; Seger B.; Stephens I. E. L.; Chan K.; Hahn C.; Nørskov J. K.; Jaramillo T. F.; Chorkendorff I. Progress and Perspectives of Electrochemical CO2 Reduction on Copper in Aqueous Electrolyte. Chem. Rev. 2019, 119, 7610–7672. 10.1021/acs.chemrev.8b00705. [DOI] [PubMed] [Google Scholar]
- Olah G. A.; Goeppert A.; Prakash G. K. Chemical Recycling of Carbon Dioxide to Methanol and Dimethyl Ether: From Greenhouse Gas to Renewable, Environmentally Carbon Neutral Fuels and Synthetic Hydrocarbons. J. Org. Chem. 2009, 74, 487–498. 10.1021/jo801260f. [DOI] [PubMed] [Google Scholar]
- Olah G. A.; Goeppert A.; Surya Prakash G. K.. Beyond Oil and Gas: The Methanol Economy, 2nd ed.; Wiley-VCH: Weinheim, Germany, 2009; pp 233–288. [Google Scholar]
- Chen H.; Dong F.; Minteer S. D. The progress and outlook of bioelectrocatalysis for the production of chemicals, fuels and materials. Nat. Catal. 2020, 3, 225–244. 10.1038/s41929-019-0408-2. [DOI] [Google Scholar]
- De Luna P.; Hahn C.; Higgins D.; Jaffer S. A.; Jaramillo T. F.; Sargent E. H. What would it take for renewably powered electrosynthesis to displace petrochemical processes?. Science 2019, 364, eaav3506 10.1126/science.aav3506. [DOI] [PubMed] [Google Scholar]
- Appel A. M.; Bercaw J. E.; Bocarsly A. B.; Dobbek H.; DuBois D. L.; Dupuis M.; Ferry J. G.; Fujita E.; Hille R.; Kenis P. J.; Kerfeld C. A.; Morris R. H.; Peden C. H.; Portis A. R.; Ragsdale S. W.; Rauchfuss T. B.; Reek J. N.; Seefeldt L. C.; Thauer R. K.; Waldrop G. L. Frontiers, opportunities, and challenges in biochemical and chemical catalysis of CO2 fixation. Chem. Rev. 2013, 113, 6621–6658. 10.1021/cr300463y. [DOI] [PMC free article] [PubMed] [Google Scholar]
- Inglis J. L.; MacLean B. J.; Pryce M. T.; Vos J. G. Electrocatalytic Pathways towards Sustainable Fuel Production from Water and CO2. Coord. Chem. Rev. 2012, 256, 2571–2600. 10.1016/j.ccr.2012.05.002. [DOI] [Google Scholar]
- Ross M. B.; De Luna P.; Li Y.; Dinh C.-T.; Kim D.; Yang P.; Sargent E. H. Designing materials for electrochemical carbon dioxide recycling. Nat. Catal. 2019, 2, 648–658. 10.1038/s41929-019-0306-7. [DOI] [Google Scholar]
- Taheri A.; Berben L. A. Tailoring Electrocatalysts for Selective CO2 or H+ Reduction: Iron Carbonyl Clusters as a Case Study. Inorg. Chem. 2016, 55, 378–385. 10.1021/acs.inorgchem.5b02293. [DOI] [PubMed] [Google Scholar]
- Loewen N. D.; Neelakantan T. V.; Berben L. A. Renewable Formate from C-H Bond Formation with CO2: Using Iron Carbonyl Clusters as Electrocatalysts. Acc. Chem. Res. 2017, 50, 2362–2370. 10.1021/acs.accounts.7b00302. [DOI] [PubMed] [Google Scholar]
- Waldie K. M.; Ostericher A. L.; Reineke M. H.; Sasayama A. F.; Kubiak C. P. Hydricity of Transition-Metal Hydrides: Thermodynamic Considerations for CO2 Reduction. ACS Catal. 2018, 8, 1313–1324. 10.1021/acscatal.7b03396. [DOI] [Google Scholar]
- Ceballos B. M.; Yang J. Y. Directing the reactivity of metal hydrides for selective CO2 reduction. Proc. Natl. Acad. Sci. U.S.A. 2018, 115, 12686–12691. 10.1073/pnas.1811396115. [DOI] [PMC free article] [PubMed] [Google Scholar]
- Yang J.; Kerr T.; Wang X.; Barlow J. Reducing CO2 to HCO2– at Mild Potentials: Lessons from Formate Dehydrogenase. J. Am. Chem. Soc. 2020, 142, 19438–19445. 10.1021/jacs.0c07965. [DOI] [PubMed] [Google Scholar]
- Barlow J. M.; Yang J. Y. Thermodynamic Considerations for Optimizing Selective CO2 Reduction by Molecular Catalysts. ACS Cent. Sci. 2019, 5, 580–588. 10.1021/acscentsci.9b00095. [DOI] [PMC free article] [PubMed] [Google Scholar]
- Cunningham D. W.; Barlow J. M.; Velazquez R. S.; Yang J. Y. Reversible and Selective CO2 to HCO2– Electrocatalysis near the Thermodynamic Potential. Angew. Chem., Int. Ed. 2020, 59, 4443–4447. 10.1002/anie.201913198. [DOI] [PubMed] [Google Scholar]
- Cunningham D. W.; Yang J. Y. Kinetic and Mechanistic Analysis of a Synthetic Reversible CO2/HCO2– Electrocatalyst. Chem. Commun. 2020, 56, 12965–12968. 10.1039/d0cc05556e. [DOI] [PubMed] [Google Scholar]
- Fogeron T.; Todorova T. K.; Porcher J. P.; Gomez-Mingot M.; Chamoreau L. M.; Mellot-Draznieks C.; Li Y.; Fontecave M. A Bioinspired Nickel(Bis-Dithiolene) Complex as a Homogeneous Catalyst for Carbon Dioxide Electroreduction. ACS Catal. 2018, 8, 2030–2038. 10.1021/acscatal.7b03383. [DOI] [Google Scholar]
- Roy S.; Sharma B.; Pécaut J.; Simon P.; Fontecave M.; Tran P. D.; Derat E.; Artero V. Molecular Cobalt Complexes with Pendant Amines for Selective Electrocatalytic Reduction of Carbon Dioxide to Formic Acid. J. Am. Chem. Soc. 2017, 139, 3685–3696. 10.1021/jacs.6b11474. [DOI] [PubMed] [Google Scholar]
- Loewen N. D.; Berben L. A. Secondary Coordination Sphere Design to Modify Transport of Protons and CO2. Inorg. Chem. 2019, 58, 16849–16857. 10.1021/acs.inorgchem.9b03102. [DOI] [PubMed] [Google Scholar]
- Taheri A.; Carr C. R.; Berben L. A. Electrochemical Methods for Assessing Kinetic Factors in the Reduction of CO2 to Formate: Implications for Improving Electrocatalyst Design. ACS Catal. 2018, 8, 5787–5793. 10.1021/acscatal.8b01799. [DOI] [Google Scholar]
- Sullivan B. P.; Meyer T. J. Kinetics and Mechanism of Carbon Dioxide Insertion into a Metal-Hydride Bond. A Large Solvent Effect and an Inverse Kinetic Isotope Effect. Organometallics 1986, 5, 1500–1502. 10.1021/om00138a035. [DOI] [Google Scholar]
- Kang P.; Cheng C.; Chen Z.; Schauer C. K.; Meyer T. J.; Brookhart M. Selective Electrocatalytic Reduction of CO2 to Formate by Water-Stable Iridium Dihydride Pincer Complexes. J. Am. Chem. Soc. 2012, 134, 5500–5503. 10.1021/ja300543s. [DOI] [PubMed] [Google Scholar]
- Kang P.; Meyer T. J.; Brookhart M. Selective Electrocatalytic Reduction of Carbon Dioxide to Formate by a Water-Soluble Iridium Pincer Catalyst. Chem. Sci. 2013, 4, 3497–3502. 10.1039/c3sc51339d. [DOI] [PubMed] [Google Scholar]
- Mayberry D. D.; Linehan J. C.; Appel A. M. Designing Catalytic Systems Using Binary Solvent Mixtures: Impact of Mole Fraction of Water on Hydride Transfer. Inorg. Chem. 2021, 60, 17132–17140. 10.1021/acs.inorgchem.1c02397. [DOI] [PubMed] [Google Scholar]
- Taheri A.; Thompson E. J.; Fettinger J. C.; Berben L. A. An Iron Electrocatalyst for Selective Reduction of CO2 to Formate in Water: Including Thermochemical Insights. ACS Catal. 2015, 5, 7140–7151. 10.1021/acscatal.5b01708. [DOI] [Google Scholar]
- Dey S.; Masero F.; Brack E.; Fontecave M.; Mougel V. Electrocatalytic Metal Hydride Generation Using Concerted Proton Electron Transfer Mediators. Nature 2022, 607, 499–506. 10.1038/s41586-022-04874-z. [DOI] [PubMed] [Google Scholar]
- Madsen M. R.; Rønne M. H.; Heuschen M.; Golo D.; Ahlquist M. S. G.; Skrydstrup T.; Pedersen S. U.; Daasbjerg K. Promoting Selective Generation of Formic Acid from CO2 Using Mn(Bpy)(CO)3Br as Electrocatalyst and Triethylamine/Isopropanol as Additives. J. Am. Chem. Soc. 2021, 143, 20491–20500. 10.1021/jacs.1c10805. [DOI] [PubMed] [Google Scholar]
- Bhattacharya M.; Sebghati S.; VanderLinden R. T.; Saouma C. T. Toward Combined Carbon Capture and Recycling: Addition of an Amine Alters Product Selectivity from CO to Formic Acid in Manganese Catalyzed Reduction of CO2. J. Am. Chem. Soc. 2020, 142, 17589–17597. 10.1021/jacs.0c07763. [DOI] [PMC free article] [PubMed] [Google Scholar]
- Cesari C.; Shon J. H.; Zacchini S.; Berben L. A. Metal Carbonyl Clusters of Groups 8-10: Synthesis and Catalysis. Chem. Soc. Rev. 2021, 50, 9503–9539. 10.1039/d1cs00161b. [DOI] [PubMed] [Google Scholar]
- Carr C. R.; Taheri A.; Berben L. A. Fast Proton Transfer and Hydrogen Evolution Reactivity Mediated by [Co13C2(CO)24]4-. J. Am. Chem. Soc. 2020, 142, 12299–12305. 10.1021/jacs.0c04034. [DOI] [PubMed] [Google Scholar]
- Pattanayak S.; Berben L. A. Cobalt Carbonyl Clusters Enable Independent Control of Two Proton Transfer Rates in the Mechanism for Hydrogen Evolution. ChemElectroChem 2021, 8, 2488–2494. 10.1002/celc.202100402. [DOI] [Google Scholar]
- Helm M. L.; Stewart M. P.; Bullock R. B.; DuBois M. R.; DuBois D. L. A Synthetic Nickel Electrocatalyst with a Turnover Frequency Above 100,000 s–1 for H2. Science 2011, 333, 863–866. 10.1126/science.1205864. [DOI] [PubMed] [Google Scholar]
- Pegis M. L.; Martin D. J.; Wise C. F.; Brezny A. C.; Johnson S. I.; Johnson L. E.; Kumar N.; Raugei S.; Mayer J. M. Mechanism of Catalytic O2 Reduction by Iron Tetraphenylporphyrin. J. Am. Chem. Soc. 2020, 141, 8315–8326. 10.1021/jacs.9b02640. [DOI] [PMC free article] [PubMed] [Google Scholar]
- Kurtz D. A.; Dhar D.; Elgrishi B.; Kandemir S. F.; McWilliams W. C.; Howland C.; Chen J. L.; Dempsey J. L. Redox-Induced Structural Reorganization Dictates Kinetics of Cobalt(III) Hydride Formation via Proton-Coupled Electron Transfer. J. Am. Chem. Soc. 2021, 143, 3393–3406. 10.1021/jacs.0c11992. [DOI] [PubMed] [Google Scholar]
- Costentin C.; Drouet S.; Passard G.; Robert M.; Savéant J. M. Proton-Coupled Electron Transfer Cleavage of Heavy-Atom Bonds in Electrocatalytic Processes. Cleavage of a C-O Bond in the Catalyzed Electrochemical Reduction of CO2. J. Am. Chem. Soc. 2013, 135, 9023–9031. 10.1021/ja4030148. [DOI] [PubMed] [Google Scholar]
- Costentin C.; Savéant J. M. Homogeneous Catalysis of Electrochemical Reactions: The Steady-State and Nonsteady-State Statuses of Intermediates. ACS Catal. 2018, 8, 5286–5297. 10.1021/acscatal.8b01195. [DOI] [Google Scholar]
- Costentin C.; Dridi H.; Savéant J. M. Molecular Catalysis of H2 Evolution: Diagnosing Heterolytic versus Homolytic Pathways. J. Am. Chem. Soc. 2014, 136, 13727–13734. 10.1021/ja505845t. [DOI] [PubMed] [Google Scholar]
- Ciabatti I.; Femoni C.; Hayatifar M.; Iapalucci M. C.; Longoni G.; Pinzino C.; Solmi M. V.; Zacchini S. The Redox Chemistry of [Co6C(CO)15]2-: A Synthetic Route to New Co-Carbide Carbonyl Clusters. Inorg. Chem. 2014, 53, 3818–3831. 10.1021/ic500161e. [DOI] [PubMed] [Google Scholar]
- Azcarate I.; Costentin C.; Robert M.; Savéant J. M. Dissection of Electronic Substituent Effects in Multielectron-Multistep Molecular Catalysis. Electrochemical CO2-to-CO Conversion Catalyzed by Iron Porphyrins. J. Phys. Chem. C 2016, 120, 28951–28960. 10.1021/acs.jpcc.6b09947. [DOI] [Google Scholar]
- Costentin C.; Drouet S.; Robert M.; Savéant J.-M. A Local Proton Source Enhances CO2 Electroreduction to CO by a Molecular Fe Catalyst. Science 2012, 338, 90–94. 10.1126/science.1224581. [DOI] [PubMed] [Google Scholar]
- Roberts J. A. S.; Bullock R. M. Direct Determination of Equilibrium Potentials for Hydrogen Oxidation/Production by Open Circuit Potential Measurements in Acetonitrile. Inorg. Chem. 2013, 52, 3823–3835. 10.1021/ic302461q. [DOI] [PubMed] [Google Scholar]
- Savéant J.-M.Elements of Molecular and Biomolecular Electrochemistry; John Wiley & Sons: Hoboken, 2006; pp 78–93. [Google Scholar]
- Lee K. J.; Elgrishi N.; Kandemir B.; Dempsey J. L. Electrochemical and Spectroscopic Methods for Evaluating Molecular Electrocatalysts. Nat. Rev. Chem. 2017, 1, 0039. 10.1038/s41570-017-0039. [DOI] [Google Scholar]
- Wang V. C. C.; Johnson B. A. Interpreting the Electrocatalytic Voltammetry of Homogeneous Catalysts by the Foot of the Wave Analysis and Its Wider Implications. ACS Catal. 2019, 9, 7109–7123. 10.1021/acscatal.9b00850. [DOI] [Google Scholar]
- Costentin C.; Savéant J.-M. Multielectron, Multistep Molecular Catalysis of Electrochemical Reactions: Benchmarking of Homogeneous Catalysts. ChemElectroChem 2014, 1, 1226–1236. 10.1002/celc.201300263. [DOI] [Google Scholar]
- Azcarate I.; Costentin C.; Robert M.; Savéant J. M. Through-Space Charge Interaction Substituent Effects in Molecular Catalysis Leading to the Design of the Most Efficient Catalyst of CO2-to-CO Electrochemical Conversion. J. Am. Chem. Soc. 2016, 138, 16639–16644. 10.1021/jacs.6b07014. [DOI] [PubMed] [Google Scholar]
- Cometto C.; Chen L.; Anxolabéhère-Mallart E.; Fave C.; Lau T.-C.; Robert M. Molecular Electrochemical Catalysis of the CO2-to-CO Conversion with a Co Complex: A Cyclic Voltammetry Mechanistic Investigation. Organometallics 2019, 38, 1280–1285. 10.1021/acs.organomet.8b00555. [DOI] [Google Scholar]
- Costentin C.; Dridi H.; Savéant J. M. Molecular Catalysis of H2 Evolution: Diagnosing Heterolytic versus Homolytic Pathways. J. Am. Chem. Soc. 2014, 136, 13727–13734. 10.1021/ja505845t. [DOI] [PubMed] [Google Scholar]
- Rountree E. S.; McCarthy B. D.; Dempsey J. L. Decoding Proton-Coupled Electron Transfer with Potential–pKa Diagrams: Applications to Catalysis. Inorg. Chem. 2019, 58, 6647–6658. 10.1021/acs.inorgchem.8b03368. [DOI] [PubMed] [Google Scholar]
- Rhile I. J.; Mayer J. M. One-Electron Oxidation of a Hydrogen-Bonded Phenol Occurs by Concerted Proton-Coupled Electron Transfer. J. Am. Chem. Soc. 2004, 126, 12718–12719. 10.1021/ja031583q. [DOI] [PubMed] [Google Scholar]
- Schrauben J. N.; Cattaneo M.; Day T. C.; Tenderholt A. L.; Mayer J. M. Multiple-Site Concerted Proton-Electron Transfer Reactions of Hydrogen-Bonded Phenols Are Nonadiabatic and Well Described by Semiclassical Marcus Theory. J. Am. Chem. Soc. 2012, 134, 16635–16645. 10.1021/ja305668h. [DOI] [PMC free article] [PubMed] [Google Scholar]
- Qiu G.; Knowles R. R. Rate-Driving Force Relationships in the Multisite Proton-Coupled Electron Transfer Activation of Ketones. J. Am. Chem. Soc. 2019, 141, 2721–2730. 10.1021/jacs.8b13451. [DOI] [PMC free article] [PubMed] [Google Scholar]
- Appel A. M.; Helm M. L. Determining the Overpotential for a Molecular Electrocatalyst. ACS Catal. 2014, 4, 630–633. 10.1021/cs401013v. [DOI] [Google Scholar]
- Dey S.; Todorova T. K.; Fontecave M.; Mougel V. Electroreduction of CO2 to Formate with Low Overpotential Using Cobalt Pyridine Thiolate Complexes. Angew. Chem. 2020, 132, 15856–15863. 10.1002/ange.202006269. [DOI] [PubMed] [Google Scholar]
- Jeletic M. S.; Hulley E. B.; Helm M. L.; Mock M. T.; Appel A. M.; Wiedner E. S.; Linehan J. C. Understanding the Relationship between Kinetics and Thermodynamics in CO2 Hydrogenation Catalysis. ACS Catal. 2017, 7, 6008–6017. 10.1021/acscatal.7b01673. [DOI] [Google Scholar]
- Loewen N. D.; Thompson E. J.; Kagan M.; Banales C. L.; Myers T. W.; Fettinger J. C.; Berben L. A. A Pendant Proton Shuttle on [Fe4N(CO)12]- Alters Product Selectivity in Formate vs. H2 Production via the Hydride [H-Fe4N(CO)12]-. Chem. Sci. 2016, 7, 2728–2735. 10.1039/c5sc03169a. [DOI] [PMC free article] [PubMed] [Google Scholar]
- Chen L.; Guo Z.; Wei X.; Gallenkamp C.; Bonin J.; Anxolabéhère-Mallart K.; Lau T.; Lau M.; Robert M. Molecular Catalysis of the Electrochemical and Photochemical Reduction of CO2 with Earth-Abundant Metal Complexes. Selective Production of CO vs HCOOH by Switching of the Metal Center. J. Am. Chem. Soc. 2015, 137, 10918–10921. 10.1021/jacs.5b06535. [DOI] [PubMed] [Google Scholar]
- Bi J.; Hou P.; Liu F.; Kang P. Electrocatalytic Reduction of CO2 to Methanol by Iron Tetradentate Phosphine Complex Through Amidation Strategy. ChemSusChem 2019, 12, 2195–2201. 10.1002/cssc.201802929. [DOI] [PubMed] [Google Scholar]
- Liu F.; Bi J.; Sun Y.; Luo S.; Kang P. Cobalt Complex with Redox-Active Imino Bipyridyl Ligand for Electrocatalytic Reduction of Carbon Dioxide to Formate. ChemSusChem 2018, 11, 1656–1663. 10.1002/cssc.201800136. [DOI] [PubMed] [Google Scholar]
- Fogeron T.; Todorova T. K.; Porcher J.; Gomez-Mingot M.; Chamoreau L.; Mellot-Draznieks C.; Li Y.; Fontecave M. A Bioinspired Nickel(Bis-Dithiolene) Complex as a Homogeneous Catalyst for Carbon Dioxide Electroreduction. ACS Catal. 2018, 8, 2030–2038. 10.1021/acscatal.7b03383. [DOI] [Google Scholar]
- Curtis C. J.; Miedaner A.; Ellis W. W.; DuBois D. L. Measurement of the Hydride Donor Abilities of [HM(Diphosphine)2]+ Complexes (M = Ni, Pt) by Heterolytic Activation of Hydrogen. J. Am. Chem. Soc. 2002, 124, 1918–1925. 10.1021/ja0116829. [DOI] [PubMed] [Google Scholar]
- Matsubara Y.; Fujita E.; Doherty M. D.; Muckerman J. T.; Creutz C. Thermodynamic and Kinetic Hydricity of Ruthenium(II) Hydride Complexes. J. Am. Chem. Soc. 2012, 134, 15743–15757. 10.1021/ja302937q. [DOI] [PubMed] [Google Scholar]
- Wiedner E. S.; Chambers M. B.; Pitman C. L.; Bullock R. M.; Miller A. J. M.; Appel A. M. Thermodynamic Hydricity of Transition Metal Hydrides. Chem. Rev. 2016, 116, 8655–8692. 10.1021/acs.chemrev.6b00168. [DOI] [PubMed] [Google Scholar]
- The theoretical framework developed by Kubiak and coworkers,11 estimates hydricity for (H-1)3– as 49.8 kcal mol–1 in MeCN solution (Calculation S6), but this assumes that bond dissociation free energy (BDFE) of metal hydride bonds varies only within ±10 kcal mol–1, and is likely not a good approximation for the delocalized and fluctional bonding in clusters.
- kcat is calculated from the TOF and [CO2] = 0.24 M in MeCN/H2O or 0.28 M in MeCN,66 using kobs = K1k2[CO2], where kcat = K1k2.
- Tomita Y.; Teruya S.; Koga O.; Hori Y. Electrochemical Reduction of Carbon Dioxide at a Platinum Electrode in Acetonitrile-Water Mixtures. J. Electrochem. Soc. 2000, 147, 4164–4167. 10.1149/1.1394035. [DOI] [Google Scholar]
Associated Data
This section collects any data citations, data availability statements, or supplementary materials included in this article.