

Abstract
Advocates for education reforms frequently call for policies to increase school efficiency performance. The Greek educational system has undergone several reforms while the recent financial crisis alters significantly. Using a unique dataset this study attempts to shed light on 643 Greek secondary education schools’ efficiency performance, over the period 2000–2017, and to perform an investigation of the efficiency determinants in a multilevel framework. Results reveal that there is substantial room for improvements especially for specific Greek NUTS2 regions while the adopted reforms seem to have a very low effect. Our findings also denote a favourable effect for physics, science laboratories, and class size and a significant negative effect for the variable of student per class. In addition, at a second level the gross domestic product per capita of the NUTS2 region that each school belongs positively affects its efficiency performance.
Keywords: Multilevel, DEA bootstrap, Upper secondary education, Greek school’s efficiency
Introduction and motivation
Starting from the seminal works of Schultz (1960; 1961; 1967) and Hanushek (1968; 1986) economists and scholars argue on the institutional mechanism of “schooling” as the main resource of countries’ human capital accumulation creating positive externalities and spillovers to the society (Blundell et al. 1999). Endogenous growth and new growth theory identify education as one of the primary components of human capital (Lucas 1988; Romer 1990), while a significant number of empirical studies justify the relationship. The latter acquires a more important role in a globalized economy and integrated labour markets while requires the re-examination of many parameters due to the radical changes brought by the COVID-19 pandemic (Burgess and Sievertsen 2020; Grewenig et al. 2021). Thus, it is important to ensure that the educational system, under a production economics framework, is carried out with a high level of efficiency performance.
Greece, among European countries, is an interesting case to study for two main reasons. The first reason concerns the global crisis of 2009 and the subsequent Greek debt crisis, while the second one refers to the large and frequent number of reforms that have been carried out. Statistics regarding the 2009–2015 period shown that gross domestic product fell annually by an average of 4% with a total reduction of 26%. Under this framework, many dimensions of the educational system have been greatly influenced. Public spending significantly declined, in nominal terms, by a 35%, serious wages cuts affect teachers’ salaries while a significant freeze in hiring additional stuff with a parallel large number of retired teachers created an explosive mixture (OECD 2018).
It is a fact that Greek educational system is characterized by a “time lag” compared to other in EU countries (Agasisti 2011) and as very centralized where the frequent changes created an enormous number of educational reforms (Ifanti 2011) with questionable and unexplored effects. Indeed, an excessive number of laws and bureaucratic schemes seem to confirm the education discontinuity in the upper secondary education. Moreover, the political efforts to reform and modernize upper secondary education although successful in transforming education spending into educational output (Agasisti 2011), have not been confirmed using PISA evaluations1 (Schleicher 2019). In addition, many specificities (i.e. shadow education, family perceptions about higher education) and idiosyncrasies is of great importance since greatly affecting secondary school’s productive performance.
This paper, aimed at partially filling this gap in the literature, carries out an evaluation of the efficiency of Greek schools in providing public secondary education over the years 2000–17. The objectives of the paper are three-fold. The first objective is to evaluate Greek secondary school’s productive performance over a large period. The analysis of educational efficiency across regions also provides an opportunity to explore the influence of the significant number of educational reforms on educational management and to check for regional divergences. The specific constitutes our second objective. Finally, the last objective refers to identifying possible factors, using a hierarchical structure, responsible for school’s productive performance. We seek to explain differences in school’s efficiency theorizing on school (level-1) and regional (level-2) determinants. This is rather important since, to the best of our knowledge, this similar studies in Greece, (Smirlis et al. 2006; Sotiriadis et al., 2015; Margaritis et al. 2022) are limited to specific regions.
This paper contributes to the above literature by adopting a robust methodology for estimating Greek school’s efficiency. However, Greece is a particularly relevant case study for two more reasons. First, Greece performed poorly in PISA 2018 compared to other European countries (Schleicher 2019). The poor overall performance of Greek students has led to a heated political debate about which school type is likely to produce better academic outcomes. Second, educational policy making is mostly centralized to government, which decide on the total amount of public funds that are allocated to secondary education. The process of centralization in Greece was spread out over time and has been influence by a significant number of different questionable reforms. For this reason, the analysis of educational efficiency across regions also provides an opportunity to explore the influence of the centralized reforms on educational management. However, our study also contributes in another way, since it tries to answer to a key unresolved question that concerns the motivation behind the geographical efficiency divide, in particular whether lower efficiency in some regions is mainly caused by due to worse teachers’ quality, organizational setting and managerial skills and/or due to different regional per capita distribution. Despite the interest of the above-mentioned issues, the literature on the performance of the Greek educational system is rather limited, and especially the effect of different educational reforms on their efficiency is a relatively little explored topic.
Our results have much to say about the impact of educational reforms. More strikingly, our results provide strong support for the view that educational reforms over the period 2000–2017 haven’t served to improve school’s efficiency performance while a substantial room for improvement has been detected. In addition, on average, rural areas seem to perform slightly better. However, NUTS2 regions at the periphery, Islands and specific non-rural areas constitutes the champions group. Finally, we observe a favourable effect for physics, science laboratories and class size and a significant negative effect for the variable of student per class. In addition, at a second level the NUTS2 regional gross domestic product per capita positively affects efficiency performance.
The remainder of the paper is structured as follows. Section 2 reviews the literature while Sect. 3 presents Greek educational reforms. Section 4 describes the methodology adopted in our study while Sect. 5 presents the dataset and the associated variables. Section 6 presents and discusses the empirical findings concerning the estimations of efficiency scores and possible determinants. Lastly, Sect. 7 summarizes and concludes.
Review of literature and theoretical background
During the last decades, many researchers were involved with the so-called “schooling”. Foundations of the theoretical basis of the field must be ascribed to Schultz (1960; 1961; 1967). In his work, a new component, related to this field, is revealed: the future welfare of society and individuals. Qualitative factors, such as family background, the number of books at home, classroom interaction, and their effectiveness in the educational process were investigated from a sociological point of view (Coleman 1968). Thus, the future research from economists in schooling had been based in those factors (Kirjavainen 2009, pp. 4) as we shall see following.
With his thesis (Hanushek 1968) as the starting point, Eric Hanushek opened a rich research field in education economics. Although the production function had been already investigated in the context of education (Burkhead et al. 1967), Hanushek has lain the groundwork for theoretical and empirical research. Studies that ensued, using various methodologies, traced the map of the field (Levin 1974; Charnes et al. 1978; Hanushek 1979). The problematic was common and was concerning inputs and their impact on school efficiency. Summers et al. (1977) criticize the results of previous empirical research that a few inputs truly affect school efficiency, suggesting focusing on inputs that help the low achievers to do better. Bessent and Bessent (1980) investigates the USA’s elementary school units of the same district in Texas in one of the first extended empirical research. Using a sample of elementary schools in metropolitan North investigate the differences among white and black students in the educational process. Inputs are initially defined and separated into four categories: socioeconomic factors, attitudes, school factors, and racial competition measures. More attention was given to school factors while outputs were verbal and mathematics achievement scores. Qualitative factors, such as teachers’ quality, showed that they affect significantly school efficiency.
In addition, Hanushek (1986) re-examines and redefines schooling through twenty-year research. This treatise turned into a new guide for future research. More and more countries start to develop research on the efficiency of education adding a cross-cultural value to the field (Kirjavainen, and Loikkanen 1996; James et al. 1996; Pedraja-Chaparro and Salinas-Jimenez 1996; Soteriou et al. 1998; Bradley et al. 2001; Borge and Naper 2006; Podinovski, et al. 2014; Yahia, et al 2018). A great number of input variables such as the number of teachers per student, expenditures, attendance, students’ background, etc. indicate the complexity of schooling (Andersen 2008; Haelermans and De Witte 2012; Aparicio et al. 2020).
Focused on specific factors, recent studies became more specialized and focused in examining class size (Angrist and Lavy 1999; Goldstein et al. 2000; Krueger 2003; Krassel and Heinesen 2014; Blatchford, and Webster 2018; Wang, and Calvano 2022), teacher quality (Hanushek, and Rivkin 2006; Krieg 2006; Jackson 2014; Mammadov, and Çimen 2019) family background (Wößmann 2005; Brunello, and Checchi 2005; Mazzonna 2014; Thijssen et al. 2022), socioeconomic factors (Toutkoushian, and Curtis 2005; Blackburn et al. 2014; Queiroz, et al 2020).
Theodor Schultz (1968) in his invited lecture defines an institution as a set of behavioral rules2 of social, political, and economic aspects of human beings set in the discussion the specific perspective. He also analyses four categories of institutions that influence and are influenced by economic growth. The fourth category includes schools: “those that establish the framework for the production and distribution of public goods and services” (pp. 1114). Schultz proposes a contribution of institutions “as variables that respond to the dynamics of economic growth”. He also indicates a key issue “the lags in adjusting to the new demands”.
Institutional theory developed during the last decades from a sociological point of view (Meyer and Rowan 1977; Zucker 1987; Tolbert and Zucker 1999). Institutions, embedded organizations, myths, and ceremonies are deeply investigated, emphasizing the dynamic character of institutional processes (Peters 2022). In parallel, economists developed Institutional theory from their point of view (Myrdal 1978; Williamson 1985; Coase 1998; Richter 2015; Acemoglu and Robinson 2006) opening the research field of new Institutional Economics. In its seminal papers, North (1991, 1993) redefining institutions and organizations, develops an analytical framework of Institutional Change, revealing the importance of the difficult and complex process of institutional change. In addition, Acemoglu and Robinson (2006) in order to investigate “the coexistence of change and persistence in institutions” construct a model “based on the distinction between de jure and de facto political power”. The role of social innovations in institutional changes was investigated by Van Wijk et al (2019) introduced a new model. In this model, three circles (micro, meso, and macro) interpret the multilevel interactions in the institutional context and simultaneously analyzes the role of awareness of institutional practices and the importance of the negotiation of potential institutional change.
A branch of institutional theory consists of Education as an institution. Meyer (1977) describes the path from individuals’ effect of education to institutional effects of Education on society. Institutional changes in Education are explored in Meyer, and Rowan (2006) and Baker (2006). Educational reforms consist of one of the main factors that affect Educational Institutions and produce fundamental changes in their core. Many researchers confirm the difficulty of any institutional transformation in elementary and secondary education (Andersen 2008; Gamson et. al. 2015; Reimers 2020) and in higher education (Enders et al 2013; Chan 2019; Strielkowski et al 2020). In this paper, we are going also to investigate the role of reforms in school efficiency in the context of institutional persistence to changes.
Educational system, reforms, and shadow education in Greece
Reforms in the Greek educational system
Educational systems reflect the historical, political, and socio-economical context of a country (Archer 2013). Many researches focus on comparing educational systems in different countries, revealing weaknesses, and inequalities, and suggesting new policies and educational practices (Giménez et al. 2017; Aparicio et al. 2020).
In Greece, from 1950 until nowadays, the decisions about Education have been made by the current Government. The Ministry of Education has the responsibility for the national Educational System as the highest administrative structure in this area. This status formed a compactly hierarchical education policy system in which the last step is the school unit which is considered as the core of education. The principal is at the top of the hierarchy in the school unit, followed by the vice-principal and the teaching staff. The educational institutions that operate in each region, are run by training directorates that differ accordingly at each level of education (primary and secondary).
We are going to describe shortly the main periods of educational reforms starting from the late-1990s, namely the legislative reforms of 1997/1998. An important reform in this period was that the introductory system to higher education changed by increasing the number of examination subjects, which involved not only 3rd grade but also 2nd grade of lyceum. In 2001, the Minister of Education slowly overturned the previews low in order to avoid educational unrest. Thus, it reduced the nationally examined courses for the 2nd Lyceum for the 3rd Lyceum and the remaining subjects for in-school examination. In the period 2004–2007, the national exams in the 2nd Lyceum were abolished, while from the next school year the students of the 3rd Lyceum will be examined in six subjects instead of the nine. At the same time, introduced as a lower limit of 10 (with an excellent 20) in the degree of access for admission to universities and technical institutes. When the government changed in 2009, the new low established criteria gave weightiness to postgraduate qualifications. This reform changed the landscape of administration in the education and led several executives to early retirement.
In 2010, under the new ministry of Education, the lower limit that we described above was abolished. As a result, thousands of students began to be admitted again to universities and technological institutes with grades three and four, but there were no vacancies left. After three years, in 2013, the new Minister of Education establishes the Thematic Bank for the promotion exams, starting with the students of the 1st-grade Lyceum. The exams are carried out by 50% by drawing lots from the Thematic Bank. There were serious reactions and thousands of students were left to be examined. The Thematic Bank was finally abolished in 2015 as the main source of written test themes and functions as an options counseling tool for students and educators. Until now, the system remains the same with minor changes. As for the thematic bank, it has returned and will probably be implemented this year for the students of the 1st Lyceum.
Shadow education in Greece
Stevenson and Baker (1992) introduced the term Shadow Education as “a set of educational activities that occur outside formal schooling and designed to enhance the student’s formal school career”. This is a worldwide phenomenon that shouldn’t be ignored in any educational research, even if considered as embedded in public formal schooling (Cordero et al. 2016). Social and educational changes investigated via shadow education revealed the significance of an institution hidden but still a powerful component of the mass Education System (Baker et al. 2001; Mori and Baker 2010; Byun et al. 2018).
In Greece, shadow education exists as a parallel institution called frontisterio and coexists with a formal legitimate Educational system. Another term with a negative meaning which is also used is paradedia (Kassotakis and Verdis 2013). In this structure, students outside school attend private lessons or group class formed lessons, to support their learning process. This outside school educational activity increase as the student enters the upper secondary level. Tutoring was estimated in 2008 up to €952.6 million representing 18.6% of all household expenditures on education and 20.1% of the government expenditures on primary and secondary education. The allocation was €340.1 million for private or small group tutoring (idietera) and €612.5 million for class-based tutoring (frontistiria) (Bray 2011, 2021).
More recently, according to OECD (2018) the year 2015, the percentage of students from schools in urban and semiurban areas, which attended out school tutoring was 84% while the percentage of students from schools in rural areas was 70%. For all these reasons, in our research, we didn’t use as output the grades of written exams for the entrance in University (panellinies). The grades that we use are the total grades from Lyceum that are formed by oral and written tests internal the school unit, considering that they represent better the perspective of the school environment from our research point of view.
Theoretical underpinnings
The empirical strategy in this study is based on a two-stage procedure. In the first stage, we estimate Greek school’s efficiency scores with the objective to detect performance in the educational process under the region that each school belongs. Then, in the second stage, we regress their efficiency scores, against a set of covariates to investigate the efficiency determinants using a multilevel approach.
Bootstrapped DEA and school efficiency
Efficiency and performance measurement, using both Data Envelopment Analysis (DEA) and Stochastic Frontier Analysis (SFA) methodologies, is a topic that is part and parcel of educational economics. This has resulted in a vast literature that discusses the advantages and disadvantages of the different methodological approaches (see Cook and Seiford 2009; Moghaddas et al. 2022a, b). In a DEA framework where we don’t require information on relative prices, we can easily handle multiple outputs, and estimate technical and scale efficiency results for each period as a separate and unique production segment (Cook and Seiford 2009; Murillo-Zamorano 2004). In a broader picture an appealing method to incorporate preference information into both efficiency analysis and target setting refers to the use of interactive MOLP techniques. (Tavana et al. 2018; Ebrahimnejad and Tavana 2014; Ebrahimnejad and Lotfi 2012) or more advanced methodologies like fuzzy DEA (Bargheri et al., 2022) and integrated DEA (Ebrahimnejad et al. 2016). However, a main weakness of DEA compared to SFA is, however, that it does not account for noise in the data and that traditional hypothesis testing is not possible except by using bootstrapping techniques developed by Simar and Wilson, (2007, 1999, 1998).
We adopt a Bootstrap-DEA approach considering schools, each producing M outputs using N inputs with N ={1,…,n} and M = {1,…,m} the input and output sets. The logic behind adopting this approach focus on the fact that statistical noise may distort any kind of efficiency ranking (Simar and Wilson 1998, 2002) while the measures of efficiency could be affected by sampling variation, suggesting that the estimated distance functions to the frontier are potentially miscalculated (Gadanakis and Ariel, 2020; Kounetas and Napolitano 2018). In the framework of the Greek frontier, a specific school of each school employs a vector of inputs to produce a vector of outputs (Charnes et al 1978) The production possibility set is given as and the input set as (Harrell and Debreu 1960). The input-oriented efficiency associated with S can be measured using the direct input distance function34 so that the input efficiency is measured for a given level of output. Thus, the technical efficiency (productive performance) for the school for the k-th region is given as Eq. (1) (Fare et al. 1994):
| 1 |
Following closely, Simar and Wilson, (2007, 1999) (SW), referred to the nature of DEA estimators of efficiency as biased by construction we introduce the concept of bootstrap DEA efficiency scores (Kounetas and Papathanasopoulos 2013) as the most suitable method to obtain statistical attributes for the DEA estimators. Hence, we calculate the bias for the original DEA estimator for the i-th regions as:
| 2 |
which is a bias corrected estimator of , given as follows:
| 3 |
A multilevel approach for assessing school efficiency determinants
In our study schools’ efficiency score over a range of nineteen years can be considered in a multilevel framework. Multilevel analysis is considered as the most preferred methodology in handling the nested formation of our dataset (Rasbash and Goldstein 1994; Rumberger and Palardy 2004; Hanushek and Rivkin 2010; Mancebόn et al., 2012; Stavropoulos and Skuras 2016). However, ignoring the proposed hierarchical structure, can lead to problems such as misestimated parameters and standard errors, aggregated bias (Thanasoulis and Portela 2002; Johnes 2006) leading to Type-I errors (Hill and Rove, 1996).
Let us start with the basic level-1 (school factors) model having the following form
| 4 |
where are group dependent in their relationship with the continuous dependent variable , while are schools’ specific efficiency determinants.
Although other econometric techniques may also be applied to estimate school’s efficiency determinants (Alexander et al. 2010; Johnes 2006) a multilevel approach has particularly appeal as in puts the emphasis on the estimation of exclusively school determinants (level-1) but also to regional characteristics that may affect (level-2) (Cools et al. 2009; Johnes 2006). Thus, across all schools, the β coefficient follow a distribution with given mean and variance. However, in a multilevel setting the (co) variance of these coefficients over different regions are estimated using a multivariate normal distribution with zero mean and a specific variance–covariance matrix. Consequently, at level-2 the random intercept and the slope are predicted by:
| 5 |
| 6 |
Term τ denotes the fixed elements across school where ,are normally distributed random variables satisfying the following:
| 7a |
| 7b |
The two levels (level-1 as in Eq. (4)) and level-2 (Eq. (5) and (6)) can be combined (Goldstein 2003) as follows:
| 8 |
Data and variables
The paper benefits from a unique dataset, that is the Bulletin of Secondary Education Statistics conducted by the Hellenic Statistical Authority (EL.STAT) that contains information regarding upper secondary education in Greece. The bulletin is actually a census survey, where questionnaires was sent to all upper secondary education schools, at the end of every academic year.5 The corresponding questionnaire contains information with respect to specific sections including the identity and location of the school unit, the organization and size, human resources (including stuff, administrative employees e.t.c) and infrastructure6 and it is used for the first time in the empirical literature.
The initial panel consists of 861 school unit observations for the period between 2000 and 2017. In order to create a reliable database, data were filtered for excluding units for which crucial information were missing for all periods reducing our initial sample to 643 schools per year (74.69%) mainly due to significant shortcomings in our variables of interest. However, to the best of our knowledge, the specific dataset, in its extent, has been for first time examined in the current study offering a holistic view of Greek secondary schools. Subsequently, secondary education units with non-consistent series of variables were excluded from our analysis reducing further our sample by 27.5%. The resulting dataset is a balanced panel consisting of 11.574 schools’ observations for all 52 NUTS2 regions in Greece and for the period between 2000 and 2017 (see Table 1).
Table 1.
NUTS2 and NUTS3 regions and number of schools
| Regions NUTS2 | Region NUTS3 | NAME OF NUTS2 region | Number of schools |
|---|---|---|---|
| GR-13 | GR-G | AETOLIA-ACARNANIA | 19 |
| GR-03 | GR-H | BOEOTIA | 13 |
| GR-03 | GR-H | EUBOEA | 14 |
| GR-06 | GR-H | PHTHIOTIS | 16 |
| GR-07 | GR-J | PHOCIS | 3 |
| GR-11 | GR-J | ARGOLIS | 7 |
| GR-12 | GR-J | ARCADIA | 8 |
| GR-13 | GR-G | ACHAIA | 21 |
| GR-14 | GR-J | ELIA | 14 |
| GR-15 | GR-J | CORINTHIA | 6 |
| GR-16 | GR-J | LACONIA | 9 |
| GR-17 | GR-J | MESSENIA | 7 |
| GR-21 | GR-F | ZAKYNTHOS | 2 |
| GR-22 | GR-F | CORFU | 5 |
| GR-23 | GR-F | CEPHALONIA | 3 |
| GR-24 | GR-F | LEFKADA | 2 |
| GR-31 | GR-D | ARTA | 9 |
| GR-32 | GR-D | THESPROTIA | 4 |
| GR-33 | GR-D | IOANNINA | 10 |
| GR-34 | GR-E | PREVEZA | 7 |
| GR-42 | GR-E | KARDITSA | 6 |
| GR-42 | GR-E | LARISSA | 20 |
| GR-43 | GR-E | MAGNESIA | 18 |
| GR-44 | GR-C | TRIKALA | 11 |
| GR-51 | GR-C | GREVENΑ | 3 |
| GR-52 | GR-A | DRAMA | 6 |
| GR-53 | GR-B | IMATHIA | 10 |
| GR-54 | GR-B | THESALONIKI | 50 |
| GR-55 | GR-A | KAVALA | 10 |
| GR-56 | GR-C | KASTORIA | 4 |
| GR-57 | GR-B | KILKIS | 7 |
| GR-58 | GR-C | KOZANI | 4 |
| GR-59 | GR-B | PELLAS | 3 |
| GR-61 | GR-B | PIERIA | 6 |
| GR-62 | GR-B | SERRES | 14 |
| GR-63 | GR-C | FLORINA | 3 |
| GR-64 | GR-B | CHALKIDIKI | 6 |
| GR-71 | GR-A | EVROS | 5 |
| GR-72 | GR-A | XANTHI | 4 |
| GR-73 | GR-A | RODOPI | 4 |
| GR-81 | GR-L | DODEKANISA | 7 |
| GR-82 | GR-L | CYCLADES | 6 |
| GR-83 | GR-K | LESVOS | 11 |
| GR-84 | GR-K | SAMOS | 4 |
| GR-85 | GR-K | CHIOS | 44 |
| GR-91 | GR-M | HERAKLEION | 14 |
| GR-92 | GR-M | LASITHI | 4 |
| GR-93 | GR-M | RETHYMNO | 5 |
| GR-94 | GR-M | CHANIA | 5 |
| GR-A1 | GR-I | ATTICA | 210 |
Consistent with both the information regarding the questionnaire developed by EL.STAT and the literature on secondary school efficiency our study considers the following input–output variables. Following the production theory approach, the first input, number of classes represents the concept of fixed capital in an educational unit (Bradley et al. 2001; Humlum and Smith 2015), while the second variable of teaching stuff encapsulates the school’s human resources and thus human capital (Portela and Thanassoulis 2001; Segovia‐Gonzalez et al., 2020). On the other hand, the literature on measuring school’s efficiency has reached a broad consensus that the most appropriate measure of school output is the marginal effect of the school on educational outcomes (Hanushek 1986; Hanushek and Taylor 1990; Aitkin and Longford 1986). Thus, on the output side, we have to note that our variables incorporated in the DEA bootstrap model focus on the school performance and accordingly we employ as the output variable (De Witte and Lopez-Torres 2017; Johnes et al. 2017; Cordero-Ferrera et al. 2008; Agasisti and Johnes 2015 among others).
In the second part of our study, following a multilevel approach, the estimated technical efficiency scores were regressed against a set of environmental variables, which can be classified, at the first level, in three broad categories. The first reflects school facilities including the existence of laboratory in physics and in science and gym (Murillo and Román, 2011; Royo and Fajardo 2020). All these variables take the value of 1 if the school provide the specific facility and 0 otherwise. In the second category, we used variables that encapsulate additional human resources. It is generally accepted that variables additional stuff may also improve students’ performance. Thus, we include the number of additional administrative stuff and the number of teachers (i.e. Haelermans and Ruggiero 2013; Abbot and Dougouliagos 2009). Finally, in the third broad category with school specific characteristic we examine the behavior of (STUDCLAS) (see for example Kirjavainen 2009; Masci et al. 2018; Crespo-Cebada et al. 2014). Because the primary purpose of our analysis is to provide evidence also, in a regional level, we examine at a second level the influence of variables related to the economic status of the region that each school belongs. It is worth noting that the inclusion of other variables, such as population density, urban/rural area (Johnes and Virmani 2020) and income for example, did not improve the econometric performance of our model. Table 2 below presents the basic descriptive statistics of the employed variables in our analysis.
Table 2.
Descriptive statistics of the participated variables
| Mean* | Std. Dev | Min | Max | |
|---|---|---|---|---|
| DEA variables | ||||
| 11.752 | 4.619 | 1.000 | 39.000 | |
| 181.160 | 184.362 | 8.000 | 934.00 | |
| 15.110 | 1.209 | 11.50 | 19.25 | |
| Multilevel regression variables | ||||
|
0 = 23.83% 1 = 67.17% |
||||
|
0 = 63.88% 1 = 36.12% |
||||
|
0 = 58.98% 1 = 41.02% |
||||
| 2.661 | 8.953 | 1 | 83 | |
| 23.48 | 12.851 | 4 | 33 | |
| 21.182 | 8.151 | 1 | 84 | |
| 9.591 | 1.333 | 7.628 | 14.288 | |
Results and discussion
Efficiency scores of Greek schools
The estimations of technical efficiency have been carried out using the bootstrap DEA7 approach to fulfill the statistical properties for our measures and overcome weaknesses of traditional DEA (Simar and Wilson 2007). However, is crucial to note that the estimations are grounded on a cross-sectional basis and estimated separately for each year in the sample, indicating each year as a unique technology production function. Therefore, the successive values of the estimated technical efficiency for each region encompasses two factors, the change of the distance of each region from the European frontier and the movement of it (Tsekouras et al. 2015). The average bias-corrected efficiency for the whole sample is 0.800 with standard deviation 0.043 and minimum and maximum values equal to 0.596 and 0.990 respectively. The specific results suggest the room for significant efficiency improvements with respect the specific input–output mix. Thus, Greek schools can improve their performance regarding grades by a 20% holding the inputs constant.
Regional estimates at Table 3 indicate a concentrated efficiency performance for the participated schools. We can observe a small diachronical improvement regarding the specific results, but we can also detect very small fluctuations in terms of performance and standard deviations. For instance, Epirus, Southern Aegean and Ionian Islands schools’ efficiency scores are relatively high comparing to Central and Western Greece but our findings highlight the presence of a narrow distribution of efficient and inefficient schools. Figure 1 reports the distribution of bias-corrected efficiency scores by region clearly indicating the results are not dispersed between the Greek regions.
Table 3.
Productive Efficiency for Greek regions for 2000–2017 (Bootstrap DEA)
| TE | TE | TE | TE | TE | Mean TE | |
|---|---|---|---|---|---|---|
| 2000 | 2005 | 2010 | 2014 | 2017 | ||
| Eastern Macedonia and Thrace (GR-A) |
0.807 (0.049) |
0.803 (0.035) |
0.783 (0.051) |
0.797 (0.042) |
0.795 (0.033) |
0.800 (0.042) |
| Central Macedonia (GR-B) |
0.803 (0.038) |
0.803 (0.042) |
0.804 (0.041) |
0.801 (0.046) |
0.808 (0.041) |
0.805 (0.041) |
| Western Macedonia (GR-C) |
0.807 (0.048) |
0.807 (0.043) |
0.796 (0.039) |
0.814 (0.061) |
0.809 (0.036) |
0.801 (0.038) |
| Epirus (GR-D) |
0.808 (0.054) |
0.811 (0.041) |
0.805 (0.027) |
0.820 (0.048) |
0.812 (0.043) |
0.812 (0.044) |
| Thessaly (GR-E) |
0.803 (0.036) |
0.794 (0.041) |
0.806 (0.038) |
0.808 (0.045) |
0.800 (0.036) |
0.803 (0.038) |
| Ionian Islands(GR-F) |
0.794 (0.036) |
0.834 (0.042) |
0.819 (0.036) |
0.824 (0.021) |
0.817 (0.031) |
0.814 (0.037) |
| Western Greece (GR-G) |
0.788 (0.041) |
0.799 (0.041) |
0.797 (0.049) |
0.791 (0.040) |
0.796 (0.044) |
0.791 (0.046) |
| Central Greece (GR-H) |
0.788 (0.040) |
0.794 (0.045) |
0.775 (0.038) |
0.768 (0.039) |
0.773 (0.043) |
0.778 (0.042) |
| Attica (GR-I) |
0.801 (0.042) |
0.802 (0.043) |
0.807 (0.042) |
0.801 (0.041) |
0.800 (0.041) |
0.803 (0.042) |
| Peloponnese (GR-J) |
0.801 (0.047) |
0.780 (0.035) |
0.779 (0.043) |
0.795 (0.053) |
0.789 (0.049) |
0.790 (0.047) |
| Northern Aegean (GR-K) |
0.801 (0.040) |
0.788 (0.037) |
0.805 (0.044) |
0.806 (0.042) |
0.799 (0.047) |
0.797 (0.032) |
| Southern Aegean (GR-L) |
0.793 (0.026) |
0.791 (0.041) |
0.811 (0.044) |
0.807 (0.036) |
0.795 (0.039) |
0.808 (0.042) |
| Crete (GR-M) |
0.810 (0.043) |
0.799 (0.042) |
0.799 (0.038) |
0.804 (0.039) |
0.794 (0.033) |
0.803 (0.043) |
| Mean | 0.789 | 0.799 | 0.801 | 0.804 | 0.806 | 0.814 |
| St.Dev | 0.036 | 0.041 | 0.045 | 0.054 | 0.043 | 0.041 |
Fig. 1.

Distribution of efficiency score by NUTS3 region
Turning now our attention at NUTS2 region level we use a complimentary way of looking at the distribution of efficiency, which contains the boxplots of scores (Fig. 2). Our results confirm a higher degree of heterogeneity of schools’ efficiency NUTS2 region in the country and the creation of distinct groups.
Fig. 2.

The distribution of efficiency score by NUTS2 region
Greek NUTS2 regions including Keffalonia (GR-23), Leukada (GR-24), Zakynthos (GR-21), Arta (GR-31), Elia (GR-14), Korithia (GR-15) and Lakonia (GR-16) are the leading ones in term of efficiency scores (see Fig. 2). More specifically, Ionian islands NUTS2 region perform best comparing with other Greek NUTS2 regions while specific NUTS2 regions in Peloponnese and Epirus follows. Moreover, it seems that the majority of the Greek NUTS2 regions appears to have better performance comparing with the mean. On the other hand, the opposite describes NUTS2 regions as Boeotia (GR-03), Phocis (GR-07), Phthiotis (GR-06), (parts of Central Greece), Achaia (GR-13), Evros (GR-71), Rethymno (GR-93), laggards since it displays significant deviations from average performance. Our results reveal the idiosyncratic behavior of Ioannina (GR-23), Larisa(GR-23) Chalkidiki (GR-23), and Grevena (GR-23), which are can’t be characterized as “falling behind” or “leaping forward” with respect to the technology. The visual representation is also useful for showing other cases, such as the ones of Attiki, Western Attiki and Piraieus (efficiency close to the median and wide distribution) that appears important outliers and Achaia (GR-13), Arcadia (GR-12) (high median efficiency, wide distribution). It is important to observe that the most populated NUTS2 region in Greece appear to have better that the average performance but with significant outliers. Thesalloniki (GR-54) NUTS2 region follows in the same logic.
We must underline, that in the leader group that we described above, belongs two NUTS2 regions, Korithia (GR-15) and Lakonia (GR-16) from the Peloponnese region. This region (Table 2) has one of the lower efficiency scores. The other NUTS2 regions of Peloponnese are Argolida (GR-11), Arcadia and Messenia (GR-17) which as we see from Fig. 2 have a significand lower efficiency score comparing with Korithia (GR-15) and Lakonia (GR-16). According to Halkos, and Tzeremes (2010) the inner economic development of Greek regions appears ununiformly. School’s efficiency seems to follow a similar pattern: inequalities inside regions materialized with great differences in efficiency among NUTS2 regions.
In one sense, this graphical/statistical tool could be used to detect schools with particular characteristics to be investigated or discussed, with the aim of understanding the particular status of high/low efficiency and derive specific interventions or managerial implications.
Finally, a Gaussian kernel functions (Fig. 3) were used in our density estimation to reflect the efficiency schools’ measure one year after the implementation of several educational reforms. It is interesting to note the unimodal pattern of the efficiency scores over time. In addition, we can observe a small difference regarding the years of estimations. Although there is a consensus for the efficiency scores regarding years, there is a specific behavior regarding 2000 with a mean around 0.8. Thus, we can assume no significant differences after the adoption of the educational reforms regarding school efficiency scores.
Fig. 3.
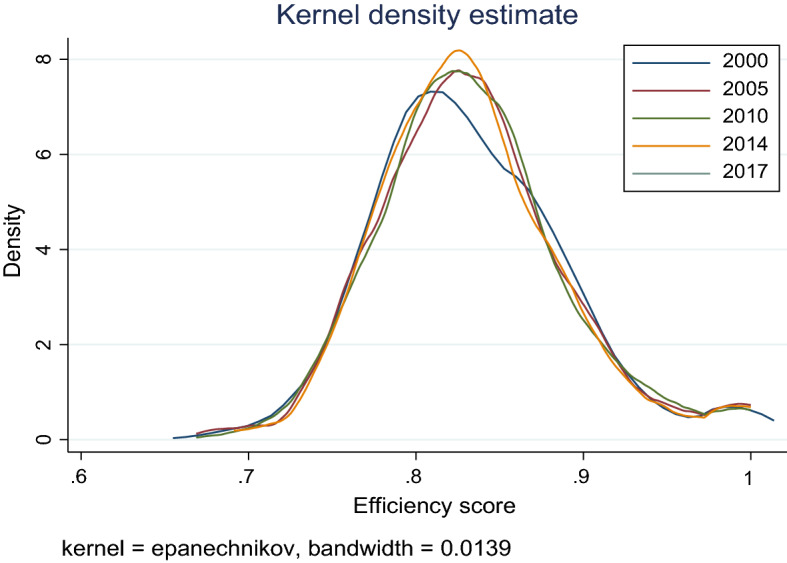
Kernel densities of efficiency scores in 2001, 2000, 2005 and 2011
In order to examine further the above result, we proceed with additional statistical tests to examine the hypothesis that equality of means is accepted for the examined period. We also apply a Friedman test for investigating alteration in ranking of different Greek schools (see Tables 4 and 5). Our test results reveal the for both tests there aren’t significant differences between the mean average performance score and the ranks of participated schools in our sample for the specific periods under examination. Thus, in full agreement to the results obtained regarding kernel density efficiency scores, the ranking and relative position of each school did not change, implying a stable allocation of Greek schools in terms of technical efficiency along the frontier.
Table 4.
Results of Mann Whitney tests concerning on the differences of technical efficiency scores
| Hypothesis tested (H0) | Criterion Value (p-value) | Decision with respect to H0 |
|---|---|---|
| Technical efficiency mean scores for Greek schools is the same for the 2000 and 2005 period |
6.687 (0.549) |
Not rejected |
| Technical efficiency mean scores for Greek schools is the same for the 2005 and 2010 period |
6.187 (0.538) |
Not rejected |
| Technical efficiency mean scores for Greek schools is the same for the 2010 and 2014 period |
8.348 (0.748) |
Not rejected |
| Technical efficiency mean scores for Greek schools is the same for the 2014 and 2017 period |
8.028 (0.698) |
Not rejected |
The Mann–Whitney test does not require the assumption of normal distributions. It shows the ranking and the relative position of each region in the examined periods
Table 5.
Results of Friedman tests concerning the rank of school’s efficiency scores between specific periods
| Hypothesis tested (H0) | Criterion value (p-value) | Decision with respect to H0 |
|---|---|---|
| Technical efficiency ranking for Greek schools is the same for the 2000 and 2005 period |
9.315 (0.749) |
Not rejected |
| Technical efficiency ranking for Greek schools is the same for the 2005 and 2010 period |
8.103 (0.838) |
Not rejected |
| Technical efficiency ranking for Greek schools is the same for the 2010 and 2014 period |
8.807 (0.788) |
Not rejected |
| Technical efficiency ranking for Greek schools is the same for the 2014 and 2017 period |
6.367 (0.654) |
Not rejected |
Adjusting for school and region’s determinants: a multilevel approach
In the second stage of our paper, we tried to explain school efficiency as have been calculated in our previous stage while taking into account clustering in school and regional level NUTS2. Thus, a two-level model is employed with school (level-1) that are embedded within Greek NUTS2 regions (level-2).
The current investigates at a first level whether some schools can be better compensated from the student final grades (Witte and Lopez-Torres 2017; Johnes et al. 2017; Cordero-Ferrera et al. 2008; Kounetas et al. 2011). Thus, a ML8 model of the form of Eq. (8) was estimated to form the base against the subsequent models. Examination of Table 6 indicates that when school characteristics and NUTS2 membership are ignored around 21.2% of the variance in students’ final grades achievements is accounted for differences among schools. More specifically the average efficiency score across schools reflected in the intercept is 0.854 while the variance component is 0.022.
Table 6.
Estimated parameters for the schools’ efficiency results
| Alternative specifications | ||||
|---|---|---|---|---|
| Explanatory variables | OLS | Tobit Model | Fractional Model | |
| School characteristics |
0.0009*** (0.000) |
0.00102*** (0.000) |
0.00213*** (0.000) |
|
|
− 0.003*** (0.005) |
− 0.001** (0.0048) |
− 0.019*** (0.0037) |
||
| Labor |
0.008*** (0.000) |
0.003*** (0.015) |
0.000*** (0.023) |
|
|
0.00001 (0.444) |
0.004 (0.356) |
0.00002 (0.465) |
||
| Scholl Facilities |
− 0.000 (0.352) |
− 0.000 (0.176) |
− 0.011 (0.277) |
|
|
0.021*** (0.000) |
.0014*** (0.003) |
0.021*** (0.000) |
||
|
0.015*** (0.045) |
.005*** (0.000) |
0.013*** (0.000) |
||
|
0.005*** (0.000) |
0.021*** (0.000) |
0.006*** (0.001) |
||
| Two-level |
0.013*** (0.004) |
0.001*** (0.000) |
0.018*** (0.000) |
|
| Random Part | ||||
|
Variance estimate (Std.error) |
Variance estimate (Std.error) |
Variance estimate (Std.error) |
||
|
125.545 (0.080) |
108.655 (0.077) |
98.912 (0.025) |
||
|
.5545 (0.104) |
4.655 (0.077) |
4.889 (0.025) |
||
|
1.545 (.000) |
0.655 (0.077) |
0.389 (0.025) |
||
| Statistics | ||||
| No. of observations | 338 | 338 | 338 | |
| No. of groups | 26 | 26 | 26 | |
| Deviance | 98,147.35 | 99,258.29 | 82,251.14 | |
| Adj. R2 | 0.1128 | – | – | |
|
Log (pseudo)likelihood Wald X2 |
− 530.24 47.69 |
− 532.698 49.05 |
− 437.19 54.88 |
|
Numbers in parentheses for the estimated coefficients correspond to the associated p-values of the estimation
As far as the coefficients of the efficiency scores are concerned, those are not actually zero but correspond to a very small number, i.e. smaller than .0001. This is captured by the symbol “ + ”
The estimation based on the reduce model allow us to provide a basic reference for comparing and interpreting more complicated models. However, following the current literature we can assume school specific residual coefficients obtained from this model would provide an indication of overall “school efficiency” (Segovia‐Gonzalez et al., 2020). As such the case we use additional variables consisting of three groups namely school characteristics, labor stuff and facilities. Therefore, these variables in the baseline equation give us something closer to the impact of school attributes from that of some major educational initiatives and public policies.9
In this direction, we have used as alternative variables capturing school’s fundamental characteristics the number of classes and the number of students per class . Number of classes was found to be positive and statistically significant for all our specifications denoting the long-term effects of school size on students’ school performance and educational outcomes (Humlum and Smith 2015). Thus, as the number of classes increases the productive efficiency of the corresponding school increases as well not allowing the creation of negative externalities through congestion effects which then reduce the students’ effectiveness and schools’ performance (Chiarello et al. 2021). According to the educational system in Greece, students are obligated to attend neighborhood schools, thus, school size is related to the number of classes. As the school size increases, the number of classes also increases.10
The importance of this variable lies in the fact that is potentially controlled since it depends on the existing educational system and reflects the socio-economic and political context of a country. Even if school size does not significantly affect school efficiency, the political dimension of this variable makes it significant to related research worldwide. In Greece, the size of the school specifies in a demographical context: large school units are found in large urban centers and small ones in rural areas with the difficulty to access. In part, due to this, we could interpret the fact that found positive and statistically significant. Thus, larger schools in urban areas are more efficient than small schools in urban areas (Coupé, et al. 2016).
Turning now our attention to number of students per class our results reveal a negative and statistically significant effect (Agasisti 2014). The specific variable appears to have an ambiguous effect on efficiency because, on the one hand, ‘crowded’ classrooms can involve less attention of teachers to students (Chiarello et al. 2021) while on the other hand cost benefit issues supports a negative effect (Hoxby 2000). More interestingly increased number of students, with a parallel increase of teachers may create peer effects on student achievements (Hoxby 2000). Our findings support the stream of the literature arguing that smaller classes have a positive effect on student achievement (i.e. Masci et al. 2018; Chiarello et al. 2021). However, in conjunction with the previous variable a question that arises is if we can find a relation between the number of classes with the number of students per class. According to Fertig and Wright (2005) the possibility to find the class size statistically significant increases as the sample increases. Another explanation for this effect arises if we consider the educational system in Greece. First, there is no prediction of class division according to students’ backgrounds. This fact does not allow us to interpret the size of classes in a similar way to Kirjavainen (2009). Moreover, Greece’s Educational system does not include a similar low as percentage disadvantage index (PD) which described by Angrist and Lavy, (1999). The manipulation of enrollments is limited, especially from 2006, the year in which the electronic system of enrollments was established. It is crucial to investigate the cases in which this number differentiates.
We must recall and refer to reforms related to the maximum of students in the class. Until 2006 the maximum number was 35. From the school year 2006- 2007 this number decreased at 30 students with the potentiality of 10% increase. Finally, from the school year 2013–2014 until today the maximum number of students per class formed at the number 27 again with the potentiality of 10% increase. Consequently, according to the educational system in Greece, class size is pure number that occurred by divisions and rounding.11 Class size is maybe the most questionable characteristic according to relevant literature (Angrist and Lavy 1999; Hanushek and Rivkin 2003; Krueger 2003; Angrist et al. 2019). In recent research, Angrist et al. (2017) were involved deeply with class size effects and enrollment manipulation near to cutoffs suggesting the decrement of the number students per class. Class size constitute a complex and significant variable in education performance. The avoidance of randomness in specifying class size and the in-depth investigation of the fundamental factors in which the class size defined, seems to be a necessity for educational system in Greece.
As it can have been seen from our first group of variables fundamental characteristics of schools influence their productive performance. However, a question of interest is whether differences in the provision of an educational level can be influenced by variable related to the stuff. Our results reveal a rather not surprising influence of additional educational stuff on school productive performance. The specific positive and statistically significant effect depicts a specific idiosyncrasy of the Greek educational system. At the end the inclusion of variable related to additional administration stuff seem to not offer more of the unexplained variation.
Finally, the educational (-in)equality in our study in terms of productive performance is examined with regard to specific school facilities (Mattar 2012; Royo and Fajardo 2020). It is an indisputable fact that school improvement takes into account the internal conditions of the school, which will determine the effectiveness of the innovative work. The internal conditions of schools refer to every single detail affecting the teaching–learning process with all necessary tools and materials, including rich libraries and additional laboratories (Mattar 2012). Technical efficiency scores are positively and statistically significant affected by the existence of science and technology laboratories (Royo and Fajardo 2020). Thus, we can argue that the availability of learning spaces other than the classrooms foster and reinforce the teaching and learning experience having an impact on schools’ performance (Murillo and Román, 2011; Mattar 2012). The specific finding can be interpreted under the fact that laboratories serve as spaces where students can engage in physical activity experiment and rehearse, having access to unique and diverse information through technology networks. In this research, additionally, formed recommendations for the improvement of less efficient schools via a training program of science teachers. Even that the use of science laboratories in Greece does not reflect the STEM (science, technology, engineering and mathematics) context, the existence of science laboratory improves the efficiency of schools.
Having established that there are indeed significant differences in Greek schools’ efficiency due to school specific attributes, the next step is to try to examine factors that may influence in a higher level. However, this is not an easy task. Because of the low number of degrees of freedom in the second level, we did not introduce more than two explanatory variables at a time. We control for region where the school is located (Ainsworth 2002) and the degree of urbanization and differences in income level (Naper 2010; Alberta Oliveira and Santos 2005), which have been indicated to play a role in educational performance by incorporating in our model GDP per capita (Cordero-Ferrera et al. 2017; Hanushek and Luque 2003) as a two-level variable. The specific variable is used as a proxy of the level of regional development capturing diversity between different regions (Chiariello et al. 2021; Cordero-Ferrera et al. 2017). As expected, at a second level NUTS2 gross domestic product has a positive effect, with a very small coefficient, on school efficiency results confirming the hypothesis that economic characteristics of the region that each school is located significantly impacts its performance (Ray, 1999; Ainsworth 2002; Cordero-Ferrera et al. 2017). A possible explanation arises in the context of richer regions possibly enjoy better educational facilities (Chiariello et al. 2021). In addition, higher in GDP per capita regions creates better livelier environments that attract more capable and equipped teachers. The specific finding can be also explained due to the disparities of economic characteristics of the regions and different financial schools’ resources misallocation (Ray 1999).
Of course, one could argue that schools’ efficiency performance can be affected by additional socio-economic background/characteristics of the student in each class. However, the structure of our model refers to school as the decision-making unit under investigation, while the unavailability of this type of data, for the Greek case, makes this counterargument very difficult to be tested.
Concluding remarks
The importance for the performance assessment of institutional mechanism of “schooling” as the main resource of countries’ human capital accumulation is not newfound. Many studies have provided useful insights in measuring the performance of schools revealing as one of the hottest topics noting specific attributes. From the one hand school’s efficiency performance is considered as important measure of educational systems while, on the other hand, serious reforms have been applied, with the corresponding subsequent cost, to adjust educational system in a globalized economy with integrated labour markets.
In the educational system of Greece, reforms with completely different extent and characteristics have been implemented (i.e. abolition of the school inspectorate, Greek text in modern Greek translations e.t.c). These reforms appear, at first sight, to be substantial and comprehensive in that they extend over a considerable cross-section of the educational system while tries to harmonize with Europe best practices. However, many authors argue that chronic system pathologies (shadow education phenomena), weaknesses and inefficiencies reveal persistence characteristics after the implementation of the specific reforms while consider the recent Greek financial crisis as a factor of deterioration and deceleration.
To examine schools ‘efficiency performance, factors that affects and the role of reforms we employ a dataset with ample heterogeneity, as we use data from a unique questionnaire proposed from Hellenic Statistical Authority for 643 schools over an eighteen-year period, specifically from 2000 to 2017. We follow a NUTS2 regions hierarchy approach, at the first stage, using bootstrap DEA approach to calculate the corresponding efficiency scores. In addition, we employ a multilevel approach to ascertain the share of each school’s educational attainment that can be attributed to the various variables measured at two levels; that is school (level-1) and NUTS2 region that each school belongs (level-2).
Our results reveal several interesting issues. First, we found that, in total the impact of the corresponding reforms is rather small except for the 2000 reforms policy. We found significant similarities for the selective years after the reform implementation according to their school performance in terms of efficiency. Second, while rural areas seem to perform slightly better from average but with significant variation (Johnes and Virmani 2020), NUTS2 regions at the periphery, Islands and specific non-rural areas performs better and constitutes the champions group. Moreover, the most populated NUTS2 region in Greece appear to have better performance but are less affected by reforms. Third, a substantial room for significant efficiency improvement up to 20% has been detected without change in the inputs. Next, we notice that the influence of the contextual factors included in our model appears to be consistent with previous evidence in the literature on the determinants of efficiency and school results. In particular, we observe a favourable effect for physics and science laboratories and class size and a significant negative effect for the variable of student per class. In addition, at a second level the gross domestic product per capita of the NUTS2 region that each school belongs positively affects its efficiency performance.
Further research work is required to support the findings documented herein. The heterogeneity of schools’ efficiency in NUTS2 regions suggests that here are other important factors that impact school unit’s efficiency that must be specified. For this more complete information is needed but such a data set is not available. Given the limitations of the examined data, further research should focus on the employment of some additional contextual factors at student level, since some previous studies have suggested that such variables might have a substantial impact on efficiency measures. In addition, inconsistencies regarding the effect of shadow education and combination of the results of final exams should be also carefully considered. Finally, we believe that some interesting questions about the impact of the recent pandemic arise in relation to school’s productive performance.
Declarations
Conflict of interest
The authors declare there is no conflict of interests and the views expressed herein are solely their own and not necessarily of the University of Patras.
Footnotes
Average students’ performance in science, mathematics and reading are below the OECD average (Publications—PISA (https://oecd.org/)).
We could call these rules institutional practices.
Given standard assumption on S the input distance function is no increasing in x and is no decreasing, homogeneous of degree + 1 and convex in y,
Θ measures the radial distance between the input-output observation and the technology frontier within the production set.
Additional information has been added via administrative sources (i.e.my school database by the Greek Ministry of Education).
The data are validated by means of a series of checks from EL.STAT. The control of the questionnaires encompasses completeness, accuracy and logical checks at the level of each school unit. The main variables are compared with the variables from other statistical sources. Primary data are cross-checked with the corresponding data of the previous year.
Benchmarking package in R has been used to carry out our estimations.
All models were estimated using STATA 16.0 version.
Please denote that considering the bounded nature of efficiency results we also report three alternative specifications (OLS, Tobit and Fractional model). The results don not differ significantly.
We must mention that the literature on the effect of the specific variable provides, however, contradictory results. For example, Driscoll et al., (2003) investigating the impact of school size in students’ performance in California indicated a negative correlation. In contrast, Kantabutra and Tang, (2006) focusing on rural–urban characteristic indicated that in both areas school size had positive effect in students’ performance while Newman et al., (2006) in a cross-country study revealed the complexity of school size effects, suggesting the pursuit of the optimal school size. In the same direction, Bloom et al. (2010) analyzing educational reform in New York City after 2002, Schwartz et al., (2013) that examined the same reform concluded that new small schools increased students’ educational outcomes and Humlum and Smith (2015) indicated a positive effect on students’ performance and graduation rate. The specific finding for the Greek secondary schools’ case is written on the side of the studies that support the positive relationship between the two variables.
If y is the number of students in a specific grade, n the maximum number of students in the class then:
If
If
Where k is the number of classes.
The number of students per class is given by .
Publisher's Note
Springer Nature remains neutral with regard to jurisdictional claims in published maps and institutional affiliations.
References
- Abbott M, Doucouliagos C. Competition and efficiency: overseas students and technical efficiency in Australian and New Zealand universities. Educ Econ. 2009;17(1):31–57. doi: 10.1080/09645290701773433. [DOI] [Google Scholar]
- Acemoglu D, Robinson JA. De facto political power and institutional persistence. American Economic Review. 2006;96(2):325–330. doi: 10.1257/000282806777212549. [DOI] [Google Scholar]
- Ainsworth JW. Why does it take a village? The mediation of neighborhood effects on educational achievement. Soc Forces. 2002;81(1):117–152. doi: 10.1353/sof.2002.0038. [DOI] [Google Scholar]
- Aitkin M, Longford N. Statistical modelling issues in school effectiveness studies. J R Stat Soc Ser A (General) 1986;149(1):1–26. doi: 10.2307/2981882. [DOI] [Google Scholar]
- Agasisti T. Performances and spending efficiency in higher education: a European comparison through non-parametric approaches. Educ Econ. 2011;19(2):199–224. doi: 10.1080/09645290903094174. [DOI] [Google Scholar]
- Agasisti T, Johnes G. Efficiency, costs, rankings and heterogeneity: the case of US higher education. Stud High Educ. 2015;40(1):60–82. doi: 10.1080/03075079.2013.818644. [DOI] [Google Scholar]
- Agasisti T. The efficiency of Italian secondary schools and the potential role of competition: a data envelopment analysis using OECD-PISA2006 data. Educ Econ. 2013;21(5):520–544. doi: 10.1080/09645292.2010.511840. [DOI] [Google Scholar]
- Alexander WRJ, Haug AA, Jaforullah M. A two-stage double-bootstrap data envelopment analysis of efficiency differences of New Zealand secondary schools. J Prod Anal. 2010;34:99–110. doi: 10.1007/s11123-010-0173-3. [DOI] [Google Scholar]
- Alberta Oliveira M, Santos C. Assessing school efficiency in Portugal using FDH and bootstrapping. Appl Econ. 2005;37(8):957–968. doi: 10.1080/00036840500061095. [DOI] [Google Scholar]
- Andersen SC. The impact of public management reforms on student performance in Danish schools. Public Admin. 2008;86(2):541–558. doi: 10.1111/j.1467-9299.2008.00717.x. [DOI] [Google Scholar]
- Angrist JD, Lavy V. Using Maimonides' rule to estimate the effect of class size on scholastic achievement. Q J Econ. 1999;114(2):533–575. doi: 10.1162/003355399556061. [DOI] [Google Scholar]
- Angrist JD, Lavy V, Leder-Luis J, Shany A. Maimonides' rule redux. Am Econ Rev Insights. 2019;1(3):309–324. doi: 10.1257/aeri.20180120. [DOI] [Google Scholar]
- Angrist JD, Battistin E, Vuri D. In a small moment: class size and moral hazard in the Italian Mezzogiorno. Am Econ J Appl Econ. 2017;9(4):216–49. doi: 10.1257/app.20160267. [DOI] [Google Scholar]
- Aparicio J, Perelman S, Santín D. Comparing the evolution of productivity and performance gaps in education systems through DEA: an application to Latin American countries. Oper Res. 2020 doi: 10.1007/s12351-020-00578-2. [DOI] [Google Scholar]
- Archer M. Social origins of educational systems. Routledge. 2013 doi: 10.4324/9780203584002. [DOI] [Google Scholar]
- Baker DP, Akiba M, LeTendre GK, Wiseman AW. Worldwide shadow education: outside-school learning, institutional quality of schooling, and cross-national mathematics achievement. Edu Eval Policy Anal. 2001;23(1):1–17. doi: 10.3102/2F01623737023001001. [DOI] [Google Scholar]
- Baker D. Institutional change in education: evidence from cross-national comparisons. In: Meyer HD, Rowan B, editors. The new institutionalism in education. Albany: SUNY Press; 2006. pp. 163–186. [Google Scholar]
- Bagheri M, Ebrahimnejad A, Razavyan S, Hosseinzadeh LF, Malekmohammadi N. Fuzzy arithmetic DEA approach for fuzzy multi-objective transportation problem. Oper Res. 2020 doi: 10.1007/s12351-020-00592-4. [DOI] [Google Scholar]
- Barnett RR, Glass JC, Snowdon RI, Stringer KS. Size, performance and effectiveness: Cost-constrained measures of best-practice performance and secondary-school size. Educ Econ. 2002;10(3):291–311. doi: 10.1080/09645290210127516. [DOI] [Google Scholar]
- Bessent AM, Bessent EW. Determining the comparative efficiency of schools through data envelopment analysis. Edu Admin Quart. 1980;16(2):57–75. doi: 10.1177/2F0013161X8001600207. [DOI] [Google Scholar]
- Blackburn V, Brennan S, Ruggiero J. Measuring efficiency in Australian schools: a preliminary analysis. Socioecon Plann Sci. 2014;48(1):4–9. doi: 10.1016/j.seps.2013.08.002. [DOI] [Google Scholar]
- Blatchford P, Webster R. Classroom contexts for learning at primary and secondary school: class size, groupings, interactions and special educational needs. Br Edu Res J. 2018;44(4):681–703. doi: 10.1002/berj.3454. [DOI] [Google Scholar]
- Bloom HS, Thompson SL, and Unterman R (2010) Transforming the high school experience: How New York City’s new small schools are boosting student achievement and graduation rates. MDRC, June. https://ssrn.com/abstract=1786966
- Blundell R, Dearden L, Meghir C, Sianesi B. Human capital investment: the returns from education and training to the individual, the firm and the economy. Fisc Stud. 1999;20(1):1–23. doi: 10.1111/j.1475-5890.1999.tb00001.x. [DOI] [Google Scholar]
- Borge L-E, Naper LR. Efficiency potential and efficiency variation in Norwegian lower secondary schools. FinanzArchiv/Public Finan Anal. 2006;62(2):221–249. doi: 10.1628/001522106X120677. [DOI] [Google Scholar]
- Bradley S, Johnes G, Millington J. The effect of competition on the efficiency of secondary schools in England. Eur J Oper Res. 2001;135(3):545–568. doi: 10.1016/S0377-2217(00)00328-3. [DOI] [Google Scholar]
- Bray TM (2011) The challenge of shadow education: private tutoring and its implications for policy makers in the European Union. European Commission
- Bray M. Shadow education in Europe: growing prevalence, underlying forces, and policy implications. ECNU Rev Edu. 2021;4(3):442–475. doi: 10.1177/2F2096531119890142. [DOI] [Google Scholar]
- Brunello G, Checchi D. School quality and family background in Italy. Econ Educ Rev. 2005;24(5):563–577. doi: 10.1016/j.econedurev.2004.09.001. [DOI] [Google Scholar]
- Burgess SM (2016) Human capital and education: the state of the art in the economics of education. Available at SSRN 2769193. https://dx.doi.org/10.2139/ssrn.2769193
- Burgess S, and Sievertsen HH (2020) Schools, skills, and learning: the impact of COVID-19 on education. VoxEu Org 1(2)
- Burkhead J, Fox TG, and Holland JW (1967) Input and output in large-city high schools, Syracuse University Press
- Byun SY, Chung HJ, and Baker DP (2018) Global patterns of the use of shadow education: student, family, and national influences. In: Research in the sociology of education. Emerald Publishing Limited, pp. 71–105
- Chan C. Crossing institutional borders: exploring pre-service teacher education partnerships through the lens of border theory. Teach Teach Edu. 2019;86:102893. doi: 10.1016/j.tate.2019.102893. [DOI] [Google Scholar]
- Charnes A, Cooper WW, Rhodes E. Measuring the efficiency of decision making units. Eur J Oper Res. 1978;2:429–444. doi: 10.1016/0377-2217(78)90138-8. [DOI] [Google Scholar]
- Chiariello V, Rotondo F, Scalera D. Efficiency in education: primary and secondary schools in Italian regions. Region Stud. 2021 doi: 10.1080/00343404.2021.2005245. [DOI] [Google Scholar]
- Coase R. The new institutional economics. Am Econ Rev. 1998;88(2):72–74. [Google Scholar]
- Coleman JS. Equality of educational opportunity. Integr Edu. 1968;6(5):19–28. doi: 10.1080/0020486680060504. [DOI] [Google Scholar]
- Cools W, De Fraine B, Van den Noortgate W, Onghena P. Multilevel design efficiency in educational effectiveness research. Sch Eff Sch Improv. 2009;20(3):357–373. doi: 10.1080/09243450902850176. [DOI] [Google Scholar]
- Cook WD, Seiford LM. Data envelopment analysis (DEA)–Thirty years on. Eur J Oper Res. 2009;192(1):1–17. doi: 10.1016/j.ejor.2008.01.032. [DOI] [Google Scholar]
- Cordero-Ferrera JM, Pedraja-Chaparro F, Salinas-Jiménez J. Measuring efficiency in education: an analysis of different approaches for incorporating non-discretionary inputs. Appl Econ. 2008;40(10):1323–1339. doi: 10.1080/00036840600771346. [DOI] [Google Scholar]
- Cordero-Ferrera JM, Santín D, Simancas R. Assessing European primary school performance through a conditional nonparametric model. J Oper Res Soc. 2017;68(4):364–376. doi: 10.1057/jors.2015.42. [DOI] [Google Scholar]
- CPT (2020) Sistema dei Conti Pubblici Territoriali. Agenzia perCoupé T, Olefir A, and Alonso JD (2016) Class size, school size and the size of the school network. Edu Econ, 24(3): 329-351. Doi: 10.1080/09645292.2015.1015405
- Crespo-Cebada E, Pedraja-Chaparro F, Santín D. Does school ownership matter? An unbiased efficiency comparison for regions of Spain. J Prod Anal. 2014;41(1):153–172. doi: 10.1007/s11123-013-0338-y. [DOI] [Google Scholar]
- De Witte K, López-Torres L. Efficiency in education: a review of literature and a way forward. J Oper Res Soc. 2017;68(4):339–363. doi: 10.1057/jors.2015.92. [DOI] [Google Scholar]
- Driscoll D, Halcoussis D, Svorny S. School district size and student performance. Econ Edu Rev. 2003;22(2):193–201. doi: 10.1016/S0272-7757(02)00002-X. [DOI] [Google Scholar]
- Ebrahimnejad A, Tavana M, Santos-Arteaga FJ. An integrated data envelopment analysis and simulation method for group consensus ranking. Math Comput Simul. 2016;119:1–17. doi: 10.1016/j.matcom.2015.08.022. [DOI] [Google Scholar]
- Ebrahimnejad A, Lotfi FH. Equivalence relationship between the general combined-oriented CCR model and the weighted minimax MOLP formulation. J King Saud Univ-Sci. 2012;24(1):47–54. doi: 10.1016/j.jksus.2010.08.007. [DOI] [Google Scholar]
- Ebrahimnejad A, Tavana M. An interactive MOLP method for identifying target units in output-oriented DEA models: the NATO enlargement problem. Measurement. 2014;52:124–134. doi: 10.1016/j.measurement.2014.03.016. [DOI] [Google Scholar]
- Enders J, De Boer H, Weyer E. Regulatory autonomy and performance: the reform of higher education re-visited. High Educ. 2013;65(1):5–23. doi: 10.1007/s10734-012-9578-4. [DOI] [Google Scholar]
- Fare R, Grosskopf S, Norris M, Zhongyang Z, (1994) Productivity growth, technical progress, and efficiency change in industrialized countries. Am Econ Rev, 66–83
- Fertig M, Wright RE. School quality, educational attainment and aggregation bias. Econ Lett. 2005;88(1):109–114. doi: 10.1016/j.econlet.2004.12.028. [DOI] [Google Scholar]
- Gadanakis Y, Areal FJ. Accounting for rainfall and the length of growing season in technical efficiency analysis. Oper Res Int J. 2020;20(4):2583–2608. doi: 10.1007/s12351-018-0429-7. [DOI] [Google Scholar]
- Gamson DA, McDermott KA, Reed DS. The elementary and secondary education act at fifty: aspirations, effects, and limitations. RSF Russell Sage Found J Soc Sci. 2015;1(3):1–29. doi: 10.7758/rsf.2015.1.3.01. [DOI] [Google Scholar]
- Giménez V, Thieme C, Prior D, Tortosa-Ausina E. An international comparison of educational systems: a temporal analysis in presence of bad outputs. J Prod Anal. 2017;47(1):83–101. doi: 10.1007/s11123-017-0491-9. [DOI] [Google Scholar]
- Goldstein H, Yang M, Omar R, Turner R, Thompson S. Meta-analysis using multilevel models with an application to the study of class size effects. J Roy Stat Soc: Ser C (Appl Stat) 2000;49(3):399–412. doi: 10.1111/1467-9876.00200. [DOI] [Google Scholar]
- Goldstein H (2003) Multilevel modelling of educational data. In: Methodology and epistemology of multilevel analysis, pp. 25–42. Springer: Dordrecht
- Grewenig E, Lergetporer P, Werner K, Woessmann L, Zierow L. COVID-19 and educational inequality: How school closures affect low-and high-achieving students. Eur Econ Rev. 2021;140:103920. doi: 10.1016/j.euroecorev.2021.103920. [DOI] [PMC free article] [PubMed] [Google Scholar]
- Haelermans C, De Witte K. The role of innovations in secondary school performance–evidence from a conditional efficiency model. Eur J Oper Res. 2012;223(2):541–549. doi: 10.1016/j.ejor.2012.06.030. [DOI] [Google Scholar]
- Haelermans C, Ruggiero J. Estimating technical and allocative efficiency in the public sector: a nonparametric analysis of Dutch schools. Eur J Oper Res. 2013;227(1):174–181. doi: 10.1016/j.ejor.2012.12.004. [DOI] [Google Scholar]
- Harrell C, Debreu G. Theory of value: an axiomatic analysis of economic equilibrium. South Econ J. 1960;27(2):149–150. doi: 10.2307/139425. [DOI] [Google Scholar]
- Halkos GE, and Tzeremes NG (2010) Measuring regional economic efficiency: the case of Greek NUTS2 regions. Ann Reg Sci 45(3)
- Hanushek EA (1968) The education of negroes and whites (Doctoral dissertation, Massachusetts Institute of Technology)
- Hanushek EA. Conceptual and empirical issues in the estimation of educational production functions. J Hum Resour. 1979 doi: 10.2307/145575. [DOI] [Google Scholar]
- Hanushek EA. The economics of schooling: production and efficiency in public schools. J Econ Liter. 1986;24(3):1141–1177. [Google Scholar]
- Hanushek EA, Lori LT. Alternative assessments of the performance of schools: measurement of state variations in achievement. J Hum Resour. 1990;25(2):179–201. doi: 10.2307/145753. [DOI] [Google Scholar]
- Hanushek EA, and Rivkin SG (2003) Does public school competition affect teacher quality?. In: The economics of school choice, pp. 23–48. University of Chicago Press
- Hanushek EA, Kain JF, Markman JM, Rivkin SG. Does peer ability affect student achievement? J Appl Economet. 2003;18(5):527–544. doi: 10.1002/jae.741. [DOI] [Google Scholar]
- Hanushek EA, Luque JA. Efficiency and equity in schools around the world. Econ Educ Rev. 2003;22(5):481–502. doi: 10.1016/S0272-7757(03)00038-4. [DOI] [Google Scholar]
- Hanushek EA, Rivkin SG. Teacher quality. Handbook Econ Educ. 2006;2:1051–1078. doi: 10.1016/S1574-0692(06)02018-6. [DOI] [Google Scholar]
- Haug AA, Blackburn VC. Government secondary school finances in New South Wales: accounting for students’ prior achievements in a two-stage DEA at the school level. J Prod Anal. 2017;48(1):69–83. doi: 10.1007/s11123-017-0502-x. [DOI] [Google Scholar]
- Hill PW, Rowe KJ. Multilevel modelling in school effectiveness research. Sch Eff Sch Improv. 1996;7(1):1–34. doi: 10.1080/0924345960070101. [DOI] [Google Scholar]
- Hoxby C (2000) Peer effects in the classroom: learning from gender and race variation (Working Paper No. 7867). National Bureau of Economic Research (NBER)
- Humlum MK, Smith N. Long-term effects of school size on students’ outcomes. Econ Educ Rev. 2015;45:28–43. doi: 10.1016/j.econedurev.2015.01.003. [DOI] [Google Scholar]
- Ifanti AA. Policy making, politics and administration in education in Greece. Edu Manag Admin. 1995;23(4):271–278. doi: 10.1177/0263211X9502300407. [DOI] [Google Scholar]
- Ifanti A (2011) Educational policy and planning for a modern school. Livanis Publications (in Greek), Athens (2011)
- Jackson CK. Teacher quality at the high school level: the importance of accounting for tracks. J Law Econ. 2014;32(4):645–684. [Google Scholar]
- James E, King EM, Suryadi A. Finance, management, and costs of public and private schools in Indonesia. Econ Educ Rev. 1996;15(4):387–398. doi: 10.1016/S0272-7757(96)00035-0. [DOI] [Google Scholar]
- Johnes J. Measuring efficiency: a comparison of multilevel modelling and data envelopment analysis in the context of higher education. Bull Econ Res. 2006;58(2):75–104. doi: 10.1111/j.0307-3378.2006.00238.x. [DOI] [Google Scholar]
- Johnes G, Virmani S. The efficiency of private and public schools in urban and rural areas: moving beyond the development goals. Int Trans Oper Res. 2020;27(4):1869–1885. doi: 10.1111/itor.12658. [DOI] [Google Scholar]
- Johnes J, Portela M, Thanassoulis E. Efficiency in education. J Oper Res Soc. 2017;68(4):331–338. doi: 10.1057/s41274-016-0109-z. [DOI] [Google Scholar]
- Kantabutra S, Tang JC. Urban-rural and size effects on school efficiency: the case of Northern Thailand. Leadersh Policy Sch. 2006;5(4):355–377. doi: 10.1080/15700760600968416. [DOI] [Google Scholar]
- Kassotakis M, and Verdis A (2013) Shadow education in Greece: characteristics, consequences and eradication efforts. In: Private tutoring across the Mediterranean (pp. 93–113). Brill
- Kounetas K, Papathanassopoulos F. How efficient are Greek hospitals? A case study using a double bootstrap DEA approach. Eur J Health Econ. 2013;14(6):979–994. doi: 10.1007/s10198-012-0446-z. [DOI] [PubMed] [Google Scholar]
- Kounetas K, Anastasiou A, Mitropoulos P, Mitropoulos I. Departmental efficiency differences within a Greek university: an application of a DEA and Tobit analysis. Int Trans Oper Res. 2011;18(5):545–559. doi: 10.1111/j.1475-3995.2011.00813.x. [DOI] [Google Scholar]
- Kounetas K, Napolitano O. Modeling the incidence of international trade on Italian regional productive efficiency using a meta-frontier DEA approach. Econ Model. 2018;71:45–58. doi: 10.1016/j.econmod.2017.11.020. [DOI] [Google Scholar]
- Krassel KF, Heinesen E. Class-size effects in secondary school. Educ Econ. 2014;22(4):412–426. doi: 10.1080/09645292.2014.902428. [DOI] [Google Scholar]
- Krieg JM. Teacher quality and attrition. Econ Educ Rev. 2006;25(1):13–27. doi: 10.1016/j.econedurev.2004.09.004. [DOI] [Google Scholar]
- Kirjavainen T, and Loikkanen H (1996) Efficiency differences of finnish senior secondary schools: an application of DEA and Tobit-analysis (No. 570). ETLA Discussion Papers. Doi: 10.1016/S0272-7757(97)00048-4
- Kirjavainen T (2009) Essays on the efficiency of schools and student achievement. Helsinki School of Economics
- Krueger AB. Economic considerations and class size. Econ J. 2003;113(485):F34–F63. doi: 10.1111/1468-0297.00098. [DOI] [Google Scholar]
- Lee S, Shouse RC. The impact of prestige orientation on shadow education in South Korea. Sociol Educ. 2011;84(3):212–224. doi: 10.1177/2F0038040711411278. [DOI] [Google Scholar]
- Leithwood K, Jantzi D. A review of empirical evidence about school size effects: a policy perspective. Rev Educ Res. 2009;79(1):464–490. doi: 10.3102/0034654308326158. [DOI] [Google Scholar]
- Levin HM. Measuring efficiency in educational production. Public Financ Quart. 1974;2(1):3–24. doi: 10.1177/2F109114217400200101. [DOI] [Google Scholar]
- Lucas RE., Jr On the mechanics of economic development. J Monet Econ. 1988;22(1):3–42. doi: 10.1016/0304-3932(88)90168-7. [DOI] [Google Scholar]
- Mammadov R, Çimen I. Optimizing teacher quality based on student performance: a data envelopment analysis on PISA and TALIS. Int J Instr. 2019;12(4):767–788. [Google Scholar]
- Mancebón MJ, Calero J, Choi Á, Ximénez-de-Embún DP. The efficiency of public and publicly subsidized high schools in Spain: evidence from PISA-2006. J Oper Res Soc. 2012;63(11):1516–1533. doi: 10.1057/jors.2011.156. [DOI] [Google Scholar]
- Margaritis SG, Tsamadias CP, Argyropoulos EE. Investigating the relative efficiency and productivity change of upper secondary schools: the case of schools in the region of central Greece. J Knowl Econ. 2022;13(1):128–160. doi: 10.1007/s13132-020-00698-2. [DOI] [Google Scholar]
- Masci C, De Witte K, Agasisti T. The influence of school size, principal characteristics and school management practices on educational performance: an efficiency analysis of Italian students attending middle schools. Socioecon Plann Sci. 2018;61:52–69. doi: 10.1016/j.seps.2016.09.009. [DOI] [Google Scholar]
- Mattar DM. Factors affecting the performance of public schools in Lebanon. Int J Educ Dev. 2012;32(2):252–263. doi: 10.1016/j.ijedudev.2011.04.001. [DOI] [Google Scholar]
- Mazzonna F. The long-lasting effects of family background: a European cross-country comparison. Econ Educ Rev. 2014;40:25–42. doi: 10.1016/j.econedurev.2013.11.010. [DOI] [Google Scholar]
- Meyer JW, Rowan B. Institutionalized organizations: formal structure as myth and ceremony. Am J Sociol. 1977;83(2):340–363. doi: 10.1086/226550. [DOI] [Google Scholar]
- Meyer JW. The effects of education as an institution. Am J Sociol. 1977;83(1):55–77. doi: 10.1086/226506. [DOI] [Google Scholar]
- Meyer HD, and Rowan B (2006) Institutional analysis and the study of education. The new institutionalism in education, pp. 1–13
- Moghaddas Z, Amirteimoori A, Kazemi MR. Selective proportionality and integer-valued data in DEA: an application to performance evaluation of high schools. Oper Res. 2022;22:3435–3459. [Google Scholar]
- Mori I, Baker D. The origin of universal shadow education: What the supplemental education phenomenon tells us about the postmodern institution of education. Asia Pac Educ Rev. 2010;11(1):36–48. doi: 10.1007/s12564-009-9057-5. [DOI] [Google Scholar]
- Moghaddas Z, Amirteimoori A, Kazemi Matin R. Selective proportionality and integer-valued data in DEA: an application to performance evaluation of high schools. Oper Res. 2022 doi: 10.1007/s12351-022-00692-3. [DOI] [Google Scholar]
- Murillo-Zamorano LR. Economic efficiency and frontier techniques. J Econ Surv. 2004;18(1):33–77. doi: 10.1111/j.1467-6419.2004.00215.x. [DOI] [Google Scholar]
- Murillo FJ, Román M. School infrastructure and resources do matter: analysis of the incidence of school resources on the performance of Latin American students. Sch Eff Sch Improv. 2011;22(1):29–50. doi: 10.1080/09243453.2010.543538. [DOI] [Google Scholar]
- Myrdal G. Institutional economics. J Econ Issues. 1978;12(4):771–783. doi: 10.1080/00213624.1978.11503577. [DOI] [Google Scholar]
- Naper LR. Teacher hiring practices and educational efficiency. Econ Educ Rev. 2010;29(4):658–668. doi: 10.1016/j.econedurev.2009.11.002. [DOI] [Google Scholar]
- Newman M, Garrett Z, Elbourne D, Bradley S, Noden P, Taylor J, West A. Does secondary school size make a difference?: a systematic review. Educ Res Rev. 2006;1(1):41–60. doi: 10.1016/j.edurev.2006.03.001. [DOI] [Google Scholar]
- North DC. Towards a theory of institutional change. Quart Rev Econ Bus. 1991;31(4):3–12. [Google Scholar]
- North DC. The new institutional economics and development. Econ Hist. 1993;9309002:1–8. [Google Scholar]
- OECD (2018) Education for a bright future 1n Greece. OECD, available at: OECD iLibrary | The Greek education system in context (oecd-ilibrary.org)
- Pedraja-Chaparro F, Salinas-Jimenez J. An assessment of the efficiency of Spanish courts using DEA. Appl Econ. 1996;28(11):1391–1403. doi: 10.1080/000368496327651. [DOI] [Google Scholar]
- Peters BG (2022) Institutional theory. In: Handbook on theories of governance, pp. 323–335. Edward Elgar Publishing
- Podinovski VV, Ismail I, Bouzdine-Chameeva T, Zhang W. Combining the assumptions of variable and constant returns to scale in the efficiency evaluation of secondary schools. Eur J Oper Res. 2014;239(2):504–513. doi: 10.1016/j.ejor.2014.05.016. [DOI] [Google Scholar]
- Portela MCAS, Thanassoulis E. Decomposing school and school-type efficiency. Eur J Oper Res. 2001;132(2):357–373. doi: 10.1016/S0377-2217(00)00157-0. [DOI] [Google Scholar]
- Psacharopoulos G, Papakonstantinou G. The real university cost in a “free” higher education country. Econ Educ Rev. 2005;24(1):103–108. doi: 10.1016/j.econedurev.2004.01.003. [DOI] [Google Scholar]
- Queiroz MVAB, Sampaio RMB, Sampaio LMB. Dynamic efficiency of primary education in Brazil: socioeconomic and infrastructure influence on school performance. Socio-Econ Plan Sci. 2020;70:1007. doi: 10.1016/j.seps.2019.100738. [DOI] [Google Scholar]
- Rasbash J, Goldstein H. Efficient analysis of mixed hierarchical and cross-classified random structures using a multilevel model. J Edu Behav Stat. 1994 doi: 10.2307/1165397. [DOI] [Google Scholar]
- Ray SC. Measuring scale efficiency from a translog production function. J Prod Anal. 1999;11:183–194. doi: 10.1023/A:1007792201696. [DOI] [Google Scholar]
- Reimers FM (2020) Audacious education purposes: How governments transform the goals of education systems (p. 250). Springer
- Richter R (2015) New economic sociology and new institutional economics. In: Essays on new institutional economics, pp. 51–75. Springer: Cham
- Robertson FW. Economies of scale for large school districts: a national study with local implications. Soc Sci J. 2007;44(4):620–629. doi: 10.1016/j.soscij.2007.10.005. [DOI] [Google Scholar]
- Romer PM. Endogenous technological change. J Polit Econ. 1990;98(5):71–102. doi: 10.1086/261725. [DOI] [Google Scholar]
- Royo CC, Fajardo MTM. Using DEA to evaluate the efficiency of public high schools for STEM offering. Am J Edu Res. 2020;8(3):155–161. doi: 10.12691/education-8-3-5. [DOI] [Google Scholar]
- Rumberger RW, and Palardy GJ (2004) Multilevel models for school effectiveness research. In: Handbook of quantitative methodology for the social sciences, pp. 235–258
- Schultz TW. Capital formation by education. J Polit Econ. 1960;68(6):571–583. doi: 10.1086/258393. [DOI] [Google Scholar]
- Schultz TW. Investment in human capital. Am Econ Rev. 1961;51(1):1–17. [Google Scholar]
- Schultz TW. The rate of return in allocating investment resources to education. J Hum Resour. 1967;2(3):293–309. doi: 10.2307/144836. [DOI] [Google Scholar]
- Schultz TW. Institutions and the rising economic value of man. Am J Agr Econ. 1968;50(5):1113–1122. doi: 10.2307/1237297. [DOI] [Google Scholar]
- Schleicher A (2019) PISA 2018: insights and interpretations. OECD Publishing
- Schwartz AE, Stiefel L, Wiswall M. Do small schools improve performance in large, urban districts? Causal evidence from New York City. J Urban Econ. 2013;77:27–40. doi: 10.1016/j.jue.2013.03.008. [DOI] [Google Scholar]
- Segovia-Gonzalez MM, Dominguez C, Contreras I. An assessment of the efficiency of Spanish schools: evaluating the influence of the geographical, managerial, and socioeconomic features. Int Trans Oper Res. 2020;27(4):1845–1868. doi: 10.1111/iter.12711. [DOI] [Google Scholar]
- Simar L, Wilson PW. Estimation and inference in two-stage, semi-parametric models of production processes. J Econ. 2007;136(1):31–64. doi: 10.1016/j.jeconom.2005.07.009. [DOI] [Google Scholar]
- Simar L, Wilson PW, (1999) Of course we can bootstrap dea scores! but does it mean anything? Logic trumps wishful thinking. J Prod Anal 93–97
- Simar L, Wilson PW. Sensitivity analysis of efficiency scores: How to bootstrap in nonparametric frontier models. Manage Sci. 1998;44(1):49–61. doi: 10.1287/mnsc.44.1.49. [DOI] [Google Scholar]
- Simar L, Wilson PW. Non-parametric tests of returns to scale. Eur J Oper Res. 2002;139(1):115–132. doi: 10.1016/S0377-2217(01)00167-9. [DOI] [Google Scholar]
- Smirlis YG, Maragos EK, Despotis DK. Data envelopment analysis with missing values: an interval DEA approach. Appl Math Comput. 2006;177(1):1–10. doi: 10.1016/j.amc.2005.10.028. [DOI] [Google Scholar]
- Soteriou AC, Karahanna E, Papanastasiou C, Diakourakis MS. Using DEA to evaluate the efficiency of secondary schools: the case of Cyprus. Int J Educ Manag. 1998 doi: 10.1108/09513549810204441. [DOI] [Google Scholar]
- Sotiriadis D, Menexes G, Tsamadias C. Investigating the efficiency of senior secondary schools: evidence from schools in the Greek region of Central Macedonia. Int J Bus Econ Sci Appl Res. 2018;11(2):36–43. [Google Scholar]
- Summers AA, Wolfe BL. Do schools make a difference? Am Econ Rev. 1977;67(4):639–652. [Google Scholar]
- Stavropoulos S, Skuras D. Firm profitability and agglomeration economies: an elusive relationship. Tijdschr Econ Soc Geogr. 2016;107(1):66–80. doi: 10.1111/tesg.12125. [DOI] [Google Scholar]
- Stevenson DL, Baker DP. Shadow education and allocation in formal schooling: transition to university in Japan. Am J Sociol. 1992;97(6):1639–1657. doi: 10.1086/229942. [DOI] [Google Scholar]
- Strielkowski W, Volchik V, Maskaev A, Savko P. Leadership and effective institutional economics design in the context of education reforms. Economies. 2020;8(2):27. doi: 10.3390/economies8020027. [DOI] [Google Scholar]
- Tavana M, Ebrahimnejad A, Santos-Arteaga FJ, Mansourzadeh SM, Matin RK. A hybrid DEA-MOLP model for public school assessment and closure decision in the City of Philadelphia. Socioecon Plann Sci. 2018;61:70–89. doi: 10.1016/j.seps.2016.09.003. [DOI] [Google Scholar]
- Thijssen MW, Rege M, Solheim OJ. Teacher relationship skills and student learning. Econ Educ Rev. 2022;89:102251. doi: 10.1016/j.econedurev.2022.102251. [DOI] [Google Scholar]
- Tsekouras K, Chatzistamoulou N, Broadstock D, Kounetas K. Technological spillovers and path dependence of European transportation productive performance under technology heterogeneity. Technol Forecast Soc Chang. 2015;102:261–274. doi: 10.1016/j.techfore.2015.09.008. [DOI] [Google Scholar]
- Thanassoulis E, Da Conceição M, Silva Portela A. School outcomes: sharing the responsibility between pupil and school1. Educ Econ. 2002;10(2):183–207. doi: 10.1080/09645290210126913. [DOI] [Google Scholar]
- Tolbert PS, and Zucker LG (1999) The institutionalization of institutional theory. In: Studying organization. Theory and method. London, Thousand Oaks, New Delhi, 1, 169-184
- Toutkoushian RK, Curtis T. Effects of socioeconomic factors on public high school outcomes and rankings. J Educ Res. 2005;98(5):259–271. doi: 10.3200/JOER.98.5.259-271. [DOI] [Google Scholar]
- Van Wijk J, Zietsma C, Dorado S, De Bakker FG, Marti I. Social innovation: Integrating micro, meso, and macro level insights from institutional theory. Bus Soc. 2019;58(5):887–918. doi: 10.1177/2F0007650318789104. [DOI] [Google Scholar]
- Wang L, Calvano L. Class size, student behaviors and educational outcomes. Organ Manag J. 2022 doi: 10.1108/OMJ-01-2021-1139. [DOI] [Google Scholar]
- Williamson OE (1985) Reflections on the new institutional economics. Zeitschrift für die gesamte Staatswissenschaft. J Inst Theor Econ, (H. 1), 187–195. http://www.jstor.org/stable/40750794
- Wößmann L. Educational production in East Asia: the impact of family background and schooling policies on student performance. German Econ Rev. 2005;6(3):331–353. doi: 10.1111/j.1468-0475.2005.00136.x. [DOI] [Google Scholar]
- Yahia FB, Essid H, Rebai S. Do dropout and environmental factors matter? A directional distance function assessment of tunisian education efficiency. Int J Educ Dev. 2018;60:120–127. doi: 10.1016/j.ijedudev.2017.11.004. [DOI] [Google Scholar]
- Zucker LG. Institutional theories of organization. Ann Rev Sociol. 1987;13(1):443–464. doi: 10.1146/annurev.so.13.080187.002303. [DOI] [Google Scholar]