

Abstract
Aim:
The Nearctic is a complex patchwork of habitats and geologic features that form barriers to gene flow resulting in phylogeographic structure and speciation in many lineages. Habitats are rarely stable over geologic time, and the Nearctic has undergone major climatic changes in the past few million years. We use the common kingsnake species complex to study how climate, geography, and history influence lineage formation over a large, complex landscape.
Location:
Nearctic/North America
Taxon:
Common kingsnake, Lampropeltis getula, species complex
Methods:
We analyzed genome-wide sequence data from 51 snakes spanning the majority of the species complex’s range. We used population clustering, generalized dissimilarity modeling, and coalescent methods to identify the number of genetic clusters within the L. getula complex, infer the environmental correlates of genetic differentiation, and estimate models of divergence and gene flow among lineages.
Results:
We identified three major lineages within the L. getula complex and further continuous spatial structure within lineages. The most important ecological correlates of genetic distance in the complex are related to aridity and precipitation, consistent with lineage breaks at the Great Plains/Desert ecotone and the Cochise Filter Barrier. Lineages are estimated to have undergone multiple rounds of isolation and secondary contact, with highly asymmetric migration occurring at present.
Main conclusions:
Changing climates combined with a large and geologically complex landscape have resulted in a mosaic of discrete and spatially continuous genetic structure. Multiple rounds of isolation and secondary contact as climate fluctuated over the past ~4.4 My have likely driven the evolution of discrete lineages that maintain high levels of gene flow. Continuous structure is strongly shaped by aridity and precipitation, suggesting roles for major precipitation gradients in helping to maintain lineage identity in the face of gene flow when lineages are in geographic contact.
Keywords: Chihuahuan Desert, gene flow, phylogeography, Nearctic, North America, Sonoran Desert, Squamata
1. INTRODUCTION:
Identifying shared barriers and processes driving lineage formation is one of the primary goals of phylogeography. Genetic differentiation at shared boundaries has now been identified in numerous taxa (e.g., Mayden, 1988; Myers et al., 2019; Omernik, 1987; Remington, 1968; Soltis et al., 2006; Swenson, 2006). Although these barriers shape the distributions of numerous species and intraspecific lineages, many species groups with lineage boundaries at these barriers show incomplete reproductive isolation (e.g., Burbrink et al., 2021; Myers et al., 2019; Dufresnes et al., 2021; Nevado et al., 2018). In temperate regions of the world, genetic structure is influenced not only by present day barriers and environmental complexity, but also by major climatic changes and glacial cycles that have caused drastic changes in the biotic and abiotic landscape over time (Hewitt, 2004). Moreover, repeated changes in climate associated with glacial cycles of the Pleistocene have isolated or compressed populations into refugia (Burbrink et al., 2016; Hewitt, 2000). All of these barriers and environmental processes can have strong effects of isolating lineages and shaping the genomic structure of lineages.
Recent work across biomes has demonstrated that introgression is particularly widespread among lineages that have overlapping geographic distributions and occur in areas exhibiting strong climatic fluctuations through time, such as the Pleistocene glacial cycles of North America (Singhal et al., 2021). Geographic proximity promotes introgression for the obvious reason that if individuals cannot physically traverse the distance between two lineages, no inter-lineage reproduction can occur. Climatic fluctuations may promote introgression given that these climatic cycles result in cyclic patterns of isolation and fusion of lineages as individuals track contracting and expanding suitable habitat (Rosenblum et al., 2012).
Widely distributed taxa often span not just one, but multiple major barriers and ecotones. In temperate regions, such widespread taxa are subject to a wide range of highly divergent habitats, both across space and through time as Pleistocene and earlier climatic fluctuations have had major impacts on the environment. In North America, many taxa have expanded since the Pleistocene in response to the fluctuations in suitable habitat during glacial cycles (e.g., Burbrink et al., 2016; Derkarabetian et al., 2016; Myers et al., 2017; Pelletier & Carstens, 2016). Widespread species in North America are therefore expected to have undergone some lineage fragmentation and isolation in the past, with resulting degrees of genetic differentiation, reproductive isolation, and introgression at present depending on length of isolation and strength of differential environmental adaptation (Gavrilets 2004; Singhal & Moritz, 2013). One possibility is that while isolated, lineages accumulated incompatibilities via selection or drift such that introgression is now maladaptive and lineages maintain their own identities with little or no gene flow (Orr, 1995). Alternatively, less divergent lineages may remain genetically and ecological compatible and may continue to exchange genes. If rates of gene flow among lineages are high enough, then it is expected that lineages will eventually merge (Behm et al., 2010; Seehausen et al., 2008; Taylor et al., 2006).
Here, we examine the common kingsnake (Lampropeltis getula) species complex to investigate how complex landscapes and climate changes may influence genetic variation in a widespread taxon. Common kingsnakes range from the Pacific to Atlantic coasts of the southern USA and northern Mexico (Ernst & Ernst, 2003; Heimes, 2016), thus spanning multiple known phylogeographic boundaries, including the Appalachian Mountains, the Mississippi River, Cochise Filter Barrier at the Chihuahuan and Sonoran Deserts (Myers et al., 2019; Omernik, 1987; Soltis et al., 2006). Whereas many snakes that have similarly wide distributions are generally found in somewhat similar microhabitats (e.g., they are found in eastern North American forests and mesic regions of western North America, but are excluded from more arid habitats in the west (e..g, racers, Coluber constrictor; Powell et al., 2016), common kingsnakes occur in nearly the full range of ecoregions in the southern half of North America, from wet eastern forest to grassy plains to sandy, open desert (Blaney, 1977; Ernst & Ernst, 2003). These radically different habitats are characterized by unique climatic regimes and ecological communities and represent major barriers important for defining the ranges of many species (Savage 1960; Omernik, 1987; Omernik & Griffith, 2014).
Common kingsnakes show striking color pattern variation across their range, with boundaries between variants at several major ecological transitions and geographic boundaries, including the Cochise filter barrier, the transition from desert to great plains, and the transition from great plains to eastern forest (Blaney, 1977). Previous work has shown that several of these boundaries between pattern variants (many previously considered to be subspecies) also exhibit major mitochondrial DNA (mtDNA) breaks, and Pyron and Burbrink (2009) named these divergent mtDNA lineages as species (Fig. 1). However, as nuclear DNA (nDNA) datasets have rapidly become larger and more easily generated over the last decade, it has become increasingly clear that signals in mtDNA and nDNA datasets can be geographically discordant and that geographic groupings identified in mtDNA datasets may not always reflect barriers to the movement of nuclear alleles (Burbrink et al., 2021; Fontenot et al., 2011; McGuire et al., 2007; Toews & Brelsford, 2012).
Figure 1.
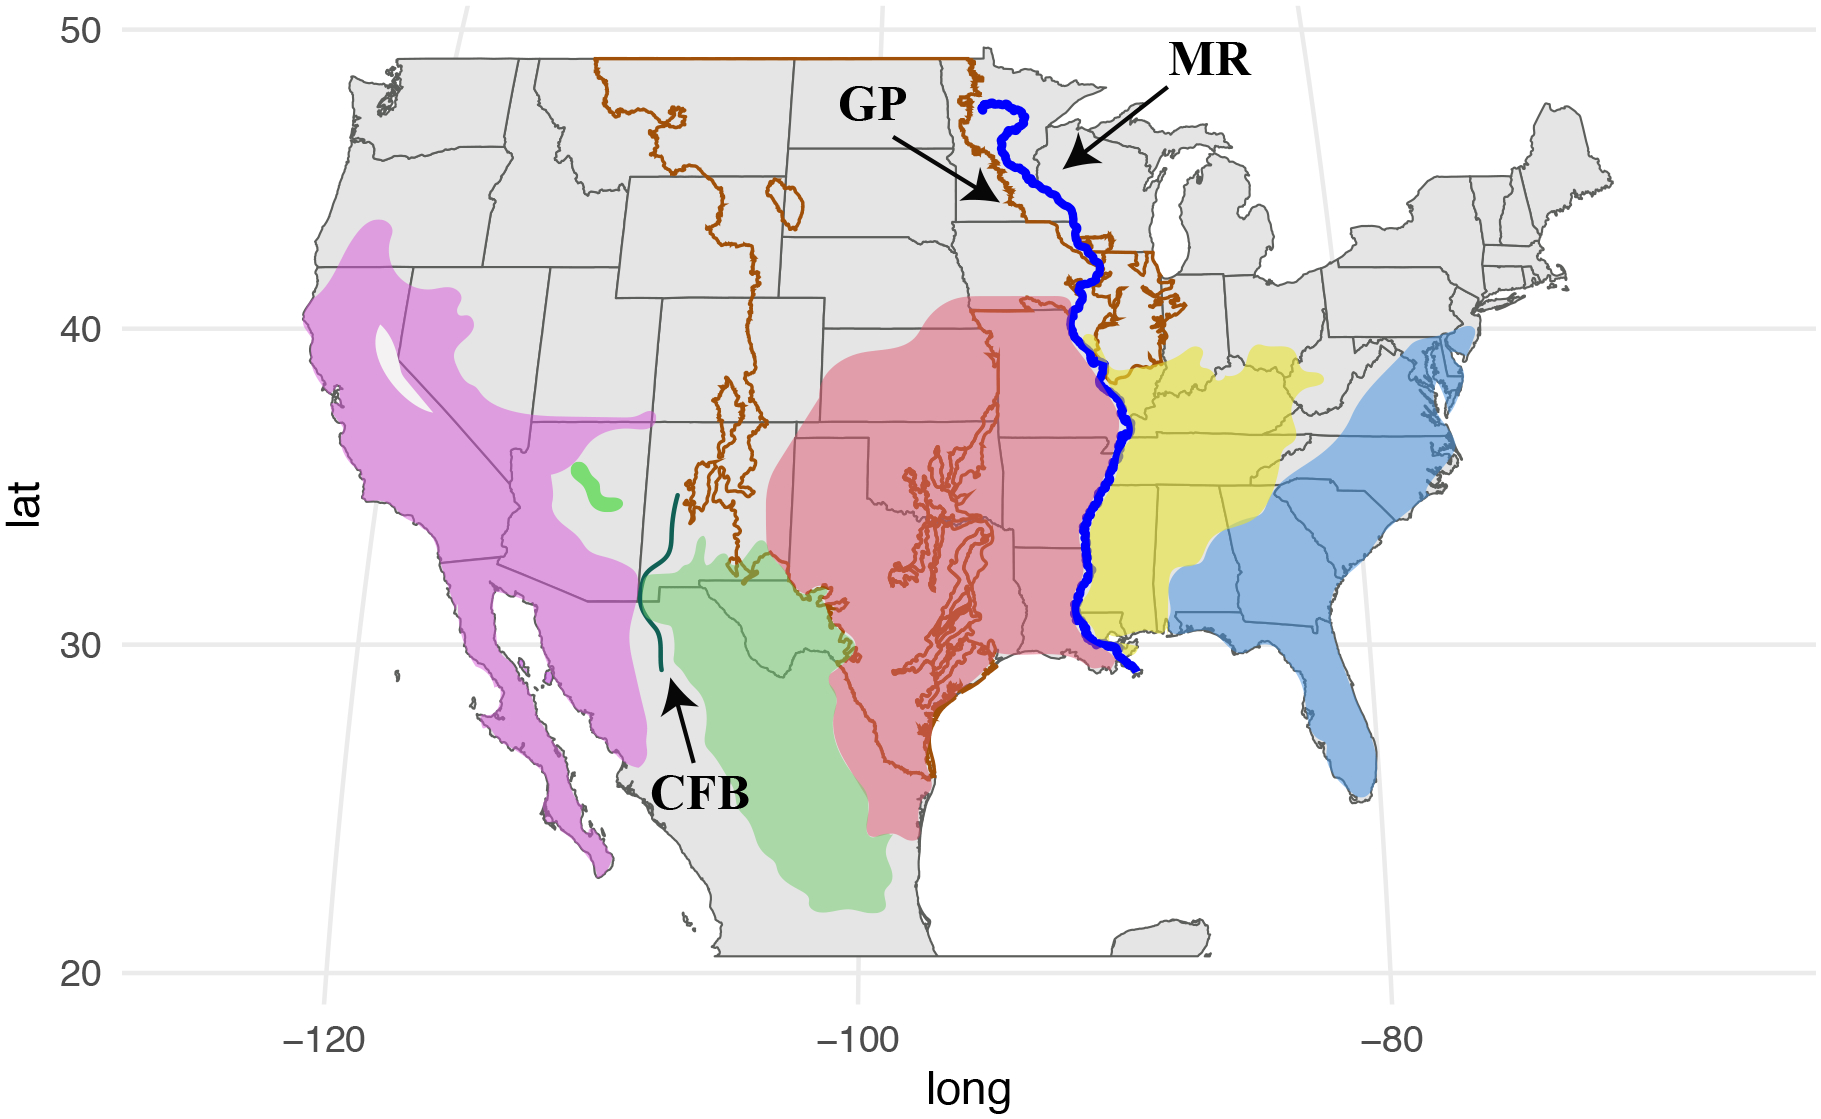
Full range of the common kingsnake, Lampropeltis getula, species complex in North America (Mollweide projection). The range is colored by the species proposed by Pyron and Burbrink (2009) based on analyses of mitochondrial DNA. From west to east, colors represent: L. californiae (purple), L. splendida (green), L. holbrooki (pink), L. nigra (yellow), and L. getula sensu stricto (blue). Abbreviations for notable phylogeographic barriers are: CFB = Cochise Filter Barrier, GP = Great Plains, and MR = Mississippi River.
To provide further insight into how major ecological transitions across North America affect patterns of genetic differentiation across the L. getula species complex, we used double digest restriction site associated (ddRAD) sequencing to sequence thousands of nuclear loci from kingsnakes spanning the range of the species complex. Using these data, we asked a set of related questions: 1) how many discrete lineages exist within the L. getula species complex and do lineage breaks correspond to known biogeographic barriers; 2) what are the environmental correlates of genetic differentiation that may be driving or maintaining lineage isolation; and 3) what is the history of isolation and gene flow among lineages and to what degree have isolation or migration changed through the Pleistocene. We show that there are two primary genetic breaks within common kingsnakes: the transition from great plains to desert, and the cochise filter barrier. East of these barriers, isolation by distance, rather than discrete structure, dominates. Gene flow among discrete genetic clusters is high and asymmetric, and demographic models suggest a history of multiple cycles of isolation followed by subsequent migration, likely shaped by the dynamic climatic history of the Nearctic. These results show that widespread species or species complexes may show little or no structure across some established boundaries, and that the amounts of divergence and gene flow occurring at lineage boundaries that do exist can be modulated by the timing and duration of past cycles of isolation as climate changes.
2. MATERIALS AND METHODS
2.1. Dataset
We extracted DNA from 56 tissue samples from members of the L. getula species complex obtained from museum collections (Appendix 1, available on Dryad at https://doi.org/10.5061/dryad.18931zd16) using the Qiagen DNEasy kit following manufacturer protocol. We sent samples to the University of Wisconsin-Madison Biotechnology Center for ddRAD library preparation using enzymes PstI and Bfal and subsequent sequencing on an Illumina NovaSeq6000 to generate paired-end 150 bp reads. We obtained 165 M reads across all 56 samples. We assembled the data using the ipyrad 0.9.63 pipeline, using primarily default parameters (e.g, maximum of 5 low quality bases, clustering threshold of 0.85; remaining parameters are shown in the params file on Github (https://github.com/seanharrington256/Lgetula_gbs). After an initial round of assembly, we decided to remove five individuals from the dataset due to their large amounts of missing data, and proceeded with a dataset consisting of 51 individuals. We required a locus to be present in at least 38 of 51 individuals (~75% of individuals) to be retained, resulting in a final SNP matrix of 168,568 sites containing ~19% missing data.
We also used ipyrad to generate a dataset using the same parameters, but including only the 35 individuals from what we defined as the eastern lineage (see results) to determine if analyses on this lineage only would show finer discrete genetic structure. We required a locus to be present in at least 26 individuals (~75% of individuals) to be retained, resulting in a SNP matrix of 160,995 sites with ~19% missing data. Finally, we generated a western dataset that included the individuals in each of two western lineages, which correspond to the currently recognized L. californiae and L. splendida lineages (see results). This included 16 individuals, and we required loci to be present in at least 12 individuals to be retained, resulting in a SNP matrix of 73,363 sites containing ~18% missing data.
2.2. Lineage clusters
We identified lineage clusters and admixture among those clusters across the species complex. We used the sparse nonnegative matrix factorization method (sNMF; Frichot et al. 2014) implemented in the ‘LEA’ R package v3.2.0 (Frichot & François, 2015) in R version 4.1.1 (R Core Team 2021). We ran sNMF for values of K (the number of discrete clusters) ranging from 1–10 with 10 replicates each and selected the optimal value of K as the value with the lowest cross-entropy score. We also ran discriminant analysis of principal components (DAPC), a method that does not explicitly model genetic variation, for each value of K using functions in the ‘adegenet’ R package v2.1.5 (Jombart, 2008; Jombart et al., 2010; Jombart & Ahmed, 2011) to confirm consistent clustering between methods. We repeated these same analyses for the datasets each composed of only eastern or only western individuals.
2.3. Correlates of genetic structure
We next tested the effects of geographic and environmental distances in shaping genetic distances across the complex. We calculated uncorrected genetic distances and linear geographic distances in R and used functions from the ‘adegenet’ package to create kernel density plots to visualize the relationship between genetic and geographic distances. To simultaneously test the effect of geographic and environmental distances on genetic distances, we use a generalized dissimilarity modeling (Ferrier et al., 2007; Fitzpatrick & Keller, 2015; GDM) approach using functions from the ‘gdm’ R package v1.5.0–1 (Fitzpatrick et al., 2021). We downloaded the Bioclim dataset (Hijmans et al., 2005) and elevation data from the Worldclim database (Fick & Hijmans, 2017) and combined these with the Envirem dataset (Title & Bemmels, 2018), then removed highly correlated variables with r > 0.8, leaving us with 13 climatic and environmental variables (Bio1, mean annual temperature; Bio2, mean diurnal temperature range; Bio4, temperature seasonality; Bio5, maximum temp of the warmest month; Bio8, mean temperature of the wettest quarter; Bio9, mean temperature of the driest quarter; Bio12 annual precipitation; Bio15, precipitation seasonality; Bio18, precipitation of the warmest quarter; SAGA-GIS topographic wetness index; terrain roughness index; Thorn’s aridity index; PET seasonality; elevation). We calculated pairwise distances among our samples for each variable and then ran a GDM model including all environmental distances plus geographic distance as predictors of genetic distance. We repeated these same analyses for the dataset composed of only eastern or only western individuals.
2.4. Historical demography
Finally, we used FastSimCoal v2.6 (FSC; Excoffier et al., 2013; Excoffier & Foll, 2011) to estimate population genetic parameters and the best model of divergence among the lineages identified by sNMF. This program requires the site frequency spectrum (SFS) as input; we used easySFS (https://github.com/isaacovercast/easySFS) to convert SNPs to the SFS and assigned samples to lineages based on the best fit K=3 clustering from sNMF. Admixed individuals were assigned to whichever cluster contributed the largest admixture proportion to an individual. We tested the fit of 14 models that included various combinations of divergence time, migration, and population size parameters (Fig. S1, available on Dryad at https://doi.org/10.5061/dryad.18931zd16). These models are primarily distinguished by whether and when migration is included among lineages. One model includes no migration and is a simple isolation model. Some models include migration that is constant among lineages beginning at the time of divergence. Other models represent secondary contact that include a period of isolation with no migration immediately after lineage divergence followed by migration. Finally, a subset of these models were parameterized to include population size change along branches (Fig. S1). For all models other than star tree models, we assumed a phylogeny in which the two western lineages are sister to each other to the exclusion of the eastern lineage. This is based on the mtDNA results of Pyron and Burbrink (2009) and our K=2 clustering results, which support the split between the eastern lineage and western lineages combined as the most differentiated split (see results below).
We ran 50 replicate FSC analyses for each model, with each analysis consisting of 100,000 simulations for composite likelihood estimation and 40 ECM cycles for parameter optimization. We consider the maximum pseudo-likelihood estimate for each model to be the single replicate run with the highest likelihood. Parameter estimation from the folded SFS in FSC requires that at least one parameter value be fixed. We chose to fix the root split of the L. getula complex to 4.4 Mya based on multiple previous studies that have converged on estimates near this value using different methods and datasets (Pyron & Burbrink, 2009; Chen et al., 2017; Burbrink and Gehara 2018; Zheng and Wiens, 2016). We used the number of parameters and likelihood estimated by FSC to calculate Akaike Information Criterion (AIC) and AIC weights for each model to compare model fits. For the single best fit model, we performed parametric bootstrapping to estimate confidence intervals around the parameter estimates. We used FSC to generate 100 bootstrap SFS replicates from the best fit model parameters, and then re-estimated the parameters for each dataset following the same procedure as for the empirical SFS described above.
3. RESULTS
3.1. Discrete structure
A model of three lineages provided the best fit to the data based on the cross-entropy scores from sNMF (Figs. 2, S2). This includes a break in west Texas at the boundary between the Great Plains and the more arid desert regions immediately to the west and a boundary at the cochise filter barrier at the Arizona/New Mexico barrier. Admixed individuals are present at both boundaries. We also examined plots of K=2, 4, and 5, although these were suboptimal based on cross-entropy scores (Figs. S2, S3). When individuals were classified into only two clusters, a single genetic break occurs at the great plains/desert transition, implying the most differentiation between the eastern lineage and the two western lineages. At K=4, the eastern lineage splits into two near the Mississippi River, with very extensive admixture among the two eastern lineages. At K=5, those previously admixed individuals are assigned to a unique cluster, still showing considerable admixture with the lineage to the west. The two western lineages in the best fit K=3 model are broadly concordant with the species (and previously subspecies) designations for the California, L. californiae, and desert, L. splendida, kingsnakes, and so for the duration of this paper, we refer to these as the L. californiae and L. splendida lineages, while referring to the remaining lineage simply as the eastern lineage. Results from DAPC analyses at each value of K were concordant with results from sNMF (Fig. S3).
Figure 2.

Left: Map of sampling localities of Lampropeltis getula complex specimens in the United States and Mexico, using Mollweide projection. Points are colored proportional to their estimated ancestry in each of the three clusters identified in the best sNMF clustering scheme. Clusters geographically correspond to the previously identified L. california and L. splendida species/subspecies and an eastern lineage of all remaining specimens, and these are labeled on the map. Right: Photos of representative individuals of the eastern lineage (top right, photo credit FTB) and L. californiae lineage (bottom right, photo credit Sam Fellows).
3.2. Environmental and geographic effects on lineage structure
A kernel density plot of genetic vs. geographic distance shows a pattern consistent with large amounts of IBD, but also additional spatial structure (Fig. 3). If IBD were the only force shaping spatial genetic diversity, we would expect a single, linear cloud of points. Instead, we see partial disjunctions in the cloud and a change in slope that indicates the presence of discrete genetic structure as well. Our GDM analysis, which includes geographic as well as several environmental distances as potential predictors of genetic distance, supports the strong role of geographic distance in shaping genetic distance across the kingsnake complex. Although geographic distance is the most important predictor, we also find significant effects of precipitation in the warmest quarter and Thorn’s aridity index (Fig. 4). Both of these environmental predictors show curves approximating exponential increases in genetic distances with increases in environmental distance, whereas geographic and genetic distances show an approximately linear relationship (Fig. 4).
Figure 3.

Kernel density plot of geographic vs. genetic distance for the full dataset of samples across the range of the Lampropeltis getula species complex shown in Fig. 2. Hotter colors correspond to higher density of points.
Figure 4.

Results from generalized dissimilarity modeling (GDM) across the range of the Lampropeltis getula species complex. Top shows the variable importance of geographic and ecological distances on predicting genetic distance. The overall model is significant at p < 0.01, as are the three variables with asterisks above the bars. Other panels show the I-splines representing the genetic variation explained as a function of each predictor.
After running the above analyses, we repeated them on a dataset composed of only the eastern lineage to determine if finer-scale structure was being masked when analyzing the full dataset. We found that the lowest cross-entropy score from sNMF was for K=2; however, this was only slightly lower than the score for K=1, indicating it does provide a considerably better fit (Fig. S4). A kernel density plot of genetic vs. geographic distance showed a single cloud of points indicating continuous spatial structure, rather than discrete structure and GDM showed a significant and roughly linear effect of geographic distance on genetic distance (Fig. S5). Therefore, we consider the eastern cluster to be a single large lineage, although we do not rule out the possibility that eastern individuals were once fragmented into multiple populations that have now merged. When analyzing the western individuals alone with sNMF, we find the same differentiation into the L. californiae and L. splendida lineages as when we analyzed all individuals together (Fig S6). Additionally, the kernel density plot of genetic against geographic distance for these western individuals showed an obvious disjunction indicating discrete structure (Figs. S6–7). A unique set of environmental variables significantly affect genetic distance for the eastern and western datasets. In the eastern lineage, isolation by distance is the most important variable, as in the model for all individuals, with precipitation in the warmest quarter as the only significant environmental predictor. In the GDM model for only western samples (L. californiae + L. splendida), geographic distance, mean diurnal temperature range, and mean temperature of the driest quarter were all significant predictors of genetic distance with the two environmental predictors both having higher variable importance than geographic distance (Fig. S8).
3.3. Demographic modeling
A model including multiple episodes of divergence and secondary contact plus population size changes best fit these data using the program FSC (Fig. 5, Table S1 [available on Dryad]). The best fit model shows that after a period of isolation following the initial divergence 4.4 Ma, the ancestor of the L. californiae and L. splendida lineages began exchanging migrants with the eastern lineage 2.75 Ma, followed by another period of isolation starting at the divergence of L. californiae and L. splendida 1.94 Ma, with migration among all three present day lineages beginning 590 Ka. Migration among lineages is highly asymmetric, with many more migrants flowing eastward than westward, both presently and prior to the divergence of L. splendida and L. californiae. We see little overlap among eastward vs. westward migration between any two extant lineages in our parametric bootstrap estimates, supporting this pattern. Population sizes were historically much smaller than at present, with lineages having expanded roughly 1.4 Mya. Parametric bootstraps also support this pattern, with no overlap in the distributions for present and ancestral lineages. We note that our maximum pseudo-likelihood estimates fall slightly outside of the parametric bootstrap distributions, suggesting that this model does not quite adequately fit these data. Despite this, maximum pseudo-likelihood estimates of population sizes are broadly similar across other FSC models (Table S1), and we therefore expect that this discrepancy is a result of a factor not modeled by any of the FSC models we included. We consider the most likely candidate to be continuous geographic structure within lineages (as shown by GDM analyses and kernel density plots of genetic and geographic distance), which is not adequately modeled in conjunction with complex scenarios of divergence and gene flow in any program of which we are aware.
Figure 5.

Schematic of the best fit model from FSC and parameter estimates for divergence times, migration rates, and population sizes of lineages within the common kingsnake, Lampropeltis getula, species complex. Abbreviations of parameters in the schematic are: m = migration, T = time. Subscripts of m: E = eastern lineage, W = ancestor of western lineages, S = L. splendida lineage, C = L. californiae lineage. Subscripts of T: cont1 = most recent secondary contact event, resize = population size change event, div = divergence of L. splendida and L. californiae lineages, cont2 = rootward secondary contact event. Parameter estimates are shown as violin plots of estimates from 100 parametric bootstraps, with the maximum pseudo-likelihood estimates shown as black diamonds. Note that the y-axis for migration rates is truncated, due to high uncertainty in the migration rate from the ancestral western lineage into the eastern lineage in the past.
DISCUSSION
Using genome-wide RAD data, we show that the genetic structure and history of divergence within the common kingsnake complex is much more complicated than the scenario detectable from mtDNA alone. This is an increasingly common pattern across many taxa (e.g., Burbrink et al. 2021; Chan & Levin, 2005; Firneno et al. 2020; Myers et al., 2020; Streicher et al., 2016; Toews & Brelsford, 2012), as the relatively recent ability to gather large amounts of nuclear loci has greatly expanded our power to make complex population genetic inferences. We identify three discrete lineages within the common kingsnake complex, corresponding to L. californiae, L. splendida, and a single eastern lineage composed of the rest of the complex. Our analyses suggest considerable gene flow among these lineages, and continuous spatial structure resulting from isolation by distance within them. Although we identify considerable gene flow across the complex that was not hypothesized based on mtDNA alone, we note that the lineages identified by Pyron and Burbink (2009) are not discordant with our findings per se. When we examined clusters inferred by sNMF under a five cluster model, the inferred lineages matched those proposed as species by Pyron and Burbrink (2009). However, higher sNMF support for all eastern samples as a single cluster and a linear relationship between genetic and geographic distance for the eastern samples indicates that the structure in eastern lineage of the L. getula complex (holbrooki, nigra, and getula sensu stricto) is primarily continuous spatial structure, consistent with isolation by distance, rather than discrete lineage structure. A similar pattern was identified in the Eastern Pinesnake (Pituophis melanoleucus) complex, which also shows clinal structure across the eastern Nearctic dominated by isolation by distance (Nikolakis et al., 2022). This does not imply that the eastern lineage was not fragmented at some point during glacial cycles or subject to other processes, only that our data do not indicate the presence of multiple discrete lineages at present.
In addition to the strong, expected effect of geographic distance on genetic distance across the L. getula complex, we also identified roles for environmental factors in shaping genetic distance. Precipitation in the warmest quarter (i.e., summer rains in the Nearctic) and Thorn’s aridity index both have strong effects on genetic distances, with genetic distances increasing more than linearly with these environmental distances. The transition from the great plains to the desert is the most dramatic shift in precipitation and temperature (both of which define degree of aridity) and also the most differentiated lineage break that we identify in the common kingsnake complex. Organisms in desert environments regularly encounter extreme high temperatures and water scarcity not encountered by organisms of the plains and forested environments. Survival in these harsh environments is often facilitated through combinations of adaptive and plastic changes to temperature tolerances, water loss, metabolic rates, and thermoregulatory behaviors (Bradshaw, 1988; Lahav & Dmi’El, 1996; Rocha et al., 2021; Williams and Tielman, 2005). Additionally, it has been shown that water loss is highest in mesic habitats and corresponds to greatly reduced biogeographic transitions between arid and mesic habitats relative to between arid and semi-arid regions (Cox & Cox, 2015). We therefore suspect that kingsnakes in desert environments likely show arid-specific adaptation and that this may help to drive lineage differentiation and the association between genetic distance and aridity and precipitation across the complex.
We find that aridity is not a significant predictor of genetic distance in the subset datasets containing only eastern or western samples, suggesting that aridity may specifically be important in shaping the boundary between lineages at the plains/desert boundary. In the eastern lineage, precipitation of the warmest quarter remains a significant non-spatial predictor of genetic distance. In the western lineage, two temperature-based environmental predictors are each more important than geographic distance in shaping these western lineages. Temperature and precipitation have both previously been found to have large effects on genetic variation in several species across the Cochise filter barrier, where we identify the break between L. californiae and L. splendida lineages at the Arizona/New Mexico border (Myers et al., 2019). In contrast to our findings, Myers et al. (2019) reported elevation as the only significant environmental predictor of genetic distance in the L. getula complex in GDM models (not a significant predictor at all in our models), however they also focused on dense sampling around the Cochise filter barrier, whereas our sampling extends farther into California, thus including wider climatic variation, potentially highlighting the influence of different drivers of genetic structure at different geographic scales. The differences in environmental variables that predict genetic distance in the eastern and western datasets further suggests that lineages in these regions respond to different environmental pressures and may exhibit differential adaptations. Broadly, this suggests that sharp environmental gradients have strong roles in shaping lineages, but that less drastic, clinal variation may not be as important for structuring the spatial landscape of genetic variation, particularly in widespread species.
Climatic variation through time can have at least as much of an influence on shaping genetic diversity as present day variation across space, and this is evident in the common kingsnake complex. The initial divergence of the L. getula complex has been previously inferred as having occurred ~4.4 Mya during the Pliocene, a time of several dramatic climatic and ecological transitions, potentially including aridification and a conversion from woodland savannahs toward grasslands and deserts in western North America, although the timing of specific events is uncertain (Webb, 1977; Wilson & Pitts, 2010). We infer the initial contact when the ancestor of L. californiae + L. splendida lineages began exchanging migrants with the eastern lineage to have occurred roughly 2.8 Mya, near the end of the Pliocene just prior to the onset of the Pleistocene. During the Pleistocene, our best fit FSC model infers divergence of the L. splendida and L. californiae lineages in isolation from each other and the eastern lineage, followed by a population size increase from previously much smaller populations, and ultimately relatively recent secondary contact about 590 kya. The population size increase between the most recent divergence and contact events lends support to the idea that these lineages were isolated in climatic refugia and then subsequently expanded. The divergence and secondary contact of the L. californiae + L. splendida lineages during the Pleistocene is broadly consistent with findings for other taxa, although there is considerable variation among species in estimated timing of divergence and contact events across this semi-permeable barrier (Provost et al., 2021).
Overall, this model suggests multiple rounds of divergence in isolation, followed by high migration in secondary contact, consistent with the mixing-isolation-mixing model of divergence (He et al., 2019). It is possible that the history of isolation and contact is more complex with several successive rounds of isolation and contact than can be modeled with these data. Therefore, additional isolation and contact may have occurred in response to the multiple glacial cycles during the Pleistocene or earlier climatic fluctuations. There is limited resolution to detect isolation and contact over short time scales, however, such that even distinguishing a single isolation and contact event from an isolation with migration model can be difficult if lineages were not isolated for sufficient time before coming into contact (Roux et al., 2016). We expect that the mixing-isolation-mixing model of divergence may be prevalent among many widespread species groups in areas of cyclic climate change, and hope that the continued development of new methods will enable accurate identification of this process.
Our results suggest that lineages within the L. getula complex are clearly not completely reproductively isolated from one another. Migration rates among current lineages range from 0.31 to 4.93 effective individuals/generation. The latter migration rate is far above the often cited threshold of 1 individual/generation that will cause populations to merge into panmixia (Wright, 1931); however, this threshold is derived under a simple population model that does include complexities such as continuous spatial structure (Wang, 2004). It is intriguing that this order of magnitude difference in migration rates is consistently asymmetric: migration rates from east to west are all less than one, whereas eastward migration rates out of western lineages are always greater than one. This pattern occurs among the three present-day lineages and in the past prior to the divergence of the L. californiae and L. splendida lineages. One speculative hypothesis for this is that survival in the arid environments of the west may require adaptations that snakes from the Eastern Nearctic do not possess at high frequency, leading to less successful migration from east to west than the reverse. Alternatively, the asymmetric migration could be the result of neutral demographic processes, such as patterns driven by the location of refugia that lineages may have expanded out of during various glacial cycles. Given the complexity of the landscape and past climatic change, we hypothesize that no single process drives this pattern. Instead, combinations of selection and demographic changes acting at different times and on different spatial scales likely shape gene flow across this complex and changing landscape. Future work using whole genomes will be key for discriminating among these scenarios by identifying how patterns of divergence vary on a locus-by-locus basis. Under neutral processes, migration should be distributed relatively evenly across the genome. If selection is preventing certain alleles from moving across the lineage boundaries, then this should be detectable as genomic islands of elevated divergence and reduced migration (Beichman et al., 2018; Ravinet et al., 2017; Seehausen et al., 2014).
Conclusions:
We demonstrate that across the varied habitats of the Nearctic, genetic diversity in the common kingsnake is shaped by complex mixtures of present climatic gradients, geography, and cyclical rounds of isolation and contact influenced by a changing climate. These varied processes result in a complicated mixture of discrete and continuous spatial structure. Across the complex, geographic distance, rainfall, and aridity affect genetic distance, suggesting a primary role for the transition from great plains to desert habitats in contributing to lineage differentiation. At least two rounds of isolation followed by secondary contact characterize the divergence history of the complex, indicating a role for climatic cycles in temporarily isolating lineages, after which point they partially or perhaps near fully merged before the next round of isolation. We propose that survival in harsh desert environments may require genetic adaptations which mediate asymmetric migration and maintain lineage boundaries, such that selection limits the ability of eastern snakes and the alleles they carry to migrate westward. Testing this hypothesis will require a genomic approach in the future to characterize the landscape of loci that do or do not resist migration across lineage boundaries.
Supplementary Material
Appendix 1. Museum specimen numbers and locality information for all samples used in this study.
Figure S1. Demographic models tested in FastSimCoal2. Vertical gray bars indicate periods of time with no migration among lineages. In current M, recent resize and all M, recent resize models the migration rates are constant from Tdiv to the present.
Figure S2. Cross entropy scores for K=1–10 from sNMF for the full dataset.
Figure S3. Sampling map and cluster membership estimates from sNMF and DAPC at values of K=1–6. Points are colored proportional to their estimated ancestry in each of the clusters in each sNMF analysis or proportional to their probability of membership in each cluster in each DAPC analysis. All maps use the Mollweide projection.
Figure S4. Cross entropy scores for K=1–10 from sNMF for the dataset containing eastern individuals only.
Figure S5. Kernel density plot of geographic vs. genetic distance for the dataset containing eastern individuals only.
Figure S6. Cross entropy scores for K=1–10 from sNMF for the dataset containing western individuals only and map (Mollweide projection) of sNMF ancestry estimates from the best fit K=2 model. Points are colored proportional to their estimated ancestry in each of the clusters.
Figure S7. Kernel density plot of geographic vs. genetic distance for the dataset containing western individuals only.
Figure S8. Generalized dissimilarity model results for the eastern and western lineages analyzed separately. In each page, the top left shows the variable importance of geographic and ecological distances on predicting genetic distance. The overall models are significant at p < 0.01, as are the variables with asterisks above the bars. Other panels show the I- splines representing the genetic variation explained as a function of each predictor.
Table S1. AIC values of model fit and parameter estimates for all FSC models from Fig. S1.
Acknowledgements:
Tissues were obtained from the following personal and institutional collections (and therefore no permits were required), and we thank all institutions and staff for their contributions: Lauren Vonnahme, David Dickey, David Kizirian, Sarah Picón, Christina Perella, Svetlana Katanova, and the American Museum of Natural History including AMNH Ambrose Monell Cryo Collection; Lauren Scheinberg and the California Academy of Sciences; Don B. Shepard personal collection; Curtis Schmidt and Fort Hays State University Sternberg Museum of Natural History; David Blackburn, Coleman Sheehy, and the University of Florida Florida Museum of Natural History; Rafe Brown, Jeff Weinell, Rich Glor, Melissa Mayhew, and the University of Kansas Natural History Museum; Neftali Camacho, Greg Pauly, and the Natural History Museum of Los Angeles County; Carol Spencer and the University of California Museum of Vertebrate Zoology; Janet Braun, Brandi Coyner, Cam Siler, and the Sam Noble Oklahoma Museum of Natural History; Vicky Zhuang, Carl Lieb, Eli Greenbaum, and The University of Texas at El Paso. We thank Isaac Overcast and Arianna Kuhn for help with data processing and analysis, Lauren Audi and Gerbi Carreon for assistance with lab work, Sajesh Singh and Apurva Narechania for computational support, and Sam Fellows for a photo contribution. SMH was supported by an Institutional Development Award (IDeA) from the National Institute of General Medical Sciences of the National Institutes of Health under Grant # 2P20GM103432 and by a Richard Gilder Graduate School Theodore Roosevelt Postdoctoral Fellowship at the American Museum of Natural History.
Footnotes
Supporting information figure captions (available on Dryad at https://doi.org/10.5061/dryad.18931zd16):
Conflict of interest: The authors declare that we have no conflict of interest.
Data availability:
All scripts for data processing and analysis are available at https://github.com/seanharrington256/Lgetula_gbs. Processed data files for input into these scripts as well as supporting figures, tables, and appendices are available at https://doi.org/10.5061/dryad.18931zd16 and raw genomic data are available at on the NCBI Sequence Read Archive under BioProject ID PRJNA889851.
References
- Behm JE, Ives AR, & Boughman JW (2010). Breakdown in Postmating Isolation and the Collapse of a Species Pair through Hybridization. The American Naturalist, 175(1), 11–26. [DOI] [PubMed] [Google Scholar]
- Beichman AC, Huerta-Sanchez E, & Lohmueller KE (2018). Using genomic data to infer historic population dynamics of nonmodel organisms. Annual Review of Ecology, Evolution, and Systematics, 49(1), 433–456 [Google Scholar]
- Blaney RM (1977). Systematics of the common kingsnake, Lampropeltis getulus (Linnaeus). Tulane Studies in Zoology and Botany, 19, 47–103. [Google Scholar]
- Bradshaw SD (1988). Desert reptiles: A case of adaptation or pre-adaptation. Journal of Arid Environments, 14, 155–174. [Google Scholar]
- Burbrink F, Gehara M, & Myers EA (2021). Resolving spatial complexities of hybridization in the context of the gray zone of speciation in North American ratsnakes (Pantherophis obsoletus complex). Evolution, 75(260–277), 2020.05.05.079467. [DOI] [PubMed] [Google Scholar]
- Burbrink FT, Chan YL, Myers EA, Ruane S, Smith BT, & Hickerson MJ (2016). Asynchronous demographic responses to Pleistocene climate change in Eastern Nearctic vertebrates. Ecology Letters, 19(12), 1457–1467. [DOI] [PubMed] [Google Scholar]
- Chan KMA, & Levin SA (2005). Leaky prezygotic isolation and porous genomes: Rapid introgression of maternally inherited DNA. Evolution, 59(4), 720–729. [PubMed] [Google Scholar]
- Cox CL, & Cox RM (2015). Evolutionary shifts in habitat aridity predict evaporative water loss across squamate reptiles. Evolution, 69(9), 2507–2516. [DOI] [PubMed] [Google Scholar]
- Derkarabetian S, Burns M, Starrett J, & Hedin M (2016). Population genomic evidence for multiple Pliocene refugia in a montane-restricted harvestman (Arachnida, Opiliones, Sclerobunus robustus) from the southwestern United States. Molecular Ecology, 25(18), 4611–4631. [DOI] [PubMed] [Google Scholar]
- Ernst CH, & Ernst EM (2003). Snakes of the United States and Canada. Smithsonian Books; Washington, DC. [Google Scholar]
- Excoffier L, Dupanloup I, Huerta-Sánchez E, Sousa VC, & Foll M (2013). Robust demographic inference from genomic and SNP data. PLoS Genetics, 9(10), e1003905. [DOI] [PMC free article] [PubMed] [Google Scholar]
- Excoffier L, & Foll M (2011). fastsimcoal: A continuous-time coalescent simulator of genomic diversity under arbitrarily complex evolutionary scenarios. Bioinformatics, 27(9), 1332–1334. [DOI] [PubMed] [Google Scholar]
- Ferrier S, Manion G, Elith J, & Richardson K (2007). Using generalized dissimilarity modelling to analyse and predict patterns of beta diversity in regional biodiversity assessment. Diversity and Distributions, 13(3), 252–264. [Google Scholar]
- Fick SE, & Hijmans RJ (2017). WorldClim 2: New 1-km spatial resolution climate surfaces for global land areas. International Journal of Climatology, 37(12), 4302–4315. [Google Scholar]
- Firneno TJ Jr., O’Neill JR, Itgen MW, Kihneman TA, Townsend JH, & Fujita MK (2021). Delimitation despite discordance: Evaluating the species limits of a confounding species complex in the face of mitonuclear discordance. Ecology and Evolution, 11(18), 12739–12753. [DOI] [PMC free article] [PubMed] [Google Scholar]
- Fitzpatrick MC, & Keller SR (2015). Ecological genomics meets community-level modelling of biodiversity: Mapping the genomic landscape of current and future environmental adaptation. Ecology Letters, 18(1), 1–16. [DOI] [PubMed] [Google Scholar]
- Fitzpatrick MC, Mokany K, Manion G, Lisk M, Ferrier S, & Nieto-Lugilde D (2021). gdm: Generalized Dissimilarity Modeling (1.4.2.2) [Computer software]. https://CRAN.R-project.org/package=gdm
- Fontenot BE, Makowsky R, & Chippindale PT (2011). Nuclear–mitochondrial discordance and gene flow in a recent radiation of toads. Molecular Phylogenetics and Evolution, 59(1), 66–80. [DOI] [PubMed] [Google Scholar]
- Frichot E, & François O (2015). LEA: An R package for landscape and ecological association studies. Methods in Ecology and Evolution, 6(8), 925–929. [Google Scholar]
- Gavrilets S (2004). Genetic Theories of Allopatric and Parapatric Speciation. In Tautz D, Metz JAJ, Doebeli M, & Dieckmann U (Eds.), Adaptive Speciation (pp. 112–139). Cambridge University Press. [Google Scholar]
- He Z, Li X, Yang M, Wang X, Zhong C, Duke NC, Wu C-I, & Shi S (2019). Speciation with gene flow via cycles of isolation and migration: Insights from multiple mangrove taxa. National Science Review, 6(2), 275–288. [DOI] [PMC free article] [PubMed] [Google Scholar]
- Heimes P (2016). Herpetofauna mexicana, Vol I: Snakes of Mexico. Edition Chimaira. [Google Scholar]
- Hewitt G (2000). The genetic legacy of the Quaternary ice ages. Nature, 405(6789), 907–913. [DOI] [PubMed] [Google Scholar]
- Hewitt GM (2004). Genetic consequences of climatic oscillations in the Quaternary. Philosophical Transactions of the Royal Society of London. Series B: Biological Sciences, 359(1442), 183–195. [DOI] [PMC free article] [PubMed] [Google Scholar]
- Hijmans RJ, Cameron SE, Parra JL, Jones PG, & Jarvis A (2005). Very high resolution interpolated climate surfaces for global land areas. International Journal of Climatology, 25(15), 1965–1978. [Google Scholar]
- Jombart T (2008). adegenet: A R package for the multivariate analysis of genetic markers. Bioinformatics, 24(11), 1403–1405. [DOI] [PubMed] [Google Scholar]
- Jombart T, & Ahmed I (2011). adegenet 1.3–1: New tools for the analysis of genome-wide SNP data. Bioinformatics, 27(21), 3070–3071. [DOI] [PMC free article] [PubMed] [Google Scholar]
- Jombart T, Devillard S, & Balloux F (2010). Discriminant analysis of principal components: A new method for the analysis of genetically structured populations. BMC Genetics, 11(1), 94. [DOI] [PMC free article] [PubMed] [Google Scholar]
- Lahav S, & Dmi’El R (1996). Skin resistance to water loss in colubrid snakes: Ecological and taxonomical correlations. Écoscience, 3(2), 135–139. [Google Scholar]
- Mayden RL (1988). Vicariance biogeography, parsimony, and evolution in North American freshwater fishes. Systematic Zoology, 37(4), 329. [Google Scholar]
- McGuire JA, Linkem CW, Koo MS, Hutchison DW, Lappin AK, Orange DI, Lemos-Espinal J, Riddle BR, & Jaeger JR (2007). Mitochondrial introgression and incomplete lineage sorting through space and time: Phylogenetics of crotaphytid lizards. Evolution, 61(12), 2879–2897. [DOI] [PubMed] [Google Scholar]
- Myers EA, Hickerson MJ, & Burbrink FT (2017). Asynchronous diversification of snakes in the North American warm deserts. Journal of Biogeography, 44(2), 461–474. [Google Scholar]
- Myers EA, Xue AT, Gehara M, Cox CL, Rabosky ARD, Lemos‐Espinal J, Martínez‐Gómez JE, & Burbrink FT (2019). Environmental heterogeneity and not vicariant biogeographic barriers generate community-wide population structure in desert-adapted snakes. Molecular Ecology, 28(20), 4535–4548. [DOI] [PubMed] [Google Scholar]
- Nevado B, Contreras-Ortiz N, Hughes C, & Filatov DA (2018). Pleistocene glacial cycles drive isolation, gene flow and speciation in the high-elevation Andes. New Phytologist, 219(2), 779–793. [DOI] [PubMed] [Google Scholar]
- Nikolakis ZL, Orton RW, & Crother BI (2022). Fine-scale population structure within an Eastern Nearctic snake complex (Pituophis melanoleucus). Zoologica Scripta, 51(2), 133–146. [Google Scholar]
- Omernik JM (1987). Ecoregions of the conterminous United States. Annals of the Association of American Geographers, 77(1), 118–125. [Google Scholar]
- Omernik JM, & Griffith GE (2014). Ecoregions of the conterminous United States: Evolution of a hierarchical spatial framework. Environmental Management, 54(6), 1249–1266. [DOI] [PubMed] [Google Scholar]
- Orr HA (1995). The population genetics of speciation: The evolution of hybrid incompatibilities. Genetics, 139(4), 1805–1813. [DOI] [PMC free article] [PubMed] [Google Scholar]
- Pelletier TA, & Carstens BC (2016). Comparing range evolution in two western Plethodon salamanders: Glacial refugia, competition, ecological niches, and spatial sorting. Journal of Biogeography, 43(11), 2237–2249. [Google Scholar]
- Powell R, Conant R, & Collins JT (2016). Peterson Field Guide to Reptiles and Amphibians of Eastern and Central North America, Fourth Edition. Houghton Mifflin Harcourt. [Google Scholar]
- Provost KL, Myers EA, & Smith BT (2021). Community phylogeographic patterns reveal how a barrier filters and structures taxa in North American warm deserts. Journal of Biogeography, 48(6), 1267–1283. [Google Scholar]
- Pyron RA, & Burbrink FT (2009). Systematics of the Common Kingsnake (Lampropeltis getula; Serpentes: Colubridae) and the burden of heritage in taxonomy. Zootaxa, 2241, 22–32. [Google Scholar]
- R Core Team (2021). R: A language and environment for statistical computing. R Foundation for Statistical Computing, Vienna, Austria. URL https://www.R-project.org/. [Google Scholar]
- Ravinet M, Faria R, Butlin RK, Galindo J, Bierne N, Rafajlović M, Noor M. a. F., Mehlig B, & Westram AM (2017). Interpreting the genomic landscape of speciation: A road map for finding barriers to gene flow. Journal of Evolutionary Biology, 30(8), 1450–1477. [DOI] [PubMed] [Google Scholar]
- Remington CL (1968). Suture-zones of hybrid interaction between recently joined biotas. In Evolutionary Biology (pp. 321–428). Springer; US. [Google Scholar]
- Rocha JL, Godinho R, Brito JC, & Nielsen R (2021). Life in Deserts: The Genetic Basis of Mammalian Desert Adaptation. Trends in Ecology & Evolution, 36(7), 637–650. [DOI] [PMC free article] [PubMed] [Google Scholar]
- Rosenblum EB, Sarver BAJ, Brown JW, Des Roches S, Hardwick KM, Hether TD, Eastman JM, Pennell MW, & Harmon LJ (2012). Goldilocks meets Santa Rosalia: An ephemeral speciation model explains patterns of diversification across time scales. Evolutionary Biology, 39(2), 255–261. [DOI] [PMC free article] [PubMed] [Google Scholar]
- Roux C, Fraïsse C, Romiguier J, Anciaux Y, Galtier N, & Bierne N (2016). Shedding light on the grey zone of speciation along a continuum of genomic divergence. PLOS Biology, 14(12), e2000234. 10.1371/journal.pbio.2000234 [DOI] [PMC free article] [PubMed] [Google Scholar]
- Seehausen O, Butlin RK, Keller I, Wagner CE, Boughman JW, Hohenlohe PA, Peichel CL, Saetre G-P, Bank C, Brännström Å, Brelsford A, Clarkson CS, Eroukhmanoff F, Feder JL, Fischer MC, Foote AD, Franchini P, Jiggins CD, Jones FC, … Widmer A (2014). Genomics and the origin of species. Nature Reviews Genetics, 15(3), 176–192. [DOI] [PubMed] [Google Scholar]
- Seehausen O, Takimoto G, Roy D, & Jokela J (2008). Speciation reversal and biodiversity dynamics with hybridization in changing environments. Molecular Ecology, 17(1), 30–44. [DOI] [PubMed] [Google Scholar]
- Singhal S, Derryberry GE, Bravo GA, Derryberry EP, Brumfield RT, & Harvey MG (2021). The dynamics of introgression across an avian radiation. Evolution Letters, 5(6), 568–581. [DOI] [PMC free article] [PubMed] [Google Scholar]
- Singhal S, & Moritz C (2013). Reproductive isolation between phylogeographic lineages scales with divergence. Proceedings of the Royal Society B: Biological Sciences, 280(1772), 20132246. [DOI] [PMC free article] [PubMed] [Google Scholar]
- Soltis DE, Morris AB, McLachlan JS, Manos PS, & Soltis PS (2006). Comparative phylogeography of unglaciated eastern North America. Molecular Ecology, 15(14), 4261–4293. [DOI] [PubMed] [Google Scholar]
- Streicher JW, McEntee JP, Drzich LC, Card DC, Schield DR, Smart U, Parkinson CL, Jezkova T, Smith EN, & Castoe TA (2016). Genetic surfing, not allopatric divergence, explains spatial sorting of mitochondrial haplotypes in venomous coralsnakes. Evolution, 70(7), 1435–1449. [DOI] [PubMed] [Google Scholar]
- Swenson NG (2006). Gis-based niche models reveal unifying climatic mechanisms that maintain the location of avian hybrid zones in a North American suture zone. Journal of Evolutionary Biology, 19(3), 717–725. [DOI] [PubMed] [Google Scholar]
- Taylor EB, Boughman JW, Groenenboom M, Sniatynski M, Schluter D, & Gow JL (2006). Speciation in reverse: Morphological and genetic evidence of the collapse of a three-spined stickleback (Gasterosteus aculeatus) species pair. Molecular Ecology, 15(2), 343–355. [DOI] [PubMed] [Google Scholar]
- Title PO, & Bemmels JB (2018). ENVIREM: An expanded set of bioclimatic and topographic variables increases flexibility and improves performance of ecological niche modeling. Ecography, 41(2), 291–307. [Google Scholar]
- Toews DPL, & Brelsford A (2012). The biogeography of mitochondrial and nuclear discordance in animals. Molecular Ecology, 21(16), 3907–3930. [DOI] [PubMed] [Google Scholar]
- Wang J (2004). Application of the one-migrant-per-generation rule to conservation and management. Conservation Biology, 18(2), 332–343. [Google Scholar]
- Webb SD (1977). A History of Savanna Vertebrates in the New World. Part I: North America. Annual Review of Ecology and Systematics, 8(1), 355–380. [Google Scholar]
- Williams JB, & Tieleman BI (2005). Physiological Adaptation in Desert Birds. BioScience, 55(5), 416–425. [Google Scholar]
- Wilson JS, & Pitts JP (2010). Illuminating the lack of consensus among descriptions of earth history data in the North American deserts: A resource for biologists. Progress in Physical Geography: Earth and Environment, 34(4), 419–441. [Google Scholar]
- Wright S (1931). Evolution in Mendelian populations. Genetics, 16(2), 97–159. [DOI] [PMC free article] [PubMed] [Google Scholar]
Associated Data
This section collects any data citations, data availability statements, or supplementary materials included in this article.
Supplementary Materials
Appendix 1. Museum specimen numbers and locality information for all samples used in this study.
Figure S1. Demographic models tested in FastSimCoal2. Vertical gray bars indicate periods of time with no migration among lineages. In current M, recent resize and all M, recent resize models the migration rates are constant from Tdiv to the present.
Figure S2. Cross entropy scores for K=1–10 from sNMF for the full dataset.
Figure S3. Sampling map and cluster membership estimates from sNMF and DAPC at values of K=1–6. Points are colored proportional to their estimated ancestry in each of the clusters in each sNMF analysis or proportional to their probability of membership in each cluster in each DAPC analysis. All maps use the Mollweide projection.
Figure S4. Cross entropy scores for K=1–10 from sNMF for the dataset containing eastern individuals only.
Figure S5. Kernel density plot of geographic vs. genetic distance for the dataset containing eastern individuals only.
Figure S6. Cross entropy scores for K=1–10 from sNMF for the dataset containing western individuals only and map (Mollweide projection) of sNMF ancestry estimates from the best fit K=2 model. Points are colored proportional to their estimated ancestry in each of the clusters.
Figure S7. Kernel density plot of geographic vs. genetic distance for the dataset containing western individuals only.
Figure S8. Generalized dissimilarity model results for the eastern and western lineages analyzed separately. In each page, the top left shows the variable importance of geographic and ecological distances on predicting genetic distance. The overall models are significant at p < 0.01, as are the variables with asterisks above the bars. Other panels show the I- splines representing the genetic variation explained as a function of each predictor.
Table S1. AIC values of model fit and parameter estimates for all FSC models from Fig. S1.
Data Availability Statement
All scripts for data processing and analysis are available at https://github.com/seanharrington256/Lgetula_gbs. Processed data files for input into these scripts as well as supporting figures, tables, and appendices are available at https://doi.org/10.5061/dryad.18931zd16 and raw genomic data are available at on the NCBI Sequence Read Archive under BioProject ID PRJNA889851.