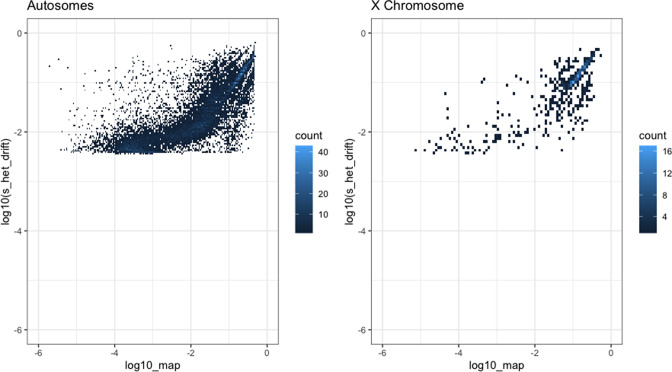
Appendix 1—figure 5. Comparison of our maximum a posteriori (MAP) estimates of hs (x-axis) and the shet measure from Weghorn et al., 2019 (y-axis) for the autosomes (left) and X chromosome (right).
Only the 15,275 genes for the autosomes and 583 genes for the X chromosome for which both estimates were available are included. For visualization, the color of each point reflects the number of overlapping genes on the plot.

