

Abstract
Dopamine is an important modulator of cognition and movement. We recently found that evoked dopamine secretion is fast and relies on active zone-like release sites. Here, we used in vivo biotin identification (iBioID) proximity proteomics in mouse striatum to assess which proteins are present at these sites. Using three release site baits, we identified proteins that are enriched over the general dopamine axonal protein content, and they fell into several categories, including active zone, Ca2+ regulatory, and synaptic vesicle proteins. We also detected many proteins not previously associated with vesicular exocytosis. Knockout of the presynaptic organizer protein RIM strongly decreased the hit number obtained with iBioID, while Synaptotagmin-1 knockout did not. α-Synuclein, a protein linked to Parkinson’s disease, was enriched at release sites, and its enrichment was lost in both tested mutants. We conclude that RIM organizes scaffolded dopamine release sites and provide a proteomic assessment of the composition of these sites.
Research organism: Mouse
Introduction
Dopamine is a critical neuromodulator and regulates target cells through G-protein-coupled receptor (GPCR) signaling (Berke, 2018; Liu et al., 2021a; Surmeier et al., 2014). In the vertebrate brain, midbrain dopamine neurons form a crucial regulatory system. The dopamine neuron somata are located in the substantia nigra pars compacta (SNc) and the ventral tegmental area (VTA), and one prominent target area of their axons is the striatum. In the striatum, dopamine is thought to act as a volume transmitter because only a small percentage of dopamine varicosities are directly apposed to postsynaptic specializations (Descarries et al., 1996; Wildenberg et al., 2021) and because dopamine receptors are found mostly extrasynaptically (Liu et al., 2021a; Rice et al., 2011; Sesack et al., 1994; Uchigashima et al., 2016; Yung et al., 1995). Hence, dopamine likely signals by diffusing through the extracellular striatal space before initiating responses in target cells. While much is understood about the mechanisms and molecules involved in the synaptic release of classical neurotransmitters, the machinery mediating the release of dopamine is less well known.
Spatial and temporal precision of vesicular exocytosis at classical synapses is established by the active zone, a conserved molecular machine that docks synaptic vesicles at the presynaptic plasma membrane close to voltage-gated Ca2+ channels, primes the vesicles for release, and aligns these processes with postsynaptic receptor clusters (Biederer et al., 2017; Südhof, 2012). Several lines of evidence point to the existence of active zone-like protein complexes for the control of striatal dopamine release. First, dopamine release is rapid, has a high release probability, and occurs at small hotspots (Banerjee et al., 2022; Banerjee et al., 2020; Beyene et al., 2019; Liu et al., 2018; Marcott et al., 2014; Patriarchi et al., 2018; Silm et al., 2019; Wang et al., 2014; Zych and Ford, 2022), indicating the need for vesicle tethering close to Ca2+ channels before the stimulus arrives. Second, at least some dopamine receptors respond rapidly to local, high concentrations of dopamine (Beckstead et al., 2004; Condon et al., 2021; Courtney and Ford, 2014; Gantz et al., 2013; Marcott et al., 2014), which likely necessitates synchrony of vesicular release. Third, dopamine neuron activity and secretion often correlate with behavior on fast time scales (Bova et al., 2020; Chaudhury et al., 2013; da Silva et al., 2018; Hamilos et al., 2021; Hollerman and Schultz, 1998; Howe and Dombeck, 2016; Jin and Costa, 2010; Schultz et al., 1997), suggesting the need for precise signaling mechanisms. Taken together these properties indicate the presence of protein machinery for rapid and efficient release of dopamine.
Indeed, our recent work has found that proteins for the control of spatial and temporal precision of synaptic vesicle exocytosis are important for evoked dopamine release. These proteins include the active zone scaffolds RIM and Liprin-α, the priming protein Munc13, and the fast Ca2+ sensor Synaptotagmin-1 (Syt-1) (Banerjee et al., 2022; Banerjee et al., 2020; Lebowitz et al., 2022; Liu et al., 2018; Robinson et al., 2019). Conversely, the active zone scaffolds RIM-BP and ELKS are dispensable for axonal dopamine release, even though at least ELKS is present at these sites (Banerjee et al., 2022; Liu et al., 2018). Striatal dopamine release only partially depends on voltage-gated Ca2+ channels of the CaV2 family, channels that are required for stimulated release at most synapses (Brimblecombe et al., 2015; Held et al., 2020; Liu et al., 2022; Luebke et al., 1993; Takahashi and Momiyama, 1993). Thus, there appear to be both similarities and differences in the secretory machines in dopamine varicosities compared with synapses. However, only a handful of proteins important for secretion are known to mediate dopamine release, and many pieces of the underlying secretory machine remain unidentified.
We here characterized the composition of dopamine release sites using an unbiased proteomic approach. We adapted in vivo biotin identification (iBioID), a method that allows for purifying proteins in close proximity to a marker protein (Kim et al., 2014; Roux et al., 2012; Uezu et al., 2016). Using three different release site bait proteins, we found that 527 proteins were present at these sites when we applied a threshold of ≥2.0-fold enrichment over soluble axonal proteins. A total of 190 proteins were enriched in multiple bait conditions and 41 proteins with all three baits. Many proteins with previously known functions at classical synapses were identified, including active zone, Ca2+ regulatory, and synaptic vesicle proteins, as well as proteins that presently do not have defined roles in axonal neurotransmitter secretion. We also tested whether structural scaffolding and dopamine release are important for the composition of these secretory sites. Conditional, dopamine neuron-specific knockout of the presynaptic organizer protein RIM strongly decreased the number of detected proteins, while that of the Ca2+ sensor Syt-1 to abolish synchronous dopamine release did not. We conclude that dopamine release sites are organized structures controlled by the scaffolding protein RIM, and we provide a proteomic assessment of the content of these release sites.
Results
Proximity proteomics to assess dopamine release site composition in the mouse striatum
With the overall goal to generate a comprehensive proteome of release sites in striatal dopamine axons, we adapted a proximity proteomic approach. We fused a promiscuous version of the biotinylase BirA (also called BirA*) (Roux et al., 2012; Uezu et al., 2016) to several proteins associated with dopamine release sites and expressed these bait proteins Cre-dependently using AAVs specifically in dopamine neurons of DATIRES-Cre mice (Bäckman et al., 2006). To locally biotinylate proteins in vivo, we provided excess biotin through subcutaneous injection for 7 days. We then performed affinity purification of the biotinylated proteins from striatal homogenates and identified them by mass spectrometry (Figure 1A). The striatal dopamine axons are particularly well suited for this approach because they are elaborately branched in the striatum and can be easily separated from their midbrain somata and dendrites during tissue dissection, limiting confounds arising from the co-purification of somatodendritic proteins.
Figure 1. In vivo biotin identification (iBioID) for release site proteins in dopamine axons of the mouse striatum.
(A) Schematic of the experiment with AAVs for Cre-dependent BirA fusion protein expression (AAV2/5-DIO-BirA-fusion), followed by in vivo biotinylation, affinity purification, and analyses by mass spectrometry. (B) Overview of BirA fusion proteins expressed Cre-dependently with AAVs in midbrain dopamine neurons of DATIRES-Cre mice, P: proline-rich motif, H: hemagglutinin (HA) tag. Each mouse expressed one of the three BirA baits (RIMPPCP-BirA, ELKS2β-BirA, and CaVβ4-BirA) or BirA-tdTomato (to generate a proteome for normalization). (C) Sample confocal images of striatal slices of DATIRES-Cre mice expressing the BirA fusion proteins shown in (B), slices were stained with anti-TH antibodies and anti-HA antibodies to label dopamine axons and BirA fusion proteins, respectively. Images are from an experiment in which all constructs were imaged in the same session and with the same settings, and adjusted identically for display, except for ELKS2β-BirA. Images for ELKS2β-BirA were acquired in a separate experiment and with its own control; these images were adjusted for brightness and contrast slightly differently to match overall appearance, and adjustments were identical to those made to its own control acquired at the same time and shown in Figure 1—figure supplement 1. A sample image area is shown from 3 to 5 overview images per mouse and condition, each experiment was repeated in ≥3 mice. (D–F) Protein enrichment in BirA bait conditions over BirA-tdTomato. Log2 fold change values are plotted as frequency histograms. Values at or below 0 represent proteins that are equal to or lower than in the BirA-tdTomato condition (light colors), values >0 represent proteins that are higher than in the BirA-tdTomato condition (saturated colors), and values ≥1 represent hits with ≥2.0-fold enrichment; (D) 1306 total proteins identified, 659 proteins with log2 fold change >0, and 269 proteins with log2 fold change ≥1 (hits); (E) 1496/805/382; (F) 1168/354/114. The gene encoding the protein that was used as a bait is shown as a dot and labeled individually in each panel; (D) 4 independent repeats (12 striata each); (E) 4 (12/12/12/10); (F) 4 (12/12/12/10). For sample images of the negative control for ELKS2β-BirA, see Figure 1—figure supplement 1; for pilot iBioID experiments and assessment of self-biotinylation, see Figure 1—figure supplement 2; for a table of all proteins identified, see Source data 1A; for cDNA sequences used to generate the fusion proteins, see Source data 1B.

Figure 1—figure supplement 1. Sample images for ELKS2β-BirA expression.
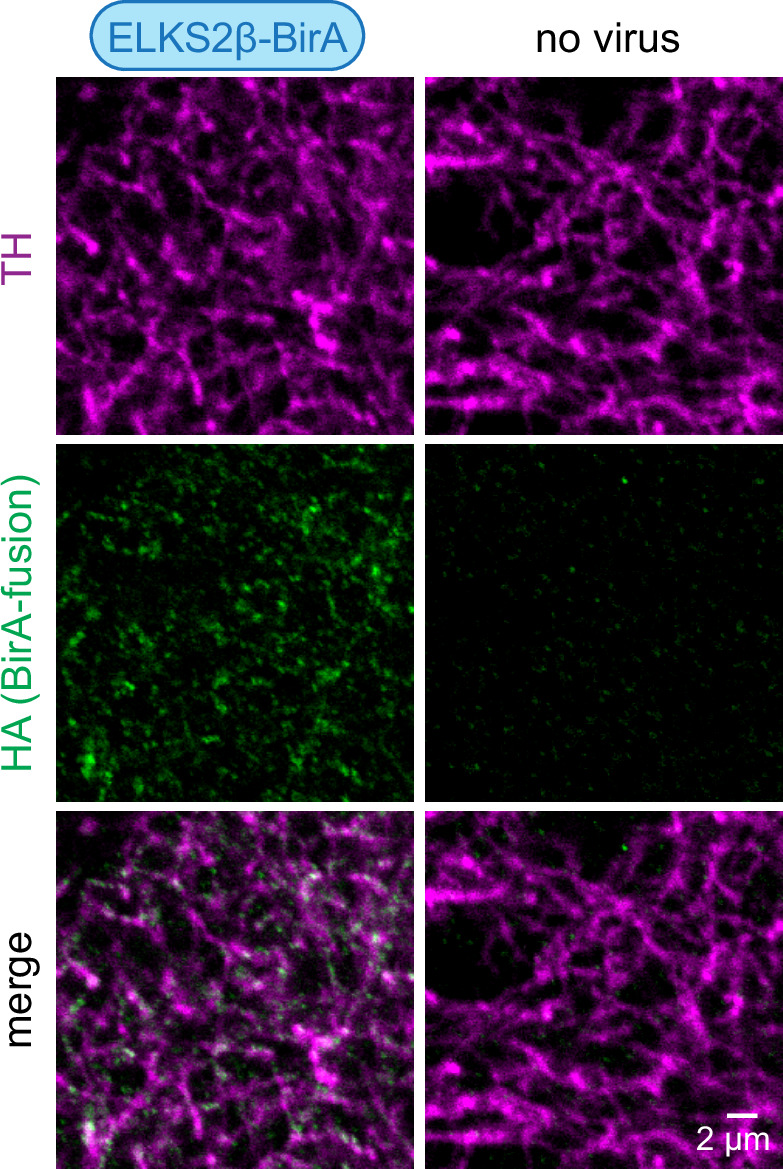
Figure 1—figure supplement 2. BirA fusion proteins are self-biotinylated and purified with iBioID.

We first generated a series of AAVs to express bait proteins in a Cre-dependent manner. In these bait proteins, BirA was fused to RIM or ELKS, active zone proteins associated with dopamine release sites (Banerjee et al., 2022; Liu et al., 2018), or to the β4 subunit of voltage-gated Ca2+ channels (CaVβ4), a component of CaV Ca2+ channel complexes that are present at release sites (Brimblecombe et al., 2015; Dolphin, 2003; Held et al., 2020; Tan et al., 2022b). Full-length active zone proteins fused to BirA exceed the packaging limit of AAVs. Considering this limitation, the following constructs were selected from initial trial experiments (Figure 1B): RIMPPCP-BirA, containing the central region of RIM (PDZ and C2A domains with endogenous linker sequences and proline-rich motifs) that is important for its active zone localization, with BirA inserted at the C-terminus (Kaeser et al., 2011; Tan et al., 2022a; Tang et al., 2016; Wu et al., 2019); ELKS2β-BirA, a short version of ELKS with BirA inserted between the CCC and CCD domains (Held et al., 2016; Kaeser et al., 2009; Liu et al., 2014); and CaVβ4-BirA, a CaV subunit with BirA inserted at the C-terminus (Dolphin, 2003; Held et al., 2020; Tan et al., 2022b). In all experiments, we used BirA fused to tdTomato (BirA-tdTomato) that localizes throughout the axon for calculating enrichment. All constructs also contained hemagglutinin (HA)-tags for identification with HA antibodies.
To assess the axonal presence of these BirA fusion proteins, we injected the AAVs into the midbrain of DATIRES-Cre mice. After 6 weeks, we perfused the mice and stained striatal brain slices with antibodies against HA (to label the fusion proteins) and antibodies against tyrosine hydroxylase (TH, to label dopamine axons) (Figure 1C, Figure 1—figure supplement 1). The fusion proteins were detected within TH-labeled axons. RIMPPCP-BirA and ELKS2β-BirA were present in small punctate structures consistent with release site localization (Liu et al., 2018). CaVβ4 appeared somewhat more widespread, similar to Ca2+ entry in these axons (Pereira et al., 2016), and BirA-tdTomato was broadly overlapping with TH, likely reflecting a soluble axonal localization. We previously performed superresolution microscopy to assess the localization of select endogenous dopamine axonal proteins (Banerjee et al., 2022; Banerjee et al., 2020; Liu et al., 2018). High-quality super-resolved images could not be obtained here, likely because of the specific antibodies and conditions that were needed. In vivo biotinylation was next confirmed for the BirA fusion proteins with or without biotin injections (for 7 days) followed by pilot biotin-affinity purifications and Western blotting of the purified fractions (Figure 1—figure supplement 2 and 'Materials and methods'). This established that biotinylation and protein purification are efficient, and that background biotinylation in the absence of biotin is limited.
To determine dopamine release site composition, we performed iBioID using these three BirA bait proteins and BirA-tdTomato expressed in DATIRES-Cre mice (Figure 1A). After 4–6 weeks of expression, biotin injections were done on seven consecutive days, and 10–12 striata per condition and repeat were dissected and homogenized. Biotinylated proteins were then isolated using affinity purification. The eluates were depleted with antibodies against pyruvate carboxylase (PC), an endogenously biotinylated protein, before assessment of protein content with mass spectrometry. In total, four independent biological repeats per BirA fusion protein were performed (i.e., four times 10–12 striata per condition, conditions: RIMPPCP-BirA, ELKS2β-BirA, CaVβ4-BirA, BirA-tdTomato, also see 'Materials and methods'). The four repeats were run as two large experiments for in vivo biotinylation, biotin affinity purification, and mass spectrometry; two repeats were run in parallel in each experiment, and the two experiments were run approximately 1 year apart from one another (the second experiment also contained analyses of conditional knockout mice described below).
Peptides from 1969 proteins were identified in at least one of the BirA conditions. A total of 300 (15%) of those proteins are mitochondrial proteins, which is common in iBioID, and these proteins were removed from further analyses unless noted otherwise, as has been done before (Loh et al., 2016; Uezu et al., 2016). To identify proteins enriched in the immediate vicinity of the bait proteins (RIMPPCP-BirA, ELKS2β-BirA, and CaVβ4-BirA), the number of peptides identified for each protein and bait was normalized to the number of peptides found for the same protein in the BirA-tdTomato condition, effectively generating a ratio of enrichment over soluble dopamine axonal protein content as fold change. For proteins that were not detected with all BirA fusions, we assigned an average value of 0.5 peptides so that we could calculate fold change values for proteins that otherwise had a 0 in the denominator and log2 of fold change for all detected proteins. After producing log2 of the fold change, values >0 represent proteins detected at levels higher than in the BirA-tdTomato condition (Figure 1D–F, saturated colors), while proteins <0 (light colors) were below. For the main analyses, 'hits' were proteins enriched ≥2.0-fold and have log2 fold change values of ≥1 (Figure 1D–F). These proteins are included in the analyses presented in Figure 2. Analyses with alternate enrichment thresholds are shown in Figure 2—figure supplements 1 and 2. These applied cutoffs are similar to previous studies using iBioID (Takano et al., 2020; Uezu et al., 2016).
Figure 2. Protein composition of release sites in dopamine axons.
(A) Venn diagram listing genes that encode protein hits enriched at least 2.0-fold over BirA-tdTomato with RIMPPCP-BirA, ELKS2β-BirA, or CaVβ4-BirA iBioID baits. Bait-encoding genes are shown outside the Venn diagram in the color of the corresponding part of the diagram. Enrichment is shown as the average of 4 independent repeats run in 2 mass spectrometry sessions (repeats 1 and 2 in the first session, repeats 3 and 4 in the second) and was calculated as described in the 'Materials and methods.' Circle size reflects average enrichment across repeats (key on the bottom right). For proteins enriched in multiple bait conditions, circle size corresponds to the bait condition with the largest enrichment. (B) Hits from (A) that have cellular compartment annotations in the SynGO database (Koopmans et al., 2019) are colored in brown and are classified into increasingly specific SynGO subcategories, subcategorizations are not mutually exclusive; proteins used as baits are not included. For a list of hits, see Source data 1C; for Venn diagrams constructed with 1.5- and 2.5-fold enrichment thresholds, see Figure 2—figure supplements 1 and 2; for a comparison of SynGO cellular compartment annotations across thresholds, see Figure 2—figure supplement 3; and for assessment of Neuroplastin (Nptn) localization in striatal synaptosomes, see Figure 2—figure supplement 4.

Figure 2—figure supplement 1. Venn diagram of the dopamine release site proteome with a 1.5-fold enrichment threshold.

Figure 2—figure supplement 2. Venn diagram of the dopamine release site proteome with a 2.5-fold enrichment threshold.

Figure 2—figure supplement 3. Assessment of release site hits listed in SynGO across enrichment thresholds.

Figure 2—figure supplement 4. Neuroplastin antibody labeling is enhanced in Bassoon-containing dopaminergic synaptosomes.

For RIMPPCP-BirA (Figure 1D) and ELKS2β-BirA (Figure 1E), 50% and 54% of the detected proteins were higher than with BirA-tdTomato, and 20% and 25% were above the 2.0-fold enrichment threshold, respectively. Only 30% of all proteins detected in the CaVβ4-BirA condition were higher compared to BirA-tdTomato, and 9% were enriched ≥2.0-fold. These observations generally align with the morphological data (Figure 1C), where CaVβ4-BirA appeared more widely expressed than RIMPPCP-BirA and ELKS2β-BirA. They are also consistent with functional analyses that revealed that Ca2+ entry in dopamine axons is widespread (Pereira et al., 2016), while active zone proteins (Banerjee et al., 2022; Liu et al., 2018) and release (Pereira et al., 2016) are only detected in 20–30% of the varicosities. In each condition, the protein that was used as a BirA bait was robustly enriched (individually labeled proteins in Figure 1D–F). This further establishes the approach, as self-biotinylation of the BirA fusion proteins should be high compared to other proteins if the labeling radius is small, which has been estimated to be 10–50 nm (Kim et al., 2014; Roux et al., 2012).
Assessment of the protein composition of release sites in dopamine axons
We next constructed Venn diagrams with proteins that were above the 2.0-fold enrichment threshold to assess the overlap of hits between the different bait conditions. In total, there were 527 proteins ≥2.0-fold enriched (Figure 2A). The enrichment compared to BirA-tdTomato indicates that these proteins have a localization that is restricted compared to general dopamine axonal proteins. Of the 527 proteins, 190 were enriched in more than one condition and 41 were enriched with all three baits, RIMPPCP-BirA, ELKS2β-BirA, and CaVβ4-BirA.
Given that the BirA baits are proteins with roles in transmitter secretion and are expressed in dopamine axons, it is expected that proteins with known roles in neurotransmitter release are enriched in the iBioID dataset. We assessed the hits by evaluating their cellular compartment annotations in SynGO, an expert-curated database that assigns localization and function of synaptic genes (Koopmans et al., 2019). Of the 527 enriched proteins, 194 (37%) have one or multiple synaptic cellular compartment annotations in SynGO (Figure 2B), reflecting that their synaptic localization has been established. SynGO does not distinguish between synapse or neurotransmitter type, but instead broadly determines whether there is evidence to support the presence or function of a given protein at synapses in general (Koopmans et al., 2019).
To assess how the enrichment threshold of ≥2.0 influenced this overall assessment of the release site proteome, we constructed Venn diagrams with alternate enrichment thresholds of ≥1.5 (Figure 2—figure supplement 1) or ≥2.5 (Figure 2—figure supplement 2). Naturally, the overall number of proteins that reached threshold varied, with 991 proteins being ≥1.5-fold and 348 proteins ≥2.5-fold enriched, compared to the 527 proteins detected with the ≥2.0-fold enrichment threshold. Changing enrichment thresholds did not increase the percentage of synaptic proteins as identified via SynGO (31% for ≥1.5 and 33% for ≥2.5 thresholds, respectively, Figure 2—figure supplement 3), justifying the use of ≥2.0 as the threshold for further analyses.
We next categorized the proteins based on whether they are known to be localized pre- or postsynaptically in order to assess which types of synaptic proteins were enriched. Proteins with SynGO annotations may have multiple annotations and can be both pre- and postsynaptic, but do not require a more specific annotation. A total of 102 proteins (19% of the entire dataset, 53% of the SynGO synaptic proteins) have a presynaptic annotation with many having additional specific assignments to the active zone or synaptic vesicles, while 87 (17% of the entire dataset, 45% of the SynGO synaptic proteins) have postsynaptic annotations (Figure 2B). Also, 43 proteins (8% of the entire dataset, 22% of the SynGO synaptic proteins) are annotated both pre- and postsynaptically.
If the iBioID approach used here enriched proteins at sites of dopamine release, it would be expected that proteins previously shown to localize to dopamine release sites are enriched. Indeed, RIM1 (Rims1), ELKS2 (Erc2), and Bassoon (Bsn), proteins that can be used as markers for dopamine release sites (Banerjee et al., 2022; Liu et al., 2018) and that were shown to be associated with synaptic vesicle docking sites using a different proteomic approach (Boyken et al., 2013), were all enriched across multiple conditions (Figure 2A).
Proteomic assessment of release site composition, like the one described here, can serve to identify new putative components. Of the 527 enriched proteins with the ≥2.0-fold threshold, 333 (63%) do not have a SynGO annotation (Figure 2B), and 46 proteins are annotated broadly as 'synaptic' without more exact specification. Additionally, for the characterization of the dopamine axon secretory machinery, proteins known to be associated with classical synaptic release that have not been implicated in dopamine release can also be identified. One example of the latter category is Neuroplastin (Nptn), a transmembrane protein with pre- and postsynaptic roles at synapses (Beesley et al., 2014; Boyken et al., 2013; Schmidt et al., 2017; Smalla et al., 2000). Neuroplastin is strongly enriched across conditions (Figure 2A), but its association with dopamine release sites has – to our knowledge – not been described. To assess Neuroplastin localization with a secondary approach, we prepared striatal synaptosomes as we described before (Banerjee et al., 2022; Banerjee et al., 2020; Liu et al., 2018) and stained them with antibodies against TH to mark dopamine synaptosomes, Bassoon to label release sites, and Neuroplastin. In particles labeled with TH, Neuroplastin antibody staining intensity was significantly higher when Bassoon was present (Figure 2—figure supplement 4). These results suggest that Neuroplastin is enriched in proximity to release sites of dopamine axons and provide an independent approach that helps validate iBioID for this specific hit.
Ablation of RIM, but not of Synaptotagmin-1, strongly decreased the number of proteins detected in the dopamine release site proteome
We next asked whether removing proteins important for dopamine release affects the composition of the dopamine release site proteome. Previous work has established genetic strategies to abolish (1) evoked dopamine release by removing the presynaptic scaffolding protein RIM (Banerjee et al., 2022; Liu et al., 2018; Robinson et al., 2019) or (2) synchronous dopamine release by removing the fast Ca2+ sensor Syt-1 (Banerjee et al., 2020; Lebowitz et al., 2022). We crossed mice with floxed alleles for RIM1 and RIM2 or for Syt-1 to DATIRES-Cre mice (Bäckman et al., 2006; Kaeser et al., 2011; Banerjee et al., 2020; Kochubey et al., 2016; Liu et al., 2018; Zhou et al., 2015) to remove these proteins from dopamine neurons (Figure 3A, RIM cKODA or Syt-1 cKODA, respectively). We then performed iBioID analogous to the proteome described in Figures 1 and 2 (called 'control proteome' from this point forward), with the modification that in each mutant we completed two independent repeats instead of four (i.e., two times 10–12 striata for each of the bait conditions in RIM cKODA and Syt-1 cKODA mice) due to the genetic complexity and volume of the experiment.
Figure 3. Enrichment of release site proteins after conditional ablation of RIM or of Synaptotagmin-1 from dopamine neurons.
(A) Strategy for ablation of RIM1 and RIM2 (RIM cKODA) or Synaptotagmin-1 (Syt-1 cKODA) from dopamine neurons using conditional mouse genetics (Banerjee et al., 2020; Liu et al., 2018). (B) The average number of peptides per protein in bins of five detected with BirA-tdTomato. The control is from data in Figures 1 and 2 and is the average peptide count of 4 repeats, the proteomes from RIM cKODA and Syt-1 cKODA are an average peptide count of 2 repeats each. The x-axis is cut at a peptide count of 50 covering >99% of the detected proteins. Average number of detected proteins: control, 1195; RIM cKODA, 1155; Syt-1 cKODA, 1011. (C–E) Protein enrichment in BirA bait conditions over BirA-tdTomato in RIM cKODA mice. Log2 fold change values are plotted as frequency histograms. Values at or below 0 represent proteins that are equal to or lower than in the BirA-tdTomato condition (light colors), values >0 represent proteins that are higher than in the BirA-tdTomato condition (saturated colors), and values ≥1 represent hits with ≥2.0-fold enrichment; (C) 1089 total proteins identified, 334 proteins with log2 fold change >0, and 149 proteins with log2 fold change ≥1 (hits); (D) 1003/123/62; (E) 1008/130/65. The gene encoding the protein that was used as a bait is shown as a dot and labeled individually in each panel: (C) 2 independent repeats (10/12 striata); (D) 2 (12/10); (E) 2 (10/12). (F–H) Same as (C–E), but for Syt-1 cKODA mice; (F) 1017 total proteins identified, 424 proteins with log2 fold change >0, and 199 proteins with log2 fold change ≥1 (hits); (G) 1103/619/327; (H) 1016/544/246, (F) 2 independent repeats (10/12 striata); (G) 2 (12/12); (H) 2 (12/12). Two-way ANOVA was used in (B) (genotype: p>0.6, peptide count: p<0.001). For a table of all peptides identified in RIM cKODA, see Source data 1F; for a table of all peptides identified in Syt-1 cKODA, see Source data 1G; and for Venn diagrams of release site protein enrichment, see Figure 3—figure supplement 1 for RIM cKODA and Figure 3—figure supplement 2 for Syt-1 cKODA.

Figure 3—figure supplement 1. Venn diagrams for the RIM cKODA dataset.

Figure 3—figure supplement 2. Venn diagrams for the Syt-1 cKODA dataset.

We first compared the BirA-tdTomato condition in control, RIM cKODA, and Syt-1 cKODA and found that both the number of identified proteins and the peptide counts were similar across experiments (Figure 3B). Hence, removal of RIM or Syt-1 from dopamine neurons did not cause strong disruptions in the overall dopamine axon protein content in the striatum. The presence of similar amounts of axonal material is consistent with previous work that found TH axon density to be similar to control mice in these mutants (Banerjee et al., 2020; Liu et al., 2018).
We next assessed fold change over tdTomato for each of the BirA baits and each mutant. In RIM cKODA mice, 31% (RIMPPCP-BirA), 12% (ELKS2β-BirA), and 13% (CaVβ4-BirA) of the identified proteins were higher than with BirA-tdTomato, and 14% (RIMPPCP-BirA), 6% (ELKS2β-BirA), and 4% (CaVβ4-BirA) reached the ≥2.0-fold enrichment threshold to be considered hits (Figure 3C–E). These percentages are overall lower than in the control proteome (Figure 1D–F). The protein enrichment over BirA-tdTomato in Syt-1 cKODA mice was more similar to the control proteome (Figure 3F–H, RIMPPCP-BirA: 42% higher than with BirA-tdTomato and 20% ≥2.0-fold enriched; ELKS2β-BirA: 56% and 30%, CaVβ4-BirA 53% and 24%). We conclude that in RIM cKODA mice, release site protein enrichment close to the baits is disrupted compared to control or Syt-1 cKODA mice. This suggests that RIM removal disrupts mechanisms important for release site scaffolding. Abolishing synchronous dopamine release by Syt-1 cKODA has no strong effects on the overall number of proteins detected at release sites in dopamine axons with iBioID.
We next assessed hits in more detail by generating and analyzing Venn diagrams for each mutant. The RIM cKODA dataset contained a total of 198 hits (Figure 3—figure supplement 1), compared to the 527 hits in the control proteome (Figure 2). RIM1 enrichment was absent from all conditions except for RIMPPCP-BirA, which likely reflects self-biotinylation of the bait. It is noteworthy that 49% of all hits (98 out of 198) in the RIM cKODA dataset came from the RIMPPCP-BirA bait only (Figure 3—figure supplement 1, yellow circle), indicating that expression of RIMPPCP, the central region of RIM containing its scaffolding domains (Figure 1B), may restore some scaffolding deficits caused by RIM cKODA. In Syt-1 cKODA mice, 450 hits were detected with the 2.0-fold enrichment threshold (Figure 3—figure supplement 2), similar to the 527 hits in the control dataset, and 104 (23%) of the hits were at least 2.0-fold enriched for all three BirA baits, including RIM (Figure 3—figure supplement 2, center). Changing enrichment thresholds to ≥1.5-fold (RIM cKODA: 268 hits; Syt-1 cKODA 602 hits) or ≥2.5-fold (RIM cKODA: 82 hits; Syt-1 cKODA 252 hits) substantiated the conclusion that RIM but not Syt-1 ablation strongly decreased the overall hit number.
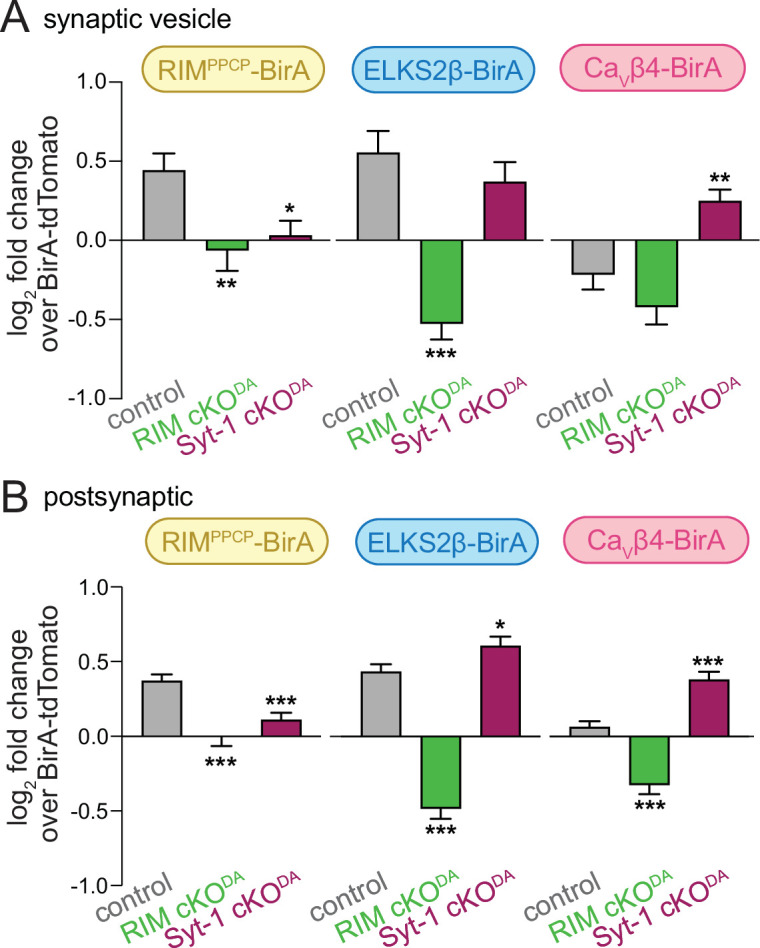
To characterize which proteins were depleted from the release site proteome in the RIM cKODA mice, we first used SynGO to categorize all identified proteins in each dataset into synaptic proteins (Figure 4A, gray bars), presynaptic proteins (Figure 4B), and active zone proteins (Figure 4C). We then plotted the log2 of the fold change of the average of all annotated proteins in each category. In the control dataset (gray bars), synaptic proteins were enriched as expected (Figure 4A), and the extent of enrichment had a tendency to increase as the SynGO annotation became more specific (to presynaptic, Figure 4B, and to active zone, Figure 4C). These effects not only disappeared in RIM cKODA mice, but instead reverted (Figure 4A–C, green bars), and for ELKS2β-BirA and CaVβ4-BirA, proteins in all three SynGO categories appeared depleted (log2 fold change values <0). The depletion is absent in the RIMPPCP-BirA condition in RIM cKODA mice, supporting that release site scaffolding is partially restored. In contrast to RIM cKODA, the proteins found in the Syt-1 cKODA dataset show an enrichment that is overall relatively similar to the control dataset with all conditions having log2 fold change values >0 (Figure 4A–C, maroon bars), supporting that abolishing synchronous dopamine release does not strongly disrupt overall release site protein content. These effects were overall similar for proteins annotated as synaptic vesicle or postsynaptic proteins in SynGO (Figure 4—figure supplement 1).
Figure 4. RIM cKODA disrupts the protein composition of release sites in dopamine axons.
(A) The average log2 fold change of identified proteins over the same proteins in the BirA-tdTomato conditions, all proteins with a synaptic localization annotation in SynGO for each bait and genotype are included. Positive values represent release site enrichment and negative values represent depletion relative to axonal protein content assessed with BirA-tdTomato. Total number of proteins detected with a SynGO annotation: control, 540; RIM cKODA, 412; Syt-1 cKODA, 438. (B) Same as (A), but for proteins with a presynaptic SynGO annotation. Total number of proteins: control, 257; RIM cKODA, 208; Syt-1 cKODA, 213. (C) Same as (A), but for proteins with an active zone SynGO annotation. Total number of proteins: control, 42; RIM cKODA, 37; Syt-1 cKODA, 36. (D) Proteins enriched in the RIM cKODA dataset mapped onto the control Venn diagram shown in Figure 2A. Proteins present in the control proteome but not in the RIM cKODA dataset are shown in light gray. Enriched proteins are colored based on relative enrichment (key on the right). Proteins in the RIM cKODA dataset that are only enriched with RIMPPCP-BirA are outlined in dark yellow independent of which bait enriched them in the control dataset. (E) Same as (D), but for the Syt-1 cKODA dataset and without outlining a specific condition. Data in (A–C) are shown as mean ± SEM, and significance is presented as *p<0.05, **p<0.01, and ***p<0.001. Two-way ANOVA was used in (A–C) (A: genotype ***, bait ***, interaction ***; B: genotype ***, bait **, interaction ***; C: genotype ***, bait *, interaction not significant), and Bonferroni post-hoc tests (p-values indicated in figure) were used to compare each genotype to control for each BirA bait. For analyses as in (A–C) but for proteins with a synaptic vesicle or postsynaptic SynGO annotation, see Figure 4—figure supplement 1.

Figure 4—figure supplement 1. Analyses of enrichment of synaptic vesicle and postsynaptic proteins across genotypes.
We next mapped the ≥2.0-fold enriched proteins detected in each mutant onto the Venn diagram of the control proteome shown in Figure 2. Only 15% of proteins in the control dataset were also enriched in the RIM cKODA dataset (Figure 4D), and 49% of those proteins stem from the RIMPPCP-BirA condition (Figure 4D, circles with yellow outline). In contrast, 37% of the proteins in the control dataset were also enriched in the Syt-1 cKODA dataset (Figure 4E). The observation that there is no full overlap between the control and Syt-1 cKODA datasets is likely due to a combination of factors. Examples are that the approach may not be saturating and may not detect all release site proteins, that the mutant data were derived from fewer repeats, and that Syt-1 cKODA may influence the exact composition but not the overall extent of the release site proteome.
Finally, to assess the organization of the proteins and their interactions in the various release site proteomes, we used the STRING database (Snel et al., 2000; Szklarczyk et al., 2019). STRING combines both theoretical predictions and empirical data to generate maps of protein–protein functional and physical interactions. We selected the proteins that were ≥2.0-fold enriched and assigned as synaptic proteins in SynGO (Figure 2B, Figure 3—figure supplement 1B, Figure 3—figure supplement 2B, 'synaptic'), and analyzed each dataset (Figure 5A–C). In the control dataset, the proteins formed an integrated network with functional nodes classified as active zone proteins, synaptic vesicle proteins, Ca2+ regulatory proteins, and synaptic ribosomes (Figure 5A). The same nodes were detected in the Syt-1 cKODA mice (Figure 5C), substantiating the overall similarities of these datasets. In contrast, these networks were disrupted in RIM cKODA mice (Figure 5B), even when hits from the RIMPPCP-BirA bait (lighter colors in Figure 5B) were included. Only the synaptic ribosome node remained, suggesting that while release site disruption was strong in RIM cKODA mice, other protein complexes near the bait proteins remained intact.
Figure 5. STRING diagrams illustrate functional categories of release site proteins and their disruption in RIM cKODA mice.

(A) STRING diagram of the enriched proteins that have a synaptic SynGO annotation in the control dataset. Physical or functional interactions determined by either empirical data or predictive modeling are illustrated as lines between proteins (Snel et al., 2000; Szklarczyk et al., 2019). The BirA bait proteins are color-coded. Functional categories identified by STRING analyses are labeled close to the corresponding clusters. (B) Same as (A), but for the RIM cKODA dataset. The proteins that are enriched only in the RIMPPCP-BirA bait are shown in lighter gray. (C) Same as (A), but for the Syt-1 cKODA dataset. Number of proteins: (A) 194; (B) 79; (C) 163.
Disrupted recruitment of α-synuclein to release sites in dopamine axons after impairing dopamine release
Loss of dopamine neurons underlies the motor symptoms characteristic of Parkinson’s disease (Poewe et al., 2017), and recent human genetic studies establish that mutations in RIMS genes increase the risk of Parkinson’s disease and are key drivers of disease progression (Liu et al., 2021b; Nalls et al., 2019). Monogenic forms of Parkinson’s disease exist and genetic associations with variable penetrance have been described (Blauwendraat et al., 2020; Day and Mullin, 2021; Marras et al., 2016). Our control dataset contained five of these genes: Snca, Park7, Dnajc6, Synj-1, and Vps35 (Figure 6A). Three were enriched in the release site proteome with at least one of the BirA baits, and Snca, which encodes the synaptic vesicle associated protein α-synuclein, was ≥2.0-fold enriched in each condition (Figures 2A and 6A). In both RIM cKODA and Syt-1 cKODA mice, α-synuclein enrichment was reduced and fell below the 2.0-fold threshold (Figure 6B, Figure 3—figure supplements 1A and 2A). α-Synuclein is associated with synaptic vesicles and regulates synaptic vesicle clustering, SNARE complex formation, and endocytosis (Burré et al., 2010; Diao et al., 2013; Murphy et al., 2000). RIM or Syt-1 knockout causes a loss of docked vesicles at synapses (Chang et al., 2018; Kaeser et al., 2011). If these proteins have similar roles in dopamine axons, the loss of α-synuclein enrichment might be explained by reduced vesicle docking.
Figure 6. Genes associated with Parkinson’s disease in the dopamine release site proteomes.

(A) Enrichment of proteins associated with monogenic forms of Parkinson’s disease (Blauwendraat et al., 2020; Day and Mullin, 2021; Marras et al., 2016) in the control dataset. Hits above the 2.0-fold enrichment threshold are shown in saturated colors, and those below the threshold in light colors; control, 4 independent repeats per bait condition. (B) Enrichment of the five proteins shown for each bait and in control, RIM cKODA and Syt-1 cKODA; control, 4 independent repeats (as described in Figure 1), RIM cKODA, 2 (as described in Figure 3); Syt-1 cKODA, 2 (as described in Figure 3).
Discussion
We used iBioID to assess release site composition in striatal dopamine axons using three bait proteins. Applying a ≥2.0-fold enrichment threshold, we identified 527 proteins, of which 190 were enriched with multiple baits. This proteome contains known secretory machinery, including active zone, Ca2+ regulatory, and synaptic vesicle proteins, and additional proteins not previously associated with vesicular exocytosis. Dopamine neuron-specific knockout of RIM, but not of Syt-1, strongly decreased the number of enriched proteins. We conclude that dopamine axons contain active zone-like sites with secretory machinery for rapid vesicular exocytosis and present an assessment of the protein composition of these sites. Each newly detected protein will require validation for a definitive assignment to dopamine release sites. Our findings establish that the integrity of these active zone-like sites strongly depends on the scaffolding protein RIM.
Proximity proteomics establish a scaffolding role for RIM in dopamine axons
In previous studies, we found that several active zone proteins are present in release site-like structures of striatal dopamine axons, including Bassoon, RIM, Munc13, and ELKS. Using dopamine-neuron-specific knockout, we established that RIM and Munc13 are essential for evoked axonal dopamine release, while ELKS and RIM-BP are dispensable. RIM removal also induced deficits in Bassoon clustering in striatal dopamine axons. We proposed the model of active zone-like release sites for action potential-evoked dopamine release (Banerjee et al., 2022; Liu et al., 2021a; Liu et al., 2018; Liu and Kaeser, 2019). We here used iBioID to generate a list of putative components of these sites. We found that active zone proteins, synaptic vesicle proteins, Ca2+ regulatory proteins, and many additional proteins are present. RIM was enriched across datasets, perhaps indicating a role for RIM in dopamine active zone assembly. RIM ablation from dopamine axons indeed resulted in a strong reduction in the number of proteins identified as release site components with iBioID. This loss of material was observed more strongly with ELKS2β-BirA and CaVβ4-BirA than with RIMPPCP-BirA, suggesting that RIMPPCP-BirA partially restored release site composition. Together with previous data, these findings establish a key scaffolding role for RIM at dopamine release sites. The overall reduced number of hits in RIM cKODA mice also suggests that many hits in the control proteome are specific.
Reductions in hit numbers in RIM cKODA mice might at least in part arise from mislocalized BirA baits in their dopamine axons. However, aberrant bait localization likely does not explain all effects. Twenty-two proteins were enriched with all three baits in RIM cKODA mice, indicating overlapping labeling radii with a resulting proteome relying on bait colocalization (Figure 3—figure supplement 1A, Figure 5). In a previous study, overall dopamine axon morphology was not strongly disrupted in RIM cKODA mice apart from changes in Bassoon clustering (Liu et al., 2018). Here, the general axonal proteome identified by BirA-tdTomato was similar between RIM cKODA and control mice (Figure 3B), arguing for a generally intact axonal arbor in these mice. Together, these points make it unlikely that bait mislocalization fully accounts for the disruption observed in RIM cKODA mice. Even if some of the bait protein is mislocalized, the main conclusion that RIM ablation disrupts release site structure in dopamine axons is supported through this mislocalization.
An active zone-like site for dopamine release
Two recent studies have assessed the composition of dopamine axons or of dopamine varicosities using different methodologies (Hobson et al., 2022; Paget-Blanc et al., 2022). Neither of the studies was designed to enrich for release site proteins over other proteins in dopamine axons. One used mass spectrometry to analyze dopaminergic synaptosomes obtained through fluorescent sorting (Paget-Blanc et al., 2022) and identified 57 proteins associated with these synaptosomes, which contain release sites, vesicles, mitochondria, cytoskeletal elements, and many other components. A second study used proximity proteomics with APEX2 to identify axonal proteins (Hobson et al., 2022), similar to the BirA-tdTomato condition used for normalization in our experiments. Indeed, there is good overlap between the axonal proteins identified with BirA-tdTomato in our experiments with those in Hobson et al., 2022, with 65% of the proteins identified here also present with the APEX2-based method.
We here used an approach to determine enrichment at release sites over these axonal proteomes. RIM1 (Rims1), Bassoon (Bsn), and ELKS1 (Erc1), ELKS2 (Erc2), and P/Q-type (CaV2.1, Cacna1a) and N-type Ca2+ channels (CaV2.2, Cacna1b) were all detected, consistent with previous studies that assessed roles and/or localization of these proteins in dopamine neurons (Banerjee et al., 2022; Brimblecombe et al., 2015; Daniel et al., 2009; Ducrot et al., 2021; Liu et al., 2022; Liu et al., 2018; Uchigashima et al., 2016), and overlapping with a proteomic study that determined release site composition at synapses via purifying proteins associated with docked synaptic vesicles (Boyken et al., 2013). The active zone proteins Liprin-α and RIM-BP were not present in the 2.0-fold enriched dataset. We found that Liprin-α2 and -α3 knockout has less severe effects on dopamine release compared to RIM knockout, while removal of RIM-BP leaves dopamine release unimpaired (Banerjee et al., 2022; Liu et al., 2018). Thus, the presence of active zone proteins in iBioID generally correlates with their known functional roles in dopamine release. One exception to this correlation is Munc13. Striatal dopamine release is strongly impaired after Munc13 ablation (Banerjee et al., 2022), but only enriched in some cases with iBioID (Figures 2 and 5, Figure 3—figure supplements 1 and 2). At synapses, some Munc13 may be more broadly distributed than just at active zones (Tan et al., 2022a; Tan et al., 2022b), but this does not explain its nonenrichment here because in the BirA-tdTomato dataset, Munc13 was not strongly detected either. Hence, Munc13 may either be overall sparse despite its requirement for evoked dopamine release or may be difficult to detect, for example, because it is poorly biotinylated or not easily affinity-purified. Notably, Munc13 was also absent in the release site proteome assessed via docked vesicles (Boyken et al., 2013). Overall, while a saturated proteome is challenging to obtain, many of the proteins previously shown to mediate dopamine release were detected with iBioID.
Dopamine neurons corelease glutamate and GABA (Hnasko et al., 2010; Stuber et al., 2010; Tritsch et al., 2012). While GABA is loaded into vesicles via VMAT2 (Melani and Tritsch, 2022; Tritsch et al., 2012), glutamate corelease may or may not originate from the same vesicular compartment (Hnasko et al., 2010; Silm et al., 2019; Zhang et al., 2015) and it is currently not possible to determine whether some iBioID hits might be from dedicated release sites for glutamate. Overall, however, our results fit with candidate approaches on dopamine release (Banerjee et al., 2022; Liu et al., 2018), suggesting that the proteome we describe might in general represent dopamine release sites.
Postsynaptic, unknown, and unexpected proteins in the dopamine release site proteome
There were 87 proteins with postsynaptic SynGO annotations in the release site proteome. Apart from experimental noise, multiple possibilities may account for this. First, SynGO may not have enough empirical evidence to designate any given protein as presynaptic. Some proteins with only postsynaptic annotations may be genuinely present in the dopamine release machinery. Second, dopamine axons receive input from cholinergic interneurons (Cachope et al., 2012; Threlfell et al., 2012; Zhou et al., 2001), and activation of nicotinic receptors triggers dopamine axon action potential firing (Liu et al., 2022). The structure and organization of this cholinergic input are commonly considered nonsynaptic (Chang, 1988; Jones et al., 2001), but synaptic-like transmission exists (Kramer et al., 2022). Hence, dopamine varicosities may in principle contain postsynaptic scaffolds, although nicotinic acetylcholine receptors were not detected with iBioID. Third, the estimated labeling radius of iBioID is up to 50 nm (Kim et al., 2014; Roux et al., 2012). Striatal dopamine axons make sparse synaptic-like connections with medium spiny neurons that contain the GABAergic postsynaptic scaffold Gephyrin (Uchigashima et al., 2016; Wildenberg et al., 2021). Gephyrin (Gphn) was indeed enriched with ELKS2β-BirA and RIMPPCP-BirA (Figure 2). Biotinylation across membranes may be common in iBioID, and detection of intramitochondrial proteins and of synaptic vesicle proteins with postsynaptic baits has been observed (Uezu et al., 2016). It is noteworthy that in our experiments dopamine receptors were not enriched, consistent with their localization outside of the postsynaptic scaffolds in target neurons (Uchigashima et al., 2016).
The proteome presented in Figure 2 contains 63% proteins that are not annotated in SynGO. Some of these proteins may be real hits that are not included in SynGO, while others may be experimental noise. Cend1, for example, a protein associated with cell cycle exit, appears both in our data and a previous vesicle docking proteome, and electron microscopic studies suggested that it might be present at the presynaptic plasma membrane (Boyken et al., 2013; Patsavoudi et al., 1995; Politis et al., 2007). It is surprising that Hist1h1d and Hist1h4a, genes encoding for the histone proteins H1.3 and H4, were robustly enriched (Figure 2A). These hits might be entirely unspecific or their co-purification could be due to biotinylation of H1 and H4 proteins (Stanley et al., 2001). It is also possible that there are unidentified synaptic functions of some of the unexpected proteins. An example for recently identified synaptic functions of nuclear proteins are those of the kinetochore complex (Zhao et al., 2019).
Some hits might arise because the BirA baits are not exclusively at release sites. Localization away from release sites is in part expected because a fraction of any release site protein will be away from its endogenous target localization. It might also be caused or amplified by the approach, for example, through viral bait expression and/or modification of protein sequences through bait design. The baits are made in the soma and transported along the axon. Some hits could reflect activity during protein trafficking that occurs within the 7-day time window for biotinylation. Transport complexes may be distinct between the baits and BirA-tdTomato and thus show as enriched. Indeed, several kinesins (Kif21a, Kif21b, Kif5a, Kif5b) were enriched, possibly reflecting transport packets. The synaptic ribosomes (Figure 5) that reached the 2.0-fold threshold across conditions may also reflect hits by non-active zone-localized bait proteins.
Summary of conclusions and limitations
Altogether, we present an assessment of dopamine release site content. Each protein will require validation through morphological and functional characterization before an unequivocal assignment to dopamine release sites is possible. As discussed, some hits may be noise, viral expression of tagged and modified bait proteins may influence the results, and thresholding strongly affects the overall number of proteins included in the release site proteome. We note that iBioID does not identify direct interaction partners. Instead, the defining property is proximity to the bait. The estimated ~50 nm labeling radius goes beyond the radius of protein interactions for most proteins. Despite these limitations, we have made progress. The presented data support a model of active zone-like dopamine release sites for rapid and efficient dopamine secretion. The disruption of the iBioID-generated proteome when RIM is removed establishes a scaffolding role for RIM. This role appears more pronounced in dopamine axons compared to classical synapses. Although similar proteomic approaches were not performed, RIM ablation does not severely disrupt release site structure at classical synapses when assessed with microscopy, but redundant scaffolds might maintain the sites instead (Acuna et al., 2016; de Jong et al., 2018; Emperador-Melero and Kaeser, 2020; Kaeser et al., 2011; Kushibiki et al., 2019; Oh et al., 2021; Tan et al., 2022a; Tan et al., 2022b; Wang et al., 2016). Overall, our work supports the model that dopamine release site scaffolding may have less redundancy and rely heavily on RIM (Banerjee et al., 2022; Liu et al., 2018).
Materials and methods
Key resources table.
| Reagent type (species) or resource | Designation | Source or reference | Identifiers | Additional information |
|---|---|---|---|---|
| Genetic reagent (Mus musculus) | B6.SJL-Slc6a3tm1.1(Cre)Bkmm/J (DATIRES-Cre) | Bäckman et al., 2006 | RRID:IMSR_JAX:006660 | |
| Genetic reagent (M. musculus) |
Rims1tm3Sud/J (RIM1αβfl/fl) |
Kaeser et al., 2008 | RRID:IMSR_JAX:015832 | |
| Genetic reagent (M. musculus) |
Rims2tm1.1Sud/J (RIM2αβγfl/fl) |
Kaeser et al., 2011 | RRID:IMSR_JAX:015833 | |
| Genetic reagent (M. musculus) |
C57BL/6Ntac-Syt1tm1a(EUCOMM)Wtsi/WtsiCnrm (Syt-1fl/fl) |
Zhou et al., 2015 | RRID:IMSR_EM:06829 | The identifier refers to the line before flp recombination |
| Cell line (Homo sapiens) | HEK293T cells | ATCC | Cat#: CRL-3216; RRID:CVCL_0063 | |
| Recombinant DNA reagent | pAAV2/5-syn-DIO-RIM-PRM-PDZ-PxxP-C2A-BirA | This study | LK18005; lab plasmid code (LPC) p864 | This reagent was used to generate AAV viruses and can be obtained from the corresponding author |
| Recombinant DNA reagent | pAAV2/5-syn-DIO- ELKS2β-BirA | This study | LK17008; LPC p857 | This reagent was used to generate AAV viruses and can be obtained from the corresponding author |
| Recombinant DNA reagent | AAV2/5-syn-DIO-CaVβ4-BirA | This study | LK19004; LPC p868 | This reagent was used to generate AAV viruses and can be obtained from the corresponding author |
| Recombinant DNA reagent | AAV2/5-syn-DIO-BirA-tdTomato | This study | LK17011; LPC p860 | This reagent was used to generate AAV viruses and can be obtained from the corresponding author |
| Antibody | Anti-HA (rabbit polyclonal) | Cell Signaling Technology | CAT# 5017; RRID:AB_10693385, lab antibody code (LAC) A40 |
Immunofluorescence (IF) (1:500) |
| Antibody | Anti-HA (mouse monoclonal) | BioLegend | CAT# 901501; RRID:AB_2565006, LAC A12 |
IF (1:500) Western blot (WB) 1:500 |
| Antibody | Anti-tyrosine hydroxylase (guinea pig polyclonal) | SySy | CAT# 213 104; RRID:AB_2619897, LAC A111 |
IF (1:1000) |
| Antibody | Anti-Bassoon (mouse monoclonal) | Millipore | CAT# ADI-VAM-PS003-F; RRID:AB_11181058, LAC A85 | IF (1:500) |
| Antibody | Anti-Neuroplastin (goat polyclonal) | R&D Systems | CAT# AF5360; RRID:AB_2155920, LAC A253 |
IF (1:500) |
| Antibody | Anti-red fluorescent protein (rabbit polyclonal) | Rockland | CAT#600-401-379; RRID:AB_2209751, LAC A81 | WB (1:1000) |
| Antibody | Anti-β-actin (mouse monoclonal) | Sigma-Aldrich | CAT# A1978; RRID:AB_476692, LAC A127 |
WB (1:10,000) |
| Antibody | Anti-pyruvate carboxylase (rabbit polyclonal) | Novus | CAT# NBP1-49536G; RRID:AB_11016707, LAC A252 | This antibody was used for depletion as described in the 'Materials and methods' |
| Software, algorithm | Prism9 | GraphPad | RRID:SCR002798; https://www.graphpad.com/scientific-software/prism |
|
| Software, algorithm | Cytoscape v 3.8.2 | Cytoscape | RRID:SCR003032; http://cytoscape.org/ |
|
| Software, algorithm | SEQUEST PRO | Thermo Fisher | https://scicrunch.org/resolver/SCR_014594 | |
| Software, algorithm | MATLAB code for object analysis | Liu, 2021 | https://github.com/kaeserlab/3DSIM_Analysis_CL |
Mouse lines
Expression via AAVs and ablation of active zone proteins in dopamine neurons was performed in mice with Cre recombinase specifically expressed in these neurons (Bäckman et al., 2006) (Jackson Laboratories; RRID:IMSR_JAX:006660, B6.SJL-Slc6a3tm1.1(Cre)Bkmm/J, also called DATIRES-Cre mice). iBioID to generate the control proteome was performed in mice heterozygote for this allele. Conditional ablation of RIM in dopamine neurons (RIM cKODA) was performed as described (Liu et al., 2018). Mice with floxed alleles for Rims1 (to remove RIM1α and RIM1β, RRID:IMSR_JAX:015832, Rims1tm3Sud/J) (Kaeser et al., 2008) and Rims2 (to remove RIM2α, RIM2β and RIM2γ, RRID:IMSR_JAX:015833, Rims2tm1.1Sud/J) (Kaeser et al., 2011) were crossed to DATIRES-Cre mice. Conditional ablation of Syt-1 in dopamine neurons (Syt-1 cKODA) was performed as described (Banerjee et al., 2020). Mice with floxed alleles for Syt-1 (RRID:IMSR_EM:06829, C57BL/6Ntac-Syt1tm1a(EUCOMM)Wtsi/WtsiCnrm) (Skarnes et al., 2011) were flp-recombined and analyzed before (Kochubey et al., 2016; Zhou et al., 2015). They were crossed to DATIRES-Cre mice as described in Banerjee et al., 2020. For generating cohorts of mice for iBioID, the floxed alleles were homozygote in both parents and one parent contained a heterozygote DATIRES-Cre allele. Male and female mice were used in all experiments irrespective of sex. All animal experiments were approved by the Harvard University Animal Care and Use Committee (protocol number IS00000049).
Plasmids, cell lines, and AAVs
AAVs were generated to express BirA fusion proteins in dopamine neurons. The following cDNAs were produced by standard techniques (for sequences, see source data tables): LK18005-AAV2/5-syn-DIO-RIMPPCP-BirA (also called LK18005-AAV2/5-syn-DIO-RIM-PRM-PDZ-PxxP-C2A-BirA, p864), LK17008-AAV2/5-syn-DIO-ELKS2β-BirA (p857), LK19004-AAV2/5-syn-DIO-CaVβ4-BirA (p868), and LK17011-AAV2/5-syn-DIO-BirA-tdTomato (p860). A cDNA encoding a promiscuous version of BirA (also called BirA*) was provided by S. Soderling and A. Uezu (Roux et al., 2012; Uezu et al., 2016). p864 to express RIMPPCP-BirA was generated based on a RIM full-length cDNA (de Jong et al., 2018; Kaeser et al., 2011; Tan et al., 2022b), and it contained endogenous proline-rich motifs (PRMs, also called PxxP motifs), the PDZ and C2A domains, and corresponding endogenous linkers, with BirA flanked by HA-tags added at the C-terminus. The RIMPPCP-BirA protein had the following sequence (numbered in subscript according to amino acid sequences of XM_039084276.1 for RIM and of UVH36278.1 for BirA): M-RIM1,524RPSP...GSIEQ1120-AAAYPYDVPDYA-BirA,154DNTV...SAEK472-AYPYDVPDYA. p857 to express ELKS2β-BirA was produced based on previously published N-terminally tagged ELKS2β (Kaeser et al., 2009) with removal of most of the N-terminal tag and insertion of BirA flanked by HA sequences between the coiled-coil regions CCC and CCD. The ELKS2β-BirA protein had the following sequence (numbered in subscript according to amino acid sequences of NM_170787.3 for ELKS2 and of UVH36278.1 for BirA): MGAALNRSVQTCFCSRMPCEQQICSH-ELKS2,367ELHRR…NIED657-AAAYPYDVPDYA-BirA,154DNTV….SAEK472-AYPYDVPDYAISRWRA-ELKS2,658DSRMN….GIWA921. p868 to express CaVβ4-BirA was produced from a previously used plasmid that was generated from a cDNA obtained from Annette Dolphin through Addgene (Addgene #107426; https://www.addgene.org/107426/; RRID:Addgene_107426; Brodbeck et al., 2002; Tan et al., 2022b) with addition of a linker sequence and an HA-flanked BirA protein at the C-terminus. The CaVβ4-BirA protein had the following sequence (numbered in subscript according to amino acid sequences of NM_001399143.1 for CaVβ4 and of UVH36278.1 for BirA): CaVβ4,1MSSS...RHRL519-VYNPAHNIEDAAAYPYDVPDYA-BirA,154DNTV...SAEK472-AYPYDVPDYA. p860 to express BirA-tdTomato was generated by fusing the BirA protein with tdTomato connected with a linker sequence that included an HA-tag. The BirA-tdTomato protein had the following sequence (numbered in subscript according to amino acid sequences of UVH36278.1 for BirA and of AJP62580.1 for tdTomato): M-BirA,154DNTV...SAEK472-AYPYDVPDYAGAPAS-tdTomtato,2VSKG...ELYK476. AAVs were made in HEK293T cells (purchased mycoplasma free from ATCC, CRL-3216, RRID:CVCL_0063, immortalized human cell line of female origin) using Ca2+ phosphate transfection and were of the serotype 2/5. Three days after transfection, HEK293T cells were collected and stored in freezing buffer (150 mM NaCl, 20 mM Tris-Cl, 2 mM MgCl2, pH 8.0) at –20°C until the virus was purified. For purification of AAVs, cells were lysed by three freeze-thaw cycles with dry ice/ethanol and a 37°C incubator. After 1 hr benzonase nuclease treatment at 37°C, cells were loaded onto an iodixanol gradient (5 ml each, 15%, 25%, 40%, 60%) and ultra-centrifuged at 208,000 × g for 4 hr. Viral particles were then purified from the 40% layer of the gradient. Quantitative reverse transcriptase PCR was used to determine viral titers, and viruses were used at concentrations ranging from 4.0 × 10¹¹ to 9.6 × 10¹² viral genome copies/ml.
Stereotaxic surgery and biotin injections
Mice (at postnatal days 30–55) were anesthetized in a 5% isoflurane induction chamber and then mounted on a stereotaxic frame; anesthesia was maintained with 1.5–2% isoflurane for the length of the surgery with a nose cone. The scalp was cut open and a hole was drilled in the skull and 1 µl of AAV viral solution was injected in the substantia nigra pars compacta (right or bilaterally depending on the experiment, 0.6 mm anterior, ±1.3 mm lateral of Lambda and 4.2 mm below the surface of the brain) using a microinjector pump (PHD ULTRA, Harvard Apparatus) at 100 nl/min. Mice were treated with post-surgical analgesia and were allowed to recover for at least 28 days prior to biotin injections (for iBioID) or transcardial perfusion (for morphological experiments). Biotin injections were started 4–6 weeks after stereotaxic AAV injection. Mice were subcutaneously injected for seven consecutive days with 500 µl of 5 mM biotin dissolved in phosphate-buffered saline (PBS).
Immunostaining and confocal imaging of brain sections
At least 4 weeks after stereotaxic injection of BirA viruses, mice (58–100 days old) were deeply anesthetized with isoflurane. Transcardial perfusion was performed with 30–50 ml ice-cold PBS followed by 50 ml of 4% paraformaldehyde in PBS (4% PFA) at 4°C. Brains were then dissected out and incubated in 4% PFA for overnight at 4°C. Fixed brains were sliced on a vibratome (Leica, VT1000s) at 100 μm thickness. Coronal sections containing the midbrain and striatum were collected in ice-cold PBS. Sections were blocked in PBS containing 0.25% Triton X-100 and 10% goat serum (PBST) for 1 hr at room temperature. Slices were incubated overnight in primary antibody in PBST at 4°C. The following primary antibodies were used: rabbit polyclonal anti-HA (1:500, A40, RRID:AB_10693385) or mouse monoclonal anti-HA (1:500, A12, RRID:AB_2565006), and guinea pig polyclonal anti-TH (1:1000, A111, RRID:AB_2619897). Slices were washed three times in PBST followed by 2 hr incubation with secondary antibody in PBST for 2 hr at room temperature in the dark. The following secondary antibodies were used: goat anti-rabbit IgG Alexa 488 (1:500, S5, RRID:AB_2576217), goat anti-mouse IgG1 Alexa 488 (1:500, S7, RRID:AB_2535764), and goat anti-guinea pig IgG Alexa 633 (1:500, S34, RRID:AB_2535757). Slices were washed again three times with PBST before being mounted on glass slides with Fluoromount-G (Southern Biotech 0100-01). Stained slices were then imaged on an Olympus FV1000 confocal microscope with a 60× objective. Images were pseudo-colored in ImageJ for display. All image acquisition was done in comparison to an uninfected control imaged at the same time to assess background fluorescence. Representative images were brightness and contrast adjusted to facilitate inspection, and these adjustments were made identically for images within the same experiment. All images in Figure 1C except for those of mice expressing ELKS2β-BirA were taken at the same time. Images of mice expressing ELKS2β-BirA were taken in a separate session and compared to their own uninfected control to confirm signal specificity (Figure 1—figure supplement 1). Three to five images per virus condition were taken during each imaging session, and the experiment was repeated in at least three mice per condition.
Biotin affinity purification
Biotin affinity purifications were adapted from previously established methods (Uezu et al., 2016), 2 (for pilot experiments, up to 4) to 12 mice (for mass spectrometry analyses) were used per experiment and condition. The mice were 65–100 days old and previously injected with AAVs for BirA fusion protein expression and subjected to subcutaneous biotin injections. They were deeply anesthetized with isoflurane and decapitated. Brains were collected in ice-cold PBS and striata were dissected out. Except for those used in pilot experiments, striata were then flash frozen and stored at –80°C until further processing. For pilot experiments, 2–4 dissected striata were immediately homogenized. For mass spectrometry, 5–6 dissected striata were homogenized at a time. Homogenization was performed using a glass-Teflon homogenizer in 1 ml of homogenizing buffer (50 mM HEPES, 150 mM NaCl, 1 mM EDTA+ mammalian protease inhibitor cocktail, Sigma Cat# P8340) with 30 slow strokes on ice. An appropriate volume of 5× lysis buffer (1% SDS, 5% Triton X-100, 5% deoxycholate in homogenizing buffer) was added to the homogenized tissue (working concentration 0.2% SDS, 1% Triton X-100, 1% deoxycholate) and incubated while rotating at 4°C for 1 hr. The mass spectrometry samples were split into two batches of 5–6 striata per condition for the initial homogenization, and the batches were combined after lysis into a single tube. Lysed samples were then sonicated twice for 10 s each at 4°C with a Branson Sonifier 450. Sonicated samples were centrifuged at 15,000 × g for 15 min at 4°C in a table-top centrifuge. The cleared supernatant was removed and added to open-top polycarbonate tubes (Beckman Cat# 343778), and centrifuged in a table-top ultracentrifuge (Beckman Rotor TLA120.2) for 1 hr at 100,000 × g. After ultracentrifugation, SDS from 0.4% and/or 5% SDS stock solutions was added to the cleared supernatant to adjust to an SDS concentration of 1% and a volume of 1.5 ml. The sample was boiled at 95°C for 5 min and allowed to cool to room temperature. Neutravidin agarose beads (Thermo Cat# 29200) were washed three times in binding buffer (1% SDS, 1% Triton X-100, 1% deoxycholate in homogenizing buffer). 20 µl washed neutravidin beads were added to each sample and the samples were incubated for 16 hr at 4°C on a rotator. After spinning at 500 × g for 2 min at 4°C, the supernatant was removed and the beads were transferred to Protein Lo-bind tubes (Eppendorf Cat# 022431081). Beads were washed twice with 500 µl 2% SDS in H2O, twice with 500 µl 1% Triton X-100, 1% deoxycholate, 25 mM LiCl in H2O, and twice in 500 µl 1 M NaCl. For each washing step, beads were pelleted by spinning at 500 × g for 2 min in a table-top centrifuge at 4°C. Bead pellets were then washed five times in 500 µl 50 mM ammonium bicarbonate in water with spinning at 500 × g for 2 min between steps. After the final wash, the bead pellet was stored at –20°C until next steps (either Western blot or PC removal).
Western blot after biotin pulldown
Neutravidin bead pellets were incubated in 60 µl of 1× SDS-PAGE loading buffer and boiled for 10 min at 95°C. The sample was spun at 13,000 × g in a table-top centrifuge for 1 min to pellet the beads. 15 µl of the supernatant were loaded on an SDS-PAGE gel, and 1% of the total input used for the binding reaction (cleared lysate just before addition of the neutravidin beads) was also loaded onto the gel. After gel electrophoresis, proteins were transferred onto a nitrocellulose membrane. Membranes were blocked in 10% milk, 5% goat serum in Tris-buffered saline + 0.1% Tween-20 (TBST) for 1 hr at room temperature and then incubated overnight at 4°C in primary antibody diluted in antibody binding solution (blocking solution diluted 1:1 with TBST). Primary antibodies used: mouse monoclonal anti-HA (1:500, LAC A12, RRID:AB_2565006), rabbit polyclonal anti-red fluorescent protein (RFP) (1: 500, LAC A81, RRID:AB_2209751), rabbit polyclonal anti-pyruvate carboxylase (1:500, LAC A252, RRID:AB_11016707), and mouse monoclonal anti-β-actin (1:10,000, LAC A127, RRID:AB_476692). Membranes were washed three times with TBST and incubated in HRP-conjugated secondary antibodies for 1 hr at room temperature. Membranes were washed three times in TBST and enhanced chemiluminescence followed by exposure to film was used to visualize protein bands.
Pyruvate carboxylase depletion
For samples being submitted to mass spectrometry, frozen neutravidin bead pellets were thawed on ice. Proteins were eluted by incubation in 500 µl RapiGest elution buffer (0.1% RapiGest, Waters Cat# 1866001861, in 2 mM biotin, 50 mM ammonium bicarbonate) for 2 hr at 60°C, while shaking. Neutravidin beads were pelleted by spinning at 18,000 × g for 5 min at 4°C and the supernatant was moved to a new tube. To prepare anti-pyruvate carboxylase (PC) antibody-conjugated beads, Protein G Sepharose beads (GE Healthcare Cat#17-0618-01) were washed three times in RapiGest elution buffer and conjugated to anti-PC antibodies (Novus, A252, RRID:AB_11016707) by incubating 3 μl of antibody per 20 µl of beads for 1 hr at 4°C on a rotator. Conjugated beads were spun down at 1000 × g for 2 min, the supernatant was removed, and beads were diluted 1:1 with fresh RapiGest elution buffer to make a 50% slurry. 20 µl sepharose beads (40 µl of a 50% slurry) were added to the 500 µl of eluted protein solution of the biotin affinity purification and incubated for 1 hr at 4°C on a rotator. PC-conjugated beads were pelleted by spinning the sample at 18,000 × g for 5 min. The proteins in the PC-depleted supernatant were then precipitated with trichloroacetic acid (TCA). One volume of 100% TCA was added to four volumes of the PC-depleted supernatant and inverted several times before incubation on ice for 10 min. Tubes were then spun at 20,000 × g for 10 min at 4°C. The supernatant was removed leaving behind a protein pellet. The pellet was air dried and stored at –20°C until analysis by mass spectrometry. In pilot experiments, we assessed the efficiency of PC depletion. Before PC depletion, 28% and 10% of the detected peptides were from PC and the related protein propionyl-CoA carboxylase (PCCA), respectively. After depletion, 3% and 1.7% of the detected peptides were from PC and PCCA, respectively.
Mass spectrometry
Liquid chromatography tandem mass spectrometry (LC-MS/MS) was performed by the Taplin Mass Spectrometry Facility of the Department of Cell Biology at Harvard Medical School. Either the neutravidin bead pellet (some pilot experiments) or the TCA-precipitated protein pellet after PC depletion (all experiments to assess release site composition) were submitted to the facility. The pellet was subjected to 5 ng/µl trypsin digest overnight at 37°C and dried until further analysis. On the day of analysis, the samples were reconstituted in 2.5% acetonitrile, 0.1% formic acid, and loaded via a Famos auto sampler (LC Packings, San Francisco, CA) onto the column after column equilibration. Peptides were eluted with increasing concentrations of 97.5% acetonitrile and 0.1% formic acid. As peptides were eluted, they were subjected to electrospray ionization and added to an LTQ Orbitrap Velos Pro ion-trap mass spectrometer (Thermo Fisher Scientific). Peptides were detected, isolated, and fragmented to produce a tandem mass spectrum of specific fragment ions for each peptide. Peptide sequences (and hence protein identity) were determined by matching protein databases with the acquired fragmentation pattern by the SEQUEST software program (Thermo Fisher Scientific). The data were filtered to establish a false discovery rate between 1% and 2% using a database of mouse protein sequences made up of half real protein sequences and half reversed sequences. Independent of whether the results were run against a mouse or a rat database, the number of peptides identified for bait proteins (which were made from rat cDNA) was similar.
Analyses of mass spectrometry data
The control dataset consists of four repeats that stem from two separate mass spectrometry sessions (repeats 1 and 2 were run first, repeats 3 and 4 were run ~1 year later). Each mutant dataset (RIM cKODA and Syt-1 cKODA) consists of two repeats that were assessed in the same mass spectrometry session together with repeats 3 and 4 of the control dataset. Mitochondrial proteins were removed from the analyses using MitoCarta3.0 (Pagliarini et al., 2008; Rath et al., 2021), except for Figures 3B and 6. PC and PCCA were also removed from the analyses along with neutravidin and IgGs. Peptide counts for each protein in each BirA condition (RIMPPCP-BirA, ELKS2β-BirA, CaVβ4-BirA, BirA-tdTomato) were first averaged for the two repeats that were acquired in the same mass spectrometry session. If the peptide count averaged from the two repeats was zero, it was assigned a value of 0.5 such that we could calculate circle size for Figure 2 and more generally enrichment or depletion for all analyses. This assignment warranted that for a protein to be included, it had to be detected more than once with a single peptide. The average peptide count for a given protein for each of the three BirA baits was divided by the average peptide count for the same protein in the BirA-tdTomato condition. This is referred to as the fold change (FC) value. For the control dataset, the average fold change values of each mass spectrometry session were then averaged together to generate a final fold change value for every protein shown in Figure 2 and Figure 2—figure supplements 1 and 2; in the mutant datasets, this final averaging was not performed as all data stem from a single mass spectrometry session. Proteins with at least 2.0-fold enrichment over BirA-tdTomato in any release site-BirA condition were considered 'hits' in Figure 2 and alternate thresholds of 1.5-fold and 2.5-fold enrichment are shown in Figure 2—figure supplements 1 and 2. The Venn diagrams were constructed using Cytoscape (v3.8.2) (Shannon et al., 2003) to map the circle size to fold change value. Circle size reflects average enrichment across repeats of an individual bait. For proteins enriched in multiple bait conditions, circle size corresponds to the condition with the largest average enrichment value. The log2 of the fold change was calculated for any protein that had at least a single peptide found for any of the BirA fusion proteins. To sort proteins for synaptic localization, either the enriched proteins (Figures 2B and 5, Figure 2—figure supplement 3, Figure 3—figure supplements 1 and 2) or all proteins (Figure 4A–C, Figure 4—figure supplement 1) were run through the SynGO database (https://www.syngoportal.org; Koopmans et al., 2019) and selected by their cellular component annotation. For Figure 4A–C and Figure 4—figure supplement 1, the self-biotinylated protein was removed from its own release site-BirA condition (e.g., RIM was removed from analysis in the RIMPPCP-BirA dataset but not in the CaVβ4- or ELKS2β-BirA datasets). For Figure 5, the enriched proteins that possessed SynGO annotations were run through the STRING database (v11) (https://string-db.org; Szklarczyk et al., 2019) to generate a STRING network diagram of enriched synaptic proteins.
Synaptosome preparation and staining
Synaptosome experiments were performed according to previously established protocols (Banerjee et al., 2022; Liu et al., 2018). Mice (30–60 days old) were deeply anesthetized with isoflurane and decapitated. The brain was collected in ice-cold PBS, and the striatum was dissected out. The striatal sections were homogenized in 1 ml of synaptosome homogenizing buffer (320 mM sucrose, 4 mM HEPES, 1× Sigma protease inhibitor cocktail [Cat# P8340], pH 7.4), with 12 slow strokes using a glass-Teflon homogenizer. One ml of homogenizing buffer was then added to the homogenate. The homogenate was spun at 1000 × g for 10 min at 4°C, the supernatant was pipetted into a new tube, and spun again at 12,500 × g for 15 min at 4°C. The pellet ('P2 fraction') was resuspended in 1 ml homogenizing buffer and homogenized again with six slow strokes. An additional 1 ml of homogenizing buffer was added, and the sample (~1.5 ml) was loaded onto a sucrose gradient made up of 5 ml 1.2 M sucrose on the bottom and 5 ml of 0.8 M sucrose at the top in thin wall ultracentrifugation tubes (Beckman Coulter, Cat# 344059). The loaded gradient was ultracentrifuged at 69,150 × g for 1 hr at 4°C (SW 41 Ti Swinging-Bucket Rotor, Beckman Coulter, Cat# 331362) and the synaptosome fraction was harvested from the interface between the two sucrose layers. The synaptosome fraction was diluted 20- to 40-fold in homogenizing buffer and 1 ml was added to a poly-D-lysine-coated coverslip (neuVitro Cat# GG-18-1.5) in a 12-well plate and spun for 15 min at 4000 × g. The buffer was removed and the synaptosomes adhering to the coverslips were fixed with 4% PFA in PBS for 10 min. The PFA was removed, and a solution with 3% bovine serum albumin and 0.1% Triton X-100 in PBS (TBP) was used for blocking and permeabilization for 1 hr at room temperature. The following primary antibodies were used (diluted in TBP) overnight at 4°C: goat polyclonal anti-NPTN (1:500, A253, RRID:AB_2155920), mouse monoclonal IgG2a anti-Bassoon (1:1000, A85, RRID:AB_11181058), and guinea pig polyclonal anti-TH (1:1000, A111, RRID:AB_2619897). After primary antibody incubation, the coverslips were washed three times in TBP and then incubated in secondary antibodies for 2 hr at room temperature in the dark. Secondary antibodies used were donkey anti-goat Alexa 488 (1:500, S6, RRID:AB_2534102), donkey anti-mouse Alexa 555 (1:500, S48, RRID:AB_2534013), and donkey anti-guinea pig Alexa 647 (1:500, S59, RRID:AB_2340476). The stained synaptosomes were washed three more times in TBP before mounting on glass slides with Fluoromount-G (Southern Biotech 0100-01).
Confocal microscopy and image analyses of stained synaptosomes
Coverslips with fixed synaptosomes were imaged with an oil immersion 60× objective and a 1.5× optical zoom on an Olympus FV1000 confocal microscope. Raw confocal images were analyzed in a custom MATLAB program as described before (Banerjee et al., 2022; Liu et al., 2018) and the code was deposited on GitHub (https://github.com/kaeserlab/3DSIM_Analysis_CL; Liu, 2021). 1000–2000 synaptosomes per image were detected using Otsu intensity thresholds and size thresholds (0.2–1 µm2 for TH and 0.15–2 µm2 for Neuroplastin and Bassoon). These threshold settings were identical for every image analyzed and used to detect Bassoon-positive (Bassoon+) ROIs, TH-positive (TH+) ROIs, and double-positive ROIs (Bassoon+/TH+). TH+ ROIs that had a Bassoon signal less than 1× the average intensity of all pixels in the image were designated as Bassoon-negative (Bassoon-). Neuroplastin antibody signal intensities within Bassoon+ TH+ or Bassoon- TH+ ROIs were quantified and a frequency histogram was plotted. The experimenter was blind to which group a specific particle belonged to during image acquisition and analyses.
Statistics
Statistics were performed in GraphPad Prism 9. Data are displayed as individual data points, mean ± SEM, and/or frequency histograms. Significance is presented as *p<0.05, **p<0.01, and ***p<0.001. Sample sizes were determined based on previous studies, no statistical methods were used to predetermine sample size, and no outliers were excluded. An unpaired two-tailed Student’s t-tests was used in Figure 2—figure supplement 4B, a Kolmogorov–Smirnov test was used in Figure 2—figure supplement 4C, a two-way ANOVA test was used in Figure 3B, and two-way ANOVA tests followed by Bonferroni post-hoc tests were used in Figure 4A–C and Figure 4—figure supplement 1. In all figures, sample sizes and the specific tests used are stated in the figure legends.
Materials, data and code availability
Plasmids will be shared upon request within the limits of respective material transfer agreements. Mouse mutant alleles are publicly available as outlined in the Key Resources Table. The previously published code used for analyses of synaptosomes has been deposited to GitHub (https://github.com/kaeserlab/3DSIM_Analysis_CL; Liu, 2021) and is publicly available as listed in the Key Resources Table. All data generated or analyzed in this study are included in the figures and the source data tables. Source data files are provided for Figures 1—3, Figure 1—figure supplement 2, Figure 2—figure supplements 1 and 2, and Figure 3—figure supplements 1 and 2. Requests for materials should be directed to the corresponding author (kaeser@hms.harvard.edu).
Acknowledgements
We thank J Wang and C Qiao for technical support, current and former members of the Kaeser laboratory and D Brann for insightful discussions and feedback, M Feany and H Nyitrai for comments on the manuscript, R Tomaino and the Taplin Mass Spectrometry Facility of the Department of Cell Biology at Harvard Medical School for help with mass spectrometric analyses, and S Soderling and A Uezu for sharing the BirA plasmid and for advice on iBioID early in the project. LK is currently an employee of Mass General Brigham (Boston, MA, USA). This work was supported in part by the NIH (R01NS103484, R01NS083898 to PSK; F31NS105159 to LK), the Lefler foundation (to PSK), a Dean’s Innovation grant (PSK), a Quan fellowship (LK), an Alice and Joseph Brooks fellowship (AB), and Harvard Medical School. We acknowledge the Neurobiology Imaging Facility (supported by a P30 Core Center Grant P30NS072030).
Funding Statement
The funders had no role in study design, data collection and interpretation, or the decision to submit the work for publication.
Contributor Information
Pascal S Kaeser, Email: kaeser@hms.harvard.edu.
Reinhard Jahn, Max Planck Institute for Biophysical Chemistry, Germany.
Gary L Westbrook, Oregon Health & Science University, United States.
Funding Information
This paper was supported by the following grants:
National Institute of Neurological Disorders and Stroke R01NS103484 to Pascal S Kaeser.
National Institute of Neurological Disorders and Stroke R01NS083898 to Pascal S Kaeser.
National Institute of Neurological Disorders and Stroke F31NS105159 to Lauren Kershberg.
Harvard Medical School Lefler Foundation to Pascal S Kaeser.
Harvard Medical School Brooks Fellowship to Aditi Banerjee.
Harvard Medical School Quan Fellowship to Lauren Kershberg.
Harvard Medical School Dean's Innovation Grant to Pascal S Kaeser.
Harvard Medical School to Pascal S Kaeser.
Additional information
Competing interests
No competing interests declared.
No competing interests declared.
Author contributions
Conceptualization, Resources, Formal analysis, Investigation, Methodology, Writing – original draft, Writing – review and editing.
Resources, Formal analysis, Investigation, Methodology, Writing – review and editing.
Conceptualization, Formal analysis, Supervision, Funding acquisition, Writing – original draft, Writing – review and editing.
Ethics
All animal experiments were performed according to institutional guidelines of Harvard University, and were in strict accordance with the recommendations in the Guide for the Care and Use of Laboratory Animals of the National Institutes of Health. All animal experiments were approved by the Harvard University Animal Care and Use Committee (protocol number IS00000049).
Additional files
(A) Table of proteins detected in mass spectrometry in control mice. An alphabetical list of genes encoding the proteins identified by mass spectrometry and associated peptide counts in the control datasets is provided.
(B) DNA sequences. Sequences of the inserts of newly generated plasmids used for producing AAVs are provided. Only the inserts in the multiple cloning site 3′ of the human synapsin promotor of a standard AAV vector are included.
(C) Table of proteins for the Venn diagram in Figure 2. Genes encoding the bait proteins are shown in the first three rows. The table contains an alphabetical list ordered by enrichment group (enriched in all bait conditions, enriched in two bait conditions, enriched in one bait condition). To be included in the Venn diagram, enriched is defined as an average ≥2.0-fold number of peptides for a specific protein over the peptide count for the same protein in the BirA-tdTomato condition, calculated across biological repeats and mass spectrometry experiments as described in detail in the 'Materials and methods'.
(D) Table of proteins for the Venn diagram in Figure 2—figure supplement 1. Genes encoding the bait proteins are shown in the first three rows. The table contains an alphabetical list ordered by enrichment group (enriched in all bait conditions, enriched in two bait conditions, enriched in one bait condition). To be included in the Venn diagram, enriched is defined as an average ≥1.5-fold number of peptides for a specific protein over the peptide count for the same protein in the BirA-tdTomato condition.
(E) Table of proteins for the Venn diagram in Figure 2—figure supplement 2. Genes encoding the bait proteins are shown in the first three rows. The table contains an alphabetical list ordered by enrichment group (enriched in all bait conditions, enriched in two bait conditions, enriched in one bait condition). To be included in the Venn diagram, enriched is defined as an average ≥2.5-fold number of peptides for a specific protein over the peptide count for the same protein in the BirA-tdTomato condition.
(F) Table of proteins detected in mass spectrometry in RIM cKODA mice. An alphabetical list of genes encoding the proteins identified by mass spectrometry and associated peptide counts in the RIM cKODA datasets is provided.
(G) Table of proteins detected in mass spectrometry in Syt-1 cKODA mice. An alphabetical list of genes encoding the proteins identified by mass spectrometry and associated peptide counts in the Syt-1 cKODA datasets is provided.
(H) Table of proteins in RIM cKODA mice for the Venn diagram in Figure 3—figure supplement 1. Genes encoding the bait proteins are shown in the first three rows. The table contains an alphabetical list ordered by enrichment group (enriched in all bait conditions, enriched in two bait conditions, enriched in one bait condition). To be included in the Venn diagram, enriched is defined as an average ≥2.0-fold number of peptides for a specific protein over the peptide count for the same protein in the BirA-tdTomato condition.
(I) Table of proteins in Syt-1 cKODA mice for the Venn diagram in Figure 3—figure supplement 2. Genes encoding the bait proteins are shown in the first three rows. The table contains an alphabetical list ordered by enrichment group (enriched in all bait conditions, enriched in two bait conditions, enriched in one bait condition). To be included in the Venn diagram, enriched is defined as an average ≥2.0-fold number of peptides for a specific protein over the peptide count for the same protein in the BirA-tdTomato condition.
Data availability
All data generated or analyzed in this study are included in the figures and the source data tables. Source data files are provided for Figs. 1 to 3, Fig. 1 - figure supplement 2, Fig. 2 - figure supplements 1 and 2, and Fig. 3 - figure supplements 1 and 2.
References
- Acuna C, Liu X, Südhof TC. How to make an active zone: unexpected universal functional redundancy between RIMs and RIM-bps. Neuron. 2016;91:792–807. doi: 10.1016/j.neuron.2016.07.042. [DOI] [PubMed] [Google Scholar]
- Bäckman CM, Malik N, Zhang Y, Shan L, Grinberg A, Hoffer BJ, Westphal H, Tomac AC. Characterization of a mouse strain expressing cre recombinase from the 3’ untranslated region of the dopamine transporter locus. Genesis. 2006;44:383–390. doi: 10.1002/dvg.20228. [DOI] [PubMed] [Google Scholar]
- Banerjee A, Lee J, Nemcova P, Liu C, Kaeser PS. Synaptotagmin-1 is the Ca2+ sensor for fast striatal dopamine release. eLife. 2020;9:e58359. doi: 10.7554/eLife.58359. [DOI] [PMC free article] [PubMed] [Google Scholar]
- Banerjee A, Imig C, Balakrishnan K, Kershberg L, Lipstein N, Uronen RL, Wang J, Cai X, Benseler F, Rhee JS, Cooper BH, Liu C, Wojcik SM, Brose N, Kaeser PS. Molecular and functional architecture of striatal dopamine release sites. Neuron. 2022;110:248–265. doi: 10.1016/j.neuron.2021.10.028. [DOI] [PMC free article] [PubMed] [Google Scholar]
- Beckstead MJ, Grandy DK, Wickman K, Williams JT. Vesicular dopamine release elicits an inhibitory postsynaptic current in midbrain dopamine neurons. Neuron. 2004;42:939–946. doi: 10.1016/j.neuron.2004.05.019. [DOI] [PubMed] [Google Scholar]
- Beesley PW, Herrera-Molina R, Smalla KH, Seidenbecher C. The neuroplastin adhesion molecules: key regulators of neuronal plasticity and synaptic function. Journal of Neurochemistry. 2014;131:268–283. doi: 10.1111/jnc.12816. [DOI] [PubMed] [Google Scholar]
- Berke JD. What does dopamine mean? Nature Neuroscience. 2018;21:787–793. doi: 10.1038/s41593-018-0152-y. [DOI] [PMC free article] [PubMed] [Google Scholar]
- Beyene AG, Delevich K, Del Bonis-O’Donnell JT, Piekarski DJ, Lin WC, Thomas AW, Yang SJ, Kosillo P, Yang D, Prounis GS, Wilbrecht L, Landry MP. Imaging striatal dopamine release using a nongenetically encoded near infrared fluorescent catecholamine nanosensor. Science Advances. 2019;5:eaaw3108. doi: 10.1126/sciadv.aaw3108. [DOI] [PMC free article] [PubMed] [Google Scholar]
- Biederer T, Kaeser PS, Blanpied TA. Transcellular nanoalignment of synaptic function. Neuron. 2017;96:680–696. doi: 10.1016/j.neuron.2017.10.006. [DOI] [PMC free article] [PubMed] [Google Scholar]
- Blauwendraat C, Nalls MA, Singleton AB. The genetic architecture of Parkinson’s disease. The Lancet. Neurology. 2020;19:170–178. doi: 10.1016/S1474-4422(19)30287-X. [DOI] [PMC free article] [PubMed] [Google Scholar]
- Bouhours B, Gjoni E, Kochubey O, Schneggenburger R. Synaptotagmin2 (SYT2) drives fast release redundantly with SYT1 at the output synapses of parvalbumin-expressing inhibitory neurons. The Journal of Neuroscience. 2017;37:4604–4617. doi: 10.1523/JNEUROSCI.3736-16.2017. [DOI] [PMC free article] [PubMed] [Google Scholar]
- Bova A, Gaidica M, Hurst A, Iwai Y, Hunter J, Leventhal DK. Precisely timed dopamine signals establish distinct kinematic representations of skilled movements. eLife. 2020;9:e61591. doi: 10.7554/eLife.61591. [DOI] [PMC free article] [PubMed] [Google Scholar]
- Boyken J, Grønborg M, Riedel D, Urlaub H, Jahn R, Chua JJE. Molecular profiling of synaptic vesicle docking sites reveals novel proteins but few differences between glutamatergic and GABAergic synapses. Neuron. 2013;78:285–297. doi: 10.1016/j.neuron.2013.02.027. [DOI] [PubMed] [Google Scholar]
- Brimblecombe KR, Gracie CJ, Platt NJ, Cragg SJ. Gating of dopamine transmission by calcium and axonal N-, Q-, T- and L-type voltage-gated calcium channels differs between striatal domains. The Journal of Physiology. 2015;593:929–946. doi: 10.1113/jphysiol.2014.285890. [DOI] [PMC free article] [PubMed] [Google Scholar]
- Brodbeck J, Davies A, Courtney JM, Meir A, Balaguero N, Canti C, Moss FJ, Page KM, Pratt WS, Hunt SP, Barclay J, Rees M, Dolphin AC. The ducky mutation in Cacna2d2 results in altered Purkinje cell morphology and is associated with the expression of a truncated alpha 2 delta-2 protein with abnormal function. The Journal of Biological Chemistry. 2002;277:7684–7693. doi: 10.1074/jbc.M109404200. [DOI] [PubMed] [Google Scholar]
- Burré J, Sharma M, Tsetsenis T, Buchman V, Etherton MR, Südhof TC. Alpha-Synuclein promotes SNARE-complex assembly in vivo and in vitro. Science. 2010;329:1663–1667. doi: 10.1126/science.1195227. [DOI] [PMC free article] [PubMed] [Google Scholar]
- Cachope R, Mateo Y, Mathur BN, Irving J, Wang HL, Morales M, Lovinger DM, Cheer JF. Selective activation of cholinergic interneurons enhances accumbal phasic dopamine release: setting the tone for reward processing. Cell Reports. 2012;2:33–41. doi: 10.1016/j.celrep.2012.05.011. [DOI] [PMC free article] [PubMed] [Google Scholar]
- Chang HT. Dopamine-acetylcholine interaction in the rat striatum: a dual-labeling immunocytochemical study. Brain Research Bulletin. 1988;21:295–304. doi: 10.1016/0361-9230(88)90244-4. [DOI] [PubMed] [Google Scholar]
- Chang S, Trimbuch T, Rosenmund C. Synaptotagmin-1 drives synchronous Ca2+-triggered fusion by C2B-domain-mediated synaptic-vesicle-membrane attachment. Nature Neuroscience. 2018;21:33–40. doi: 10.1038/s41593-017-0037-5. [DOI] [PMC free article] [PubMed] [Google Scholar]
- Chaudhury D, Walsh JJ, Friedman AK, Juarez B, Ku SM, Koo JW, Ferguson D, Tsai HC, Pomeranz L, Christoffel DJ, Nectow AR, Ekstrand M, Domingos A, Mazei-Robison MS, Mouzon E, Lobo MK, Neve RL, Friedman JM, Russo SJ, Deisseroth K, Nestler EJ, Han MH. Rapid regulation of depression-related behaviours by control of midbrain dopamine neurons. Nature. 2013;493:532–536. doi: 10.1038/nature11713. [DOI] [PMC free article] [PubMed] [Google Scholar]
- Condon AF, Robinson BG, Asad N, Dore TM, Tian L, Williams JT. The residence of synaptically released dopamine on D2 autoreceptors. Cell Reports. 2021;36:109465. doi: 10.1016/j.celrep.2021.109465. [DOI] [PMC free article] [PubMed] [Google Scholar]
- Courtney NA, Ford CP. The timing of dopamine- and noradrenaline-mediated transmission reflects underlying differences in the extent of spillover and pooling. The Journal of Neuroscience. 2014;34:7645–7656. doi: 10.1523/JNEUROSCI.0166-14.2014. [DOI] [PMC free article] [PubMed] [Google Scholar]
- da Silva JA, Tecuapetla F, Paixão V, Costa RM. Dopamine neuron activity before action initiation gates and invigorates future movements. Nature. 2018;554:244–248. doi: 10.1038/nature25457. [DOI] [PubMed] [Google Scholar]
- Daniel JA, Galbraith S, Iacovitti L, Abdipranoto A, Vissel B. Functional heterogeneity at dopamine release sites. The Journal of Neuroscience. 2009;29:14670–14680. doi: 10.1523/JNEUROSCI.1349-09.2009. [DOI] [PMC free article] [PubMed] [Google Scholar]
- Day JO, Mullin S. The genetics of Parkinson’s disease and implications for clinical practice. Genes. 2021;12:1006. doi: 10.3390/genes12071006. [DOI] [PMC free article] [PubMed] [Google Scholar]
- de Jong APH, Roggero CM, Ho M-R, Wong MY, Brautigam CA, Rizo J, Kaeser PS. Rim C2B domains target presynaptic active zone functions to PIP2-containing membranes. Neuron. 2018;98:335–349. doi: 10.1016/j.neuron.2018.03.011. [DOI] [PMC free article] [PubMed] [Google Scholar]
- Delignat-Lavaud B, Kano J, Ducrot C, Massé I, Mukherjee S, Giguère N, Moquin L, Lévesque C, Nanni SB, Bourque MJ, Rosa-Neto P, Lévesque D, De Beaumont L, Trudeau LÉ. The calcium sensor synaptotagmin-1 is critical for phasic axonal dopamine release in the striatum and mesencephalon, but is dispensable for basic motor behaviors in mice. bioRxiv. 2021 doi: 10.1101/2021.09.15.460511. [DOI] [PMC free article] [PubMed]
- Descarries L, Watkins KC, Garcia S, Bosler O, Doucet G. Dual character, asynaptic and synaptic, of the dopamine innervation in adult rat neostriatum: a quantitative autoradiographic and immunocytochemical analysis. The Journal of Comparative Neurology. 1996;375:167–186. doi: 10.1002/(SICI)1096-9861(19961111)375:2<167::AID-CNE1>3.0.CO;2-0. [DOI] [PubMed] [Google Scholar]
- Diao J, Burré J, Vivona S, Cipriano DJ, Sharma M, Kyoung M, Südhof TC, Brunger AT. Native α-synuclein induces clustering of synaptic-vesicle mimics via binding to phospholipids and synaptobrevin-2/VAMP2. eLife. 2013;2:e00592. doi: 10.7554/eLife.00592. [DOI] [PMC free article] [PubMed] [Google Scholar]
- Dolphin AC. Beta subunits of voltage-gated calcium channels. Journal of Bioenergetics and Biomembranes. 2003;35:599–620. doi: 10.1023/b:jobb.0000008026.37790.5a. [DOI] [PubMed] [Google Scholar]
- Ducrot C, Bourque MJ, Delmas CVL, Racine AS, Guadarrama Bello D, Delignat-Lavaud B, Domenic Lycas M, Fallon A, Michaud-Tardif C, Burke Nanni S, Herborg F, Gether U, Nanci A, Takahashi H, Parent M, Trudeau LE. Dopaminergic neurons establish a distinctive axonal Arbor with a majority of non-synaptic terminals. FASEB Journal. 2021;35:e21791. doi: 10.1096/fj.202100201RR. [DOI] [PubMed] [Google Scholar]
- Emperador-Melero J, Kaeser PS. Assembly of the presynaptic active zone. Current Opinion in Neurobiology. 2020;63:95–103. doi: 10.1016/j.conb.2020.03.008. [DOI] [PMC free article] [PubMed] [Google Scholar]
- Gantz SC, Bunzow JR, Williams JT. Spontaneous inhibitory synaptic currents mediated by a G protein-coupled receptor. Neuron. 2013;78:807–812. doi: 10.1016/j.neuron.2013.04.013. [DOI] [PMC free article] [PubMed] [Google Scholar]
- Hamilos AE, Spedicato G, Hong Y, Sun F, Li Y, Assad JA. Slowly evolving dopaminergic activity modulates the moment-to-moment probability of reward-related self-timed movements. eLife. 2021;10:e62583. doi: 10.7554/eLife.62583. [DOI] [PMC free article] [PubMed] [Google Scholar]
- Held RG, Liu C, Kaeser PS. ELKS controls the pool of readily releasable vesicles at excitatory synapses through its N-terminal coiled-coil domains. eLife. 2016;5:e14862. doi: 10.7554/eLife.14862. [DOI] [PMC free article] [PubMed] [Google Scholar]
- Held RG, Liu C, Ma K, Ramsey AM, Tarr TB, De Nola G, Wang SSH, Wang J, van den Maagdenberg AMJM, Schneider T, Sun J, Blanpied TA, Kaeser PS. Synapse and active zone assembly in the absence of presynaptic Ca2+ channels and Ca2+ entry. Neuron. 2020;107:667–683. doi: 10.1016/j.neuron.2020.05.032. [DOI] [PMC free article] [PubMed] [Google Scholar]
- Hnasko TS, Chuhma N, Zhang H, Goh GY, Sulzer D, Palmiter RD, Rayport S, Edwards RH. Vesicular glutamate transport promotes dopamine storage and glutamate corelease in vivo. Neuron. 2010;65:643–656. doi: 10.1016/j.neuron.2010.02.012. [DOI] [PMC free article] [PubMed] [Google Scholar]
- Hobson BD, Choi SJ, Mosharov EV, Soni RK, Sulzer D, Sims PA. Subcellular proteomics of dopamine neurons in the mouse brain. eLife. 2022;11:e70921. doi: 10.7554/eLife.70921. [DOI] [PMC free article] [PubMed] [Google Scholar]
- Hollerman JR, Schultz W. Dopamine neurons report an error in the temporal prediction of reward during learning. Nature Neuroscience. 1998;1:304–309. doi: 10.1038/1124. [DOI] [PubMed] [Google Scholar]
- Howe MW, Dombeck DA. Rapid signalling in distinct dopaminergic axons during locomotion and reward. Nature. 2016;535:505–510. doi: 10.1038/nature18942. [DOI] [PMC free article] [PubMed] [Google Scholar]
- Jin X, Costa RM. Start/stop signals emerge in nigrostriatal circuits during sequence learning. Nature. 2010;466:457–462. doi: 10.1038/nature09263. [DOI] [PMC free article] [PubMed] [Google Scholar]
- Jones IW, Bolam JP, Wonnacott S. Presynaptic localisation of the nicotinic acetylcholine receptor beta2 subunit immunoreactivity in rat nigrostriatal dopaminergic neurones. The Journal of Comparative Neurology. 2001;439:235–247. doi: 10.1002/cne.1345. [DOI] [PubMed] [Google Scholar]
- Kaeser PS, Kwon HB, Chiu CQ, Deng L, Castillo PE, Südhof TC. Rim1Alpha and rim1beta are synthesized from distinct promoters of the rim1 gene to mediate differential but overlapping synaptic functions. The Journal of Neuroscience. 2008;28:13435–13447. doi: 10.1523/JNEUROSCI.3235-08.2008. [DOI] [PMC free article] [PubMed] [Google Scholar]
- Kaeser P.S, Deng L, Chávez AE, Liu X, Castillo PE, Südhof TC. ELKS2alpha/CAST deletion selectively increases neurotransmitter release at inhibitory synapses. Neuron. 2009;64:227–239. doi: 10.1016/j.neuron.2009.09.019. [DOI] [PMC free article] [PubMed] [Google Scholar]
- Kaeser P.S, Deng L, Wang Y, Dulubova I, Liu X, Rizo J, Südhof TC. Rim proteins tether Ca2+ channels to presynaptic active zones via a direct PDZ-domain interaction. Cell. 2011;144:282–295. doi: 10.1016/j.cell.2010.12.029. [DOI] [PMC free article] [PubMed] [Google Scholar]
- Kim DI, Birendra KC, Zhu W, Motamedchaboki K, Doye V, Roux KJ. Probing nuclear pore complex architecture with proximity-dependent biotinylation. PNAS. 2014;111:E2453–E2461. doi: 10.1073/pnas.1406459111. [DOI] [PMC free article] [PubMed] [Google Scholar]
- Kochubey O, Babai N, Schneggenburger R. A synaptotagmin isoform switch during the development of an identified CNS synapse. Neuron. 2016;90:984–999. doi: 10.1016/j.neuron.2016.04.038. [DOI] [PubMed] [Google Scholar]
- Koopmans F, van Nierop P, Andres-Alonso M, Byrnes A, Cijsouw T, Coba MP, Cornelisse LN, Farrell RJ, Goldschmidt HL, Howrigan DP, Hussain NK, Imig C, de Jong APH, Jung H, Kohansalnodehi M, Kramarz B, Lipstein N, Lovering RC, MacGillavry H, Mariano V, Mi H, Ninov M, Osumi-Sutherland D, Pielot R, Smalla K-H, Tang H, Tashman K, Toonen RFG, Verpelli C, Reig-Viader R, Watanabe K, van Weering J, Achsel T, Ashrafi G, Asi N, Brown TC, De Camilli P, Feuermann M, Foulger RE, Gaudet P, Joglekar A, Kanellopoulos A, Malenka R, Nicoll RA, Pulido C, de Juan-Sanz J, Sheng M, Südhof TC, Tilgner HU, Bagni C, Bayés À, Biederer T, Brose N, Chua JJE, Dieterich DC, Gundelfinger ED, Hoogenraad C, Huganir RL, Jahn R, Kaeser PS, Kim E, Kreutz MR, McPherson PS, Neale BM, O’Connor V, Posthuma D, Ryan TA, Sala C, Feng G, Hyman SE, Thomas PD, Smit AB, Verhage M. SynGO: an evidence-based, expert-curated knowledge base for the synapse. Neuron. 2019;103:217–234. doi: 10.1016/j.neuron.2019.05.002. [DOI] [PMC free article] [PubMed] [Google Scholar]
- Kramer PF, Brill-Weil SG, Cummins AC, Zhang R, Camacho-Hernandez GA, Newman AH, Eldridge MAG, Averbeck BB, Khaliq ZM. Synaptic-Like axo-axonal transmission from striatal cholinergic interneurons onto dopaminergic fibers. Neuron. 2022;110:2949–2960. doi: 10.1016/j.neuron.2022.07.011. [DOI] [PMC free article] [PubMed] [Google Scholar]
- Kushibiki Y, Suzuki T, Jin Y, Taru H. RIMB-1/RIM-binding protein and UNC-10/RIM redundantly regulate presynaptic localization of the voltage-gated calcium channel in Caenorhabditis elegans. The Journal of Neuroscience. 2019;39:8617–8631. doi: 10.1523/JNEUROSCI.0506-19.2019. [DOI] [PMC free article] [PubMed] [Google Scholar]
- Lebowitz JJ, Banerjee A, Qiao C, Bunzow JR, Williams JT, Kaeser PS. Synaptotagmin-1 is a Ca2+ sensor for somatodendritic dopamine release. Cell Reports. 2022;42:111915. doi: 10.1016/j.celrep.2022.111915. [DOI] [PMC free article] [PubMed] [Google Scholar]
- Liu C, Bickford LS, Held RG, Nyitrai H, Südhof TC, Kaeser PS. The active zone protein family ELKS supports Ca2+ influx at nerve terminals of inhibitory hippocampal neurons. The Journal of Neuroscience. 2014;34:12289–12303. doi: 10.1523/JNEUROSCI.0999-14.2014. [DOI] [PMC free article] [PubMed] [Google Scholar]
- Liu C, Kershberg L, Wang J, Schneeberger S, Kaeser PS. Dopamine secretion is mediated by sparse active zone-like release sites. Cell. 2018;172:706–718. doi: 10.1016/j.cell.2018.01.008. [DOI] [PMC free article] [PubMed] [Google Scholar]
- Liu C, Kaeser PS. Mechanisms and regulation of dopamine release. Current Opinion in Neurobiology. 2019;57:46–53. doi: 10.1016/j.conb.2019.01.001. [DOI] [PMC free article] [PubMed] [Google Scholar]
- Liu C. 3DSIM_Analysis_CL. v1.0GitHub. 2021 https://github.com/kaeserlab/3DSIM_Analysis_CL
- Liu C, Goel P, Kaeser PS. Spatial and temporal scales of dopamine transmission. Nature Reviews. Neuroscience. 2021a;22:345–358. doi: 10.1038/s41583-021-00455-7. [DOI] [PMC free article] [PubMed] [Google Scholar]
- Liu G, Peng J, Liao Z, Locascio JJ, Corvol JC, Zhu F, Dong X, Maple-Grødem J, Campbell MC, Elbaz A, Lesage S, Brice A, Mangone G, Growdon JH, Hung AY, Schwarzschild MA, Hayes MT, Wills AM, Herrington TM, Ravina B, Shoulson I, Taba P, Kõks S, Beach TG, Cormier-Dequaire F, Alves G, Tysnes OB, Perlmutter JS, Heutink P, Amr SS, van Hilten JJ, Kasten M, Mollenhauer B, Trenkwalder C, Klein C, Barker RA, Williams-Gray CH, Marinus J, Scherzer CR, International Genetics of Parkinson Disease Progression Consortium Genome-wide survival study identifies a novel synaptic locus and polygenic score for cognitive progression in parkinson’s disease. Nature Genetics. 2021b;53:787–793. doi: 10.1038/s41588-021-00847-6. [DOI] [PMC free article] [PubMed] [Google Scholar]
- Liu C, Cai X, Ritzau-Jost A, Kramer PF, Li Y, Khaliq ZM, Hallermann S, Kaeser PS. An action potential initiation mechanism in distal axons for the control of dopamine release. Science. 2022;375:1378–1385. doi: 10.1126/science.abn0532. [DOI] [PMC free article] [PubMed] [Google Scholar]
- Loh KH, Stawski PS, Draycott AS, Udeshi ND, Lehrman EK, Wilton DK, Svinkina T, Deerinck TJ, Ellisman MH, Stevens B, Carr SA, Ting AY. Proteomic analysis of unbounded cellular compartments: synaptic clefts. Cell. 2016;166:1295–1307. doi: 10.1016/j.cell.2016.07.041. [DOI] [PMC free article] [PubMed] [Google Scholar]
- Luebke JI, Dunlap K, Turner TJ. Multiple calcium channel types control glutamatergic synaptic transmission in the hippocampus. Neuron. 1993;11:895–902. doi: 10.1016/0896-6273(93)90119-c. [DOI] [PubMed] [Google Scholar]
- Marcott PF, Mamaligas AA, Ford CP. Phasic dopamine release drives rapid activation of striatal D2-receptors. Neuron. 2014;84:164–176. doi: 10.1016/j.neuron.2014.08.058. [DOI] [PMC free article] [PubMed] [Google Scholar]
- Marras C, Lang A, van de Warrenburg BP, Sue CM, Tabrizi SJ, Bertram L, Mercimek-Mahmutoglu S, Ebrahimi-Fakhari D, Warner TT, Durr A, Assmann B, Lohmann K, Kostic V, Klein C. Nomenclature of genetic movement disorders: recommendations of the international parkinson and movement disorder society task force. Movement Disorders. 2016;31:436–457. doi: 10.1002/mds.26527. [DOI] [PubMed] [Google Scholar]
- Melani R, Tritsch NX. Inhibitory co-transmission from midbrain dopamine neurons relies on presynaptic GABA uptake. Cell Reports. 2022;39:110716. doi: 10.1016/j.celrep.2022.110716. [DOI] [PMC free article] [PubMed] [Google Scholar]
- Murphy DD, Rueter SM, Trojanowski JQ, Lee VMY. Synucleins are developmentally expressed, and alpha-synuclein regulates the size of the presynaptic vesicular pool in primary hippocampal neurons. The Journal of Neuroscience. 2000;20:3214–3220. doi: 10.1523/JNEUROSCI.20-09-03214.2000. [DOI] [PMC free article] [PubMed] [Google Scholar]
- Nalls MA, Blauwendraat C, Vallerga CL, Heilbron K, Bandres-Ciga S, Chang D, Tan M, Kia DA, Noyce AJ, Xue A, Bras J, Young E, von Coelln R, Simón-Sánchez J, Schulte C, Sharma M, Krohn L, Pihlstrøm L, Siitonen A, Iwaki H, Leonard H, Faghri F, Gibbs JR, Hernandez DG, Scholz SW, Botia JA, Martinez M, Corvol JC, Lesage S, Jankovic J, Shulman LM, Sutherland M, Tienari P, Majamaa K, Toft M, Andreassen OA, Bangale T, Brice A, Yang J, Gan-Or Z, Gasser T, Heutink P, Shulman JM, Wood NW, Hinds DA, Hardy JA, Morris HR, Gratten J, Visscher PM, Graham RR, Singleton AB, 23andMe Research Team. System Genomics of Parkinson’s Disease Consortium. International Parkinson’s Disease Genomics Consortium Identification of novel risk loci, causal insights, and heritable risk for parkinson’s disease: a meta-analysis of genome-wide association studies. The Lancet. Neurology. 2019;18:1091–1102. doi: 10.1016/S1474-4422(19)30320-5. [DOI] [PMC free article] [PubMed] [Google Scholar]
- Oh KH, Krout MD, Richmond JE, Kim H. UNC-2 cav2 channel localization at presynaptic active zones depends on UNC-10/RIM and SYD-2/liprin-α in Caenorhabditis elegans. The Journal of Neuroscience. 2021;41:4782–4794. doi: 10.1523/JNEUROSCI.0076-21.2021. [DOI] [PMC free article] [PubMed] [Google Scholar]
- Paget-Blanc V, Pfeffer ME, Pronot M, Lapios P, Angelo M-F, Walle R, Cordelières FP, Levet F, Claverol S, Lacomme S, Petrel M, Martin C, Pitard V, De Smedt Peyrusse V, Biederer T, Perrais D, Trifilieff P, Herzog E. A synaptomic analysis reveals dopamine hub synapses in the mouse striatum. Nature Communications. 2022;13:3102. doi: 10.1038/s41467-022-30776-9. [DOI] [PMC free article] [PubMed] [Google Scholar]
- Pagliarini DJ, Calvo SE, Chang B, Sheth SA, Vafai SB, Ong SE, Walford GA, Sugiana C, Boneh A, Chen WK, Hill DE, Vidal M, Evans JG, Thorburn DR, Carr SA, Mootha VK. A mitochondrial protein compendium elucidates complex I disease biology. Cell. 2008;134:112–123. doi: 10.1016/j.cell.2008.06.016. [DOI] [PMC free article] [PubMed] [Google Scholar]
- Patriarchi T, Cho JR, Merten K, Howe MW, Marley A, Xiong WH, Folk RW, Broussard GJ, Liang R, Jang MJ, Zhong H, Dombeck D, von Zastrow M, Nimmerjahn A, Gradinaru V, Williams JT, Tian L. Ultrafast neuronal imaging of dopamine dynamics with designed genetically encoded sensors. Science. 2018;360:eaat4422. doi: 10.1126/science.aat4422. [DOI] [PMC free article] [PubMed] [Google Scholar]
- Patsavoudi E, Merkouri E, Thomaidou D, Sandillon F, Alonso G, Matsas R. Characterization and localization of the BM88 antigen in the developing and adult rat brain. Journal of Neuroscience Research. 1995;40:506–518. doi: 10.1002/jnr.490400410. [DOI] [PubMed] [Google Scholar]
- Pereira DB, Schmitz Y, Mészáros J, Merchant P, Hu G, Li S, Henke A, Lizardi-Ortiz JE, Karpowicz RJ, Morgenstern TJ, Sonders MS, Kanter E, Rodriguez PC, Mosharov EV, Sames D, Sulzer D. Fluorescent false neurotransmitter reveals functionally silent dopamine vesicle clusters in the striatum. Nature Neuroscience. 2016;19:578–586. doi: 10.1038/nn.4252. [DOI] [PMC free article] [PubMed] [Google Scholar]
- Poewe W, Seppi K, Tanner CM, Halliday GM, Brundin P, Volkmann J, Schrag AE, Lang AE. Parkinson disease. Nature Reviews. Disease Primers. 2017;3:17013. doi: 10.1038/nrdp.2017.13. [DOI] [PubMed] [Google Scholar]
- Politis PK, Makri G, Thomaidou D, Geissen M, Rohrer H, Matsas R. BM88/CEND1 coordinates cell cycle exit and differentiation of neuronal precursors. PNAS. 2007;104:17861–17866. doi: 10.1073/pnas.0610973104. [DOI] [PMC free article] [PubMed] [Google Scholar]
- Rath S, Sharma R, Gupta R, Ast T, Chan C, Durham TJ, Goodman RP, Grabarek Z, Haas ME, Hung WHW, Joshi PR, Jourdain AA, Kim SH, Kotrys AV, Lam SS, McCoy JG, Meisel JD, Miranda M, Panda A, Patgiri A, Rogers R, Sadre S, Shah H, Skinner OS, To T-L, Walker MA, Wang H, Ward PS, Wengrod J, Yuan C-C, Calvo SE, Mootha VK. MitoCarta3.0: an updated mitochondrial proteome now with sub-organelle localization and pathway annotations. Nucleic Acids Research. 2021;49:D1541–D1547. doi: 10.1093/nar/gkaa1011. [DOI] [PMC free article] [PubMed] [Google Scholar]
- Rice ME, Patel JC, Cragg SJ. Dopamine release in the basal ganglia. Neuroscience. 2011;198:112–137. doi: 10.1016/j.neuroscience.2011.08.066. [DOI] [PMC free article] [PubMed] [Google Scholar]
- Robinson BG, Cai X, Wang J, Bunzow JR, Williams JT, Kaeser PS. Rim is essential for stimulated but not spontaneous somatodendritic dopamine release in the midbrain. eLife. 2019;8:e47972. doi: 10.7554/eLife.47972. [DOI] [PMC free article] [PubMed] [Google Scholar]
- Roux KJ, Kim DI, Raida M, Burke B. A promiscuous biotin ligase fusion protein identifies proximal and interacting proteins in mammalian cells. The Journal of Cell Biology. 2012;196:801–810. doi: 10.1083/jcb.201112098. [DOI] [PMC free article] [PubMed] [Google Scholar]
- Schmidt N, Kollewe A, Constantin CE, Henrich S, Ritzau-Jost A, Bildl W, Saalbach A, Hallermann S, Kulik A, Fakler B, Schulte U. Neuroplastin and basigin are essential auxiliary subunits of plasma membrane ca2+-atpases and key regulators of ca2+ clearance. Neuron. 2017;96:827–838. doi: 10.1016/j.neuron.2017.09.038. [DOI] [PubMed] [Google Scholar]
- Schultz W, Dayan P, Montague PR. A neural substrate of prediction and reward. Science. 1997;275:1593–1599. doi: 10.1126/science.275.5306.1593. [DOI] [PubMed] [Google Scholar]
- Sesack SR, Aoki C, Pickel VM. Ultrastructural localization of D2 receptor-like immunoreactivity in midbrain dopamine neurons and their striatal targets. The Journal of Neuroscience. 1994;14:88–106. doi: 10.1523/JNEUROSCI.14-01-00088.1994. [DOI] [PMC free article] [PubMed] [Google Scholar]
- Shannon P, Markiel A, Ozier O, Baliga NS, Wang JT, Ramage D, Amin N, Schwikowski B, Ideker T. Cytoscape: a software environment for integrated models of biomolecular interaction networks. Genome Research. 2003;13:2498–2504. doi: 10.1101/gr.1239303. [DOI] [PMC free article] [PubMed] [Google Scholar]
- Silm K, Yang J, Marcott PF, Asensio CS, Eriksen J, Guthrie DA, Newman AH, Ford CP, Edwards RH. Synaptic vesicle recycling pathway determines neurotransmitter content and release properties. Neuron. 2019;102:786–800. doi: 10.1016/j.neuron.2019.03.031. [DOI] [PMC free article] [PubMed] [Google Scholar]
- Skarnes WC, Rosen B, West AP, Koutsourakis M, Bushell W, Iyer V, Mujica AO, Thomas M, Harrow J, Cox T, Jackson D, Severin J, Biggs P, Fu J, Nefedov M, de Jong PJ, Stewart AF, Bradley A. A conditional knockout resource for the genome-wide study of mouse gene function. Nature. 2011;474:337–342. doi: 10.1038/nature10163. [DOI] [PMC free article] [PubMed] [Google Scholar]
- Smalla KH, Matthies H, Langnäse K, Shabir S, Böckers TM, Wyneken U, Staak S, Krug M, Beesley PW, Gundelfinger ED. The synaptic glycoprotein neuroplastin is involved in long-term potentiation at hippocampal CA1 synapses. PNAS. 2000;97:4327–4332. doi: 10.1073/pnas.080389297. [DOI] [PMC free article] [PubMed] [Google Scholar]
- Snel B, Lehmann G, Bork P, Huynen MA. String: a web-server to retrieve and display the repeatedly occurring neighbourhood of a gene. Nucleic Acids Research. 2000;28:3442–3444. doi: 10.1093/nar/28.18.3442. [DOI] [PMC free article] [PubMed] [Google Scholar]
- Stanley JS, Griffin JB, Zempleni J. Biotinylation of histones in human cells. European Journal of Biochemistry. 2001;268:5424–5429. doi: 10.1046/j.0014-2956.2001.02481.x. [DOI] [PubMed] [Google Scholar]
- Stuber GD, Hnasko TS, Britt JP, Edwards RH, Bonci A. Dopaminergic terminals in the nucleus accumbens but not the dorsal striatum corelease glutamate. The Journal of Neuroscience. 2010;30:8229–8233. doi: 10.1523/JNEUROSCI.1754-10.2010. [DOI] [PMC free article] [PubMed] [Google Scholar]
- Südhof TC. The presynaptic active zone. Neuron. 2012;75:11–25. doi: 10.1016/j.neuron.2012.06.012. [DOI] [PMC free article] [PubMed] [Google Scholar]
- Surmeier DJ, Graves SM, Shen W. Dopaminergic modulation of striatal networks in health and Parkinson’s disease. Current Opinion in Neurobiology. 2014;29:109–117. doi: 10.1016/j.conb.2014.07.008. [DOI] [PMC free article] [PubMed] [Google Scholar]
- Szklarczyk D, Gable AL, Lyon D, Junge A, Wyder S, Huerta-Cepas J, Simonovic M, Doncheva NT, Morris JH, Bork P, Jensen LJ, von Mering C. String v11: protein-protein association networks with increased coverage, supporting functional discovery in genome-wide experimental datasets. Nucleic Acids Research. 2019;47:D607–D613. doi: 10.1093/nar/gky1131. [DOI] [PMC free article] [PubMed] [Google Scholar]
- Takahashi T, Momiyama A. Different types of calcium channels mediate central synaptic transmission. Nature. 1993;366:156–158. doi: 10.1038/366156a0. [DOI] [PubMed] [Google Scholar]
- Takano T, Wallace JT, Baldwin KT, Purkey AM, Uezu A, Courtland JL, Soderblom EJ, Shimogori T, Maness PF, Eroglu C, Soderling SH. Chemico-genetic discovery of astrocytic control of inhibition in vivo. Nature. 2020;588:296–302. doi: 10.1038/s41586-020-2926-0. [DOI] [PMC free article] [PubMed] [Google Scholar]
- Tan C, de Nola G, Qiao C, Imig C, Born RT, Brose N, Kaeser PS. Munc13 supports fusogenicity of non-docked vesicles at synapses with disrupted active zones. eLife. 2022a;11:e79077. doi: 10.7554/eLife.79077. [DOI] [PMC free article] [PubMed] [Google Scholar]
- Tan C, Wang SSH, de Nola G, Kaeser PS. Rebuilding essential active zone functions within a synapse. Neuron. 2022b;110:1498–1515. doi: 10.1016/j.neuron.2022.01.026. [DOI] [PMC free article] [PubMed] [Google Scholar]
- Tang A-H, Chen H, Li TP, Metzbower SR, MacGillavry HD, Blanpied TA. A trans-synaptic nanocolumn aligns neurotransmitter release to receptors. Nature. 2016;536:210–214. doi: 10.1038/nature19058. [DOI] [PMC free article] [PubMed] [Google Scholar]
- Threlfell S, Lalic T, Platt NJ, Jennings KA, Deisseroth K, Cragg SJ. Striatal dopamine release is triggered by synchronized activity in cholinergic interneurons. Neuron. 2012;75:58–64. doi: 10.1016/j.neuron.2012.04.038. [DOI] [PubMed] [Google Scholar]
- Tritsch NX, Ding JB, Sabatini BL. Dopaminergic neurons inhibit striatal output through non-canonical release of GABA. Nature. 2012;490:262–266. doi: 10.1038/nature11466. [DOI] [PMC free article] [PubMed] [Google Scholar]
- Uchigashima M, Ohtsuka T, Kobayashi K, Watanabe M. Dopamine synapse is a neuroligin-2-mediated contact between dopaminergic presynaptic and gabaergic postsynaptic structures. PNAS. 2016;113:4206–4211. doi: 10.1073/pnas.1514074113. [DOI] [PMC free article] [PubMed] [Google Scholar]
- Uezu A, Kanak DJ, Bradshaw TWA, Soderblom EJ, Catavero CM, Burette AC, Weinberg RJ, Soderling SH. Identification of an elaborate complex mediating postsynaptic inhibition. Science. 2016;353:1123–1129. doi: 10.1126/science.aag0821. [DOI] [PMC free article] [PubMed] [Google Scholar]
- Wang L, Zhang X, Xu H, Zhou L, Jiao R, Liu W, Zhu F, Kang X, Liu B, Teng S, Wu Q, Li M, Dou H, Zuo P, Wang C, Wang S, Zhou Z. Temporal components of cholinergic terminal to dopaminergic terminal transmission in dorsal striatum slices of mice. The Journal of Physiology. 2014;592:3559–3576. doi: 10.1113/jphysiol.2014.271825. [DOI] [PMC free article] [PubMed] [Google Scholar]
- Wang SSH, Held RG, Wong MY, Liu C, Karakhanyan A, Kaeser PS. Fusion competent synaptic vesicles persist upon active zone disruption and loss of vesicle docking. Neuron. 2016;91:777–791. doi: 10.1016/j.neuron.2016.07.005. [DOI] [PMC free article] [PubMed] [Google Scholar]
- Wildenberg G, Sorokina A, Koranda J, Monical A, Heer C, Sheffield M, Zhuang X, McGehee D, Kasthuri B. Partial connectomes of labeled dopaminergic circuits reveal non-synaptic communication and axonal remodeling after exposure to cocaine. eLife. 2021;10:e71981. doi: 10.7554/eLife.71981. [DOI] [PMC free article] [PubMed] [Google Scholar]
- Wu X, Cai Q, Shen Z, Chen X, Zeng M, Du S, Zhang M. Rim and RIM-BP form presynaptic active-zone-like condensates via phase separation. Molecular Cell. 2019;73:971–984. doi: 10.1016/j.molcel.2018.12.007. [DOI] [PubMed] [Google Scholar]
- Yung KKL, Bolam JP, Smith AD, Hersch SM, Ciliax BJ, Levey AI. Immunocytochemical localization of D1 and D2 dopamine receptors in the basal ganglia of the rat: light and electron microscopy. Neuroscience. 1995;65:709–730. doi: 10.1016/0306-4522(94)00536-E. [DOI] [PubMed] [Google Scholar]
- Zhang S, Qi J, Li X, Wang HL, Britt JP, Hoffman AF, Bonci A, Lupica CR, Morales M. Dopaminergic and glutamatergic microdomains in a subset of rodent mesoaccumbens axons. Nature Neuroscience. 2015;18:386–392. doi: 10.1038/nn.3945. [DOI] [PMC free article] [PubMed] [Google Scholar]
- Zhao G, Oztan A, Ye Y, Schwarz TL. Kinetochore proteins have a post-mitotic function in neurodevelopment. Developmental Cell. 2019;48:873–882. doi: 10.1016/j.devcel.2019.02.003. [DOI] [PMC free article] [PubMed] [Google Scholar]
- Zhou FM, Liang Y, Dani JA. Endogenous nicotinic cholinergic activity regulates dopamine release in the striatum. Nature Neuroscience. 2001;4:1224–1229. doi: 10.1038/nn769. [DOI] [PubMed] [Google Scholar]
- Zhou Q, Lai Y, Bacaj T, Zhao M, Lyubimov AY, Uervirojnangkoorn M, Zeldin OB, Brewster AS, Sauter NK, Cohen AE, Soltis SM, Alonso-Mori R, Chollet M, Lemke HT, Pfuetzner RA, Choi UB, Weis WI, Diao J, Südhof TC, Brunger AT. Architecture of the synaptotagmin-SNARE machinery for neuronal exocytosis. Nature. 2015;525:62–67. doi: 10.1038/nature14975. [DOI] [PMC free article] [PubMed] [Google Scholar]
- Zhou Q, Zhou P, Wang AL, Wu D, Zhao M, Südhof TC, Brunger AT. The primed SNARE-complexin-synaptotagmin complex for neuronal exocytosis. Nature. 2017;548:420–425. doi: 10.1038/nature23484. [DOI] [PMC free article] [PubMed] [Google Scholar]
- Zych SM, Ford CP. Divergent properties and independent regulation of striatal dopamine and GABA co-transmission. Cell Reports. 2022;39:110823. doi: 10.1016/j.celrep.2022.110823. [DOI] [PMC free article] [PubMed] [Google Scholar]