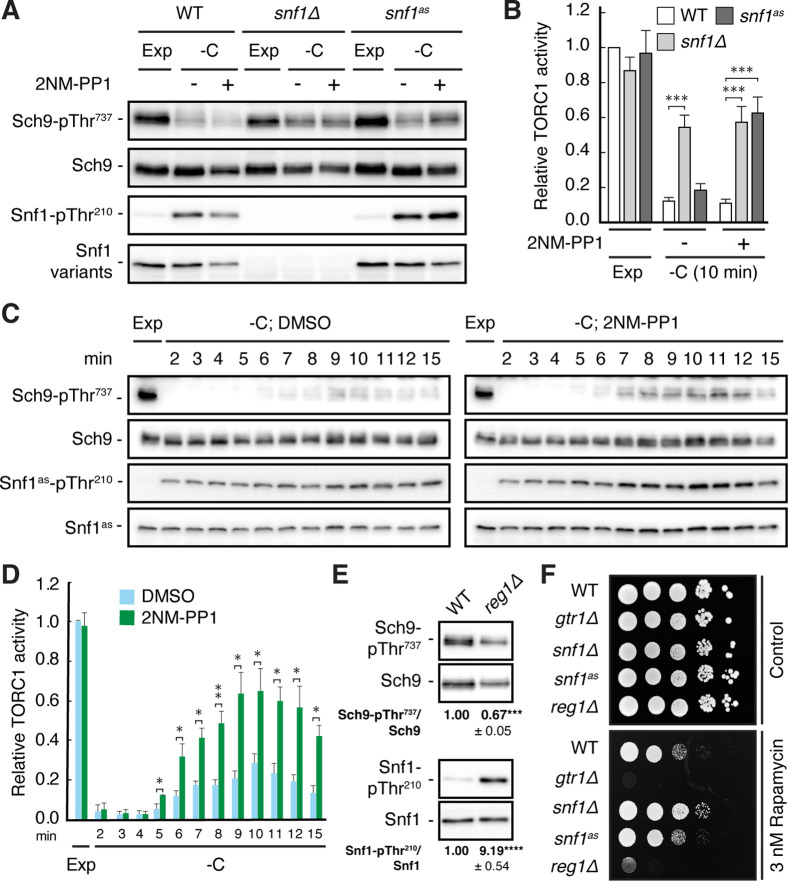
Figure 1. Snf1 is required for proper downregulation of TORC1 in glucose-starved cells.
(A, B) Wild-type (WT), snf1Δ, and snf1as (analog-sensitive) cells were grown exponentially (Exp) and starved for glucose for 10 min (-C) in the absence (-; DMSO vehicle control) or presence (+) of 2NM-PP1. Phosphorylation of the bona fide TORC1 target residue Thr737 in Sch9 and of Thr210 in Snf1 was detected by immunoblot analyses of whole cell extracts using phospho-specific antibodies against the respective phospho-residues. Anti-Sch9 and anti-His6 antibodies served to detect the levels of Sch9 and Snf1, respectively (A). Notably, binding of 2NM-PP1 to the catalytic cleft of Snf1as inhibits its kinase activity and, at the same time, prevents the dephosphorylation of phosphorylated Thr210 (pThr210) in Snf1 (Chandrashekarappa et al., 2013). The mean TORC1 activities (i.e. Sch9-pThr737/Sch9) were quantified, normalized relative to exponentially growing WT cells (set to 1.0), and shown in the bar diagram in (B) (n=6; + SEM; unpaired Student’s t-test, ***≤0.0005). (C, D) Analog-sensitive snf1as cells were treated as in (A), but harvested at the times indicated following glucose starvation (-C). The respective relative TORC1 activities were assessed as in (B), but cross-normalized (for each of the two sets of blots) to the same sample from exponentially growing cells (lane 1; Exp), and are shown in (D) (n=4; + SEM; unpaired Student’s t-test, *p≤0.05, **p≤0.005). (E) WT and reg1∆ cells were grown exponentially and assayed for their mean relative TORC1 activities (Sch9-pThr737/Sch9) and Snf1-Thr210 phosphorylation levels (Snf1-pThr210/Snf1), each normalized to WT cells (set to 1.0; n=4; ± SEM). In unpaired Student’s tests, both values in reg1∆ cells were significantly different from the ones in WT cells (***p≤0.0005, ****p≤0.00005). (F) Exponentially growing cells (of the indicated genotype) were 10-fold serially diluted, spotted on synthetic complete medium containing, or not (control), 3 nM rapamycin, and grown for 3 days at 30 °C (n=3). The online version of this article includes the following source data for Figure 1—source data 1, quantification of blots for graphs shown in (B, D and E); Figure 1—source data 2, uncropped blots shown in (A, C and E); Uncropped dropspots shown in (F); Figure 1—source data 3, raw blots shown in (A, C and E) and raw dropspots shown in (F).


