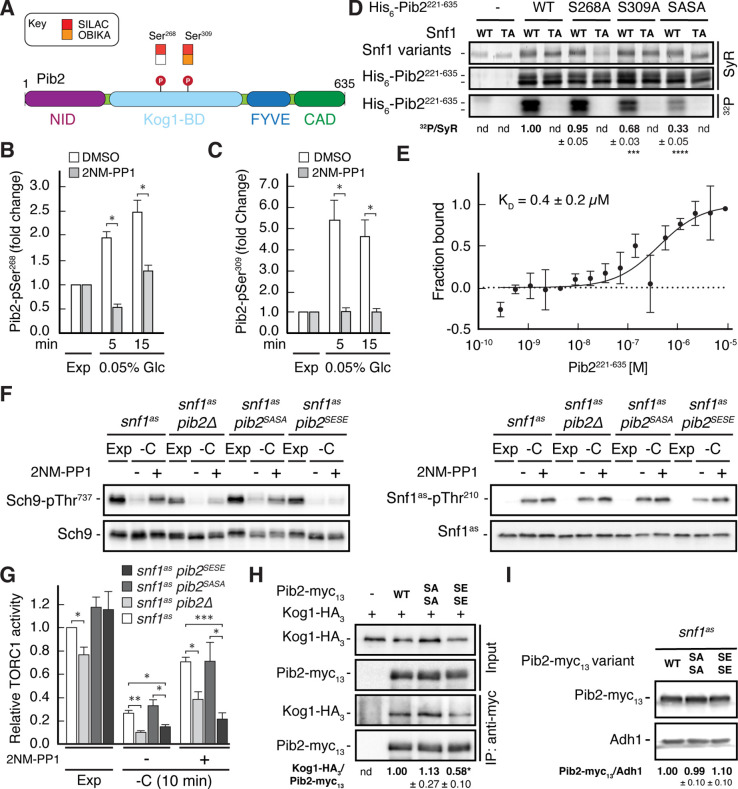
Figure 4. Snf1 weakens the Pib2-Kog1 association by phosphorylating Pib2-Ser268,309.
(A) Schematic representation of the structure of Pib2 with the N-terminal TORC1-inhibitory (NID), Kog1-binding (Kog1-BD), phosphatidylinositol-3-phosphate (PI3P) -binding Fab1-YOTB-Vac1-EEA1 (FYVE), and C-terminal TORC1-activatory (CAD) domains (Hatakeyama, 2021). The residues Ser268 and Ser309 in Pib2 were both identified as potential Snf1 targets (P) in vivo (SILAC), while only Ser309 was recovered in our highly multiplexed on-beads in vitro kinase assays (OBIKA) with Snf1. (B, C) Snf1 controls the phosphorylation of Ser268 and Ser309 in Pib2 in vivo. Phosphorylation levels of Pib2-Ser268 (B) and Pib2-Ser309 (C) in untreated (DMSO) and 2NM-PP1-treated snf1as cells that were grown exponentially (Exp) and limited for glucose (0.05%) for the times indicated. Mean values were extracted from the SILAC experiment (Supplementary file 2 and Figure 3) and normalized to the ones in exponentially growing cells (set to 1.0) (n=3; + SD; unpaired Student’s t-test, *FDR ≤ 0.05). (D) Snf1 phosphorylates Ser268 and Ser309 in Pib2 in vitro. Snf1 (WT) and kinase-inactive Snf1T210A (TA) were purified from yeast and used in protein kinase assays with [γ-32P]-ATP and a bacterially-expressed fragment of Pib2 (Pib2221-635) lacking the N-terminal 220 amino acids that, according to our in vivo proteomics analyses, did not contain a potential Snf1 target residue. In parallel protein kinase assays, we also used the respective Pib2S268A, Pib2S309A, and Pib2S268A/S309A (Pib2SASA) mutant fragments as substrates. Substrate phosphorylation was detected by autoradiography (32P, lower panel) and Sypro Ruby (SyR) staining is shown as loading control for the Snf1 variants (upper panel) and the His6-tagged Pib2 fragments that were partially degraded and ran in more than 1 band (panel in the middle). The mean phosphorylation of Pib2S268A, Pib2S309A, and Pib2S268A/S309A (Pib2SASA) fragments by wild-type Snf1 (i.e. 32P signal/Sypro Ruby [SyR] substrate input level [including the indicated faster migrating proteolytic forms]; nd, not detected) was assessed relative to the one of the Pib2WT fragment (set to 1.0; n=3; ± SEM; unpaired Student’s t-test, ***p≤0.0005, ****p≤0.00005). (E) The Snf1 complex binds Pib2. The binding affinity between bacterially purified, titrated Pib2221-635 and yeast purified Snf1 complex (containing the C-terminally GFP-tagged Snf4 γ-subunit) was assessed by microscale thermophoresis. The dissociation constant (KD; 95% profile likelihood = 136–1098 nM, n=3; ± SEM) was calculated using a nonlinear asymmetric sigmoidal regression. (F, G) Expression of the phosphomimetic Pib2S268E,S309E allele, like loss of Pib2, rescues the TORC1 inactivation defect in glucose-starved, Snf1-compromised cells. Exponentially growing snf1as, snf1as pib2∆, snf1as pib2S268A,S309A (pib2SASA), and snf1as pib2S268E,S309E (pib2SESE) cells were grown exponentially (Exp) and then starved for 10 min for glucose (-C) in the absence (-; DMSO) or the presence (+) of 2NM-PP1. Immunoblot analyses of Sch9-pThr737 and Sch9 (left blots) and of Snf1as-pThr210 and Snf1as (right blots) were carried out as in Figure 1A (F). The mean relative TORC1 activities in the four strains were quantified as in Figure 1B and normalized to the values in exponentially growing snf1as cells (set to 1.0; n=4; + SEM; unpaired Student’s t-test, *p≤0.05, **p≤0.005, ***p≤0.0005) (G). (H) The phosphomimetic Pib2S268E,S309E is compromised for TORC1-binding. Kog1-HA3-expressing cells co-expressing Pib2-myc13 (WT), Pib2S368A,S309A-myc13 (SASA), Pib2S368E,S309E-myc13 (SESE), or untagged Pib2 (-) were grown exponentially. Lysates (input) containing 60 mM glutamine and anti-myc immunoprecipitates (IP: anti-myc) were analyzed by immunoblotting with anti-HA and anti-myc antibodies, respectively. The mean relative amount of Kog1-HA3 that was immunoprecipitated with Pib2-myc13 and its variants was determined and normalized to the one between Kog1-HA3 and Pib2-myc13 (set to 1.0; n=4; + SEM; unpaired Student’s t-test, *p≤0.05; nd, not detected). (I) Pib2-myc13 alleles are adequately expressed. Expression of Pib2-myc13 variants (as in F) was probed by immunoblot analysis in extracts of exponentially growing cells using anti-myc antibodies. Values were quantified relative to Adh1 levels (detected with anti-Adh1 antibodies) and normalized to the respective Pib2-myc13/Adh1 ratio in cells expressing the WT Pib2-myc13 (n=3; ± SEM; unpaired Student’s t-test; nd, not detected). The online version of this article includes the following source data for Figure 4—source data 1, data for the graph shown in (B, C and E) and quantifications of the blots in (D, H and I) and for the graph shown in (G); Figure 4—source data 2, uncropped blots, gels and autoradiographies shown in (D, F, H and I); Figure 4—source data 3, raw blots, gels and autoradiographies shown in (D, F, H and I).

