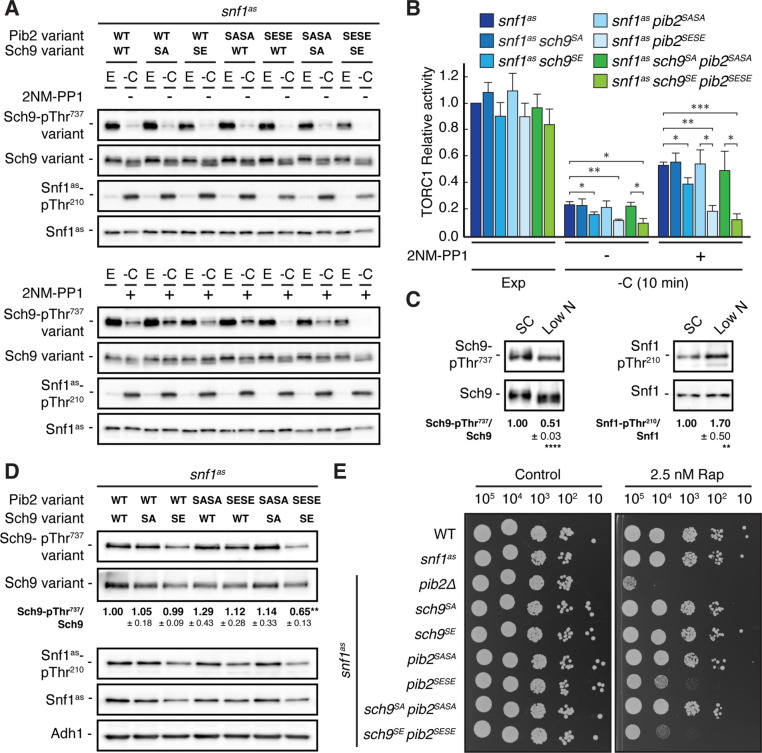
Figure 6. Physiological effects of Sch9S288E and Pib2S268E,S309E are additive.
(A, B) Exponentially growing (E) snf1as cells expressing the indicated combinations of wild type Pib2 (Pib2 variant: WT), Pib2S268A,S309A (Pib2 variant: SASA), and Pib2S268E,S309E (Pib2 variant: SESE) and wild type Sch9 (Sch9 variant: WT), Sch9288A (Sch9 variant: SA), and Sch9S288E (Sch9 variant: SE) were starved for glucose (10 min; -C) in the absence (-; DMSO; upper panels) and presence of 2NM-PP1 (+; lower panels). Immunoblot analyses were performed as in Figure 1A and the mean relative TORC1 activities (i.e. Sch9-pThr737/Sch9) were quantified, normalized relative to exponentially growing snf1as cells (set to 1.0), and shown in the bar diagram in (B) (n=4; + SEM; unpaired Student’s t-test, *p≤0.05, **p≤0.005, ***p≤0.0005). (C) Growth on media containing low nitrogen levels activates Snf1-Thr210 phosphorylation and decreases TORC1 activity. WT cells were grown exponentially on SC or low nitrogen medium and assayed for their mean relative TORC1 activities (Sch9-pThr737/Sch9) and Snf1-Thr210 phosphorylation levels (Snf1-pThr210/Snf1), each normalized to the values of cells grown on SC (set to 1.0; n=10; ± SEM). In unpaired Student’s tests, both values in cells growing on low nitrogen medium were significantly different form the ones growing on SC (**p≤0.005, ****p≤0.005). (D, E) Combined expression of Sch9S288E and Pib2S268E,S309E causes reduced Sch9-Thr737 phosphorylation (D) and enhanced rapamycin sensitivity (E). In (D), indicated strains were grown exponentially on low nitrogen medium and assayed for their mean TORC1 activities as in (C), which were normalized to the value of WT cells (set to 1.0; n=4; ± SEM; unpaired Student’s t-test, **p≤0.005). In (E), cells with the indicated genotypes were grown exponentially in SD, then 10-fold serially diluted, spotted on control plates (SD) or 2.5 nM rapamycin-containing plates, and grown for 3 days at 30 °C (n=4). The online version of this article includes the following source data for Figure 6—source data 1, quantifications of the blots in (C and D) and for graph shown in (B); Figure 6—source data 2, uncropped blots shown in (A, C and D); uncropped dropspots shown in (E); Figure 6—source data 3, raw blots shown in (A, C and D); raw dropspots shown in (E).

