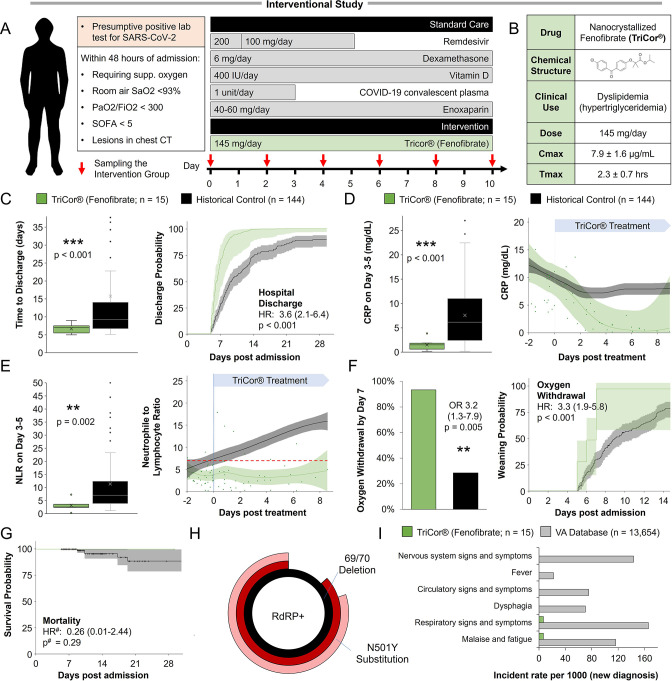
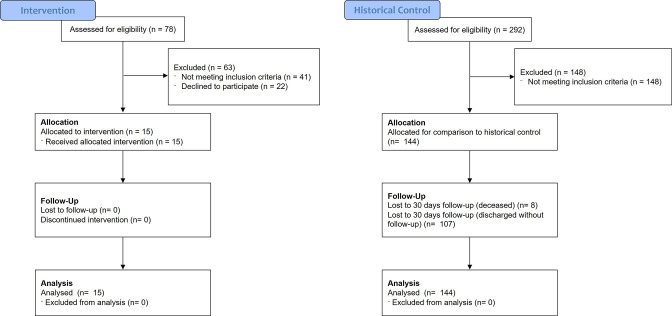
Figure 5. Inflammation and speed recovery in severe COVID-19 patients treated with standard-of-care plus nanocrystallized fenofibrate.
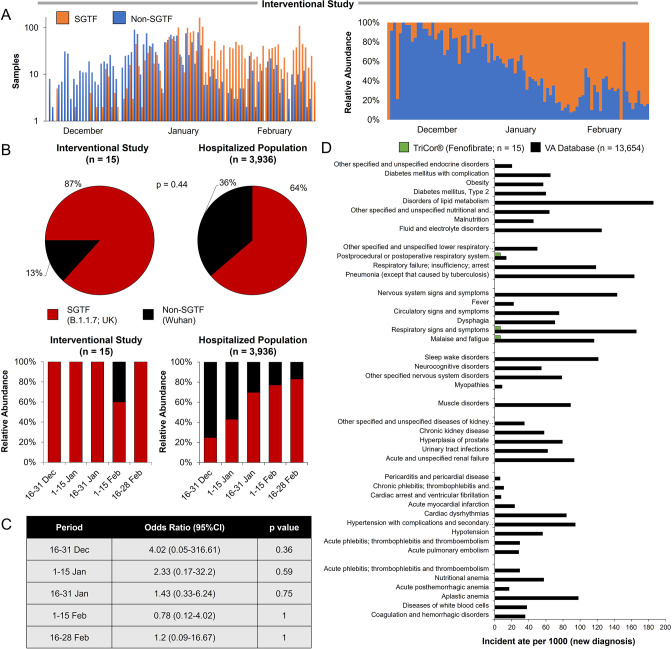
(A) Schematic depicting interventional study design in 15 severe hospitalized COVID-19 patients receiving remdesivir, dexamethasone, and enoxaparin. Patients received 145 mg/day of nanocrystallized fenofibrate for 10 days with blood samples taken every 48–72 hr until discharge (methods). (B) Chemical, clinical, and pharmacokinetic characteristics of nanocrystallized fenofibrate. Lower Tmax compared to other fibrates enables rapid intervention in deteriorating COVID-19 patients. (C) Box and whisker plot of hospitalization duration (left) and Cox accumulative estimated hospital time to discharge by day 28 analysis, plotted as 1 minus the Cox estimator (right). Patients treated with nanocrystallized fenofibrate had a significantly lower hospitalization duration (n=15, p<0.001), and a higher likelihood of discharge (HR: 3.6, 95% CI 2.1–6.4, n=15, p<0.001). (D–E) Dynamic changes (right) and box and whisker plots (left) of immunoinflammatory indicators C-reactive protein (CRP) and neutrophil-to-lymphocyte ratio (NLR) in treatment and non-treatment groups (Control) over hospitalization duration (methods). The centerline shows the mean value while the 95% confidence interval is shaded. (D) High CRP levels gradually declined in the control group reaching a plateau by day 7. Nanocrystallized fenofibrate-treated patients showed a faster decline in inflammation, resulting in significantly lower CRP levels 3–5 days post-treatment (n=15, p<0.001). (E) NLR in the control group increased during hospitalization indicating severe immunoinflammatory stress. Patients treated with nanocrystallized fenofibrate showed no increase in NLR, suggesting minimal immune response, resulting in a significantly lower NLR 3–5 days post-treatment (n=15; p=0.002). (F) Withdrawal from oxygen support plotted as cumulative incidence at day 7 (left; OR: 3.2, 95% CI 1.3–7.9, n=15, p=0.005) Kaplan-Meier estimated time to discharge by day 28, plotted as 1 minus the survival estimator (right; HR: 2.9, 95% CI 1.7–5.0, n=15, p<0.001). (G) Kaplan–Meier survival curves of 28 days mortality in treatment and non-treatment groups (Control) and Cox regression modeling presenting hazard ratio estimate, 95% CI, and p-value. (H) Novaplex SARS-CoV-2 qPCR variant analysis (methods), showing a dominant presence of 69/70 deletion and N501Y substitution mutation correlating to the B.1.1.7 (UK) variant of the virus in the patient population. (I) Assessment of significant post-acute incident diagnoses in people who had been hospitalized with COVID-19 (long COVID) in patients taken from Al-Aly and colleagues (Al-Aly et al., 2021) compared to those treated with 145 mg fenofibrate in this study at 6 months after hospital discharge. Incident rate (IR) per 1000 at 6 months in hospitalized COVID-19 was ascertained from day 30 after hospital admission until 6 months or end of follow-up. For each outcome, cohort participants without a history of the outcome in the past year were included in the analysis. Hazard ratios (HR) and the related p-values were calculated by a Cox regression model. Odds ratios (ORs) and the related p-values were calculated using Fisher’s exact test (methods). * p<0.05, ** p<.0.01, *** p<0.001. In boxplots, x is the mean; center line is the median; box limits are the 25th and 75th percentiles; whiskers extend to 1.5×the interquartile range (IQR) from the 25th and 75th percentiles; dots are outliers. # indicates that the hazard ratios were calculated using Firth’s correction for monotone likelihood with profile likelihood confidence limits.


