Abstract.
Purpose
Segmenting medical images accurately and reliably is important for disease diagnosis and treatment. It is a challenging task because of the wide variety of objects’ sizes, shapes, and scanning modalities. Recently, many convolutional neural networks have been designed for segmentation tasks and have achieved great success. Few studies, however, have fully considered the sizes of objects; thus, most demonstrate poor performance for small object segmentation. This can have a significant impact on the early detection of diseases.
Approach
We propose a context axial reverse attention network (CaraNet) to improve the segmentation performance on small objects compared with several recent state-of-the-art models. CaraNet applies axial reserve attention and channel-wise feature pyramid modules to dig the feature information of small medical objects. We evaluate our model by six different measurement metrics.
Results
We test our CaraNet on segmentation datasets for brain tumor (BraTS 2018) and polyp (Kvasir-SEG, CVC-ColonDB, CVC-ClinicDB, CVC-300, and ETIS-LaribPolypDB). Our CaraNet achieves the top-rank mean Dice segmentation accuracy, and results show a distinct advantage of CaraNet in the segmentation of small medical objects.
Conclusions
We proposed CaraNet to segment small medical objects and outperform state-of-the-art methods.
Keywords: small object segmentation, brain tumor, colonoscopy, attention, context axial reverse
1. Introduction
Deep learning has had a tremendous impact on various scientific fields. The focus of this study in deep learning is one of the most critical areas of computer vision: medical image segmentation. Recently, various convolutional neural networks (CNNs) have shown great performance in medical image segmentation.1–4 CNNs have been introduced for various medical imaging modalities, including x-ray, visible-light imaging, magnetic resonance imaging (MRI), positron emission tomography, and computerized tomography (CT). They all have achieved excellent performance on medical image segmentation challenges from different modalities, such as BraTS,5–7 KiTS19,8 and COVID19–20.9,10 To obtain more accurate segmentation results, many works have introduced improvements of network architectures. These improvements are mostly attributed to exploring new neural architectures by designing networks with varying depths (ResNet11), widths (ResNeXt12), connectivity (DenseNet13 and GoogLeNet14), or new types of components (pyramid scene15 and atrous convolution16). Although the new architectures improve the overall segmentation results, they are less sensitive to detecting small medical objects. And it is very common in medical image segmentation that the anatomy of interest occupies only a very small portion of the image.17 Most extracted features belong to the background, with these small lesion areas being important for early detection and diagnosis. For example, the survival rate decreases with the growing size of a brain tumor.18 Thus, it has clinical significance to build an effective network to detect tiny medical objects.
The attention mechanism plays a dominant role in neural network research. It can effectively use information transferred from several subsequent feature maps to detect the salience features.19 Many attention methods such as self-attention and multi-head attention have been verified to have high performance in applications of natural language processing20 and computer vision.21 Those attention methods also have been successfully used for medical image segmentation; e.g., the Medical Transformer22 used a gated axial self-attention layer to build a Local-Global network for ultrasound and microscopy image segmentation, TransUNet23 stacked self-attention as a transformer in the encoder for CT image segmentation, and CoTr24 bridged the CNN encoder and decoder by the transformer encoder for multi-organ segmentation. All of these attention-based segmentations achieved significant improvement compared with purely CNN such as U-Net1 and fully convolutional networks.25
Although these types of neural networks show good performance on many medical segmentation tasks, they seldom consider the small object segmentation, especially in the medical image area. We propose a novel attention-based deep neural network, called CaraNet. The contributions of the paper can be summarized as follows:
-
1.
We propose a novel neural network, CaraNet, to solve the problem of segmentation of small medical objects.
-
2.
We introduce a method to evaluate the network’s performance on small medical objects.
-
3.
Our experiments show that CaraNet outperforms most current models (e.g., DS-TransUNet from TMI’22, CCBANet from MICCAI’21, and PraNet from MICCAI’20) and advances the state-of-the-art by a large margin, both overall and on small objects, in segmentation performance on polyps.
2. Method
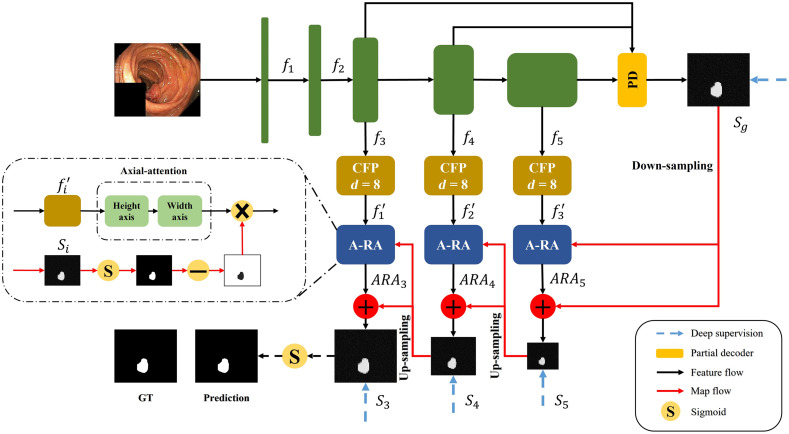
Figure 1 shows the architecture of our CaraNet, which uses a parallel partial decoder4 to generate the high-level semantic global map and a set of context and axial reverse attention (A-RA) operations to detect global and local feature information. We introduce the main components of the CaraNet architecture in the following subsections with explanations of the motivation, purpose, or effectiveness of adding these components.
Fig. 1.
Overview of CaraNet, which contains the pretrained backbone, partial decoder, CFP module, and A-RA module.
2.1. Backbone
Transfer learning provides a feasible method for alleviating the challenge of data-hunger, and it has been widely applied to the field of computer vision.26 Benefiting from the strong visual knowledge distributed in ImageNet,27 the pre-trained CNNs can be fine-tuned with a small amount of task-specific data and can perform well on downstream tasks. Because Res2Net28 can construct hierarchical residual-like connections within one single residual block that has stronger multi-scale representation ability, we applied the pre-trained Res2Net as the backbone of CaraNet.
2.2. Partial Decoder
Existing state-of-the-art segmentation networks rely on aggregating multi-level features from the encoder (e.g., U-Net aggregates all level features extracted from an encoder). Compared with the high-level features, however, low-level features contribute less to the performance but have higher computational cost because of their larger spatial resolution.29 Thus, we applied the parallel partial decoder4 as shown in Fig. 2 to aggregate high-level features. We feed the original image with a size of (, , and represent the height, width, and channel, respectively) into Res2Net, and we get five different level features with a resolution of . We aggregate the high-level features from Res2Net using the partial decoder with a parallel connection. Then, we get a global map .
Fig. 2.
Overview of the partial decoder with parallel connection.
2.3. Channel-Wise Feature Pyramid Module
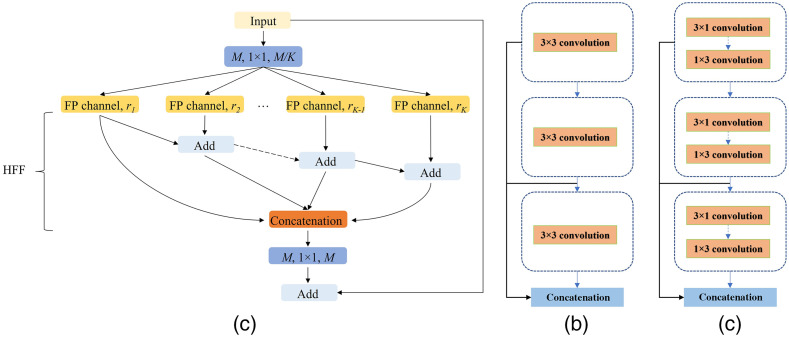
The feature pyramid (FP) has been widely used in deep learning models for computer vision tasks due to its ability to represent multi-scale features. For example, PSPNet15 builds a pyramid pooling module with different sizes of pooling layers to extract multi-scale features, and the feature pyramid network30 takes different strides with convolution kernels to obtain an FP. Although these FP-based methods perform well in the computer vision area, they cannot avoid using large numbers of parameters, which consume a large amount of computation resources. In addition, their receptive fields are usually small and do not perform well in datasets with sharply varying object sizes.31 Alternatively, our previous works31,32 proposed a lightweight channel-wise feature pyramid (CFP) module and successfully applied it to both nature and medical image segmentation. The architecture of this CFP module is shown in Fig. 3.
Fig. 3.
(a) CFP module; (b) FP channel with regular convolution; and (c) FP channel with asymmetric convolution.
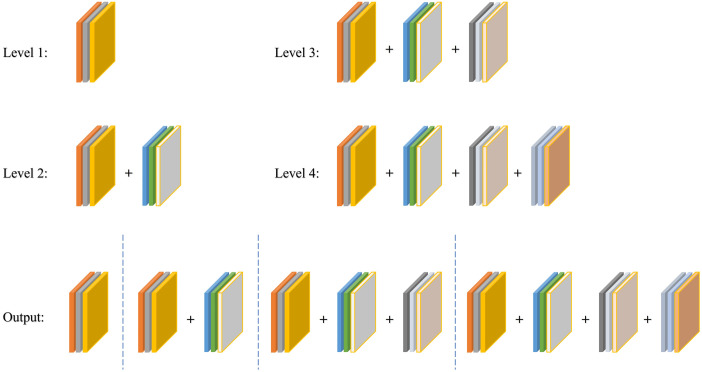
Figure 3(a) shows the architecture of the CFP module; it contains a total of channels, and each channel has its own dilation rate . Typically, we choose the for CaraNet and the dilation rates for each channel , which has been verified as the best dilation rates combination for CaraNet in Table 4; thus, each channel’s dimension is . The simple feature fusion method sometimes introduces some unwanted checkerboard or gridding artifacts that greatly influence the accuracy and quality of segmentation masks.31 Thus, we apply hierarchical feature fusion33 (HFF) to sum the outputs of all channels step by step. For the FP channel, we provide two versions with regular convolution and asymmetric convolution as shown in Figs. 3(b) and 3(c). We connect the outputs of each convolutional module using skip connection, and thus each channel can be considered to be a sub-pyramid. We select the regular convolution as the FP channel for CaraNet. The overall FP is obtained from concatenating the sub-pyramids from the HFF operation. The final FP contains four levels of feature stacks as shown in Fig. 4. These four levels of feature stacks are computed as
| (1) |
Table 4.
Quantitative results on Kvasir for different dilation rates.
| Dilation rate | Mean Dice |
|---|---|
| 0 | 0.909 |
| 4 | 0.908 |
| 8 | 0.918 |
| 16 | 0.913 |
| 32 | 0.907 |
Note: Bold values represent best performance.
Fig. 4.
Final FP obtained from the CFP module.
The final FP is computed by . Based on our split-merge FP strategy, the receptive fields of a single CFP module with dilation rates vary from to , which successfully overcomes the challenge from sharply varying object sizes.
2.4. Axial Reverse Attention Module
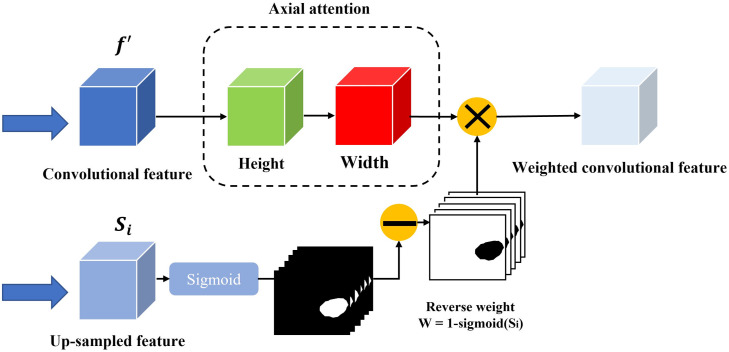
The previous partial decoder that generates the global map (Sec. 2.2) could roughly locate the position of medical objects, and the CFP module extracted only multi-scale features from the pre-trained model. To obtain more accurate feature information, we design the A-RA module to refine localization information and multi-scale features efficiently. The overview and detail of the A-RA module can be seen in Figs. 1 and 5, respectively. The input of the top line is the multi-scale feature maps from the CFP module, and we use axial attention to analyze the salience information. The axial attention is based on self-attention, which maps a query and a set of key-value pairs to an output and the operation as
| (2) |
where , and represent the query, key, value, and dimension of the key, respectively. However, self-attention consumes great computational resources, especially when the spatial dimension of the input is large.34 Therefore, we apply axial attention, which factorizes 2D attention into two 1D attention along the height and width axes. Here, we replace the Softmax activation function with a sigmoid, based on the experiments. For the second line, we applied the reverse operation35 to detect the salience features from the side-output , which is obtained from the output of the previous A-RA module. The reverse operation is given as
| (3) |
Fig. 5.
Structure of the A-RA module.
The total A-RA operation is given as
| (4) |
where is element-wise multiplication and the is feature from the axial attention route.
2.5. Deep Supervision
We apply weighted intersection over union (IoU) and weighted binary cross-entropy in our loss function: to calculate the global loss and local (pixel-level) loss, respectively. To train CaraNet, we apply deep supervision for the three side-outputs () and the global map . Before calculating the loss, we up-sample them to the same size as ground truth . Thus, the total loss is given as
| (5) |
2.6. Small Object Segmentation Analysis
Because the size of all images input to the segmentation models must be fixed, the size of an object is determined by the number of pixels in the object and the number of total pixels in the image . Thus, we consider the object’s size using the size ratio (proportion) = . Then, we evaluate the performance of the segmentation models according to the sizes of the objects. In particular, we mainly focus on the small areas with size ratios that are smaller than 5%. To define the watershed of small size is a question; it depends on data and model performance. We further discuss this question in the Discussion section.
To evaluate the performance of segmentation models according to the sizes of objects, we first obtain the mean-Dice coefficients and size ratios of segmentations from the test dataset. Similar to computing the histogram, we plot the results in a curve with the -axis being mean-Dice coefficients and -axis being increasingly sorted size ratios. To smooth the curve, we take interval-averaged mean-Dice coefficients by sorted size ratios: we divide the entire range of size ratios into a consecutive, non-overlapping series of intervals of equal length and then calculate the average mean-Dice coefficients of size ratios in each interval. The interval-averaged coefficients have a smooth curve and are more stable in the presence of noise.
3. Experiment
3.1. Implementation Details
We implemented our model in PyTorch accelerated by the NVIDIA RTX 2070Ti GPU. We resized input images to for polyp segmentation and for brain tumor segmentation and employed a multi-scale training strategy instead of data augmentation. We used Adam optimizer with the initial learning rate .
3.2. Dataset
We test our CaraNet on five polyp segmentation datasets: ETIS,36 CVC-ClinicDB,37 CVC-ColonDB,38 EndoScene,39 and Kvasir.40 The first four are standard benchmarks, and the last one is the largest dataset, which was released recently. We also test our model on the Brain Tumor Segmentation 2018 (BraTS 2018) dataset,5,6 which contains more extremely small medical objects. Table 1 gives the details of these datasets: image size, scale of testing set, and size ratios of medical objects.
Table 1.
Details of the datasets.
| Image size | Number of test samples | Object size ratio | |
|---|---|---|---|
| ETIS | 196 | 0.11% to 29.05% | |
| CVC-ClinicDB | 62 | 0.34% to 45.88% | |
| CVC-ColonDB | 380 | 0.30% to 63.15% | |
| CVC-300 | 60 | 0.55% to 18.42% | |
| Kvasir | 100 | 0.79% to 62.13% | |
| BraTS 2018 | 3231 | 0.01% to 4.91% |
The data of brain tumor segmentation is from the multimodal brain tumor segmentation challenge 2018 (BraTS 2018) built by the Section for Biomedical Image Analysis at the University of Pennsylvania. It contains the multimodal brain MRI scans and manual ground truth labels of glioblastoma from 285 cases (patients). Each case includes four scan-modals: (1) native (T1), (2) T1 contrast enhanced (T1ce), (3) T2-weighted (T2), and (4) T2 fluid attenuated inversion recovery (FLAIR). And each case includes three types of ground truth labels: necrotic and non-enhancing tumor core (NET), gadolinium-enhancing tumor (ET), and peritumoral edema (Ed). In this study, T1ce is selected as our input images, and ground truth labels use NET type because it delineates the minimum areas for small object segmentation. The MRI scans for each case are sliced to 2D images. As given in Table 1, the test samples are chosen by the sizes of objects in images (by examining the areas of truth labels) ranging from 0.01% to 4.91%.
3.3. Baseline
We compared CaraNet with six medical image segmentation models, including state-of-the-art models: U-Net,1 U-Net++,2 ResUNet-mod,41 ResUNet++,3 SFA,42 PraNet,26 CCBANet,43 and DS-TransUNet.44
3.4. Training and Measurement Metrics
We randomly split 80% of images from Kvasir and CVC-ClinicDB as the training set and the remainder as the testing dataset. In addition to mean Dice and mean IoU, we also apply four other measurement metrics: weighted dice metric , MAE, enhanced alignment metric ,45 and structural measurement .46 Table 2 gives the polyp segmentation on the five datasets. The weighted dice metric is used to amend the equal importance flaw in dice. The MAE is used to measure the pixel-to-pixel accuracy. The recently released enhanced alignment metric is utilized to evaluate the pixel-level and global-level similarity. is used to measure the structure similarity between predictions and ground truth.
Table 2.
Quantitative results on Kvasir, CVC-ClinicDB, CVC-ColonDB, ETIS, and CVC-T (test dataset of EndoScene). Note: mDice: mean Dice; mIoU: mean IoU; : weighted dice; : structural measurement;46 : enhanced alignment;45 and MAE: mean absolute error. ↑ denotes that higher is better, and ↓ denotes that lower is better.
| Methods | mDice ↑ | mIoU ↑ | ↑ | ↑ | ↑ | MAE ↓ | |
|---|---|---|---|---|---|---|---|
| Kvasir | UNet | 0.818 | 0.746 | 0.794 | 0.858 | 0.893 | 0.055 |
| UNet++ | 0.821 | 0.743 | 0.808 | 0.862 | 0.910 | 0.048 | |
| ResUNet-mod | 0.791 | N/A | N/A | N/A | N/A | N/A | |
| ResUNet++ | 0.813 | 0.793 | N/A | N/A | N/A | N/A | |
| SFA | 0.723 | 0.611 | 0.670 | 0.782 | 0.849 | 0.075 | |
| PraNet | 0.898 | 0.840 | 0.885 | 0.915 | 0.948 | 0.030 | |
| CCBANet | 0.902 | 0.845 | 0.887 | 0.916 | 0.952 | 0.032 | |
| DS-TransUNet | 0.913 | 0.857 | 0.902 | 0.923 | 0.963 | 0.023 | |
| CaraNet | 0.918 | 0.865 | 0.909 | 0.929 | 0.968 | 0.023 | |
| CVC-ClinicDB | UNet | 0.823 | 0.755 | 0.811 | 0.889 | 0.954 | 0.019 |
| UNet++ | 0.794 | 0.729 | 0.785 | 0.873 | 0.931 | 0.022 | |
| ResUNet-mod | 0.779 | N/A | N/A | N/A | N/A | N/A | |
| ResUNet++ | 0.796 | 0.796 | N/A | N/A | N/A | N/A | |
| SFA | 0.700 | 0.607 | 0.647 | 0.793 | 0.885 | 0.042 | |
| PraNet | 0.899 | 0.849 | 0.896 | 0.936 | 0.979 | 0.009 | |
| CCBANet | 0.909 | 0.856 | 0.903 | 0.939 | 0.971 | 0.010 | |
| DS-TransUNet | 0.912 | 0.859 | 0.908 | 0.936 | 0.976 | 0.007 | |
| CaraNet | 0.936 | 0.887 | 0.931 | 0.954 | 0.991 | 0.007 | |
| ColonDB | UNet | 0.512 | 0.444 | 0.498 | 0.712 | 0.776 | 0.061 |
| UNet++ | 0.483 | 0.410 | 0.467 | 0.691 | 0.760 | 0.064 | |
| SFA | 0.469 | 0.347 | 0.379 | 0.634 | 0.765 | 0.094 | |
| PraNet | 0.709 | 0.640 | 0.696 | 0.819 | 0.869 | 0.045 | |
| CCBANet | 0.758 | 0.675 | 0.736 | 0.842 | 0.880 | 0.042 | |
| DS-TransUNet | 0.762 | 0.682 | 0.738 | 0.829 | 0.872 | 0.053 | |
| CaraNet | 0.773 | 0.689 | 0.729 | 0.853 | 0.902 | 0.042 | |
| ETIS | UNet | 0.398 | 0.335 | 0.366 | 0.684 | 0.740 | 0.036 |
| UNet++ | 0.401 | 0.344 | 0.390 | 0.683 | 0.776 | 0.035 | |
| SFA | 0.297 | 0.217 | 0.231 | 0.557 | 0.633 | 0.109 | |
| PraNet | 0.628 | 0.567 | 0.600 | 0.794 | 0.841 | 0.031 | |
| CCBANet | 0.677 | 0.610 | 0.640 | 0.800 | 0.838 | 0.028 | |
| DS-TransUNet | 0.675 | 0.592 | 0.625 | 0.802 | 0.859 | 0.023 | |
| CaraNet | 0.747 | 0.672 | 0.709 | 0.868 | 0.894 | 0.017 | |
| CVC-T | UNet | 0.710 | 0.627 | 0.684 | 0.843 | 0.876 | 0.022 |
| UNet++ | 0.707 | 0.624 | 0.687 | 0.839 | 0.898 | 0.018 | |
| SFA | 0.467 | 0.329 | 0.341 | 0.640 | 0.817 | 0.065 | |
| PraNet | 0.871 | 0.797 | 0.843 | 0.925 | 0.972 | 0.010 | |
| CCBANet | 0.903 | 0.833 | 0.881 | 0.933 | 0.986 | 0.007 | |
| DS-TransUNet | 0.880 | 0.798 | 0.854 | 0.920 | 0.978 | 0.007 | |
| CaraNet | 0.903 | 0.838 | 0.887 | 0.940 | 0.989 | 0.007 | |
Note: Bold values represent best performance.
3.5. Results
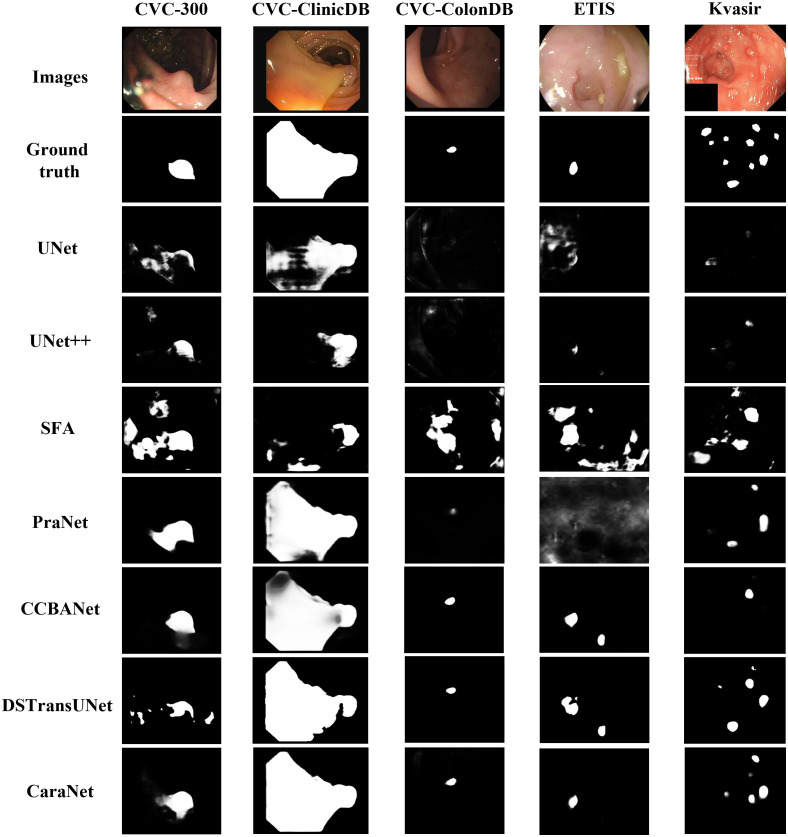
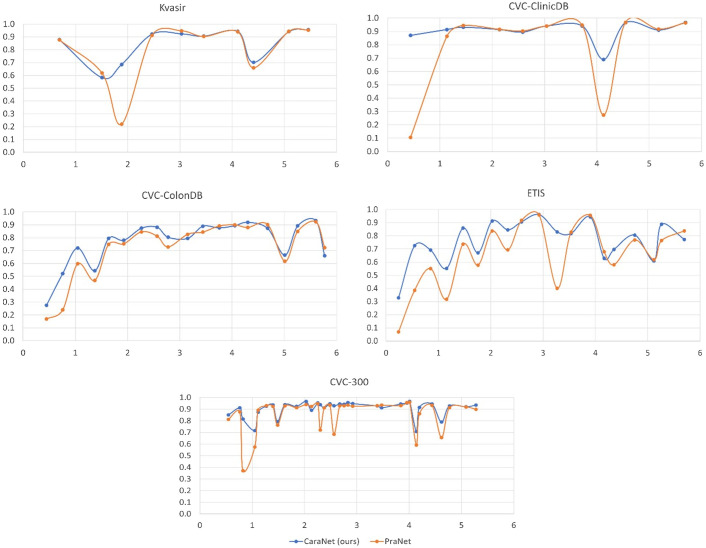
We first report the polyp segmentation results and compare with the state-of-the-art methods such as DS-TransUNet, CCBANet, and PraNet in Table 2. Among all five public endoscopy segmentation datasets, our proposed CaraNet achieves the best performance, especially in the ETIS dataset, which contains more small polyps. We also show some polyp segmentation results in Fig. 6. For the five polyp datasets, CaraNet outperforms the compared models not only in overall performance but also on samples with small polyps. Figure 7 shows the segmentation performance of CaraNet and PraNet for small objects (proportions ). For the extremely small object segmentation analysis on the BraTS 2018 dataset, we compare only CaraNet with PraNet because PraNet has the closest performance to ours, and the overall accuracies of the other segmentation models are clearly lower than those of CaraNet and PraNet. (Note that the fluctuations with size in the colonoscopy datasets are caused by the types and boundary of polyps and the quality of imaging.)
Fig. 6.
Polyp segmentation results.
Fig. 7.
Performance of CaraNet and PraNet for small object segmentation. The discussion about small object segmentation analysis is in Sec. 2.6. For each subfigure, the -axis is the proportion size (%) of polyp, and the -axis is the averaged mean Dice coefficient. Subfigures show performance versus size on the five polyp datasets, which are Kvasir, CVC-ClinicDB, CVC-ColonDB, ETIS, and CVC-300. The blue line is for our CaraNet, and the orange is for the PraNet, showing only the results of small polyp sizes (). We find that our CaraNet overperforms the PraNet for most cases of small size polyps from the five datasets.
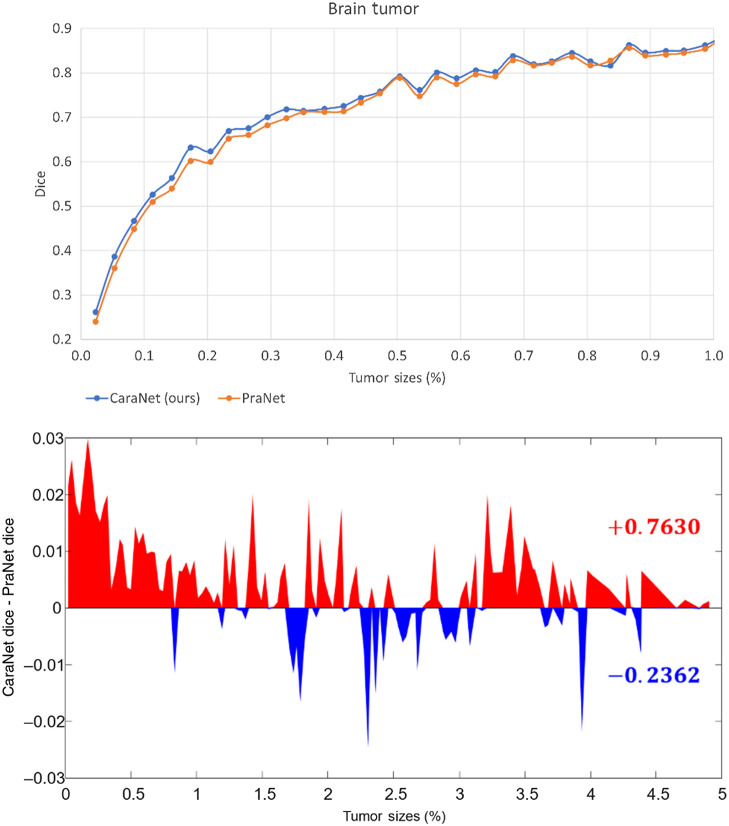
To further evaluate the effectiveness of CaraNet for small-object segmentation, we conducted another experiment using the brain tumor dataset (BraTS 2018). The polyp datasets lack extremely small objects (the minimum is about 0.11%) and do not have enough small samples (such as Kvasir and CVC-ClinicDB, in Fig. 7, which have fewer samples in the range of small sizes). The brain tumor dataset was created from the BraTS 2018 database by slicing 2D images from the T1ce source with “NET” type labels. We randomly select 60% of the images as the training set and the remainder as the testing dataset. Altogether, 3231 images with proportions of tumor sizes ranging from 0.01% – 4.91% were in the testing dataset. Table 3 and Figs. 8 and 9 show the comparison result. We compared CaraNet with only PraNet for the same reason stated above. Clearly, our CaraNet performed better, especially for the extremely small cases ranging from 0.01% to 0.1% in Fig. 8. The red area indicates that the Dice value of CaraNet is greater than that of PraNet, and blue area shows the opposite. Values on the right show the summations of all red and blue differential values.
Table 3.
Quantitative results on brain tumor (BraTS 2018) dataset.
| Methods | Mean Dice | Mean IoU | MAE | |||
|---|---|---|---|---|---|---|
| CaraNet (ours) | 0.631 | 0.507 | 0.629 | 0.786 | 0.927 | 0.003 |
| PraNet (MICCAI’20) | 0.619 | 0.494 | 0.606 | 0.776 | 0.920 | 0.003 |
Note: Bold values represent best performance.
Fig. 8.
Performance versus size on the brain tumor datasets. The x-axis is the proportion size (%) of the tumor. Upper figure: the -axis is the mean Dice coefficient results of our CaraNet and PraNet. For the very small tumor sizes (), almost all results of CaraNet are better than PraNet. Lower figure: the -axis is the difference between the averaged mean Dice coefficient results of CaraNet and PraNet. Red indicates that the Dice value of CaraNet is greater than that of PraNet; blue shows the opposite.
Fig. 9.
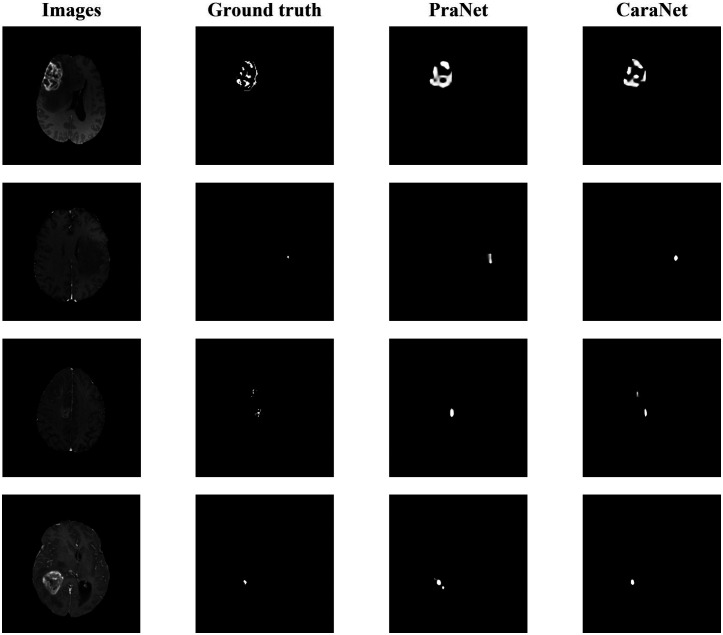
Brain tumor segmentation results.
3.6. Ablation study
To search the best dilation rate for our CFP module, we set up experiments and choose different dilation rates from 0 to 32. The performance of CaraNet with different dilation rates is tested on the Kvasir testing set as given in Table 4. When we choose small dilation rates such as 0 and 4, the dilations rates for each channel are and . The CFP module focuses on local information but ignores the global one; thus, the accuracy is about 1% lower than the best one. When large dilation rates such as 16 and 32 are chosen, the dilation rates for each channel are and . Only one channel focuses on local features, which is unreasonable for small medical object detection. When we choose a fairish dilation rate such as 8 in which , the weights of local and global information can be balanced and the best performance is achieved.
We further conduct ablation studies to demonstrate the effectiveness of our proposed CFP module and A-RA module on five public endoscopy segmentation datasets, and we choose the same six measurement metrics as in Sec. 3.4 for evaluation.
We first conduct an experiment to evaluate CaraNet without the CFP module. As given in Table 5, the performance without the CFP module drops sharply on the five public datasets. In particular, the mDice achieves about 8% reduction on the ETIS dataset, which strongly verifies that the CFP module can effectively detect local-to-global features due to the various sizes of its receptive field. Then, we evaluate the CaraNet without either the CFP module or the A-RA module. The mDice continued to decrease about 2% to 3%, indicating that our A-RA module enables CaraNet to accurately distinguish true polyp tissues.
Table 5.
Ablation study for CaraNet on Kvasir, CVC-ClinicDB, CVC-ColonDB, ETIS, and CVC-T (test dataset of EndoScene). Note: mDice: mean Dice; mIoU: mean IoU; : weighted dice; : structural measurement;46 : enhanced alignment;45 and MAE: mean absolute error. ↑ denotes that higher is better, and ↓ denotes that lower is better.
| Dataset | CFP | A-RA | mDice ↑ | mIoU ↑ | ↑ | ↑ | ↑ | MAE ↓ |
|---|---|---|---|---|---|---|---|---|
| Kvasir | × | × | 0.870 | 0.798 | 0.836 | 0.899 | 0.938 | 0.043 |
| × | ✓ | 0.888 | 0.830 | 0.878 | 0.911 | 0.940 | 0.032 | |
| ✓ | ✓ | 0.918 | 0.865 | 0.909 | 0.929 | 0.968 | 0.023 | |
| CVC-ClinicDB | × | × | 0.862 | 0.789 | 0.841 | 0.908 | 0.949 | 0.021 |
| × | ✓ | 0.887 | 0.830 | 0.874 | 0.928 | 0.966 | 0.012 | |
| ✓ | ✓ | 0.936 | 0.887 | 0.931 | 0.954 | 0.991 | 0.007 | |
| ColonDB | × | × | 0.681 | 0.586 | 0.595 | 0.797 | 0.865 | 0.063 |
| × | ✓ | 0.707 | 0.636 | 0.689 | 0.815 | 0.867 | 0.048 | |
| ✓ | ✓ | 0.773 | 0.689 | 0.729 | 0.853 | 0.902 | 0.042 | |
| ETIS | × | × | 0.646 | 0.570 | 0.587 | 0.790 | 0.833 | 0.055 |
| × | ✓ | 0.662 | 0.580 | 0.604 | 0.805 | 0.869 | 0.032 | |
| ✓ | ✓ | 0.747 | 0.672 | 0.709 | 0.868 | 0.894 | 0.017 | |
| CVC-T | × | × | 0.839 | 0.765 | 0.802 | 0.909 | 0.943 | 0.022 |
| × | ✓ | 0.870 | 0.803 | 0.839 | 0.917 | 0.965 | 0.009 | |
| ✓ | ✓ | 0.903 | 0.838 | 0.887 | 0.940 | 0.989 | 0.007 |
Note: Bold values represent best performance.
4. Discussion
We propose a novel deep-learning based segmentation model – CaraNet, by combining the A-RA and CFP modules. This new method improves the performance of the segmentation of small medical objects. Through the experiments, we show that CaraNet outperforms the most well-known models by a large margin overall for six measurement metrics. As shown by the polyp segmentation results, CaraNet not only produces high quality segmentation on samples of large polyps but also performs well for small and multi small-object segmentation. Figure 9 shows some results of extremely small tumor segmentation from the BraTS 2018 dataset. The advantage of the CaraNet in segmenting small single and multiple objects is evident. In addition, compared with the recent state-of-the-art network, PraNet, CaraNet provides a more precise prediction for the most challenging cases.
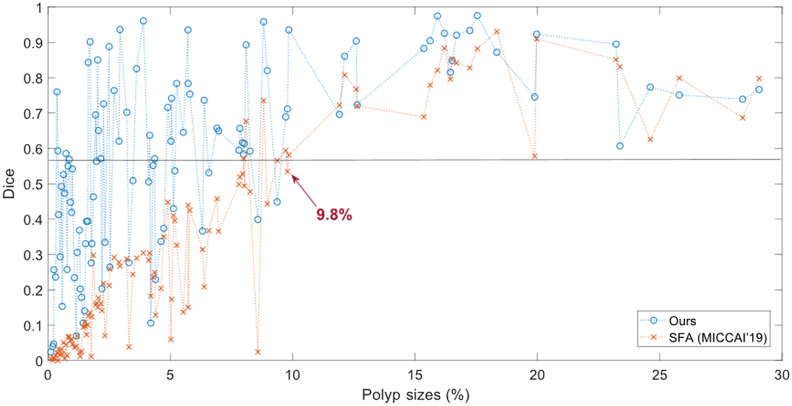
We also introduce the process to evaluate segmentation models according to the size of objects. We consider the object’s size using the size ratio including the sizes of objects and the whole image. In this study, we assume that the size ratios of “small objects” are . However, the definition of small objects is not specified. Because few studies have fully considered the sizes of objects and the small-object problems in medical imaging, we could further study this question in future work. Preliminarily, the small size (watershed) could be defined by the performance versus size curves. Figure 10 shows an example on the ETIS datasets. The watershed of small size could be defined at 9.8%. After that point, the performance generally increase/change slower and is more stable. The definition of small area may depend on datasets, segmentation models, and object shapes, but if these conditions are fixed, it is feasible to make fair comparisons. The definition of a small area discussed here may not be perfect, but it is worth paying attention to the model’s performance on small size cases in addition to the whole dataset. Figure 10 also indicates that the overall performance of segmentation depends on size ranges. If we remove the small size cases, the overall performance will be greatly improved.
Fig. 10.
Performance versus size on the ETIS datasets. The -axis is the proportion size (%) of polyp; the -axis is the mean Dice coefficient. Blue is for our CaraNet, and orange is for the SFA model. Unlike Fig. 7, it shows the results of all sizes.
Although CaraNet achieves good improvement on medical image segmentation tasks, there are still some limitations and potentials to optimize the model. For example, using bilinear interpolation to up-sample feature maps cannot prevent the loss of some useful information, leading to a coarse boundary. It can be improved by applying a deconvolutional layer. In addition, the backbone of CaraNet is pre-trained on ImageNet, which contains natural images that are very different from medical images. Moreover, the sliced brain MRI data also cause a loss of spatial information between the voxels, which may influence the accuracy of small tumor detection. In our future work, we will use the Model Genesis47 as a 3D backbone to replace the Res2Net (2D backbone) and adjust the CaraNet to employ it on 3D medical imaging segmentation to build a 3D version CaraNet for more accurate CT or MRI image segmentation. Segmentation of 3D medical images is of growing interest; we believe CaraNet will address this problem successfully.
5. Conclusions
We have proposed a neural network, CaraNet, for small medical object segmentation. We used a partial decoder to roughly localize polyp position, improve the adaptability of the CaraNet to detect different sizes objects using a CFP module, and finally refine the polyp segmentation by an A-RA module. From the overall segmentation accuracy, we found that CaraNet outperformed all state-of-the-art approaches by at least 2% (mean dice accuracy). For the early diagnosis dataset (ETIS), which contains many small polyps, however, CaraNet reached 74.7% mean dice accuracy, which was about 12% higher than PraNet. For the extremely small object segmentation dataset (BraTS 2018), CaraNet achieved 3% higher than PraNet. When evaluating segmentation models according to the size of objects, CaraNet outperformed PraNet for small objects in all six datasets that we used. In addition to the average accuracy through the whole dataset, evaluating/comparing segmentation models according to sizes of objects could show more characteristics of models, especially their performance on small areas. And this method can find or verify models that are good for small object segmentation.
Biographies
Ange Lou received his MS degree in electrical engineering from George Washington University in 2019. Currently, he is pursuing a PhD in electrical engineering at Vanderbilt University under Dr Jack Noble’s supervision. His research interests include medical image analysis, computer vision, and deep learning.
Shuyue Guan received his MS degree and PhD in computer science from George Washington University in 2016 and 2022. Currently, he is a visiting scientist in FDA. His research interests include silico medical AI, image segmentation synthesis, data separability measure, and learnability for deep learning models.
Murray Loew is Chair and Professor of Biomedical Engineering at George Washington University. His current research interests include imaging, registration, mosaicking, and analysis of images of paintings.
Disclosures
No conflicts of interest.
Contributor Information
Ange Lou, Email: ange.lou@vanderbilt.edu.
Shuyue Guan, Email: frankshuyueguan@gwu.edu.
Murray Loew, Email: loew@gwu.edu.
Code Availability
The code is available at GitHub: https://github.com/AngeLouCN/CaraNet
References
- 1.Ronneberger O., Fischer P., Brox T., “U-Net: convolutional networks for biomedical image segmentation,” Lect. Notes Comput. Sci. 9351, 234–241 (2015). 10.1007/978-3-319-24574-4_28 [DOI] [Google Scholar]
- 2.Zhou Z., et al. , “UNet++: a nested u-net architecture for medical image segmentation,” Lect. Notes Comput. Sci. 11045, 3–11 (2018). 10.1007/978-3-030-00889-5_1 [DOI] [PMC free article] [PubMed] [Google Scholar]
- 3.Jha D., et al. , “ResuNet++: an advanced architecture for medical image segmentation,” in IEEE Int. Symp. Multimedia (ISM), IEEE, pp. 225–2255 (2019). 10.1109/ISM46123.2019.00049 [DOI] [Google Scholar]
- 4.Fan D. P., et al. , “PraNet: parallel reverse attention network for polyp segmentation,” Lect. Notes Comput. Sci. 12266, 263–273 (2020). 10.1007/978-3-030-59725-2_26 [DOI] [Google Scholar]
- 5.Menze B. H., et al. , “The multimodal brain tumor image segmentation benchmark (BRATS),” IEEE Trans. Med. Imaging, 34(10), 1993–2024 (2014). 10.1109/TMI.2014.2377694 [DOI] [PMC free article] [PubMed] [Google Scholar]
- 6.Bakas S., et al. , “Advancing the cancer genome atlas glioma MRI collections with expert segmentation labels and radiomic features,” Nat. Sci. Data 4, 170117 (2017). 10.1038/sdata.2017.117 [DOI] [PMC free article] [PubMed] [Google Scholar]
- 7.Bakas S., et al. , “Identifying the best machine learning algorithms for brain tumor segmentation, progression assessment, and overall survival prediction in the BRATS challenge,” arXiv:1811.02629 (2018).
- 8.Heller N., et al. , “The kits19 challenge data: 300 kidney tumor cases with clinical context, CT semantic segmentations, and surgical outcomes,” arXiv:1904.00445 (2019).
- 9.Roth H., et al. , “Rapid artificial intelligence solutions in a pandemic-the COVID-19–20 lung CT lesion segmentation challenge,” (2021) [DOI] [PMC free article] [PubMed]
- 10.An P., et al. , “CT images in Covid-19 [Data set],” Cancer Imaging Arch. (2020). [Google Scholar]
- 11.He K., et al. , “Deep residual learning for image recognition,” in Proc. IEEE Conf. Comput. Vision and Pattern Recognit., pp. 770–778 (2016). 10.1109/CVPR.2016.90 [DOI] [Google Scholar]
- 12.Xie S., et al. , “Aggregated residual transformations for deep neural networks,” in Proc. IEEE Conf. Comput. Vision and Pattern Recognit., pp. 1492–1500 (2017). 10.1109/CVPR.2017.634 [DOI] [Google Scholar]
- 13.Huang G., et al. , “Densely connected convolutional networks,” in Proc. IEEE Conf. Comput. Vision and Pattern Recognit., pp. 4700–4708 (2017). [Google Scholar]
- 14.Szegedy C., et al. , “Going deeper with convolutions,” in Proc. IEEE Conf. Comput. Vision and Pattern Recognit., pp. 1–9 (2015). 10.1109/CVPR.2015.7298594 [DOI] [Google Scholar]
- 15.Zhao H., et al. , “Pyramid scene parsing network,” in Proc. IEEE Conf. Comput. Vision and Pattern Recognit., pp. 2881–2890 (2017). [Google Scholar]
- 16.Chen C., et al. , “Rethinking atrous convolution for semantic image segmentation liang-chieh,” IEEE Trans. Pattern Anal. Mach. Intell. 5 (2018). [DOI] [PubMed] [Google Scholar]
- 17.Hesamian M. H., et al. , “Deep learning techniques for medical image segmentation: achievements and challenges,” J. Digital Imaging 32(4), 582–596 (2019). 10.1007/s10278-019-00227-x [DOI] [PMC free article] [PubMed] [Google Scholar]
- 18.Ngo D. K., et al. , “Multi-task learning for small brain tumor segmentation from MRI,” Appl. Sci. 10(21), 7790 (2020). 10.3390/app10217790 [DOI] [Google Scholar]
- 19.Taghanaki S. A., et al. , “Deep semantic segmentation of natural and medical images: a review,” Artif. Intell. Rev. 54(1), 137–178 (2021). 10.1007/s10462-020-09854-1 [DOI] [Google Scholar]
- 20.Vaswani A., et al. , “Attention is all you need,” in Adv. Neural Inf. Process. Syst., pp. 5998–6008 (2017). [Google Scholar]
- 21.Kolesnikov A., et al. , “An image is worth 16 × 16 words: transformers for image recognition at scale,” arXiv:2010.11929 (2021).
- 22.Valanarasu M. J., et al. , “Medical transformer: gated axial-attention for medical image segmentation,” in Int. Conf. Medical Image Computing and Computer-Assisted Intervention, Strasbourg, France, Springer, pp. 36–46 (2021). [Google Scholar]
- 23.Chen J., et al. , “Transunet: transformers make strong encoders for medical image segmentation,” arXiv:2102.04306 (2021).
- 24.Xie Y., et al. , “Cotr: Efficiently bridging cnn and transformer for 3d medical image segmentation,” in Int. Conf. Medical Image Computing and Computer-Assisted Intervention, Strasbourg, France, Springer, pp. 171–180 (2021). [Google Scholar]
- 25.Long J., Shelhamer E., Darrell T., “Fully convolutional networks for semantic segmentation,” in Proc. IEEE Conf. Comput. Vision and Pattern Recognit., pp. 3431–3440 (2015). [DOI] [PubMed] [Google Scholar]
- 26.Dahl G. E., et al. , “Context-dependent pre-trained deep neural networks for large-vocabulary speech recognition,” IEEE Trans. Audio Speech Lang. Process. 20(1), 30–42 (2011). 10.1109/TASL.2011.2134090 [DOI] [Google Scholar]
- 27.Deng J., et al. , “ImageNet: a large-scale hierarchical image database,” in IEEE Conf. Comput. Vision and Pattern Recognit. (CVPR), pp. 248–255 (2009). 10.1109/CVPR.2009.5206848 [DOI] [Google Scholar]
- 28.Gao S., et al. , “Res2Net: a new multi-scale backbone architecture,” IEEE Trans. Pattern Anal. Mach. Intell. 43(2), 652–662 (2019). [DOI] [PubMed] [Google Scholar]
- 29.Wu Z., Su L., Huang Q., “Cascaded partial decoder for fast and accurate salient object detection,” in Proc. IEEE/CVF Conf. Comput. Vision and Pattern Recognit., pp. 3907–3916 (2019). 10.1109/CVPR.2019.00403 [DOI] [Google Scholar]
- 30.Lin T. Y., et al. , “Feature pyramid networks for object detection,” in Proc. IEEE Conf. Comput. Vision and Pattern Recognit., pp. 2117–2125 (2017). [Google Scholar]
- 31.Lou A., Loew M., “Cfpnet: channel-wise feature pyramid for real-time semantic segmentation,” in IEEE Int. Conf. Image Processing (ICIP), pp. 1894–1898 (2021). [Google Scholar]
- 32.Lou A., Guan S., Loew M., “CFPNet-M: a light-weight encoder-decoder based network for multimodal biomedical image real-time segmentation,” Comput. Biol. Med., 106579 (2023). [DOI] [PubMed] [Google Scholar]
- 33.Mehta S., et al. , “ESPNet: efficient spatial pyramid of dilated convolutions for semantic segmentation,” in Proc. Eur. Conf. Comput. Vision (ECCV), pp. 552–568 (2018). [Google Scholar]
- 34.Wang H., et al. , “Axial-DeepLab: stand-alone axial-attention for panoptic segmentation,” Lect. Notes Comput. Sci. 12349, 108–126 (2020. 10.1007/978-3-030-58548-8_7 [DOI] [Google Scholar]
- 35.Chen S., et al. , “Reverse attention for salient object detection,” in Proc. Eur. Conf. Comput. Vision (ECCV), pp. 234–250 (2018). [Google Scholar]
- 36.Silva J., et al. , “Toward embedded detection of polyps in WCE images for early diagnosis of colorectal cancer,” Int. J. Comput. Assist. Radiol. Surg. 9(2), 283–293 (2014). 10.1007/s11548-013-0926-3 [DOI] [PubMed] [Google Scholar]
- 37.Bernal J., et al. , “WM-DOVA maps for accurate polyp highlighting in colonoscopy: validation vs. saliency maps from physicians,” Comput. Med. Imaging Graphics 43, 99–111 (2015). 10.1016/j.compmedimag.2015.02.007 [DOI] [PubMed] [Google Scholar]
- 38.Tajbakhsh N., Gurudu S. R., Liang J., “Automated polyp detection in colonoscopy videos using shape and context information,” IEEE Trans. Med. Imaging 35(2), 630–644 (2015). 10.1109/TMI.2015.2487997 [DOI] [PubMed] [Google Scholar]
- 39.Vázquez D., et al. , “A benchmark for endoluminal scene segmentation of colonoscopy images,” J. Healthc. Eng. 2017, 4037190 (2017). 10.1155/2017/4037190 [DOI] [PMC free article] [PubMed] [Google Scholar]
- 40.Jha D., et al. , “Kvasir-SEG: a segmented polyp dataset,” Lect. Notes Comput. Sci. 11962, 451–462 (2020). 10.1007/978-3-030-37734-2_37 [DOI] [Google Scholar]
- 41.Zhang Z., Liu Q., Wang Y., “Road extraction by deep residual U-Net,” IEEE Geosci. Remote Sens. Lett. 15(5), 749–753 (2018). 10.1109/LGRS.2018.2802944 [DOI] [Google Scholar]
- 42.Fang Y., et al. , “Selective feature aggregation network with area-boundary constraints for polyp segmentation,” Lect. Notes Comput. Sci. 11764, 302–310 (2019). 10.1007/978-3-030-32239-7_34 [DOI] [Google Scholar]
- 43.Nguyen T. C., et al. , “CCBANet: cascading context and balancing attention for polyp segmentation,” Lect. Notes Comput. Sci. 12901, 633–643 (2021. 10.1007/978-3-030-87193-2_60 [DOI] [Google Scholar]
- 44.Lin A., et al. , “DS-TransUNet: dual swin transformer U-Net for medical image segmentation,” IEEE Trans. Instrum. Meas. 71, 1–15 (2022). [Google Scholar]
- 45.Fan D. P., et al. , “Enhanced-alignment measure for binary foreground map evaluation,” in Proc. 27th Int. Joint Conf. Artif. Intell., pp. 698–704 (2018). [Google Scholar]
- 46.Fan D. P., et al. , “Structure-measure: a new way to evaluate foreground maps,” in Proc. IEEE Int. Conf. Comput. Vision, pp. 4548–4557 (2017). [Google Scholar]
- 47.Zhou Z., et al. , “Models genesis,” Med. Image Anal. 67, 101840 (2021). 10.1016/j.media.2020.101840 [DOI] [PMC free article] [PubMed] [Google Scholar]


