An official website of the United States government
Here's how you know
Official websites use .gov
A
.gov website belongs to an official
government organization in the United States.
Secure .gov websites use HTTPS
A lock (
) or https:// means you've safely
connected to the .gov website. Share sensitive
information only on official, secure websites.
As a library, NLM provides access to scientific literature. Inclusion in an NLM database does not imply endorsement of, or agreement with,
the contents by NLM or the National Institutes of Health.
Learn more:
PMC Disclaimer
|
PMC Copyright Notice
This is an open access article distributed under the terms of the Creative Commons Attribution Licence, which permits unrestricted use, distribution, and reproduction in any medium, provided the original work is properly cited.
We have revised the manuscript taking helpful comments and suggestions from two reviewers into account, as detailed in our response to those reviewers, which can be found on the F1000 website. In particular: (1). We have expanded the Introduction by including a new opening paragraph that places our study in context and cites relevant literature. We have also a new paragraph that states the motivation of our study. In total, we cite seven additional papers. (2). We have made minor changes to the Methods section to explain how our parameterisation is related to single-rater reliability and to the Spearman-Brown equation for the reliability based upon multiple raters, and have specified how quantities of the normal distribution are computed in the statistical package R. We have defined the correlation on the underlying and observed scoring scales. We have clarified that for our theoretical calculations, the variance due to assessor (as a random effect) is also noise. (3). We have added three new paragraphs in the Discussion about our assumptions of normality and how non-normally distributed scores, which are theoretically less tractable, could be investigated. We have added discussion on why assessors do not always score the same even if the category descriptors are well-defined and given examples. We have added a paragraph that the difference between Pearson and Spearman (rank) correlation will not change the conclusions from our study. We end with a take-home message concluding paragraph. (4). We have updated our R script, added more comments to the code and expanded the Readme file. The github link remains unchanged but the updated version of the Zenodo link is available at https://doi.org/10.5281/zenodo.7519164
Abstract
In this study we quantify the accuracy of scoring the quality of research grants using a finite set of distinct categories (1, 2, …., k), when the unobserved grant score is a continuous random variable comprising a true quality score and measurement error, both normally distributed. We vary the number of categories, the number of assessors that score the same grant and a signal-to-noise ratio parameter. We show that the loss of information of scoring a small number of categories (k > 5) compared to scoring on a continuous scale is very small, so that increasing the number of scoring categories is unlikely to lead to an improvement in the outcomes of scoring systems. In addition, we model the effect of grant assessors scoring too close to the mean and show that this results in only a very small reduction in the accuracy of scoring.
Keywords: grant scoring, multiple threshold model, grant quality, grant ranking
Introduction
The peer review process for grant proposals is bureaucratic, costly and unreliable (
Independent Review of Research Bureaucracy Interim Report, 2022;
Guthrie
et al., 2013,
2018). Empirical analyses on grant scoring shows that single-rater reliability is typically in the range of 0.2 to 0.5 (
Marsh
et al., 2008;
Guthrie
et al., 2018). For example, in a recent study of preliminary overall scores from 7,471 review on 2,566 grant applications from the National Institutes of Health (NIH), the authors used a mixed effects model to estimate fixed effects and variance components (
Erosheva
et al., 2020). From their results (model 1, Table 4), the proportion of total variance that is attributed to PI (Principal Investigator) was 0.27. This metric is also an estimate of the single-rater reliability and is consistent with the range reported in the literature (
Marsh
et al., 2008;
Guthrie
et al., 2018). Improvements in reliability of grant scoring are desirable because funding decisions are based upon the ranking of grant proposals.
Grant funding bodies use different ways to obtain a final ranking of grant proposals. The number of items that are scored can vary, as well as the scale on which each item is scored and the weighting scheme to combine the individual items scores into a single overall score. In attempts to decrease bureaucracy or increase efficiency and reliability, grant funding bodies can make changes to the peer review process (
Guthrie
et al., 2013). One such change is the way assessors score items or overall scores of individual grant proposals. In our study we address one particular element of grant scoring, which is the scale of scoring. Our motivation is that any change in the scale of scoring should be evidence-based and that changes to grant scores that are not evidence-based can increase bureaucracy without improving outcomes.
Scoring scales differ widely among grant funding bodies. For example, in Australia, the National Health and Medical Research Council (NHMRC) uses a scale of 1-7 whereas the Australian Research Council (ARC) uses 1-5 (A:E), and other funding bodies use scales such as 1-10. One question for the funding bodies, grant applicants and grant assessors is whether using a different scale would lead to more accurate outcomes. For example, if the NHMRC would allow half-scores (e.g., 5.5), expanding the scale to 13 categories (1, 1.5, …, 6.5, 7), or the ARC would expand to 1-10, then might that lead to a better ranking of grants? This is the question we address in this note. Specially, we address two questions that are relevant for grant scoring: (1) how much information is lost when scoring in discrete categories compared to scoring on a scale that is continuous; and (2) what is the effect of the scale of scoring on the accuracy of the ranking of grants?
Methods
To quantify the effect of grant scoring scale on scoring accuracy, a model of the unknown true distribution of grant quality has to be assumed, as well as the distribution of errors in scoring the quality of a grant. We assume a simple model where an
unobserved underlying score (
u) is continuous (so no discrete categories) and the error (
e) is randomly distributed around the true quality (
q) of the grant and that there is no correlation between the true quality of the grant and the error,
with
u
i the score of grant
i on the underlying continuous scale,
q
i its quality value on that scale and
e
i a random deviation (error). Furthermore, we assume that
q and
e are normally distributed around zero and, without losing generality, that the variance of
u is 1. Hence, σ
2u = σ
2q + σ
2e = 1. We denote the signal-to-noise ratio as s = σ
2q/ (σ
2q + σ
2e), which is a value between zero and one. This parameter is sometimes called the single-rater reliability (e.g.,
Marsh
et al., 2008). Note that adding a mean to model and/or changing the total variance of
u will not change subsequent results. This continuous scale is never observed unless the scoring system would allow full continuous scoring. A close approximation of this scale would be if the scoring scale were to be continuous in the range of, for example, 1-100. In summary, we propose a simple signal (
q) + noise (
e) model on an underlying scale which is continuous. Note that in principle this model could be extended by adding a random effect for assessor (e.g.,
Erosheva
et al., 2020), but that for our model derivations and results the variance due to assessor would also appears as noise.
We now define the way in which the grants are actually scored by assessors. Assume that there are k mutually exclusive categories (e.g., k = 7) which correspond to (k-1) fixed thresholds on the underlying scale and k discontinuities on the observed (
Y) scale. We also assume that the scores on the
Y-scale are linear and symmetrically distributed, so for an even number of categories, there will be a threshold on the
u-scale located at zero (formally, if there are k categories then threshold t
k/2 = 0). This is an example of a multiple threshold model. In the extreme case of k = 2 (assessors can only score 1 or 2), the threshold on the underlying
u-scale is 0 and when
u < 0 then the observed score
Y = 1 and when
u > 0 then the observed score
Y = 2. The mean on the observed scale in this model is simply (k + 1)/2.
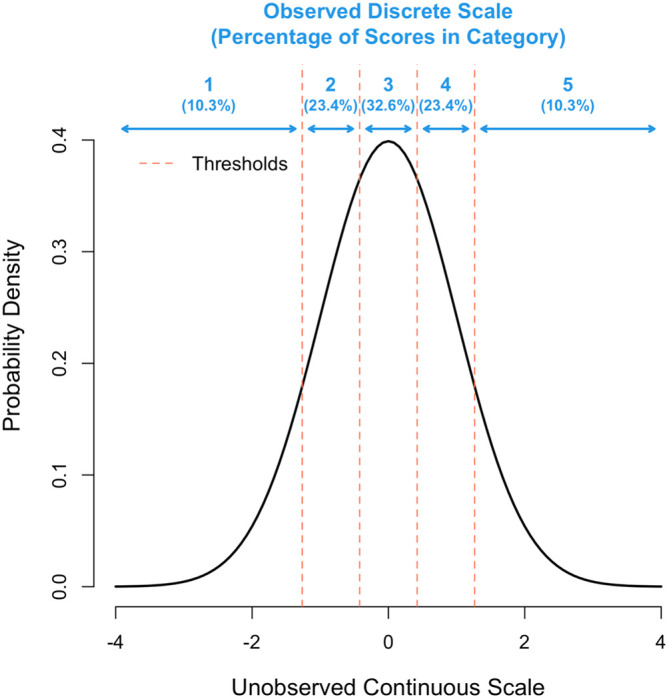
In summary, we assume that the actual observed score is a response in one of several mutually exclusive categories (1, 2, …, k), which arise from an unobserved underlying continuous scale. For a given number of categories (k), the (k-1) thresholds were determined numerically to maximise the correlation between the observed Y-scale and the unobserved continuous u-scale, while fixing the inter-threshold spacing on the u-scale to be constant. Per definition, this correlation is equal to cov(u,Y)/√(var(u)var(Y)), where both the covariance and the variance of Y depend on the position of the thresholds. Fixing the inter-threshold spacing ensures symmetry on the observed Y-scale and appears to be the optimal solution in that it gave identical results to a general optimisation of the thresholds (results not shown).
Figure 1 gives a schematic for k = 5. To get the thresholds requires a numerical optimisation, which was done through a purpose-written program using the statistical software package R version 4.2.0 (see Software availability section). The question on the loss of information by using a finite versus continuous (infinite) scoring scale was addressed by calculating the correlation between
Y (observed) and u (continuous) with increasing values of k from 1 to 100. For a given set of thresholds t
i and assuming that the variance on the underlying scale (
u) is 1, this correlation (R
k) was calculated as,
[1]
with
z
i (i = 1, … k-1) the height of the normal curve pertaining to threshold
t
i, and var(
Y) the variance of the observed scores, which is calculated from the proportions
p
i (i = 1, …,k) of scores that fall into category
i, which in turn follow from the thresholds
t
i. In the notation of software package R, z = dnorm(t) and,
pi = pnorm(
ti) – pnorm(
ti-1).
[2]
Figure 1. Representation of the multiple threshold model for k = 5 categories.
The x-axis shows the unobserved continuous scale in standard deviation units and the y-axis the density. The position of each of the 4 thresholds is shown as a vertical red line.
The expression for the correlation between the observed and underlying scale under the multiple threshold model is known from the genetics literature (
Gianola, 1979). The square of the correlation in
Equation [1] is the proportion of variation on the continuous scale that is captured by the discrete scale. For k = 2,
t1 = 0,
z1 = 0.3989,
p1 =
p2 = ½,
Y1 = 1 and
Y2 = 2, giving var(
Y) = ¼ and R
2 ~ √0.637 = 0.798. This is a known result for a threshold model with two equal categories, where the binary scale captures 63.7% of the variation on the continuous scale (
Dempster and Lerner, 1950).
To address the question on the effect of scoring on the ranking of grants we need to estimate the signal-to-noise ratio of the Y-scale and u-scale. Thresholds models with two random effects on the underlying scale have been studied in the genetic literature (e.g.,
Dempster and Lerner, 1950;
Gianola, 1979;
Gianola and Norton, 1981).
Gianola (1979) also deals with the case where the errors (
e) are exponentially distributed, but this distribution was not considered here.
When the observed scores are 1, 2, …, k,
Gianola (1979) showed that the ratio of signal-to-noise on the observed Y-scale and unobserved u-scale is R
k2, the square of the correlation in
Equation [1]. Therefore, the ratio of signal-to-noise parameters (R
k2) does not depend on the signal-to-noise value on the underlying scale (s) itself. However, the effect of scaling on the ranking of grants does depend on the signal-to-ratio effects, and to address this question we need to also specify the number of assessors (m). Given m (e.g., m = 4, 5, 6), the correlation (
Corr) between the true score of a grant (
q
i) and the mean score from m assessors on the
u-scale or
Y-scale can be shown to be,
On the continuous (u) scale, the square of this correlation is also known as the reliability of the mean rating from m raters (assessors) and can be calculated from the single-rater reliability using the equivalent Spearman-Brown equation (
Marsh
et al., 2008).
Finally, we can express the loss of information in ranking grants when m assessor score on the
Y-scale instead of on the continuous scale as,
[3]
Equations [1] and
[3] can also be used to compare different values for k against each other. For example k = 7 versus k = 13 can be compared by calculating R
7/R
13 and L(m,13,s)/L(m,7,s).
Grant assessors might not use the entire scale that is available to them or score too few grants in the extreme categories (categories 1 and k, respectively). The effect of such a scoring approach is to change the proportions in each of the k categories and thereby change the variance on the Y-scale and the covariance between the
u and
Y variables. These changes lead to a lower correlation between
Y and
u than given by
Equation [1] and, consequently, reduce the ranking accuracy of grants. We simulated this scenario by using the same model as before, but now assuming that the proportions of scores in each category follow from a normal distribution with smaller variance (σ
2us) than the variance of 1 which is assumed to be the true unobserved variance (when σ
2us = σ
2u = 1). When σ
2us < 1, this model leads to more scores around the mean and fewer in the tails (the lowest and highest category).
Results
We first quantify the correlation between the observed categorical score (
Y) and the underlying continuous score (
u), as a function of the number of categories.
Figure 2 shows the results from
Equation [1], for k = 2 to 100. It shows there is very little loss of information when the number of categories is five or more. For example, the correlation is 0.958, 0.976, 0.987 and 0.992, for k = 5, 7, 10 and 13, respectively. The association between the correlation and the number of categories can be approximated by the simple equation, R(k) ≈ 1 – 0.7k
-1.7, which fits almost perfectly.
Figure 2. Correlation between the observed categorical score and the underlying continuous score.
The x-axis is the number of discrete categorical scores (k) and the y-axis shows the correlation between the observed categorical score (Y) and the underlying continuous score (u). The red horizontal line denotes a correlation of 0.95.
Given the correlations in
Figure 2 we calculated the correlation between the true quality of a grant (
q) and the mean score on the categorical scale from m assessors.
Figure 3 shows the results from
Equation [3], for m = 3,4,5,6; k = 5,7,10,13; and s from 0.1 to 0.9. It shows that that loss of information on the correlation between true quality of the grant and its mean assessor score is very small – typically 2% or less.
Figure 3. Loss of information relative to scoring on a continuous scale.
Each panel shows the loss of information (
Equation [3]) when scoring a finite number of categories relative to the continuous score, as a function of the number of assessors (panels a to d) and the proportion of variation in scores due to the quality of the grant (x-axis).
We next explored the scenario where grant assessors do not sufficiently use the entire scale available to them, by simulating σ
2us < 1, which leads to a deficiency of scores in the tails of the distribution. For example, the proportion of scores for k = 5 in categories 1-5 (
Figure 1) are 10.3%, 23.4%, 32.6%, 23.4% and 10.3%, respectively, when the distribution underlying scores has a variance of σ
2us = 1, but 3.7%, 23.9%, 44.8%, 23.9% and 3.7% when that variance is σ
2us = 0.5. In this extreme scenario, the proportions in the tails are nearly 3-fold (10.3/3.7) lower than they should be yet decreasing σ
2us from 1 to 0.5 induces only a small reduction of R
k from 0.958 to 0.944.
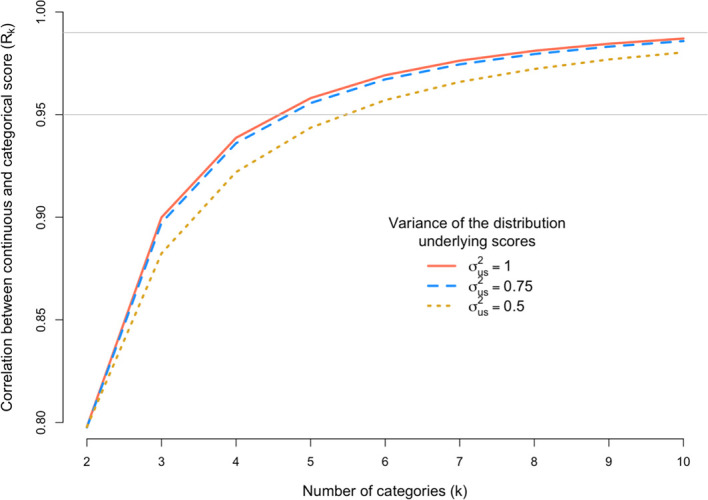
Figure 4 shows R
k for a scoring scale with 2 to 10 categories when the variance of underlying distribution is σ
2us = 0.5, 0.75 or 1.
Figure 4. Loss of information induced by scoring too few grants in extreme categories.
The x-axis is the number of discrete categorical scores (k) and the y-axis shows the correlation (R
k) between the observed categorical score (Y) and the underlying continuous score (u). The correlation R
k is calculated under three scenarios defined by the variance (σ
2s) of the distribution of underlying scores. The grey horizontal line denotes a correlation of 0.95 or 0.99.
Discussion
It is known from the grant peer review literature that scoring reliability is low (
Marsh
et al., 2008;
Guthrie
et al., 2018) and, therefore that the precision of estimating the “true” value of a grant proposal is low unless a very large number of assessors are used (
Kaplan
et al., 2008). Training researchers in scoring grants may improve accuracy (
Sattler
et al., 2015) but there will always be variation between assessors. For example, the Australian NHMRC has multiple pages of detailed category descriptors, yet assessors do not always agree. One source of variability is the discrete scale of scoring. If the true value of a grant proposal is, say, 5.5 on a 1-7 integer scale then some assessors may score a 5 while others may score a 6. Other sources of differences between assessors could involve genuine subjective differences in opinion about the “significance” and “innovation” of a proposal. To avoid the aforementioned hypothetical situation of the true value being midway between discrete scores one could change the scale.
Intuitively one might think that scoring with a broader scale is always better, but the results herein show that this can be misleading. Above k = 5 categories there is a very small gain in the signal-to-noise ratio compared to a fully continuous scale, and the effect on the accuracy of the ranking of grants is even smaller.
Comparing k = 5 with k = 10 categories and k = 7 with k = 13 categories shows a theoretical gain of 3% (0.987/0.958) and 1.6% (0.992/0.976) in the correlation between observed and continuous scales (
Figure 2). These very small gains predicted by doubling the number of categories scored will have to be balanced with the cost of changing the grant scoring systems.
The effect of ranking grants on their quality is even smaller.
Figure 3 shows that, for most existing Australian grant scoring schemes, the loss in accuracy of scoring a grant using discrete categories compared to a truly continuous scale is trivial – nearly always less than 1%. As shown in the methods section, the squared correlation between the true quality of a grant and the average score from m assessors is m/(m + λ
Y), with λ
Y = (1-R
k2s)/(R
k2s). Since R
k2 is close to 1 (
Figure 2), the squared correlation is approximately equal to m/[m + (1-s)/s], which is the reliability based upon m assessors and equivalent to the Spearman-Brown equation. Therefore, even if the signal-to-noise ratio parameter s is as low as, say, 1/3, the squared correlation between the true quality and the mean assessor score is m/(m + 2), or 3/5, 2/3 and 5/7 for m = 3, 4 and 5, respectively, hence correlations ranging from 0.77 to 0.85.
The results in
Figure 4 are to mimic a situation where assessors score too closely to the mean. As expected, R
k decreases when fewer grants are scored in the tails of the distribution of categories. However, the loss of information is generally very small. For example, for k = 7 and the most extreme case considered (σ
2us = 0.5), R
k = 0.966, which is only slightly lower than 0.976, which is the correlation when the distribution of assessor scores is consistent with the underlying true distribution with variance of 1.
We have necessarily made a number of simplifying assumptions, but they could be relaxed in principle, for example different statistical distributions of the quality of the grant and the errors could be used, including distributions that are skewed. We have also assumed no systematic bias in scorers so that the true quality value of a grant on the observed scale is the mean value from a very large number of independent scorers. Departures from these assumptions will require additional assumptions and more parameters to model and will require extensive computer simulations because the results won’t be as theoretically tractable and generalisable as herein. However, assuming a multiple threshold model with normally distributed random effects on an underlying scale is simple and flexible and likely both robust and sufficient to address questions of the scale of grant scoring.
Throughout this study we have used the Pearson correlation to quantify the correlation between the score on the underlying and observed scales. We could also have used the Spearman rank correlation, but the conclusions would not change. In fact, the Spearman rank correlations are even larger than the Pearson correlations and they converge at k = 10 categories (results not shown).
The main take-home message from our study for grant funding agencies is to consider changing the scoring scale only when there is strong evidence to support it. Unnecessary changes will increase bureaucracy and cost. From the empirical literature it seems clear that the main source of variation in grant scoring is due to measurement error (noise) and that reliability is best improved by increasing the number of assessors.
Data availability
The data underlying Figures 1-3 are generated automatically by the provided R scripts.
The authors would like to thank Adrian Barnett for helpful discussions and for the prompt.
Funding Statement
PMV and LY acknowledge grant support from the Australian Research Council. We confirm that funding bodies had no role in study design, analysis, decision to publish, or preparation of the manuscript.
The funders had no role in study design, data collection and analysis, decision to publish, or preparation of the manuscript.
[version 2; peer review: 2 approved]
References
Dempster ER, Lerner IM:
Heritability of threshold characters.
Genetics.
1950;35:212–236.
10.1093/genetics/35.2.212
[DOI] [PMC free article] [PubMed] [Google Scholar]
Erosheva EA, Grant S, Chen MC, et al. :
NIH peer review: Criterion scores completely account for racial disparities in overall impact scores.
Sci. Adv.
2020;6(23):eaaz4868.
10.1126/sciadv.aaz4868
[DOI] [PMC free article] [PubMed] [Google Scholar]
Guthrie S, Ghiga I, Wooding S:
What do we know about grant peer review in the health sciences?
F1000Res.
2018;6:1335.
10.12688/f1000research.11917.2
[DOI] [PMC free article] [PubMed] [Google Scholar]
Guthrie S, Guérin B, Wu H, et al. :
Alternatives to peer review in research project funding. Santa Monica: RAND Corporation.
2013. [Google Scholar]
Kaplan D, Lacetera N, Kaplan C:
Sample size and precision in NIH peer review.
PLoS One.
2008;3(7):e2761.
10.1371/journal.pone.0002761
[DOI] [PMC free article] [PubMed] [Google Scholar]
Marsh HW, Jayasinghe UW, Bond NW:
Improving the peer-review process for grant applications: Reliability, validity, bias, and generalizability.
Am. Psychol.
2008;63(3):160–168.
10.1037/0003-066X.63.3.160
[DOI] [PubMed] [Google Scholar]
Sattler DN, McKnight PE, Naney L, et al. :
Grant Peer Review: Improving Inter-Rater Reliability with Training.
PLoS One.
2015;10(6):e0130450.
10.1371/journal.pone.0130450
[DOI] [PMC free article] [PubMed] [Google Scholar]
1Center for Reproducible Science and Department of Biostatistics at the Epidemiology, Biostatistics and Prevention Institute (EPBI), University of Zurich, Zurich, Switzerland
1Center for Reproducible Science and Department of Biostatistics at the Epidemiology, Biostatistics and Prevention Institute (EPBI), University of Zurich, Zurich, Switzerland
Competing interests: No competing interests were disclosed.
This is an open access peer review report distributed under the terms of the Creative Commons Attribution Licence, which permits unrestricted use, distribution, and reproduction in any medium, provided the original work is properly cited.
In their revision, the authors addressed all my comments. The introduction and motivation was extended, more details were added into the methods section and the discussion was adapted.
I have a couple of very minor comments that could, but do not have to be addressed:
p.4., end of first paragraph: change sentence "Note that in principle this model could be extended by adding a random effect for assessor (e.g., Erosheva et al., 2020), but that for our model derivations and results the variance due to assessor would also appears as noise." to "Note that in principle this model could be extended by adding a random effect for [the] assessor (e.g., Erosheva et al., 2020), but [in] our model derivations and results the variance due to [the] assessor would also appear[] as noise."
Isn't z_i simply the t_i-quantile of the standard normal distribution?
The "(results not shown)" at the end of the manuscript could probably be changed into a "(find analysis in R-script on github)". Meaning that since you performed the analysis, you could also push it to goit.
The list in the github readme does not compile, making it hard to read.
Is the rationale for developing the new method (or application) clearly explained?
Partly
Is the description of the method technically sound?
Yes
Are the conclusions about the method and its performance adequately supported by the findings presented in the article?
Yes
If any results are presented, are all the source data underlying the results available to ensure full reproducibility?
Yes
Are sufficient details provided to allow replication of the method development and its use by others?
Partly
Reviewer Expertise:
Statistics, Grant peer review, Research evaluation
I confirm that I have read this submission and believe that I have an appropriate level of expertise to confirm that it is of an acceptable scientific standard.
1National Institute for Health Research (NIHR) Collaboration for Applied Health Research and Care (CLAHRC) Wessex, University of Southampton, Southampton, UK
1National Institute for Health Research (NIHR) Collaboration for Applied Health Research and Care (CLAHRC) Wessex, University of Southampton, Southampton, UK
Competing interests: No competing interests were disclosed.
This is an open access peer review report distributed under the terms of the Creative Commons Attribution Licence, which permits unrestricted use, distribution, and reproduction in any medium, provided the original work is properly cited.
I would like to thank the authors for addressing the feedback in the revision process. Changes made to the article following the suggestions listed in the review have satisfactorily resolved all queries.
Findings and take away message provide important evidence to funding organisations when changes to application and funding processes are designed. Consideration of unintended consequences in terms of increased bureaucracy and cost when making changes to scoring scales is highly relevant in current research practice.
Is the rationale for developing the new method (or application) clearly explained?
Partly
Is the description of the method technically sound?
Yes
Are the conclusions about the method and its performance adequately supported by the findings presented in the article?
Yes
If any results are presented, are all the source data underlying the results available to ensure full reproducibility?
Yes
Are sufficient details provided to allow replication of the method development and its use by others?
Yes
Reviewer Expertise:
Research on Research; Health services delivery research
I confirm that I have read this submission and believe that I have an appropriate level of expertise to confirm that it is of an acceptable scientific standard.
1National Institute for Health Research (NIHR) Collaboration for Applied Health Research and Care (CLAHRC) Wessex, University of Southampton, Southampton, UK
1National Institute for Health Research (NIHR) Collaboration for Applied Health Research and Care (CLAHRC) Wessex, University of Southampton, Southampton, UK
Competing interests: No competing interests were disclosed.
This is an open access peer review report distributed under the terms of the Creative Commons Attribution Licence, which permits unrestricted use, distribution, and reproduction in any medium, provided the original work is properly cited.
“
The effect of the scale of grant scoring on ranking accuracy” by Visscher and Yengo presents the work of a novel approach to understand the effect of scoring categories/scales (and assessors) on the loss of information/loss in accuracy of grant scoring. The authors developed a multiple threshold model with normally distributed random effects on an underlying scale and showed that doubling the number of categories used to score grant applications does not change the scoring accuracy (as defined by authors), highlighting the importance of assessing the cost of changing grant scoring systems against the benefit it adds to scoring. The authors also studied the correlation between observed categorical scores and continuous scores (as a function of the number of categories) reporting very little loss of information when the number of categories was five or more.
Overall strengths:
Method and data availability: Providing the code to run the analysis reported in this paper is commendable. In doing this, the authors are supporting the principles of research openness and transparency that strengthens science and enhance its value to academia and society. It is a great example of the contribution of meta-research.
Clarity of results: The authors provide a clear description of the main findings of their analysis in a succinct and informative way.
Contribution from conclusions presented: In light of recent work (
e.g., Independent Review of Research Bureaucracy Interim Report
https://assets.publishing.service.gov.uk/government/uploads/system/uploads/attachment_data/file/1046070/independent-review-of-research-bureaucracy-interim-report.pdf), the work presented is timely and highly relevant. Changes to the research funding system (from application to delivery and impact) need to be evidence-based. Showing that changes to scoring criteria in funding agencies are not necessarily the solution to issues linked to research funding decisions (which the authors do not necessarily discuss in their literature) is a clear contribution to efforts aimed at reducing unnecessary research bureaucracy.
Areas for improvement:
The work described is not entirely linked to the title of the paper as there is no information on ranking accuracy except for a phrase towards the end of the discussion section: “…the true quality value of a grant on the observed scale is the mean value from a very large number of independent scorers.”
They main area to address in this work is represented in the partial response to the question: Is the rationale for developing the new method clearly explained?
Published work that reports studies exploring variation in scores touches on one of the issues that the authors are studying, i.e., what is the right number of assessors to ensure a research application is scored fairly/bias-free (through less score variability), whilst ensuring the process is efficient and viable (please see
Kaplan D, Lacetera N, Kaplan C. Sample size and precision in NIH peer review. PLoS One. 2008;3(7):e2761.
https://doi.org/10.1371/journal.pone.0002761.) This, and other related work on scores inter-reliability (e
.g., Sattler DN, McKnight PE, Naney L, Mathis R. Grant peer review: improving inter-rater reliability with training. PLoS One. 2015;10(6):e0130450.
https://doi.org/10.1371/journal.pone.0130450.S) highlight the aspect of this paper that is not presented about how this work is contributing to the efforts of enhancing decision-making in research funding. The key assumption of the authors’ model of no-systematic bias in scores provides a ‘place to start’, but the need to include variability because in reality those scenarios are more likely to be the norm leaves a gap in the contribution of the work reported.
The model proposed successfully shows that all things being equal, having 13 scoring categories does not enhance an application score, making a case for simplified scoring criteria that have the potential of reducing administrative burden. However, the value of the work will increase if the model showed similar results in the presence of systematic bias in scores.
Overall, the paper needs to provide context to how their work contributes to the issues that have been identified with research funding allocation for which innovative alternatives have been suggested (see for example
Guthrie S, Ghiga I, Wooding S. What do we know about grant peer review in the health sciences? [version 2; peer review: 2 approved]. F1000Research. 2018;6:1335; Guthrie S, Guérin B, Wu H, Ismail S, Wooding S. Alternatives to peer review in research project funding: 2013 Update. Santa Monica: RAND Corporation; 2013.
https://www.rand.org/pubs/research_reports/RR139.html.) The results reported are promising, however, without reference to the context and processes that are being targeted to improve, the value of the work is not as evident as it could be.
Is the rationale for developing the new method (or application) clearly explained?
Partly
Is the description of the method technically sound?
Yes
Are the conclusions about the method and its performance adequately supported by the findings presented in the article?
Yes
If any results are presented, are all the source data underlying the results available to ensure full reproducibility?
Yes
Are sufficient details provided to allow replication of the method development and its use by others?
Yes
Reviewer Expertise:
Research on Research; Health services delivery research
I confirm that I have read this submission and believe that I have an appropriate level of expertise to confirm that it is of an acceptable scientific standard, however I have significant reservations, as outlined above.
References
1.
:
Sample size and precision in NIH peer review.
PLoS One
.2008;3(7) :
10.1371/journal.pone.0002761
e2761
10.1371/journal.pone.0002761
[DOI] [PMC free article] [PubMed] [Google Scholar]
2.
:
Grant Peer Review: Improving Inter-Rater Reliability with Training.
PLoS One
.2015;10(6) :
10.1371/journal.pone.0130450
e0130450
10.1371/journal.pone.0130450
[DOI] [PMC free article] [PubMed] [Google Scholar]
3.
:
What do we know about grant peer review in the health sciences?.
F1000Res
.2017;6:
10.12688/f1000research.11917.2
1335
10.12688/f1000research.11917.2
[DOI] [PMC free article] [PubMed] [Google Scholar]
4.
:
Alternatives to peer review in research project funding.
Santa Monica: RAND Corporation
.2013;
Reference source
“The effect of the scale of grant scoring on ranking accuracy” by Visscher and Yengo presents the work of a novel approach to understand the effect of scoring categories/scales (and assessors) on the loss of information/loss in accuracy of grant scoring. The authors developed a multiple threshold model with normally distributed random effects on an underlying scale and showed that doubling the number of categories used to score grant applications does not change the scoring accuracy (as defined by authors), highlighting the importance of assessing the cost of changing grant scoring systems against the benefit it adds to scoring. The authors also studied the correlation between observed categorical scores and continuous scores (as a function of the number of categories) reporting very little loss of information when the number of categories was five or more.
We thank the reviewer for their time, comments and suggestions. We thank the reviewer in particular for pointing us to a number of relevant publications which was most helpful because peer review research is not our normal area of research. We have revised the manuscript taking those comments and suggestions into account.
Overall strengths:
Method and data availability: Providing the code to run the analysis reported in this paper is commendable. In doing this, the authors are supporting the principles of research openness and transparency that strengthens science and enhance its value to academia and society. It is a great example of the contribution of meta-research.
Clarity of results: The authors provide a clear description of the main findings of their analysis in a succinct and informative way.
Contribution from conclusions presented: In light of recent work (e.g., Independent Review of Research Bureaucracy Interim Report https://assets.publishing.service.gov.uk/government/uploads/system/uploads/attachment_data/file/1046070/independent-review-of-research-bureaucracy-interim-report.pdf), the work presented is timely and highly relevant. Changes to the research funding system (from application to delivery and impact) need to be evidence-based. Showing that changes to scoring criteria in funding agencies are not necessarily the solution to issues linked to research funding decisions (which the authors do not necessarily discuss in their literature) is a clear contribution to efforts aimed at reducing unnecessary research bureaucracy.
Areas for improvement:
The work described is not entirely linked to the title of the paper as there is no information on ranking accuracy except for a phrase towards the end of the discussion section: “…the true quality value of a grant on the observed scale is the mean value from a very large number of independent scorers.”
They main area to address in this work is represented in the partial response to the question: Is the rationale for developing the new method clearly explained?
Published work that reports studies exploring variation in scores touches on one of the issues that the authors are studying, i.e., what is the right number of assessors to ensure a research application is scored fairly/bias-free (through less score variability), whilst ensuring the process is efficient and viable (please see Kaplan D, Lacetera N, Kaplan C. Sample size and precision in NIH peer review. PLoS One. 2008;3(7):e2761. https://doi.org/10.1371/journal.pone.0002761.) This, and other related work on scores inter-reliability (e.g., Sattler DN, McKnight PE, Naney L, Mathis R. Grant peer review: improving inter-rater reliability with training. PLoS One. 2015;10(6):e0130450. https://doi.org/10.1371/journal.pone.0130450.S) highlight the aspect of this paper that is not presented about how this work is contributing to the efforts of enhancing decision-making in research funding. The key assumption of the authors’ model of no-systematic bias in scores provides a ‘place to start’, but the need to include variability because in reality those scenarios are more likely to be the norm leaves a gap in the contribution of the work reported.
We thank the reviewer for these references which we have now cited. We have expended on our Introduction and Discussion sections to place our study in the peer review literature. We also give our motivation for the study.
The model proposed successfully shows that all things being equal, having 13 scoring categories does not enhance an application score, making a case for simplified scoring criteria that have the potential of reducing administrative burden. However, the value of the work will increase if the model showed similar results in the presence of systematic bias in scores.
We agree with the reviewer that we have focused on precision only and not on bias. The reason is the narrow scope of our paper: what happens if, everything else being the same, the scale of scoring changes? As we now mention, our results are also relevant if there is a random effect of assessor, such that some assessors score on average lower or higher than others. Our motivation for focussing on precision is that there is strong evidence in the literature of lack of precision yet to our knowledge less evidence for systematic biases (e.g., Guthrie et al. 2018). To study systematic bias would require us to model such biases and there are many ways in which this could be done and the necessary assumptions we would need to make could of course be questioned. A full exploration of a wide range of models for bias will in our opinion require extensive computer simulations and we judged that to be outside of the scope of our study.
Overall, the paper needs to provide context to how their work contributes to the issues that have been identified with research funding allocation for which innovative alternatives have been suggested (see for example Guthrie S, Ghiga I, Wooding S. What do we know about grant peer review in the health sciences? [version 2; peer review: 2 approved]. F1000Research. 2018;6:1335; Guthrie S, Guérin B, Wu H, Ismail S, Wooding S. Alternatives to peer review in research project funding: 2013 Update. Santa Monica: RAND Corporation; 2013. https://www.rand.org/pubs/research_reports/RR139.html.) The results reported are promising, however, without reference to the context and processes that are being targeted to improve, the value of the work is not as evident as it could be.
Is the rationale for developing the new method (or application) clearly explained?
We thank the reviewer again for providing these references which we have now cited.
1Center for Reproducible Science and Department of Biostatistics at the Epidemiology, Biostatistics and Prevention Institute (EPBI), University of Zurich, Zurich, Switzerland
1Center for Reproducible Science and Department of Biostatistics at the Epidemiology, Biostatistics and Prevention Institute (EPBI), University of Zurich, Zurich, Switzerland
Competing interests: No competing interests were disclosed.
This is an open access peer review report distributed under the terms of the Creative Commons Attribution Licence, which permits unrestricted use, distribution, and reproduction in any medium, provided the original work is properly cited.
The paper by Peter Visscher and Loic Yengo addresses a crucial question for funding bodies: how large is the effect of the scoring scale on the proposal ranking accuracy. The manuscript is concise and well-written. R-code is available on github and computationally reproducible, which is wonderful! My main concern with the paper as it is currently presented, is that it is not well integrated in the literature on grant peer review (so far only three papers from Genetics, all from before 1990, are cited).
Introduction:
The introduction is a bit short and the whole paper has only three references, which are also very old. There has been a lot of research on the reliability and accuracy of grant peer review scores which the authors could at least mention.
Funding decisions are based on the rankings of grant proposals. Therefore the accuracy of the ranking of grant proposals is so important. For a general audience, less familiar with grant peer review, some more insights into the motivation of the work could be relevant.
Methods:
I applaud the authors for uploading their R-code on github, which helped me a lot in understanding of the methods. From the methods section in the paper itself it was rather hard to grasp all the details. Therefore reconsider reworking the methods section and give more details: e.g. how are p
i and z
i computed?
The ordering of the presentation of the methods could be changed to make the section more reader-friendly: for example, does the third paragraph start with explaining how the thresholds can be computed by maximising the correlation between Y and u while this correlation is only defined at the very end of the paragraph when explaining the loss of information problem.
The multiple threshold model is set in a way that most weight is on the average score (3 for a 5-point scale). From the literature on grant peer review we know however that the actual distributions are most often skewed towards higher scores (see for example the plots in doi:10.1126/sciadv.aaz4868
1). Can your multiple threshold model be updated to such a more realistic scenario?
Often in grant peer review the same experts might score more than one proposal which will affect the error structure of your normal distributions, as all scores by expert xyz are correlated with each other. Could such a scenario be included in your multiple threshold model?
Discussion:
I believe the discussion is also lacking more context. What do your results mean for funding decisions? for funding agencies?
The thresholds of the model are chosen in a way to maximise the correlation between the observed and the continuous scale. How realistic is this? Isn't it this exact subjective choice made by the reviewers which often makes grant peer review unreliable? If a 4 in a 5-point scale means the same for all reviewers (as it is the case in your model, right?), grant peer review would be almost perfectly reliable. However it is a very subjective choice. Can you comment on this? at least as a limitation in the discussion.
General Comment:
The title suggests that you are interested in ranking of grant proposals, but in the article you are actually interested in the correlations between the scoring and the true quality (!= not a rank) of the proposals. The relationship between the effects on the scoring and the subsequent ranks of proposals should be explained more clearly.
Code:
All four R-scripts for the four figures re-define the function 'CorrEquiSpaced'. It is common practice to instead write an R-script (called functions.R) with all the functions and very detailed description. All scripts could benefit from more comments, also the Readme file is not very informative.
Is the rationale for developing the new method (or application) clearly explained?
Partly
Is the description of the method technically sound?
Yes
Are the conclusions about the method and its performance adequately supported by the findings presented in the article?
Yes
If any results are presented, are all the source data underlying the results available to ensure full reproducibility?
Yes
Are sufficient details provided to allow replication of the method development and its use by others?
Partly
Reviewer Expertise:
Statistics, Grant peer review, Research evaluation
I confirm that I have read this submission and believe that I have an appropriate level of expertise to confirm that it is of an acceptable scientific standard, however I have significant reservations, as outlined above.
The paper by Peter Visscher and Loic Yengo addresses a crucial question for funding bodies: how large is the effect of the scoring scale on the proposal ranking accuracy. The manuscript is concise and well-written. R-code is available on github and computationally reproducible, which is wonderful! My main concern with the paper as it is currently presented, is that it is not well integrated in the literature on grant peer review (so far only three papers from Genetics, all from before 1990, are cited).
We thank the reviewer for their time, comments and suggestions. We thank the reviewer in particular for pointing us to a number of relevant publications which was most helpful because peer review research is not our normal area of research. We have revised the manuscript taking those comments and suggestions into account.
Introduction:
The introduction is a bit short and the whole paper has only three references, which are also very old. There has been a lot of research on the reliability and accuracy of grant peer review scores which the authors could at least mention.
We thank the reviewer for this comment and have now expanded the Introduction and have cited a number of relevant papers and reports.
Funding decisions are based on the rankings of grant proposals. Therefore the accuracy of the ranking of grant proposals is so important. For a general audience, less familiar with grant peer review, some more insights into the motivation of the work could be relevant.
We have now included a statement about the motivation.
Methods:
I applaud the authors for uploading their R-code on github, which helped me a lot in understanding of the methods. From the methods section in the paper itself it was rather hard to grasp all the details. Therefore reconsider reworking the methods section and give more details: e.g. how are pi and zi computed?
We have tweaked the Methods section and have specified how, in R, pi and zi are computed.
The ordering of the presentation of the methods could be changed to make the section more reader-friendly: for example, does the third paragraph start with explaining how the thresholds can be computed by maximising the correlation between Y and u while this correlation is only defined at the very end of the paragraph when explaining the loss of information problem.
We thank the referee for this comment. We have now added a few sentences for clarification and define the correlation earlier.
The multiple threshold model is set in a way that most weight is on the average score (3 for a 5-point scale). From the literature on grant peer review we know however that the actual distributions are most often skewed towards higher scores (see for example the plots in doi:10.1126/sciadv.aaz48681). Can your multiple threshold model be updated to such a more realistic scenario?
We thank the referee for this comment. We note that the distribution of the Overall Impact Score in Erosheva et al. 2020 (Fig2), on which the ranking is based, is much less skewed than the individual component scores and furthermore that the distribution is a mixture because two groups of grants are compared. The distribution of scores when adjusted for the fixed effect may be (even) more normal. In any case, as we mention the Discussion, in principle the effect of the scale can be investigated with other statistical distributions, for example assuming that the continuous scale is log-normal (skewed) or kurtotic. Non-normal distributions of the quality and error term will make the results less generalisable because the of thresholds will depend on the specific parameters of the chosen non-normal distribution. For example, Gianola (1979) showed that for an exponential distribution, the threshold values depend on the densities of q and e, and therefore each signal-to-noise ratio will have its own set of thresholds. A full exploration of a wide range of statistical models will in our opinion require extensive computer simulations and we judged that to be outside of the scope of our study.
Often in grant peer review the same experts might score more than one proposal which will affect the error structure of your normal distributions, as all scores by expert xyz are correlated with each other. Could such a scenario be included in your multiple threshold model?
We thank the referee for this question. For our theoretical calculations, the variance due to assessor (as a random effect) is also noise and we have clarified this in the revision. For real data analysis we agree with the reviewer that an assessor effect should be fitted (as, for example, done in Erosheva et al., Science Advances 2020), if only to quantify how much variation in scores is due to some assessors scoring systematically lower or higher than others.
Discussion:
I believe the discussion is also lacking more context. What do your results mean for funding decisions? for funding agencies?
We have now expanded the Discussion significantly.
The thresholds of the model are chosen in a way to maximise the correlation between the observed and the continuous scale. How realistic is this? Isn't it this exact subjective choice made by the reviewers which often makes grant peer review unreliable? If a 4 in a 5-point scale means the same for all reviewers (as it is the case in your model, right?), grant peer review would be almost perfectly reliable. However it is a very subjective choice. Can you comment on this? at least as a limitation in the discussion.
We thank the reviewer for this question. We agree that in the absence of measurement error (or subjective choices) the reliability of scoring would be perfect, but there is strong evidence that assessors do not always score the same even if the category descriptors are well-defined. We give examples of why assessors might score differently in the revised manuscript. The choice of our thresholds was just to make a link between a true continuous scale and the actual scale of scoring and this choice seems reasonable to us. The main assumption is that the true distribution is continuous.
General Comment:
The title suggests that you are interested in ranking of grant proposals, but in the article you are actually interested in the correlations between the scoring and the true quality (!= not a rank) of the proposals. The relationship between the effects on the scoring and the subsequent ranks of proposals should be explained more clearly.
We thank the reviewer for this point. We have now specified that our parameters are directly related to single-rater reliability and reliability based upon the mean from multiple assessors. In addition, from our simulations we compared the Spearman rank correlations to the Pearson correlations. The Spearman correlations were even larger than the Pearson correlations (Figure for referee below) and therefore re-enforce the conclusion of our study. We have added a paragraph in the Discussion: “Throughout this study we have used the Pearson correlation to quantify the correlation between the score on the underlying and observed scales. We could also have used the Spearman rank correlation, but the conclusions would not change. In fact, the Spearman rank correlations are even larger than the Pearson correlations and they converge at k = 10 categories (results not shown).”
All four R-scripts for the four figures re-define the function 'CorrEquiSpaced'. It is common practice to instead write an R-script (called functions.R) with all the functions and very detailed description. All scripts could benefit from more comments, also the Readme file is not very informative.
We thank the reviewer for this comment and have now updated our R script accordingly, added more comments to the code and expanded the Readme file. The github link remains unchanged but the updated version of the Zenodo link is available at https://doi.org/10.5281/zenodo.7519164
Associated Data
This section collects any data citations, data availability statements, or supplementary materials included in this article.
Data Availability Statement
The data underlying Figures 1-3 are generated automatically by the provided R scripts.