Abstract
Adult white adipose tissue (WAT) harbors distinct mesenchymal stromal cell subpopulations that differentially impact WAT function and plasticity. Here, we unveil the cellular landscape of the perinatal epididymal WAT (eWAT) primordium using single-cell transcriptomics in male mice. We reveal that adipocyte precursor cells (APCs) and fibro-inflammatory progenitors (FIPs) emerge as functionally distinct PDGFRβ+ subpopulations within the eWAT anlagen prior to adipocyte accrual. We further identify important molecular and functional differences between perinatal and adult FIPs, including differences in their pro-inflammatory response, adipogenic capacity, and anti-adipogenic behavior. Notably, we find that transient overexpression of Pparg in PDGFRβ+ cells only during postnatal day 0.5 to 7.5 in male mice leads to hyperplastic WAT development, durable progenitor cell reprogramming, and protection against pathologic WAT remodeling and glucose intolerance in adult-onset obesity. Thus, factors that alter the adipogenic capacity of perinatal adipose progenitors can have long-lasting effects on progenitor plasticity, tissue expandability, and metabolic health into adulthood.
Introduction
White adipocytes are specialized lipid-storing cells that evolved as a safe and efficient compartment for long term energy storage in the form of triglyceride. These cells can appear throughout the body but are generally organized into distinct tissues, or “depots,” with remarkable cellular heterogeneity. In fact, adipocytes comprise of only 20–40% of the cellular components in the tissue 1. Under homeostastic conditions, the non-parenchymal fraction of adipose tissue (termed “stromal-vascular fraction”) consists of a vast array of cell types, including immune cells, endothelial cells, mural cells, and fibroblast-like subpopulations. WAT expansion in the setting of obesity involves qualitative and quantitative changes in cellular composition of the tissue, including a shift from an anti-inflammatory phenotype to a low grade chronic pro-inflammatory state, alterations in adipocyte number and size, and extracellular matrix remodeling 2,3. Activity within the adipose tissue microenvironment is critical as these various cell types interact with adipocytes to coordinate local and systemic adaptations to changing environmental and physiological conditions 4,5. The emergence of single-cell RNA-sequencing (scRNA-seq) and single-nuclei RNA-sequencing (snRNA-seq) have greatly facilitated the derivation of several cellular atlases of the mouse and human adipose tissue microenvironment 6,7. Of particular interest has been the murine perigonadal WAT depot. The perigonadal WAT depot of male mice (epididymal WAT, or “eWAT”) is a well characterized site of immune cell residence, adipose progenitor heterogeneity, and robust tissue remodeling and expansion in obesity. As such, the eWAT depot of mice offers a model for many aspects of adipose tissue remodeling observed in human obesity.
Multiple groups have utilized scRNA-seq or snRNA-seq to unveil functionally distinct APC subpopulations in eWAT of adult mice 7–11. Computational comparisons of distinct datasets indicate that there is considerable agreement that adult murine eWAT harbors at least two predominant molecularly distinct mesenchymal progenitor cells subpopulations 7. One expresses a fibro-inflammatory gene expression profile whereas the other is enriched in the expression of Pparg, encoding the “master regulator” of adipocyte differentiation. Different studies have utilized distinct nomenclature to designate these cell subpopulations and applied different cell sorting strategies to isolate them. Our group’s prior scRNA-seq efforts identified and designated the LY6C− CD9− PDGFRβ+ subpopulation in eWAT as functional “APCs” 9. These cells, also termed “adipocyte stem cell 1” (ASC 1)” by Burl et al 8, “VmSC4/5” by Spallanzani et al 10, “FAP1/2” by Sarvari et al 11, and “mASPC1/5” by Emont et al. 7, are enriched in the expression of Pparg, encoding the “master regulator” of adipocyte differentiation, and possess robust adipogenic capacity both in vitro and in vivo 9. De novo differentiation from PDGFRβ+ APCs drives adipocyte recruitment in the setting of diet-induced obesity and ensures healthy tissue remodeling and proper lipid storage in WAT 12–14. In contrast, LY6C+ PDGFRβ+ cells represent fibro-inflammatory precursors, or “FIPs.” FIPs, termed by others as “adipocyte stem cell 2” (ASC 2)” by Burl et al 8, “VmSC1/2” by Spallanzani et al 8, “FAP3/4” by Sarvari et al 11, “CD34High” cells by Buffolo et al.15, and “mASPC2/3” by Emont et al. 7, exert strong pro-inflammatory, fibrogenic, and anti-adipogenic phenotypes 9. These cells are activated upon high-fat diet (HFD) feeding and play an important role in controlling pro-inflammatory macrophage accrual and tissue collagen deposition associated with obesity 14,16,17.
There is now considerable consensus that the APC pool in adult WAT is molecularly heterogeneous 18; however, it is unclear when functionally distinct adipose progenitor subpopulations emerge during development, where they are localized, and if/how their molecular and functional properties change over time. Here, we combined scRNA-seq, in silico cell trajectory analysis, and functional analyses in cells and genetic mouse models to define the unique functional properties of perinatal adipose progenitor subpopulations. Our results highlight the emergence of functionally distinct progenitor cell subpopulations prior to the formation of parenchymal adipocytes and reveal important molecular and functional differences between perinatal and adult progenitor cell subpopulations. Importantly, we demonstrate that transient perinatal exposure to pro-adipogenic stimuli can exert long-lasting effects on progenitor plasticity and tissue cellularity into adulthood.
Results
Stromal cell heterogeneity at the onset of eWAT development
Murine eWAT develops shortly after birth. The accumulation of lipid-laden epididymal adipocytes becomes readily apparent by approximately postnatal (P) day 7 (P7) 19,20. We visualized the eWAT anlagen by histological analysis of transverse sections of the lower abdominal/inguinal region of newborn C57BL/6 mice at P0, P3, and P7 (Fig. 1a). At P0, the presumptive eWAT depot appears as an evagination of the caput epididymis. By P3, the eWAT anlagen appears as a thin, translucent structure surrounded by a continuous mesothelial layer expressing Mesothelin (MSLN+). At P7, unilocular PLIN1+ adipocytes are readily apparent within a distinct depot that is encapsulated by the surrounding mesothelium.
Figure 1. Postnatal emergence of epididymal WAT from the Pdgfrb lineage.
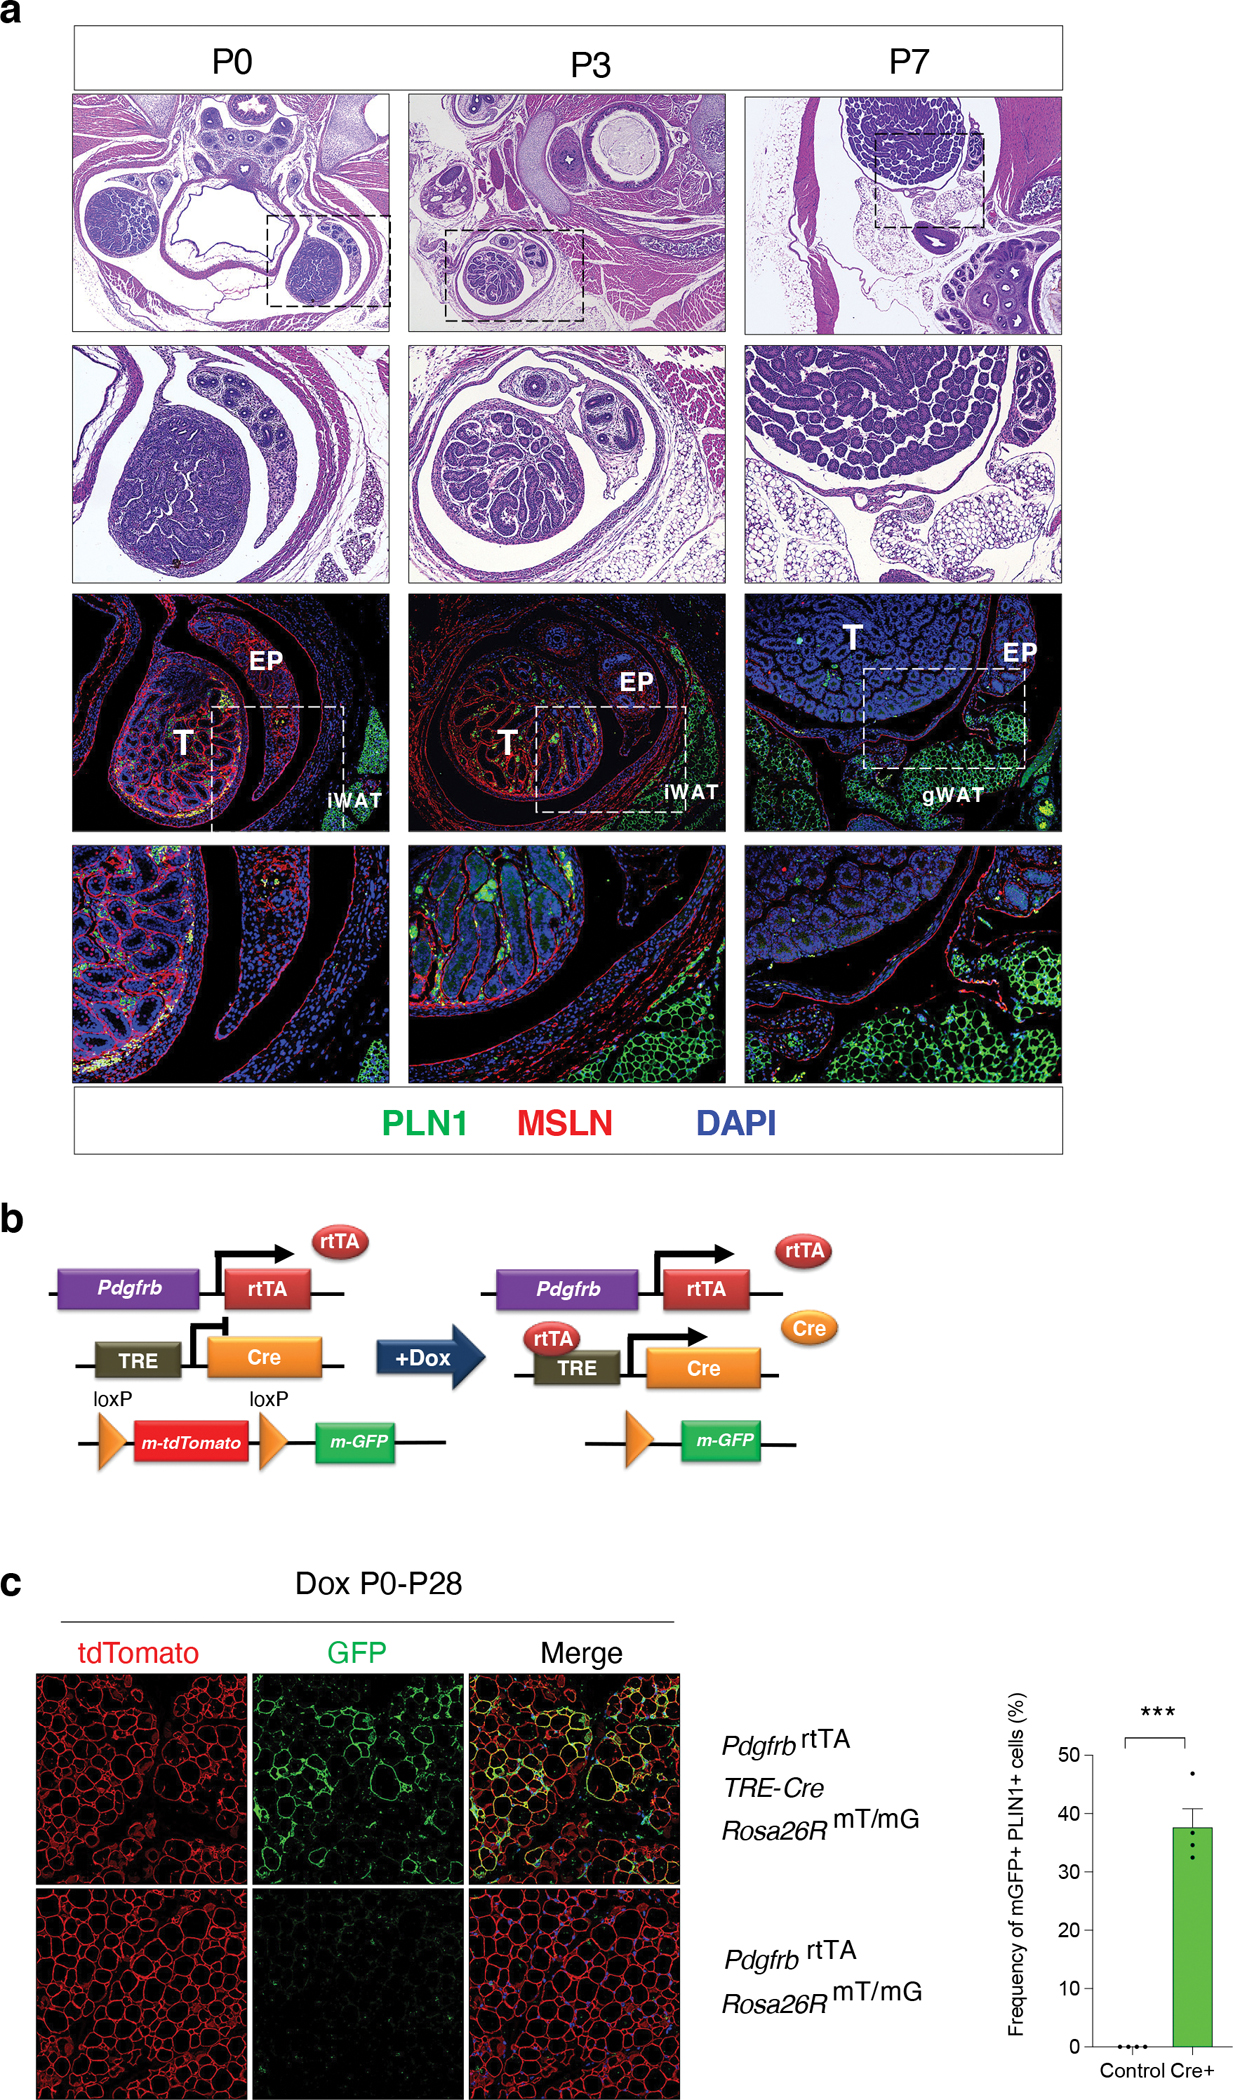
a) Histological analysis of perinatal eWAT development. Top two rows: representative H&E staining of transverse sections of the lower abdominal region of mice at postnatal (P) day 0 (P0), day 3 (P3), and day 7 (P7). First row H&E images are captured at 4x magnification. Second row H&E images are 10x magnifications of the dotted-lined boxes shown in the top row. Bottom two rows: indirect immunofluorescence (IF) assay of PLIN1 (Green) and MSLN (Red) expression within the presumptive eWAT at P0, P3, and P7. First row IF images are captured at 10x magnification. Second row IF images are 20x magnifications of the dotted-lined boxes shown directly above. EP = epididymis, T = testis, iWAT = subcutaneous inguinal WAT.
b) Genetic alleles of the “MuralChaser” lineage tracing system. In the presence of doxycycline (Dox), rtTA activates Cre expression in Pdgfrb-expressing cells. CRE excises the loxP-flanked membrane tdTomato cassette and allows constitutive activation of membrane GFP (mGFP) reporter expression in Pdgfrb-expressing cells and cells descending from this lineage.
c) (Left) Representative 20x confocal image of GFP and PLIN1 expression in P28 eWAT of Control (Cre−) or “MuralChaser” mice. Lactating mice were administrated Dox-containing chow diet from P0 to P28. (Right) Percentage of PLIN1+ adipocytes expressing GFP (GFP+). Bars represent ± SEM. *** denotes p<0.001 by student t-test. 3 independent experiments were conducted with similar results.
Exact p values and numbers of repetitions can be found in Source Data Figure 1.
In adult mice, de novo differentiation of epididymal adipocytes originates from PDGFRβ+ mesenchymal cells 21. We asked whether the initial perinatal development of epididymal adipocytes includes differentiation from Pdgfrb-expressing cells present within the observed perinatal eWAT primordium. First, we utilized our previously developed genetic lineage tracing system that enables labeling and fate-mapping of Pdgfrb-expressing cells. In WAT, Pdgfrb expression is found in mural cells (pericytes and vascular smooth muscle cells) and adventitial fibroblasts, but not differentiated adipocytes. This doxycycline-inducible “MuralChaser” model consists of the PdgfrbrtTA transgene, TRE-Cre transgene, and the CRE-dependent Rosa26RmT/mG membrane-bound GFP reporter (mGFP) allele (Fig. 1b) 21. Newborn MuralChaser pups were exposed to doxycycline from the time of birth (P0.5) until weaning (P28) through postpartum feeding of lactating mothers with doxycycline-containing chow diet (DOX-Chow). This enables permanent mGFP labeling of Pdgfrb-expressing cells in MuralChaser mice at the earliest stages of perinatal eWAT development. Upon tissue harvest at P28, we observed that ~40% of lipid-laden adipocytes expressed mGFP (Fig. 1c). These data provide evidence that epididymal adipocytes develop, at least in part, from perinatal Pdgfrb-expressing cells.
We utilized single-cell RNA-Seq (scRNA-Seq) analysis to reveal the overall cellular landscape of the stromal-vascular fraction (SVF) of the eWAT primordium and identify putative adipose progenitor subpopulations. Our earliest time point of analysis was P3, which was the earliest stage in which discernible eWAT could be reliably dissected. We also profiled the SVF of P7 eWAT, a stage when adipocytes are first readily apparent, as well as adult (P35) eWAT SVF. An integrated analysis of the three datasets identified the presence of endothelial cells, immune cells, mesenchymal stromal cells, epithelial (mesothelial) cells, and committed preadipocytes, across each stage of tissue development (Extended Data Fig. 1a–c). Upon further sub-clustering, we observed the vast array of immune cells that are known to reside within adult perigonadal WAT, including T cells, B cells, neutrophils, dendritic cells, and two main subtypes of macrophages (Perivascular macrophages and non-perivascular macrophages) (Fig. 2a; Supplementary Table 1). Remarkably, many of these hematopoietic lineage cells were present at the onset of eWAT development. Sub-clustering of the mesenchymal stromal cells (PDGFRα/β+) revealed the presence of distinct cell subpopulations in P3 and P7 eWAT that cluster together with those previously identified in adult eWAT. This includes cell types bearing the previously described molecular markers of adult APCs (e.g Agt, Apoe, Fndc5; Cluster 9) and FIPs (e.g., Ly6c1, Efhd1, Mfap5, Fn1; Cluster 1). Our analysis also identified smooth muscle cells (“SMCs”, Cluster 10) as well as a small population of mesothelial-like cells (“MLCs”; Cluster 17) expressing a mixed mesenchymal/epithelial phenotype and are distinct from the large cluster of classical mesothelial cells (Fig. 2a, b; Supplementary Table 1). Across all time points, we also observed a distinct cluster of cells expressing adipocyte lineage-selective transcripts, including Pparg, Fabp4, and low levels of Adipoq (Extended Data Figure 1c and Extended Data Figure 2a, b; Supplementary Table 1). Notably, expression of Pparg and Fabp4 increases over time within this cell cluster, suggesting that these cells likely represent committed preadipocytes and/or immature adipocytes. We also examined the expression of the previously characterized adipocyte progenitor cell marker, Dlk1 (PREF-1), in these subpopulations22. Dlk1 is expressed in APCs; however, expression was observed in all perinatal mesenchymal subpopulations we identified (Extended Data Fig. 2c). Interestingly, the expression of Dlk1 is notably different between perinatal and adult stromal cells. Levels of Dlk1 were markedly higher in all perinatal stromal cell subpopulations than observed in adult stromal cells, highlighting a significant difference between perinatal vs. adult progenitor cells in the expression of a commonly used APC marker.
Figure 2. Cellular heterogeneity of perinatal and adult eWAT.
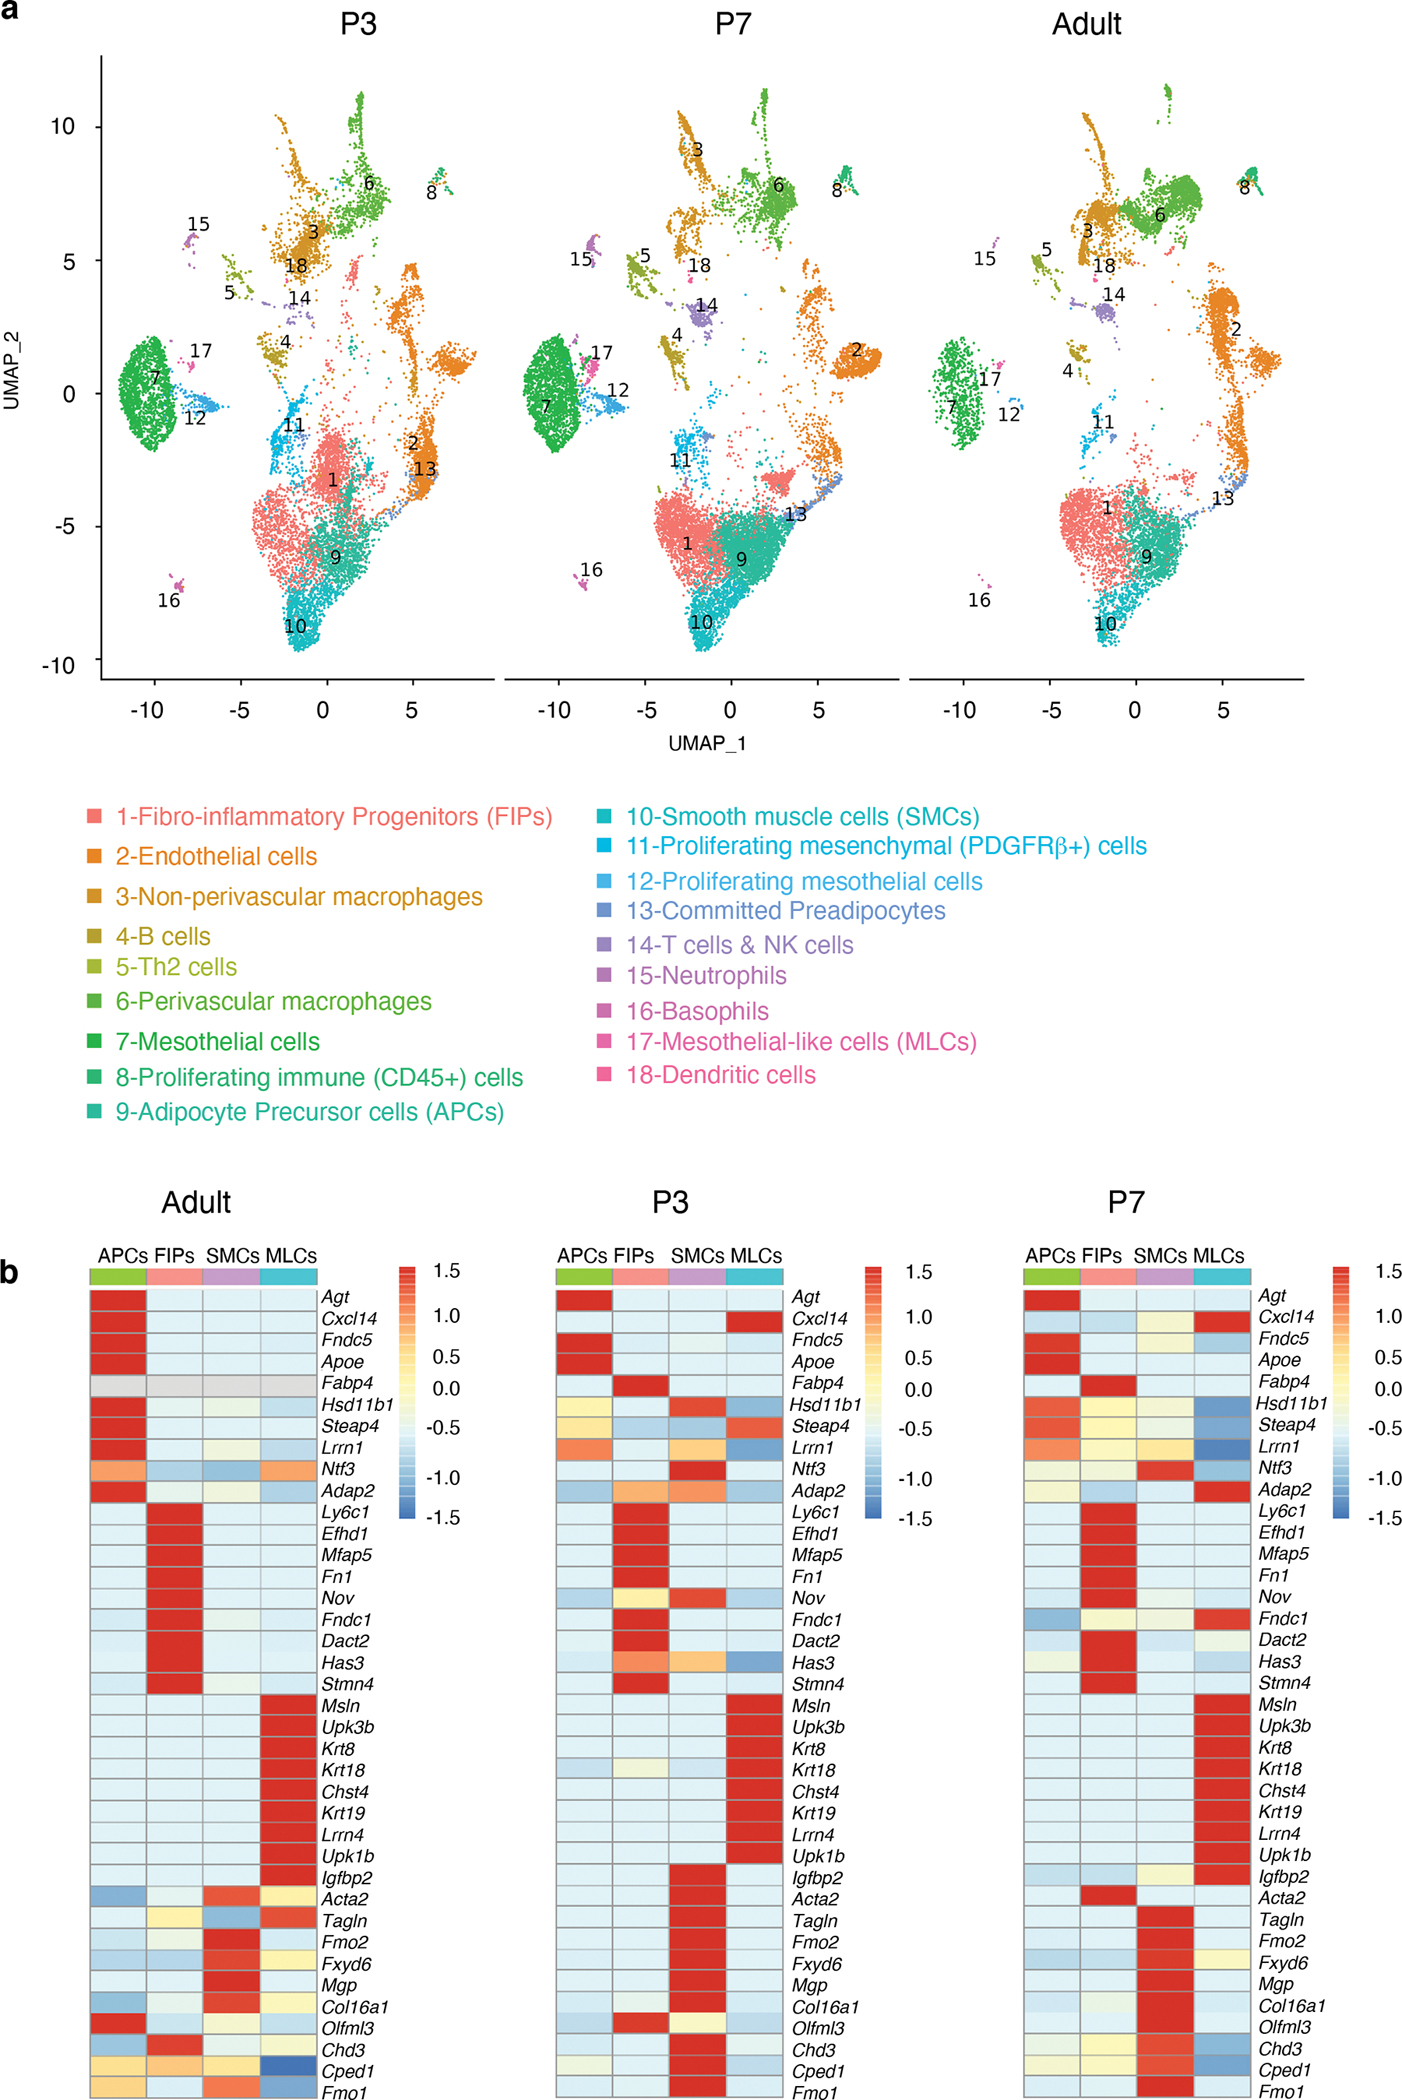
a) UMAP analyses of transcriptional profiles of eWAT stromal-vascular cells harvested at P3 (n= 11553 cells), P7 (n= 14538 cells) and 5-weeks of age (adult) (n= 10442 cells).
b) Heatmap depicting expression of 10 selected signature genes for PDGFRβ+ sub-populations: APCs (cluster 9), FIPs (cluster 1), MLCs (cluster 17) and SMCs (cluster 10). Scaled by cluster mean expression and normalized by z-score. A full list of signature genes can be found in Supplementary Table 2.
Closer inspection of the P3 and P7 datasets reveal that the respective clusters resembling adult FIPs may possess additional heterogeneity. We further analyzed the perinatal FIPs population and indeed found 3 subclusters (designated as FIPs-1, FIPs-2, and FIPs-3, respectively) (Extended Data Fig. 3a). FIPs-1 is the predominant cluster found at all stages of development analyzed. FIPs-2 was largely unique to P3 eWAT; Pathway analysis of differentially expressed genes indicates an enrichment in gene signatures associated with ribosomal biogenesis/regulation (Extended Data Fig. 3b,c). Enriched expression of these gene signatures is often associated with cell proliferation/growth 23. As such, FIPs-2 likely represents a proliferating FIPs subpopulation present at P3. FIPs-3 is unique and abundant at P7; however, a deeper analysis of the FIPs-3 gene expression profile suggest that these are low quality/profile cells 24 and thus a likely artifact.
We developed a strategy to quantify and isolate these distinct perinatal PDGFRβ+ subpopulations using FACS (Extended Data Fig. 4a, b). Perinatal APCs and FIPs both reside amongst the PDGFRβ+ CD9− fraction of CD45− CD31− (Lin−) eWAT SVF cells and can be distinguished from one another based on LY6C expression (Perinatal FIPs= PDGFRβ+ LY6C+; Perinatal APCs= PDGFRβ+ CD9− LY6C−). SMCs and MLCs are enriched in the PDGFRβ+ CD9+ fraction of Lin− SVF cells and can be distinguished by the expression of DPP4 (Perinatal SMCs= PDGFRβ+ CD9+ DPP4-; Perinatal MLCs= PDGFRβ+ CD9+ DPP4+). Gene expression analysis of subpopulation-selective genes confirmed that the sorting strategy indeed enriched for the appropriate cell population (Extended Data Fig. 4c). We performed global bulk-RNA sequencing to confirm that APCs, FIPs, MLCs, and SMCs, represent molecularly distinct subclusters of cells and to better define their molecular profiles (Supplementary Table 2). P7 cell subpopulations were isolated by FACS and lysed immediately for RNA extraction and library production. Principal component analysis and sample clustering based on global transcriptomes confirmed that these four subpopulations within perinatal eWAT are molecularly distinct, with APCs and FIPs bearing more resemblance to one another than to SMCs and MLCs (Extended Data Fig. 5a–c). We utilized Gene Set Enrichment Analysis to identify gene signatures that distinguish perinatal APCs and FIPs. Much like their adult counterparts, perinatal APCs are enriched in a gene signature of “adipogenesis,” whereas FIPs are enriched in gene signatures reflecting heightened pro-inflammatory signaling (Extended Data Fig. 5d).
Flow cytometry also allowed us to quantify the relative proportion of these cell subpopulations. At P7, APCs were the most abundant PDGFRβ+ subpopulation, followed by FIPs (Extended Data Fig. 4d). This differs from adult mice, where FIPs outnumber APCs in lean and obese eWAT 9,16. We examined the change in frequency of APCs and FIPs during eWAT development more closely using flow cytometry. At P3 and P7, ~60% of PDGFRβ+ cells can be clearly designated APCs, coinciding with the rapid accumulation of adipocytes occurring during this period. At this stage, ~20% of the pool of cells represent FIPs. In adult mice maintained on a chow diet, FIPs represents ~60% of the overall PDGFRβ+ pool, whereas APCs represent ~20% (Extended Data Fig. 4e). All together, these data establish that the molecular heterogeneity of adipose progenitors observed in adult mice emerges at the onset of eWAT development, but that the relative frequency of these cell subpopulations change during early postnatal period.
PDGFRβ+ LY6C− CD9− cells represent APCs in perinatal eWAT
In adult mice, the LY6C− CD9− fraction of PDGFRβ+ cells (termed APCs) represent the highly adipogenic subpopulation within the eWAT SVF, whereas adult LY6C+ fraction of PDGFRβ+ cells (termed FIPs) lack adipogenic potential even in the presence of strong pro-adipogenic stimuli (e.g. PPARγ agonism) 9. In silico cell trajectory analysis based on the single-cell transcriptomes predicted a direct developmental relationship between APCs and committed preadipocytes and suggested that APCs may be the only direct source of committed preadipocytes amongst these populations (Fig. 3a). We explored the adipogenic capacity of perinatal APCs and FIPs directly by testing the ability of these subpopulations to undergo adipocyte differentiation in vitro and in vivo. We isolated and maintained these PDGFRβ+ subpopulations in growth medium containing 2% FBS and 1% ITS (insulin, transferrin, selenium). These represent culture conditions that we previously established for growth and differentiation of adult eWAT PDGFRβ+ cells 9,21. Under these conditions, perinatal LY6C− CD9− PDGFRβ+ cells (APCs) underwent adipocyte differentiation at a high efficiency within 6 days of reaching confluence (Day 6 after confluence) (Fig. 3b, c). Even by the time that APCs reach confluence (Day 0), the expression of several adipocyte-selective transcripts can be readily detected (Fig. 3c). On the contrary, very few adipocytes emerged within cultures of perinatal FIPs, MLCs, or SMCs, indicating that APCs are the subpopulation most committed to the adipocyte lineage (Fig. 3b, c).
Figure 3. PDGFRβ+ LY6C− CD9− cells are the highly adipogenic subpopulation within perinatal eWAT.
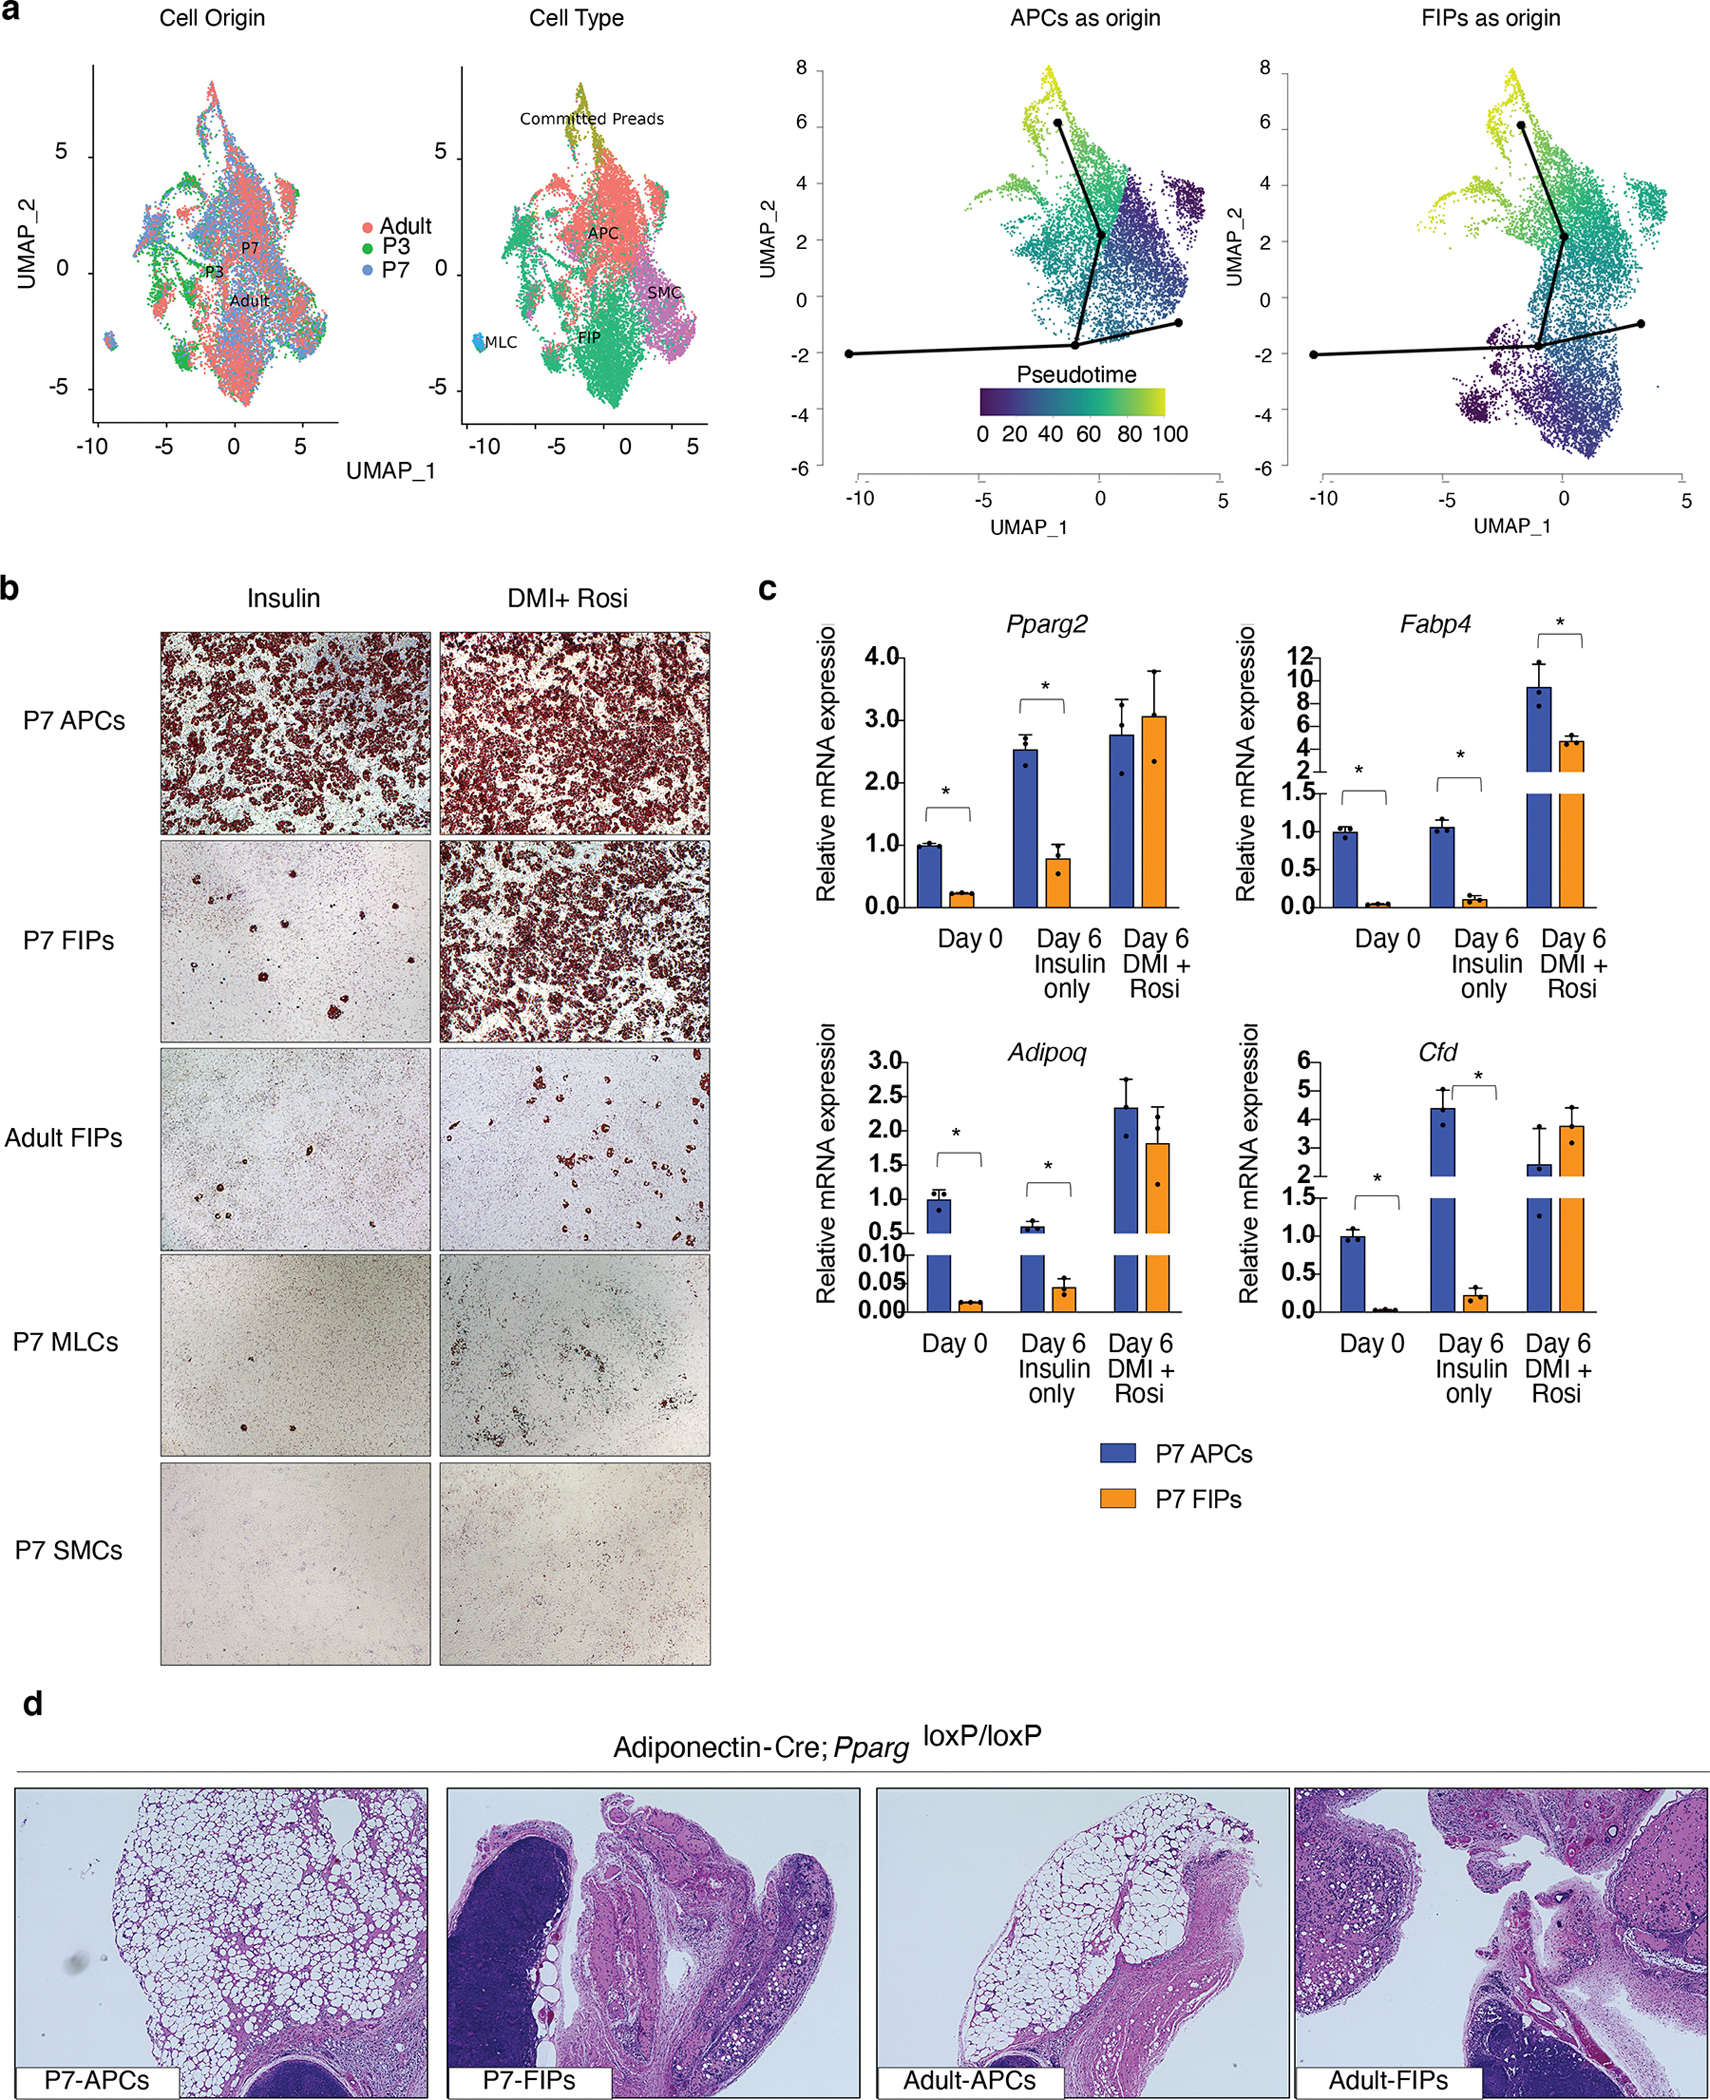
a) Cell lineage trajectory analysis using Slingshot. Committed preadipocytes (Preads), APCs, FIPs, MLCs, and SMCs from merged datasets were subclustered as input for Slingshot, indicated by panels “Cell Origin” and “Cell Type”. Committed Preads were specified as the end state, and either APCs (“APCs as origin”) or FIPs (“FIPs as origin”) was set as the root for pseudotime analysis.
b) Representative 10x magnification brightfield images of P7 APCs, P7 FIPs, Adult (5 weeks old) FIPs, P7 MLCs, and P7 SMCs, 6 days following the induction of in vitro adipocyte differentiation. Cultures are stained with oil red-O to visualize lipid accumulation.
c) mRNA levels of adipocyte-selective genes in P7 APCS and P7 FIPs at confluence (Day 0) or 6 days following the induction of in vitro adipocyte differentiation (Day 6). Bars represent ± SEM. * denotes p<0.05 by student t-test, ** denotes p<0.01, *** denotes p<0.001.
d) Representative 10x magnification image of H&E stained sections of the remnant inguinal WAT depot from lipodystrophic Adipoq-Cre, PpargloxP/loxP mice 3 weeks after transplantation of either 100,000 P7 APCs, 100,000 P7 FIPs, 100,000 Adult (5 weeks old) APCs, or 100,000 Adult FIPs. 3 independent experiments were conducted with similar results. Exact p values and numbers of repetitions can be found in Source Data Figure 3.
We also tested the abilities of these perinatal progenitor subpopulations to undergo differentiation in response to the more commonly used hormonal adipogenic cocktail (dexamethasone, IBMX, and insulin) with the addition of the PPARγ agonist, Rosiglitazone. Under these very strong pro-adipogenic conditions both perinatal APCs and FIPs can undergo differentiation with high efficiency, whereas only occasional lipid-laden adipocytes were present in cultures of MLCs or SMCs (Fig. 3b, c). The latent adipogenic potential of P7 FIPs is remarkably different from the potential of adult FIPs, which are largely refractory upon the same strong adipogenic stimuli (Fig. 3b). We also evaluated the ability of P7 and adult APCs and FIPs to undergo adipocyte differentiation upon transplantation into the remnant subcutaneous WAT depots of Adipoq-Cre; PpargloxP/loxP animals, a well-described model of lipodystrophy 25. Three weeks following cell transplantation, the WAT depot of Adipoq-Cre; PpargloxP/loxP mice injected with either adult or P7 APCs contain numerous clusters of lipid-laden fat cells (Fig. 3d). The contralateral depots of the same animals injected with either adult or P7 FIPs remained devoid of mature adipocytes. Collectively, these data indicate that the cell subpopulation we designate as APCs indeed represent the highly adipogenic subpopulation of both the developing and adult eWAT SVF. However, the in vitro differentiation studies also highlight an intrinsic difference between perinatal FIPs and adult FIPs in their lineage plasticity.
In adult eWAT, committed preadipocytes and APCs reside within small blood vessels where they take on the appearance of PDGFRβ+ mural cells (pericytes or vascular smooth muscle) 26,27. The identity of good markers to distinguish mural cells (pericytes/SMCs) vs. perivascular fibroblasts has been a topic of discussion in the field of mesenchymal stem cell biology 28. There is strong consensus that one single marker cannot be used to define mural cells 29. Instead, scRNA-seq studies in different tissues have defined mural cells based on a gene signature as well as histological localization of the cells. We examined the expression of previously reported cardinal transcripts defining pericytes vs. other fibroblasts 29. P7 APCs and adult APCs exhibited the expected pattern of pericytes or mural cells: enriched Pdgfrb, Notch3, and Mcam, and under-expression of Cd34 (Fig. 4a). We also performed indirect immunofluorescence assays to assess the localization of APCs and FIPs in perinatal eWAT. We utilized a commercially available antibody recognizing AGT (angiotensinogen), whose expression is selective to APCs (Figure 2b). We localized FIPs based on EFHD1 (EF-hand domain family D1) protein expression, whose expression is selective to FIPs (Figure 2b). In P7 eWAT, AGT expression was readily detected within blood vessels, specifically within peri-endothelial cells resembling mural cells (Fig. 4b). The expression of EFHD1 was found in both perivascular cells and cells resembling interstitial fibroblasts (Fig. 4c). Moreover, we observed the occasional EFHD1+ in association with the tissue mesothelium (Fig. 4d). These histological data provide evidence that perinatal eWAT APCs reside in the vasculature as peri-endothelial cells; however, FIPs at this stage appear more broadly distributed within the tissue.
Figure 4. Localization of APCs and FIPs in P7 eWAT.
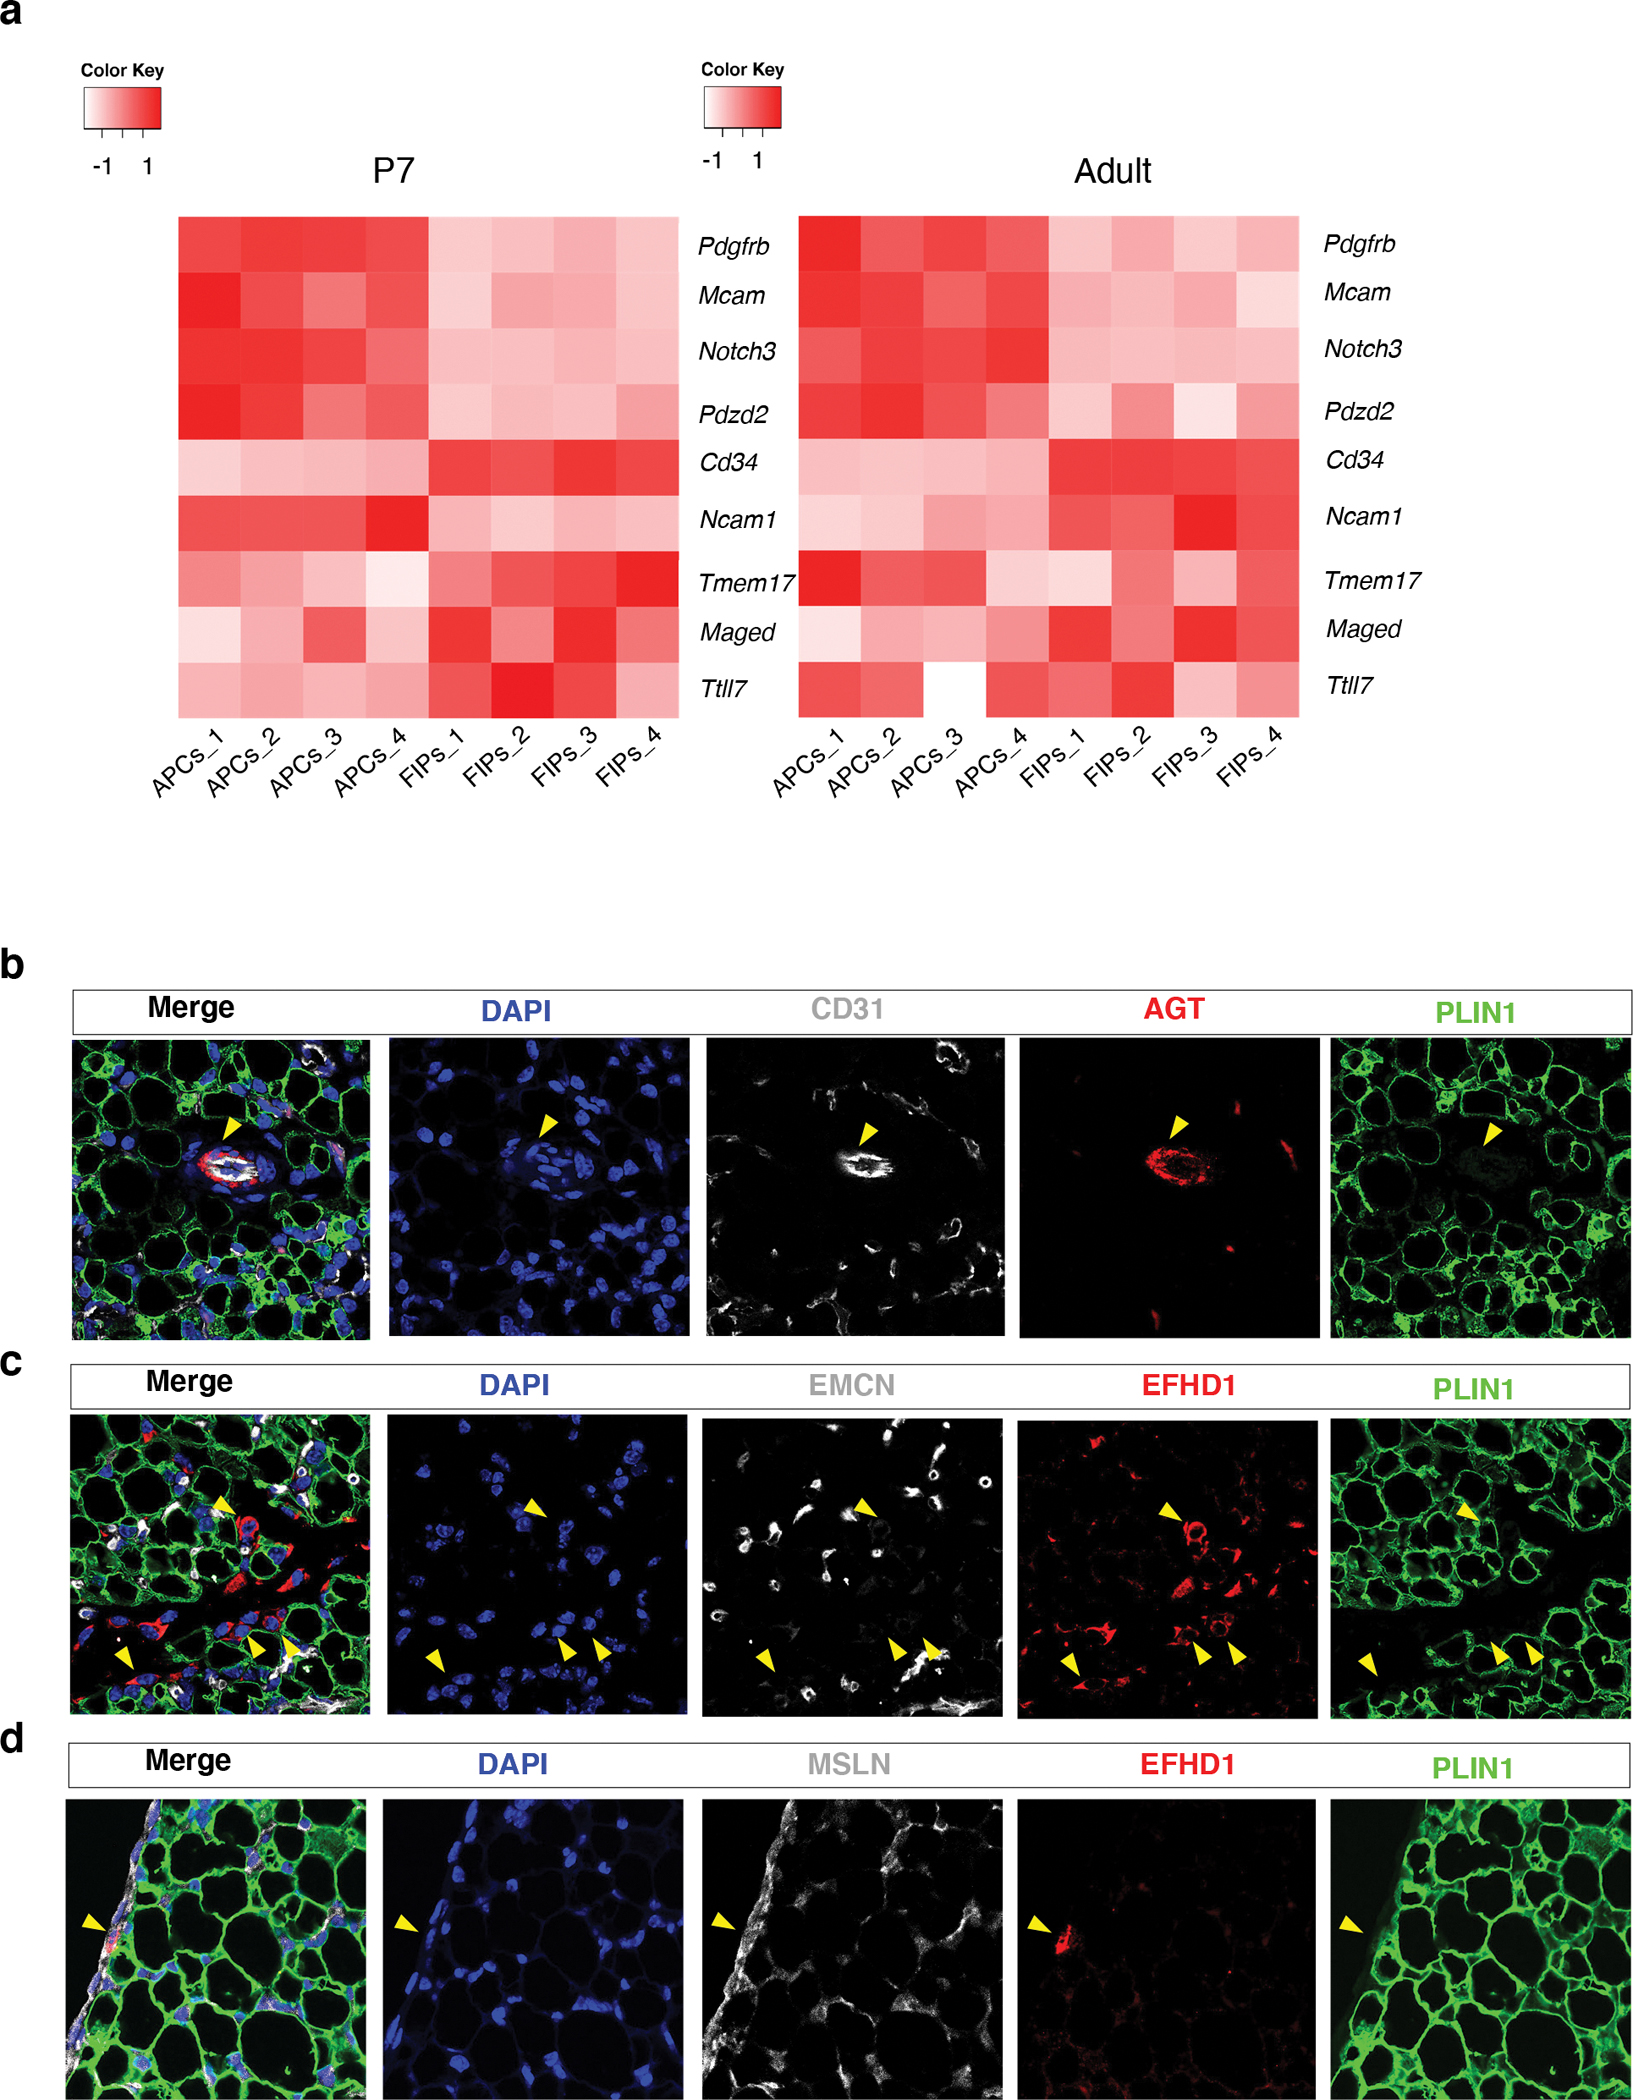
a) Heatmap depicting the expression of previously reported transcripts 29 defining pericytes vs. perivascular fibroblasts within P7 and adult APCs and FIPs. Enriched expression of Pdgfrb, Mcam, Notch3, and Pdzd2, is characteristic of pericytes, whereas enriched expression of Cd34, Ncam1, Tmem17, Maged, and Ttll7, is more charactertistic of fibroblasts 29. Expression normalized by z-score.
b) Representative 63x magnification confocal image of CD31, ANGIOTENSINOGEN (AGT), and PERILIPIN (PLIN) expression in P7 eWAT sections. Nuclei were counterstained with DAPI. 3 independent experiments were conducted with similar results.
c) Representative 63x magnification confocal image of ENDOMUCIN (EMCN), EFHD1, and PLIN, expression in P7 eWAT sections. Nuclei were counterstained with DAPI. 3 independent experiments were conducted with similar results.
d) Representative 63x magnification confocal image of MESOTHELIN (MSLN), EFHD1, and PLIN, expression in P7 eWAT sections. Nuclei were counterstained with DAPI. 3 independent experiments were conducted with similar results.
Distinct functional properties of perinatal and adult FIPs
A notable feature of adult FIPs is their capacity to block adipocyte differentiation from APCs through the production of paracrine factors. Given the difference between perinatal and adult FIPs in their abilities to undergo in vitro differentiation under strong adipogenic conditions, we asked whether these two populations also differed in their anti-adipogenic potential. As previously reported, adult APCs exposed to conditioned media from adult FIPs fail to undergo adipogenesis (Fig. 5a) 9. On the other hand, adult APCs exposed to conditioned media from parallel cultures of APCs maintain their adipogenic potential (Fig. 5a). Remarkably, APCs exposed to conditioned media from perinatal FIPs also maintain nearly their full adipogenic potential (Fig. 5a). This indicates that perinatal FIPs are not anti-adipogenic, in contrast to their adult counterparts.
Figure 5. Perinatal FIPs are less anti-adipogenic and pro-inflammatory than adult FIPs.
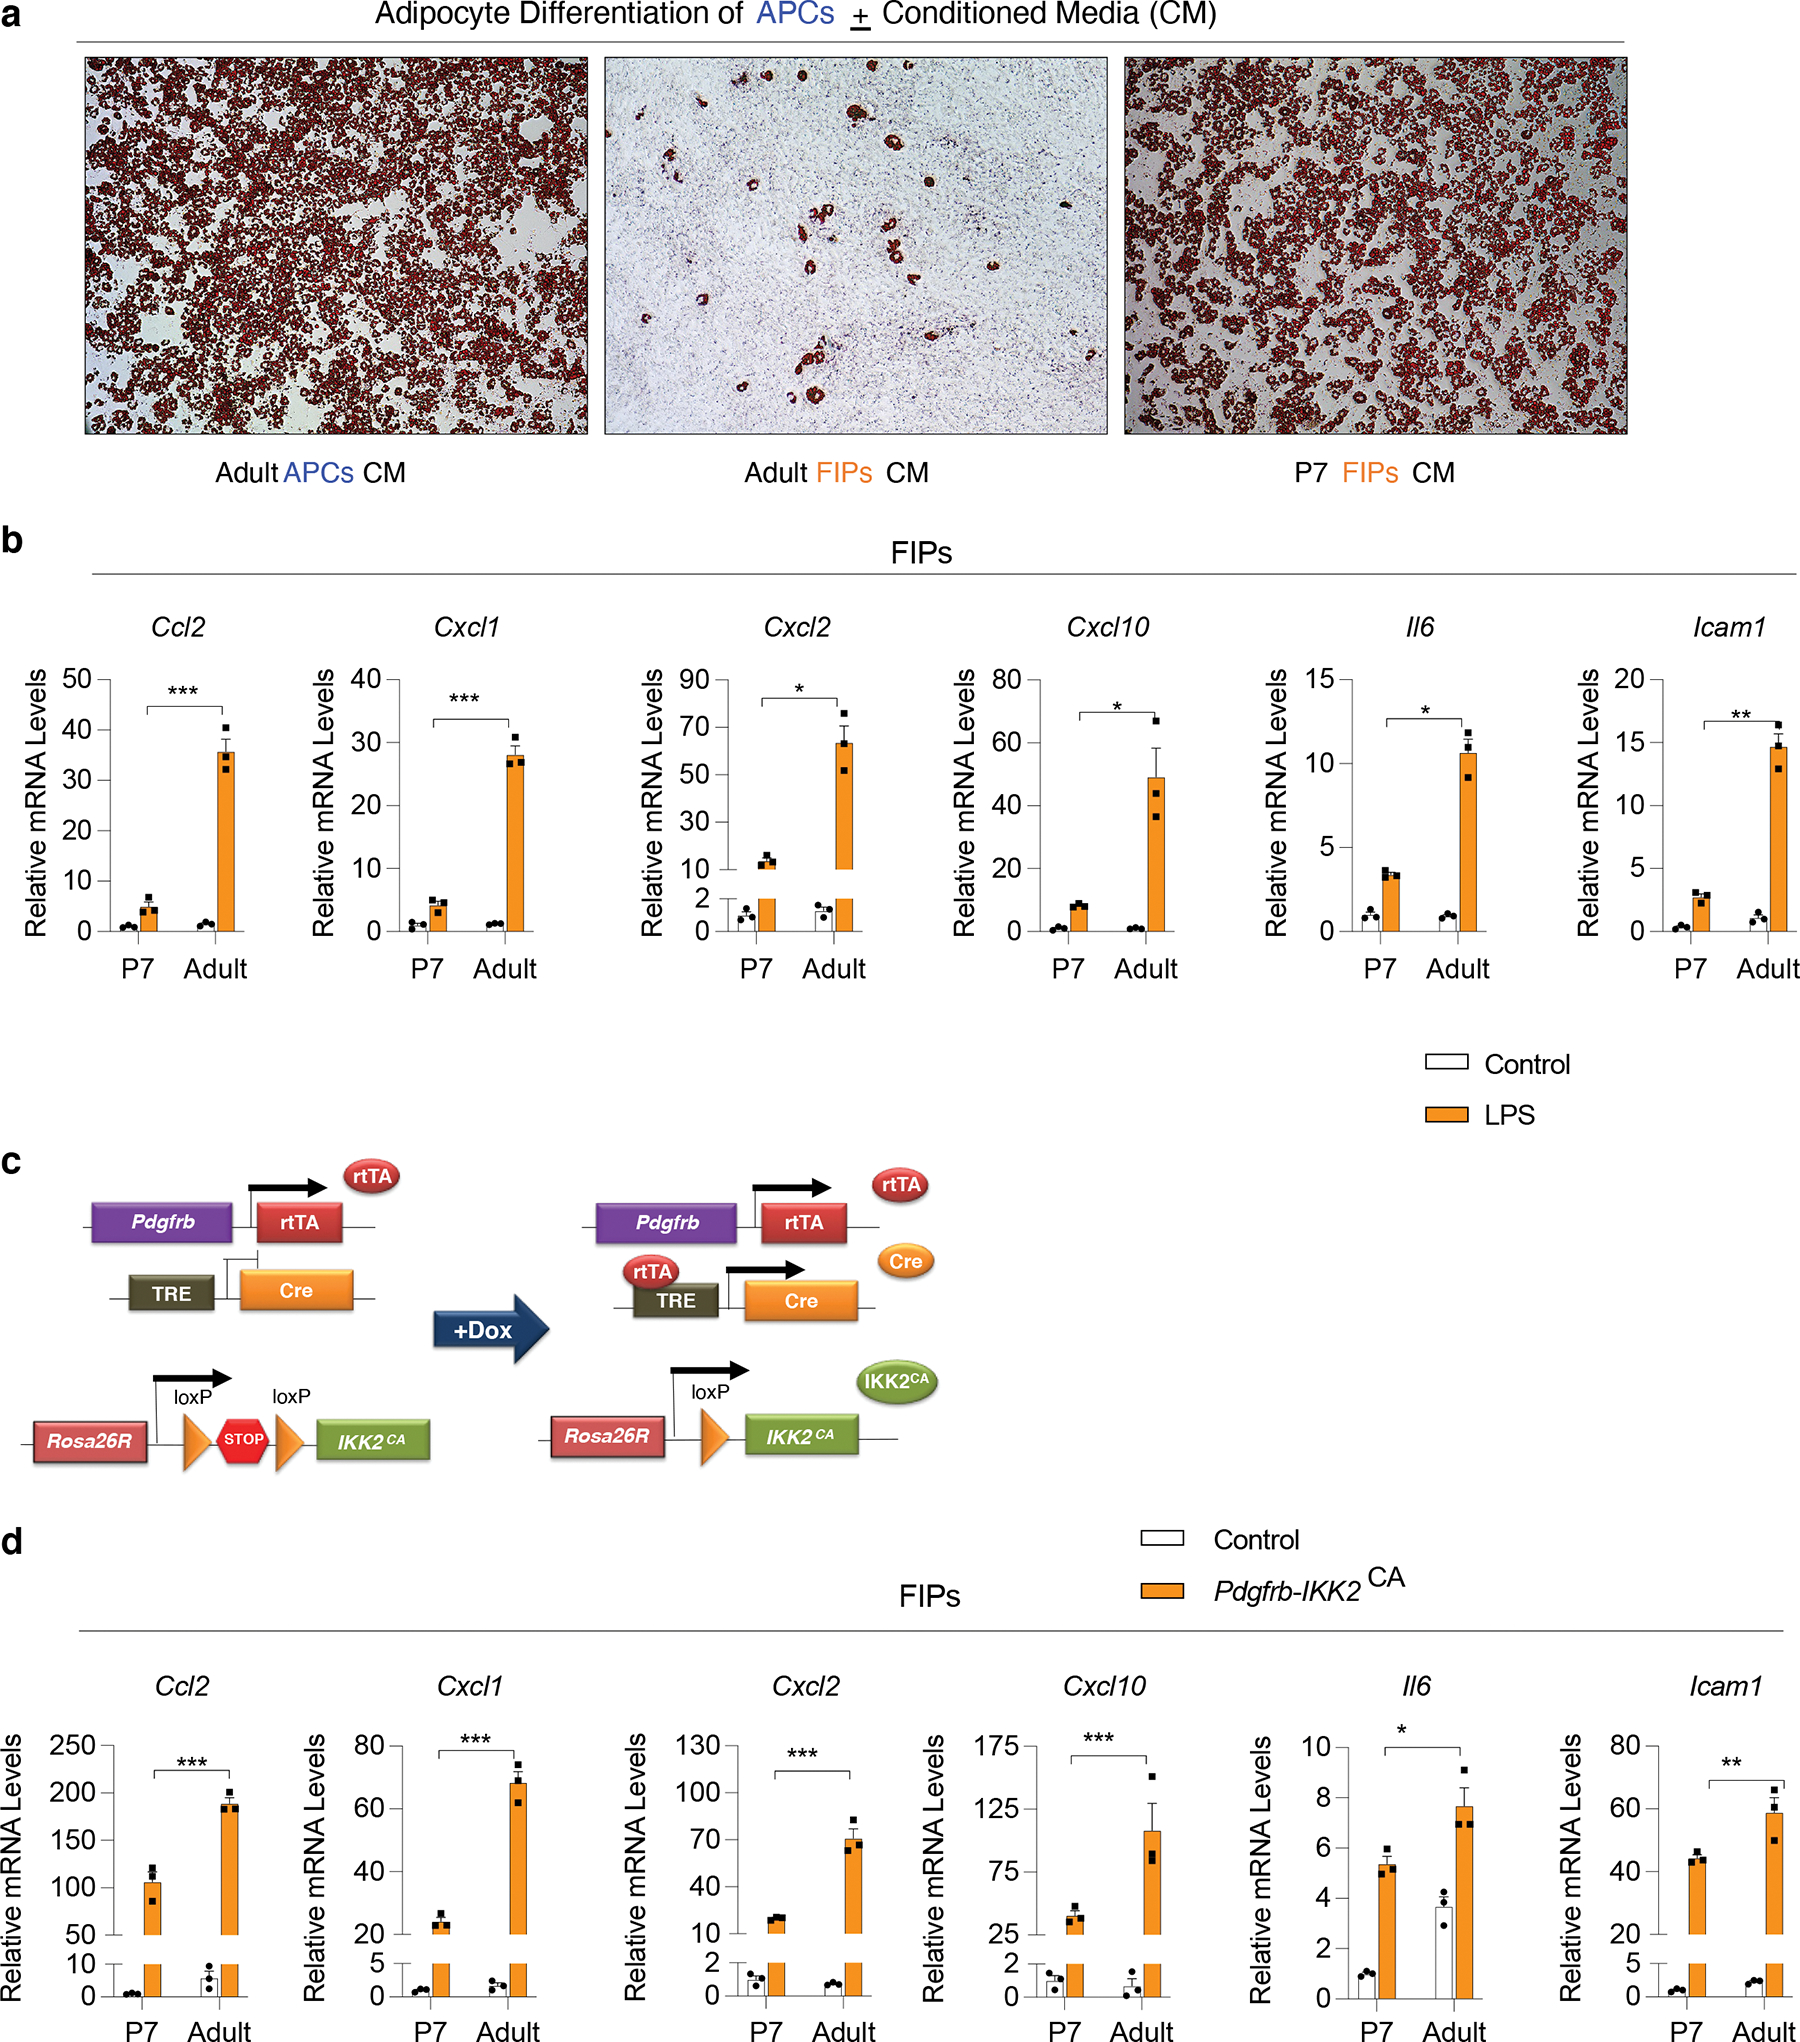
a) Representative 10x brightfield images of adult (5 weeks-old) APCs after 8 days of culture in conditioned media from parallel cultures of adult APCs, adult FIPs and P7 FIPs. Cultures are stained with oil red-O to visualize lipid accumulation.
b) mRNA levels of indicated proinflammatory genes in P7 FIPs and adult (5 weeks-old) FIPs treated with PBS or LPS (100ng/ml) for 2 hours. n=3 for each group. Bars represent ± SEM. * denotes p<0.05 by student t-test, ** denotes p<0.01, *** denotes p<0.001.
c) Pdgfrb-Ikk2CA were derived by breeding PdgfrbrtTA transgenic mice to animals expressing Cre recombinase under the control of the tetracycline-response element (TRE-Cre) and carrying the Rosa26RIkk2CA allele. Littermates carrying only PdgfrbrtTA and Rosa26RIkk2CA alleles were used as the control animals. The addition of doxycycline leads to activation of the Rosa26RIkk2CA allele, constitutively active (CA) IKK2 in Pdgfrb-expressing cells, and thus activation of NF-κB signaling.
d) mRNA levels of indicated proinflammatory genes in cultured P7 FIPs and adult (5 weeks-old) FIPs 24 hours after the addition of doxycycline (1μg/ml). n=3 for each group. Bars represent ± SEM. * denotes p<0.05 by student t-test, ** denotes p<0.01, *** denotes p<0.001.
Exact p values and numbers of repetitions can be found in Source Data Figure 5.
Another notable feature of adult FIPs is their ability to exert a pro-inflammatory phenotype in response to pro-inflammatory stimuli 16. GSEA indicated that perinatal FIPs are enriched in gene signatures reflecting heightened pro-inflammatory signaling when compared to perinatal APCs (Extended Data Fig. 5d). We observed that cultured perinatal FIPs indeed exhibit a stronger pro-inflammatory gene expression response to LPS treatment than perinatal APCs (Extended Data Fig. 6a). Nevertheless, cross comparison of these data to the published data on adult FIPs and APCs caused us to speculate that the response of perinatal FIPs to pro-inflammatory stimuli may not be as robust as observed in adulthood. We examined the pro-inflammatory responses of perinatal vs adult FIPs more closely by first comparing their transcriptional response to LPS in vitro. Upon LPS stimulation, levels of several key pro-inflammatory cytokines were elevated to a greater degree in adult FIPs when compared to P7 FIPs (Fig. 5b). Similar results were observed when cells were instead treated with TNFα (Extended Data Fig. 6b).
The NFκB signaling cascade is a classical signaling pathway that integrates both TNFα and LPS signaling. We previously demonstrated that adult FIPs differed from adult APCs in their transcriptional response to genetic NFκB activation 16. Thus, we asked whether the differential gene expression response of adult FIPs and perinatal FIPs to pro-inflammatory signals reflects an intrinsic difference in their potential to respond to NFκB activation. We utilized our previously described “Pdgfrb-Ikk2CA” model in which the addition of doxycycline results in expression of a constitutively active form of IKK2 (IKK2CA), an activator of NFκB, in PDGFRβ+ cells (Fig. 5c) 16. Following the addition of Dox in vitro, the induction in mRNA levels of all of the pro-inflammatory genes examined were 2–3 fold greater in adult FIPs than in perinatal FIPs (Fig. 5d). Taken together, data provide evidence that perinatal FIPs are less anti-adipogenic and less pro-inflammatory than adult FIPs.
Perinatal Pparg overexpression impacts cell plasticity in adulthood
We previously described a model in which the adipogenic capacity of PDGFRβ+ progenitors can be increased through Dox-inducible overexpression of Pparg. (PdgfrbrtTA; TRE-Pparg, herein “PpargTG” mice) (Fig. 6a) 12. Inducing PPARγ overexpression in adult PpargTG mice at the onset of high fat diet (HFD) led to a doubling of the amount of de novo adipogenesis that normally occurs in the gonadal WAT depot in association with HFD feeding 12. This observed increase in de novo adipogenesis was associated with healthy WAT remodeling; eWAT accumulated smaller and more numerous fat cells, relatively fewer pro-inflammatory macrophages, and maintained local insulin sensitivity. Importantly, inducible PPARγ overexpression in adult PDGFRβ+ precursors was not sufficient to drive de novo adipogenesis in adult chow-fed mice 12.
Figure 6. Transient perinatal Pparg overexpression in PDGFRβ+ cells has long-term consequences on progenitor cell plasticity.
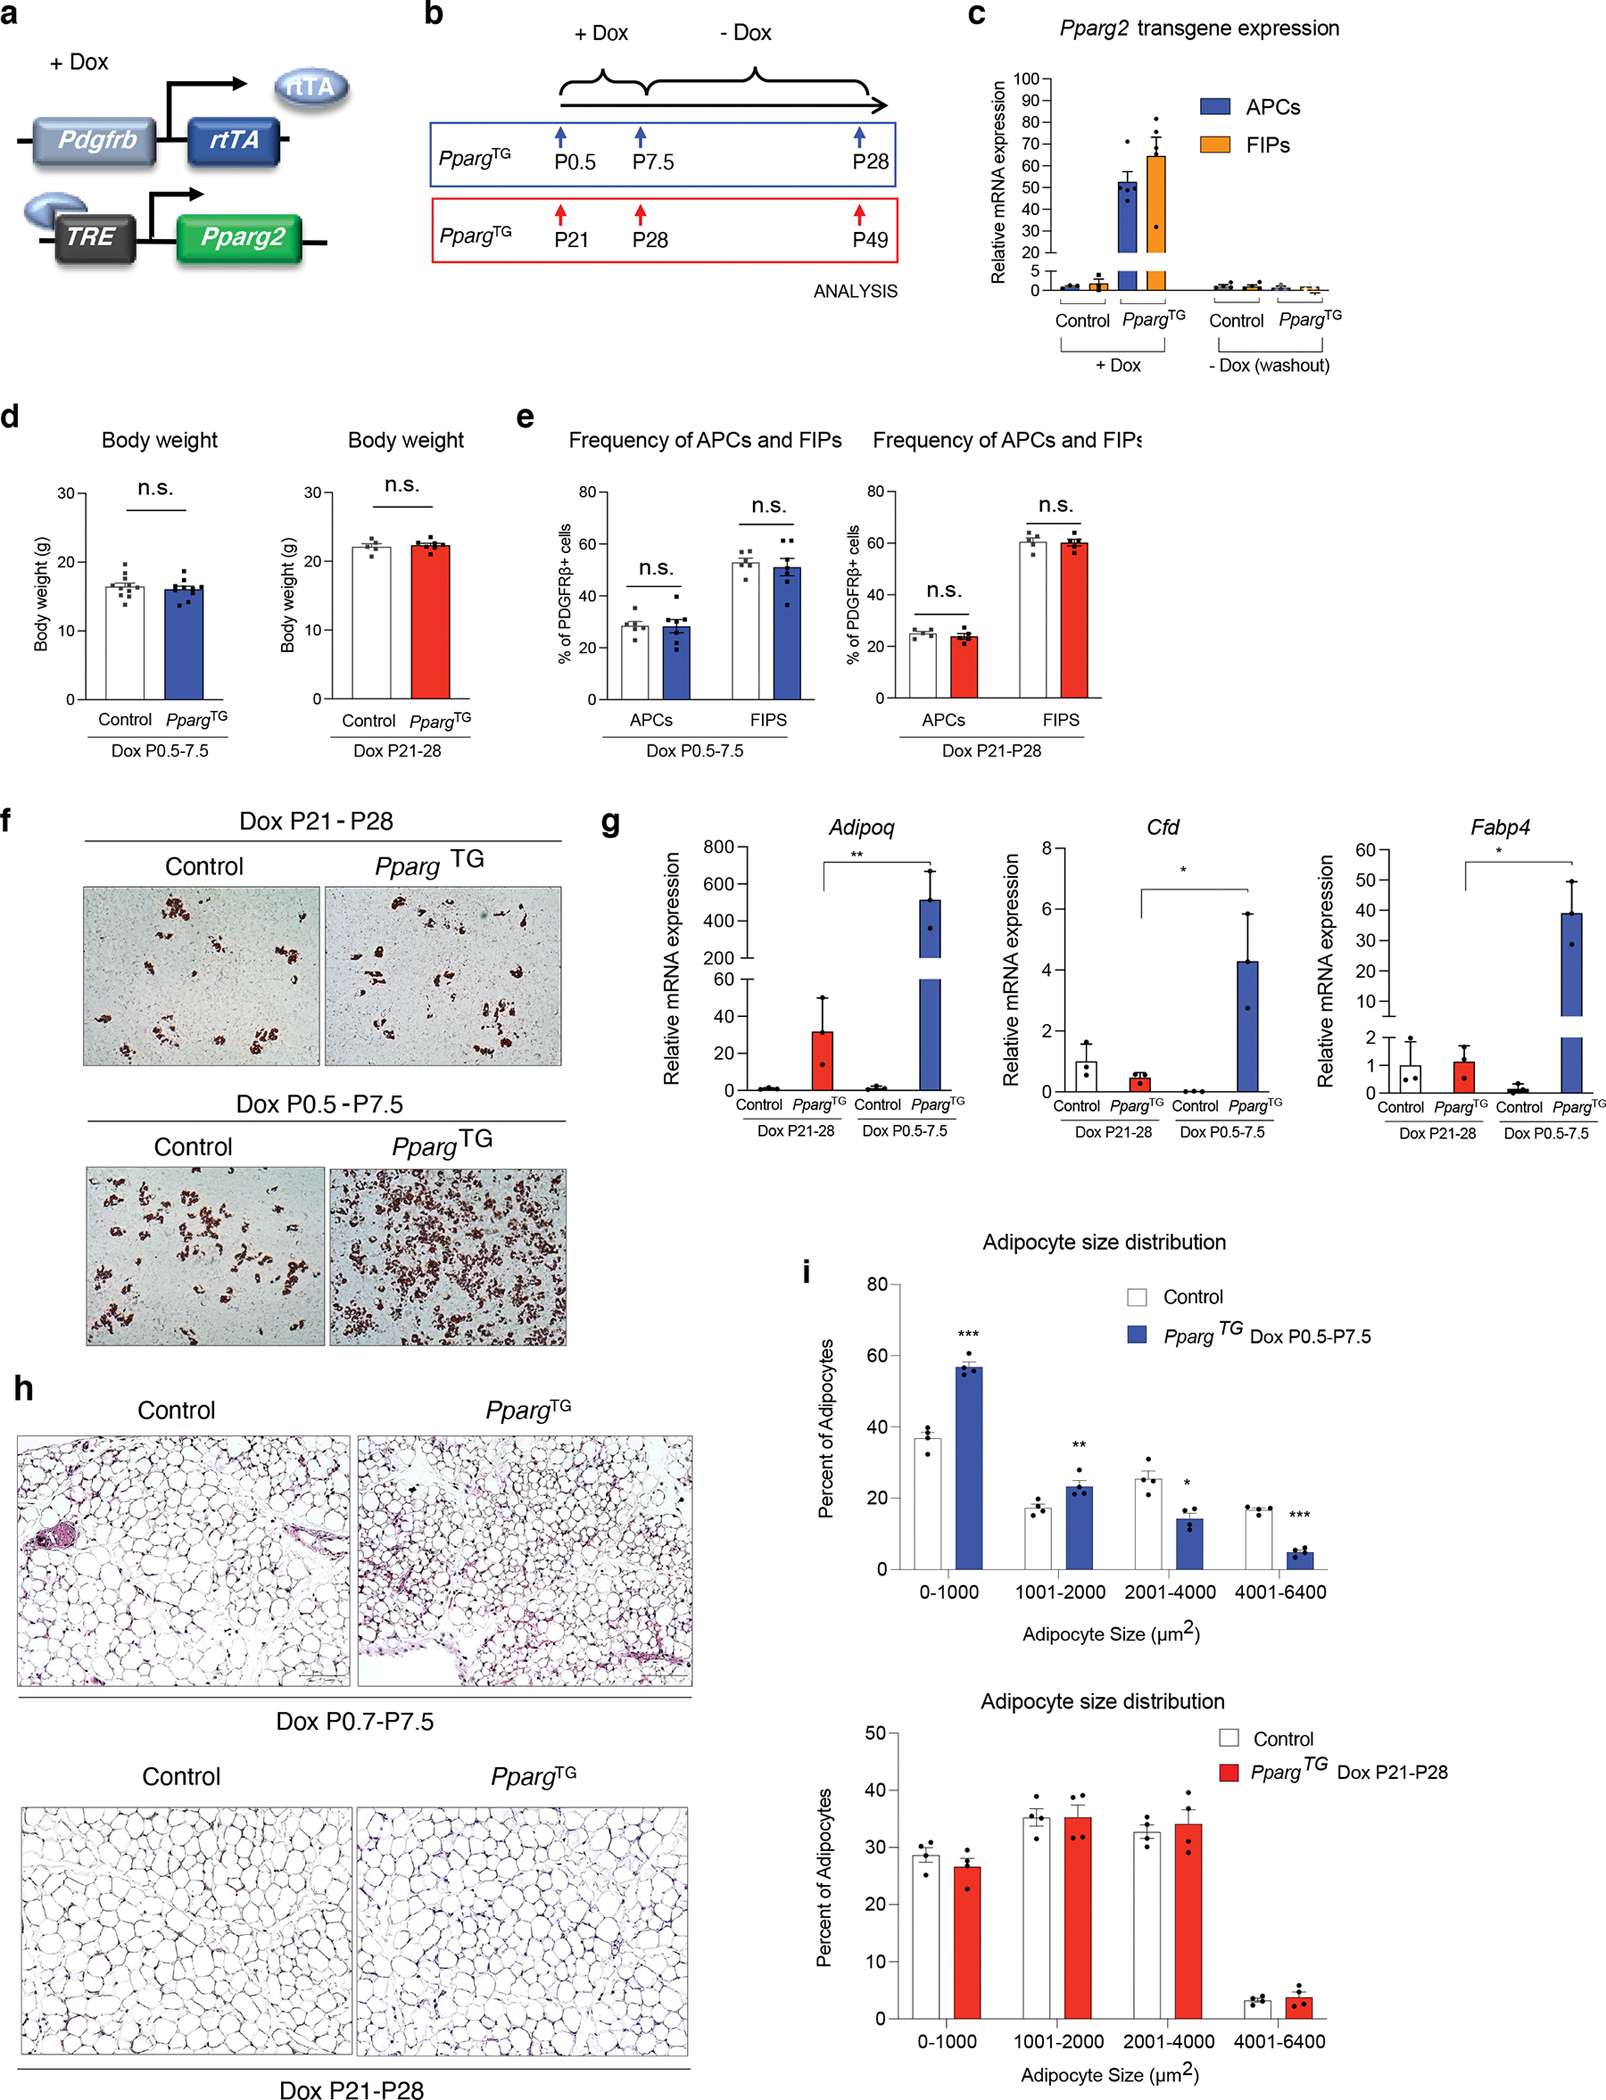
a) PpargTG mice (Bi-transgenic PdgfrbrtTA; TRE-Pparg2) are generated by breeding the PdgfrbrtTA transgenic mice to animals expressing Pparg2 under the control of the tet-response element (TRE− Pparg2). Littermates carrying only PdgfrbrtTA or TRE-Pparg2 alleles were used as the control animals.
b) Transient perinatal Pparg overexpression was achieved by exposing newborn pups to doxycycline from P0.5-P7.5 via lactating mothers fed a Dox-containing chow diet (600 mg/kg). Animals were then maintained on standard chow diet (- Dox) until harvest at P28 for analysis. Transient adolescent Pparg overexpression was achieved by directly feeding animals Dox-containing chow diet from P21-P28. Animals were then maintained on standard chow diet (- Dox) until harvest at P49 for analysis.
c) mRNA levels of Pparg2 transgene (transgene-specific primers) in isolated APCs and FIPs at the 7th day of Dox treatment and 3 weeks after the removal of Dox (washout). n=3–5 for each group. Bars represent ± SEM. ** denotes p<0.01 by student t-test, *** denotes p<0.001.
d) Body weights 3 weeks after the indicated Dox-treatment periods (left: Dox from P0.5-P7.5; right: Dox from P21-P28). n=5–11 for each group. Bars represent ± SEM. N.S. denotes p>0.05 by student t-test.
e) Frequency of APCs and FIPs in eWAT 3 weeks after the indicated Dox-treatment periods (left: Dox from P0.5-P7.5; right: Dox from P21-P28). n=5–6 for each group. Bars represent ± SEM. N.S. denotes p>0.05 by student t-test.
f) Representative 10x brightfield image of lipid accumulation in differentiated cultures of FIPs. FIPs were isolated 3 weeks after the indicated periods of Dox-treatment and transient Pparg expression. Cells were induced to undergo adipogenesis with induction media containing dexamethasone, IMBX, insulin, and rosiglitazone. Oil Red O staining of lipid accumulation and imaging was performed 6 days following the induction of differentiation.
g) mRNA levels of adipocyte-selective genes in differentiated cultures of FIPs corresponding to panel f. n=3 for each group. Bars represent ± SEM. * denotes p<0.05 by student t-test, *** denotes p<0.001.
h) Representative 10x brightfield images of H&E stained eWAT 3 weeks after the indicated period of Dox-treatment and transient Pparg expression.
i) Adipocyte size distribution in eWAT 3 weeks after the indicated period of Dox-treatment and transient Pparg expression. n = 4 for each group. Bars represent ± SEM. * denotes p<0.05 by student t-test, ** denotes p<0.01, *** denotes p<0.001.
Exact p values and numbers of repetitions can be found in Source Data Figure 6.
The observed differences in the functional properties of adult vs. perinatal PDGFRβ+ progenitor subpopulations prompted us to ask whether increasing the adipogenic capacity of PDGFRβ+ precursors specifically during the perinatal period would impact adipose tissue development and expandability in adulthood. Newborn littermate Control (carrying either PdgfrbrtTA or TRE-Pparg transgene) and PpargTG pups were transiently exposed to doxycycline from P0.5 to P7.5 through postpartum feeding of lactating mothers with DOX-Chow. After P7.5, lactating mice were switched back to standard chow diet without Dox until the time of weaning and harvesting (P28) (Fig. 6b). We confirmed by gene expression analysis that the Pparg transgene mRNA levels were induced to comparable levels in both APCs and FIPs following seven days of perinatal Dox exposure (Fig. 6c). Importantly, by P28 (3 weeks after Dox washout), transgene expression was turned off with mRNA levels returning to baseline levels (Fig. 6c). We did not observe any effect of transient perinatal Pparg overexpression in PDGFRβ+ cells on P28 body weights (Fig. 6d). Moreover, the frequency of eWAT APCs and FIPs at P28 was also not impacted by perinatal Pparg overexpression (Fig. 6e). We isolated APCs and FIPs from eWAT depots of both P28 Control and PpargTG mice to test their differentiation potential in vitro. APCs from Control and PpargTG mice underwent differentiation to a similar degree (Extended Data Figure 7a,b); however, transient Pparg overexpression only between P0.5-P.7.5 had a striking and durable pro-adipogenic impact on the differentiation capacity of FIPs (Fig. 6f,g). P28 FIPs from PpargTG mice underwent adipocyte differentiation to a much greater extent than Control P28 FIPs upon induction. Histological analysis of P28 eWAT sections revealed the presence of smaller and more numerous adipocytes (Fig. 6h,i), indicative of hyperplastic eWAT development in response to transient Pparg overexpression during the first week of life.
PPARγ is directly activated by the thiazolidinedione (TZD) class of anti-diabetic drugs 30. In adult mice, TZDs, such as Rosiglitazone, drive adipocyte differentiation from PDGFRβ+ cells 12. We asked whether transient perinatal exposure of newborn mice (P0.5-P7.5) to Rosiglitazone can stimulate adipocyte differentiation in a manner sufficient to drive hyperplastic eWAT development. We treated newborn pups with Rosiglitazone via daily oral gavage of lactating mothers from P0.5-P7.5. At 5 weeks of age, we did not observe any body weight difference between Control and Rosiglitazone treated mice (Extended Data Figure 8a). We observed the well-known TZD-induced “browning” phenotype of the inguinal WAT in treated animals, indicating that Rosiglitazone treatment was effective. Inguinal WAT mass was smaller in treated animals (Extended Data Figure 8b), correlating with a larger area of multilocular adipocytes than observed in control animals (Extended Data Figure 8d). Activation of the beige adipocyte gene expression was confirmed by qPCR; levels of Ucp1 and other thermogenic genes were induced and remained elevated 4 weeks after the last rosiglitazone treatment (Extended Data Figure 8c). On the other hand, we did not observe a phenotype in gonadal WAT that mimicked the phenotype of PpargTG mice. The cellularity and gene expression profile of gonadal WAT at P35 was not impacted transient Rosiglitazone exposure (Extended Data Figure 8d,e). Thus, transient overexpression of Pparg in perinatal adipose progenitors, rather than agonism alone, is needed to induce this adipose tissue phenotype.
We also asked whether transient Pparg overexpression in PDGFRβ+ cells at a later stage of life can exert the same long-lasting effects. We weaned Control and PpargTG mice at P21 and placed them directly on a Dox-chow diet for one week (P21-P28) (Fig. 6b). This is a period considered to represent murine adolescence 31. Three weeks after Dox diet was removed (P49), body weights of PpargTG mice were indistinguishable from Controls (Fig. 6d). Moreover, transient expression of Pparg did not impact the frequency of APCs and FIPs or the adipogenic capacity of FIPs (Fig. 6e–g). Histological analysis of eWAT sections revealed that transient Pparg overexpression from P21-P28 also did not impact the cellularity of tissue at P49 (Fig. 6h,i). Taken together, these data suggest that the early perinatal period (P0.5–7.5) is a unique window for adipose progenitor plasticity.
Perinatal Pparg overexpression impacts WAT plasticity in obesity
The hyperplastic eWAT phenotype observed following perinatal Pparg overexpression prompted us to ask how eWAT of these PpargTG mice would subsequently remodel under physiological and pathophysiological conditions. Perigondal WAT in mice is relatively resistant to cold-induced beige adipocyte accrual (i.e. “browning”) 32. Given the important role for Pparg in controlling thermogenic gene expression, we asked whether transient Pparg overexpression in perinatal Pdgfrb-expressing cells influenced the ability of adipocytes to adopt a beige adipocyte phenotype. To address this, we exposed Control and PpargTG mice to doxycycline from P0.5 to P.7.5 to induce transient Pparg expression in Pdgfrb-expressing cells. 4 weeks after the removal of doxycycline, we exposed animals to cold temperature (6 °C) for one week (Extended Data Figure 9a). After one week of cold exposure, we did not observe any difference in body weight or adipose tissue weight (Extended Data Figure 9b,c). Histological analysis of sectioned gonadal WAT revealed the presence of smaller adipocytes in PpargTG mice, consistent with the phenotype at room temperature. We did observe few multilocular cells (Extended Data Figure 9d); however, they were scarce and not readily apparent across the tissue. Gene expression analysis revealed a slight induction in some (Cox8b and Elovl3) cold-induced transcripts associated with beige adipocytes; however, most transcripts (e.g. Ucp1) remained low and not induced (Extended Data Figure 9e). As such, this specific perturbation of perinatal progenitors does not seem sufficient to allow for substantial cold-induced thermogenic remodeling of the tissue.
We then asked how the hyperplastic eWAT depots of PpargTG mice adapt to high-fat diet feeding in adulthood. We treated Control and PpargTG mice with Dox from P0.5-P7.5 as described above, and then placed animals on a standard chow diet until 6 weeks of age. At 6 weeks of age, mice were then placed on a HFD (60% kcal) for up to 12 weeks (Fig. 7a). During the 12 weeks of HFD feeding, Control and PpargTG mice did not significantly differ in body weights (Fig. 7b). After 12 weeks of HFD, WAT mass was also comparable between the controls and transgenic mice (Fig. 7c). We analyzed the frequency of eWAT FIPs and APCs in obese Control and PpargTG mice by flow cytometry. Transient perinatal Pparg expression did not alter the relative proportions of FIPs and APCs normally observed in diet-induced obesity; FIPs remained the predominant subpopulation of PDGFRβ+ cells (~80% of all PDGFRβ+ cells) whereas APCs were much lower in abundance (Fig. 7d). However, isolated FIPs from PpargTG mice exhibited different molecular and functional phenotypes. FIPs from PpargTG mice expressed relatively lower levels of pro-inflammatory transcripts than FIPs from Control animals (Fig. 7e). Remarkably, the potential for FIPs to undergo adipogenesis in vitro was preserved, even after 12 weeks of HFD feeding (17 weeks after the removal of doxycycline) (Fig. 7f,g).
Figure 7. Transient perinatal Pparg overexpression in PDGFRβ+ cells impacts FIPs activity in diet-induced obesity.
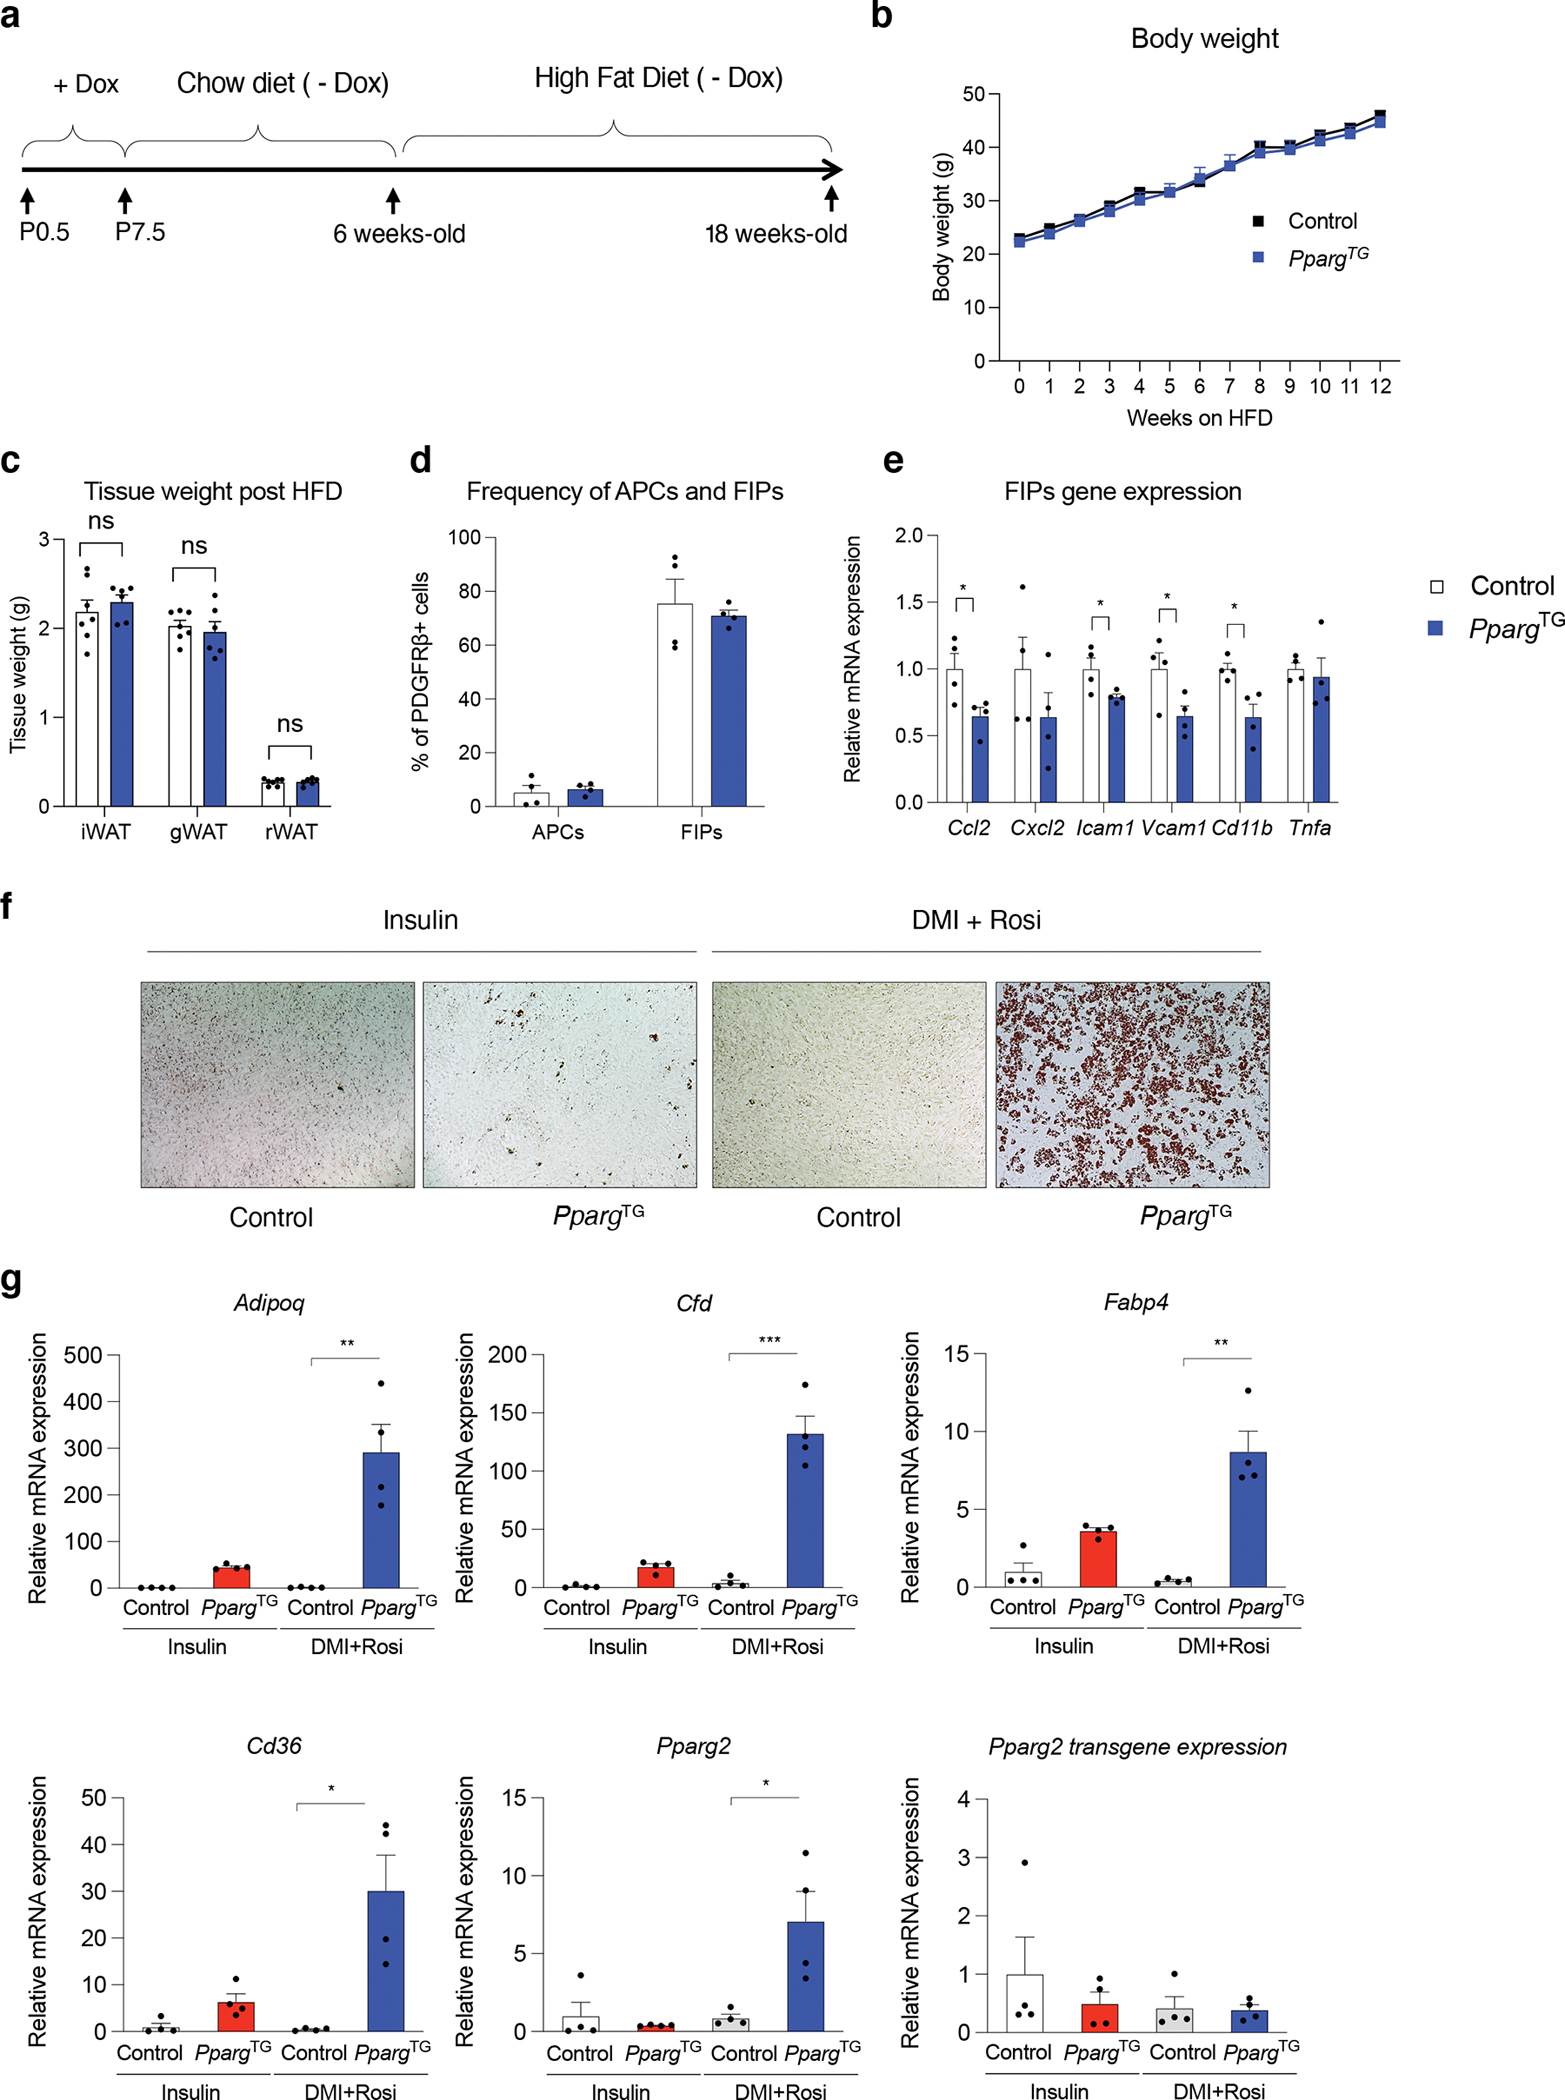
a) Experimental design: Transient perinatal Pparg overexpression from P0.5-P7.5 was induced by exposing newborn pups to doxycycline via lactating mothers fed a Dox-containing chow diet (600 mg/kg). Lactating animals were then switched to a standard chow diet (- Dox) until weaning. 6 weeks-old Control and PpargTG offspring then administrated a high-fat-diet (HFD) (60% kcal) for 12 weeks prior to analysis.
b) Weekly body weights of Control and PpargTG mice during the HFD feeding period. n=7 for each group. Data points represent mean ± SEM.
c) Tissue weights of Control and PpargTG mice after 12 weeks of HFD feeding. n=7 for each group. Bars represent ± SEM. N.S. denotes p>0.5 by student t-test.
d) Frequency of APCs and FIPs in eWAT of Control and PpargTG mice after 12 weeks of HFD feeding.. n=4 for each group. Bars represent ± SEM. N.S. denotes p>0.05 by student t-test.
e) mRNA levels of indicated proinflammatory genes in freshly isolated FIPs from Control and PpargTG mice after 12 weeks of HFD feeding. n=4 for each group. Bars represent ± SEM. * denotes p<0.05 by student t-test, ** denotes p<0.01.
f) Representative 10x bright field image of lipid accumulation in normal or differentiating cultures of FIPs obtained from Control and PpargTG mice after 12 weeks of HFD feeding. Cells were induced to undergo adipogenesis with induction media containing dexamethasone, IMBX, insulin, and rosiglitazone. Oil Red O staining of lipid accumulation and imaging was performed 6 days following the induction of differentiation.
g) mRNA levels of adipocyte-selective genes within in vitro differentiated FIPs isolated from Control and PpargTG mice maintained on HFD feeding for 12 weeks. mRNA levels were assayed 6 days following the induction of in vitro adipocyte differentiation. Bars represent ± SEM. * denotes p<0.05 by student t-test, ** denotes p<0.01, *** denotes p<0.001.
Exact p values and numbers of repetitions can be found in Source Data Figure 7.
The overall eWAT phenotype of PpargTG mice appeared relatively healthier than eWAT from obese Control animals. eWAT depots from HFD-fed PpargTG mice contained fewer MAC-2+ inflammatory cells and fewer crown-like structures (Fig. 8a.b). Moreover, eWAT from HFD-fed PpargTG mice maintained smaller and more numerous adipocytes after the 12 weeks of HFD feeding (Fig. 8c–e). Isolated adipocytes from obese PpargTG mice exhibited a gene expression profile indicative of healthier adipocytes. Compared to fractionated adipocytes from Control eWAT, epididymal adipocytes from PpargTG mice expressed lower levels of genes associated with extracellular matrix remodeing and metabolic inflammation (Fig. 8f–h). The healthy eWAT phenotype correlated with systemic improvements in metabolic health. Obese PpargTG mice exhibit better glucose tolerance than Control animals (Fig. 8i,j). Moreover, serum levels of ADIPONECTIN are higher in obese PpargTG mice, further reflective of preserved WAT function (Fig. 8k). Furthermore, serum triglyceride levels were lower in obese PpargTG mice (Fig. 8l). Taken together, these data highlight the long-term impact of modulating the adipogenic capacity of adipose progenitors during the perinatal stage.
Figure 8. Transient perinatal Pparg overexpression in PDGFRβ+ cells impacts WAT plasticity in adult onset obesity.
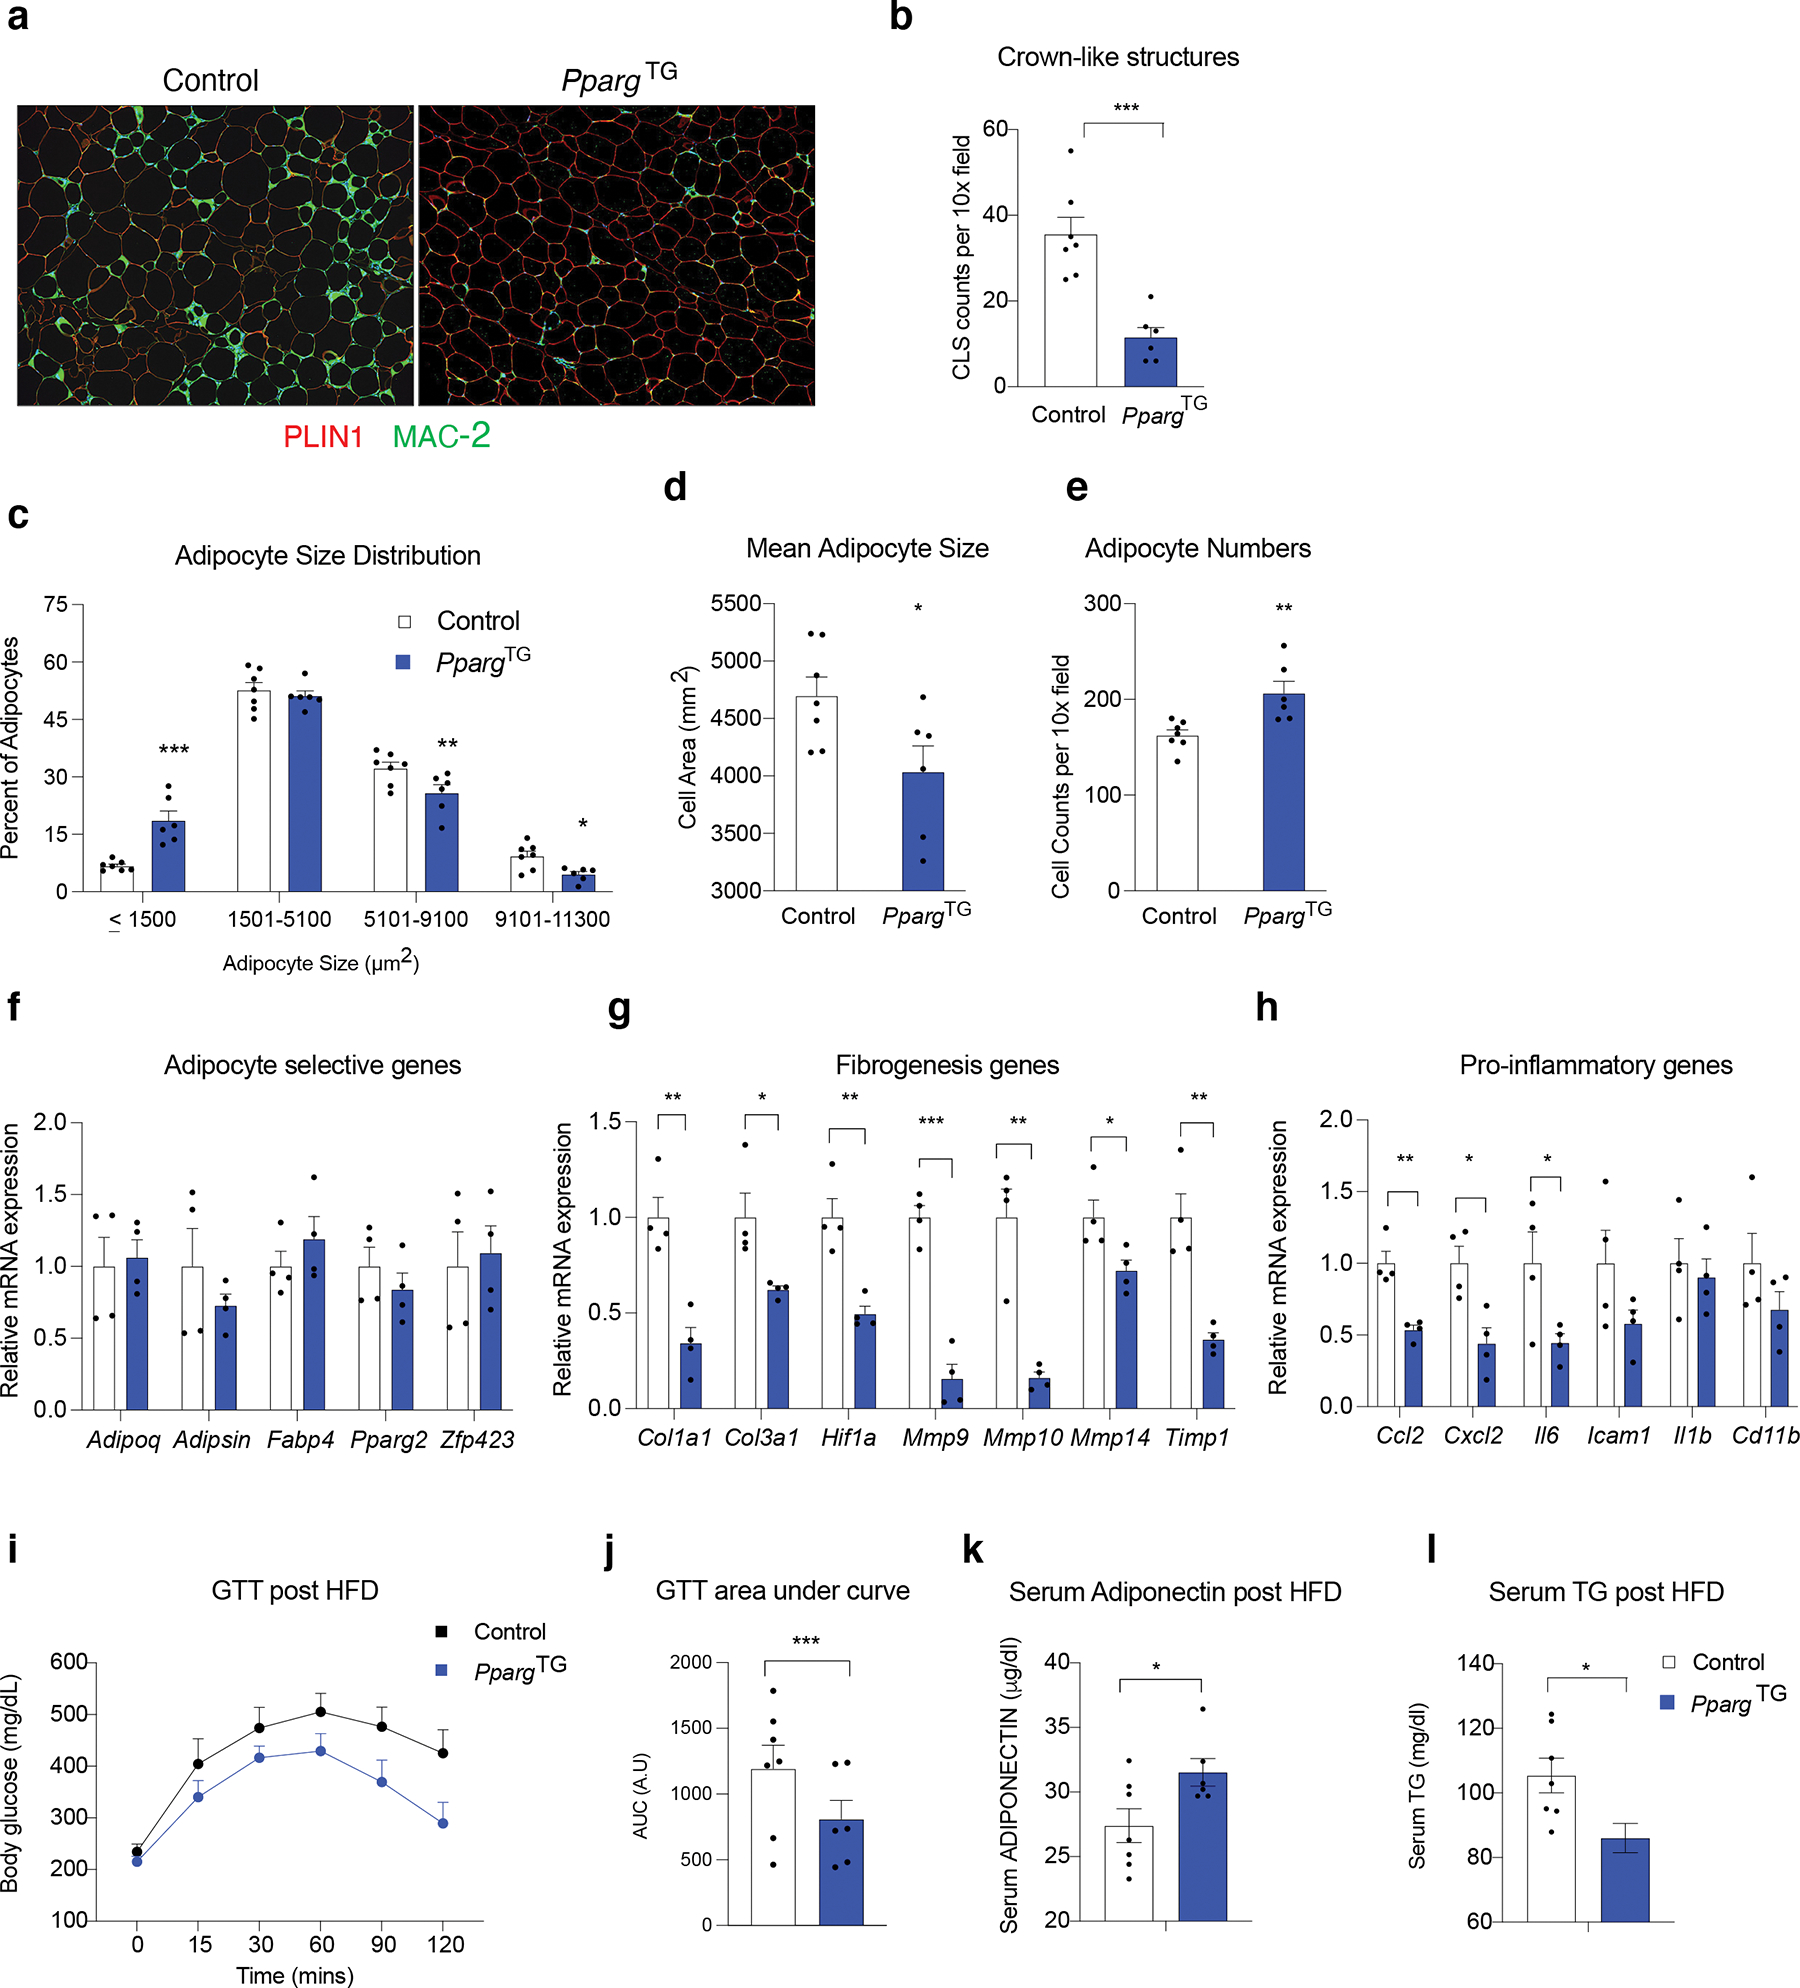
a) Representative 10x immunofluorescence image of PERILIPIN (red) and MAC-2 (green) expression in eWAT sections after 12 weeks of HFD feeding. Nuclei counterstained with DAPI.
b) Frequency of MAC-2 crown-like structures (MAC-2 positive) per 10x field in eWAT sections after 12 weeks of HFD feeding. n=7 for each group. Bars represent ± SEM. *** denotes p<0.001 by student t-test.
c) Adipocyte size (μm2) distribution in eWAT after 12 weeks of HFD feeding. n=7 for each group. Bars represent ± SEM. * denotes p<0.05 by student t-test, ** denotes p<0.01, *** denotes p<0.001.
d) Mean adipocyte size (μm2) in eWAT after 12 weeks of HFD feeding. n=7 for each group. Bars represent ± SEM. * denotes p<0.05 by student t-test.
e) Adipocyte cell numbers per 10x field of H&E stained sections of eWAT after 12 weeks of HFD feeding. n=7 for each group. Bars represent ± SEM. ** denotes p<0.01 by student t-test.
f) mRNA levels of adipocyte-selective genes in fractionated epididymal mature adipocytes after 12 weeks of HFD feeding. n=4 for each group. Bars represent ± SEM.
g) mRNA levels of fibrogenic genes in fractionated epididymal mature adipocytes after 12 weeks of HFD feeding. n=4 for each group. Bars represent ± SEM. * denotes p<0.05 by student t-test, ** denotes p<0.01, *** denotes p<0.001.
h) mRNA levels of pro-inflammatory genes in fractionated epididymal mature adipocytes after 12 weeks of HFD feeding. n=4 for each group. Bars represent ± SEM. * denotes p<0.05 by student t-test, ** denotes p<0.01.
i) Glucose tolerance tests after 11 weeks of HFD feeding. n = 7 for each group.
j) Area under curve measurements of glucose tolerance tests shown in k. n=7 for each group. Bars represent ± SEM. *** denotes p<0.001 by student t-test.
k) Serum adiponectin levels after 12 weeks of HFD feeding. n=7 for each group. Bars represent ± SEM. ** denotes p<0.01 by student t-test.
l) Serum triglyceride (TG) levels after 12 weeks of HFD feeding. n=7 for each group. Bars represent ± SEM. ** denotes p<0.01 by student t-test.
Exact p values and numbers of repetitions can be found in Source Data Figure 8.
Discussion
The development of scRNA-seq has enabled rapid progress in unraveling the molecular heterogeneity and complexity of the adipose tissue microenvironment. One key question that arises from these studies is whether cell subpopulations of interest emerge during the initial development of the tissue, or instead, emerge and adopt their unique phenotypes in adulthood. Here, we demonstrate that APCs and FIPs emerge at the earliest stages of murine eWAT development. Their presence within the eWAT primordium at P3 provides evidence that these distinct cell subpopulations emerge even prior to formation of lipid-laden adipocytes. The scRNA-seq data provide evidence of global transcriptomic similarities between perinatal and adult adipose progenitors; however, our functional studies reveal important differences that can be observed upon isolation of the cells. Most notably, perinatal FIPs lack the anti-adipogenic phenotype exhibited by adult FIPs. It is tempting to speculate that such a change in phenotype over time may be advantageous, at least for periods of time. The lack of anti-adipogenic signals in the early postnatal period may help enhance adipocyte differentiation during this key period of WAT development. In adults, the presence of such anti-adipogenic signals may help maintain APCs in a quiescent state under homeostatic conditions. Recent independent studies have highlighted the impact of aging on progenitor activity and the age-dependent accumulation of anti-adipogenic cells in subcutaneous WAT 5,33–36. In aging, the imbalance between anti-adipogenic and pro-adipogenic signals may contribute to progenitor exhaustion and an inability to maintain WAT plasticity. Going forward, it will be important to identify the mechanisms underlying the age-related changes in FIPs activity. The loss of adipogenic potential with age may reflect a loss in expression/activity of a “pro-adipogenic” factor and/or the acquisition of an intrinsic “anti-adipogenic” mechanism. We report here that adult FIPs are more pro-inflammatory and anti-adipogenic than perinatal FIPs. Whether the gain in these phenotypes mechanistically related to their loss of adipogenic potential needs to be further explored.
The exact origin of adipocytes and the timing of their emergence varies with depot20,37. Murine epididymal adipocytes differentiate during the early postnatal period. This stands in contrast to inguinal white adipocytes and classical brown adipocytes which emerge during the late stages of fetal development. Until recently, the prevailing view has been that epididymal adipocytes originate, at least in part, from a mesothelial cell origin 38,39. This hypothesis is attractive given the presence of mesothelial cells in intra-abdominal, but not subcutaneous, WAT depots. A recent study tested the hypothesis of a mesothelial origin of adipocytes directly by performing a lineage-tracing analysis based on the expression of Krt19, a specific mesothelial cell marker 40. This study did not identify adipocytes that descend from Krt19-expressing cells, either during development or in adult mice with diet-induced obesity. As such, this challenges the hypothesis that adipocytes descend from mesothelial cells, at least under the conditions tested. Our lineage tracing, scRNA-seq analyses, and functional analyses, point to mesenchymal PDGFRβ+ cells as precursors to epididymal adipocytes during the early postnatal period. Based on our work alone, we certainly cannot reject the hypothesis of a mesothelial cell origin of adipocytes. In fact, during development intra-abdominal fibroblasts and smooth muscle cells originate from mesothelin-expressing mesothelial cells 41. Thus, we cannot rule out that the APC population described here may ultimately be of mesothelial origin. Importantly, it should be noted that one cannot rule out the possibility of multiple origins of epididymal adipocytes. Our lineage tracing of Pdgfrb-expressing cells specifically during the pre-weaning period (P0-P28) revealed that ~40% of adipocytes present at P28 were GFP+, and thus descending from PDGFRβ+ cells present during the time of doxycycline exposure. This number may reflect technical limitations to the lineage tracing system at this stage (e.g. efficiency of Dox-mediated CRE activation) or real biological heterogeneity in Pdgfrb expression within APCs. As such, we cannot rule out the possibility that adipocytes may also emerge from cells lacking or low in Pdgfrb expression. Moreover, we cannot rule out the possibility that additional subpopulations of FIP-like cells and APC subpopulations beyond what is observed here might exist at different stages of development. In fact, clonal analyses of epididymal SVF cells revealed adipocyte and preadipocyte cellular heterogeneity beyond what was observed through scRNA seq studies 42. Given the limitations of all approaches utilized, further studies will be needed to understand the complexity of eWAT development and the inductive signals that initiate tissue development during the perinatal period.
Our data here highlight the long-term impact of modulating the adipogenic capacity of adipose progenitors specifically during the perinatal stage. Transient overexpression of Pparg in PDGFRβ+ cells during the first week of life led to healthy hyperplastic eWAT development that can be observed at weaning and even after HFD feeding in adulthood. Remarkably, PPARγ expression during this perinatal window exerted a long-lasting impact on the adipogenic capacity of FIPs. These phenotypes were not observed when PPARγ was instead transiently expressed for the same duration in P21-P28 mice, suggesting a unique plasticity to perinatal progenitors. The differences between perinatal vs. adult adipose progenitors in molecular markers (e.g. Dlk1) and lineage plasticity may have implications for the study of adipogenesis in mice. The use of gain and loss of function animals that lack temporal control (e.g. constitutively active transgenes) may make it difficult to discriminate between perinatal vs. adult effects on progenitor activity. An important limitation to our analysis of PpargTg mice is that we cannot definitively establish whether the healthy hyperplastic phenotype of the adipose tissue in the transgenic model is due to enhanced differentiation from APCs and/or from FIPs. Our in vitro data suggest that FIPs are the most impacted by the transient overexpression of Pparg during the perinatal period; however, there are several possibilities, including 1) enhanced differentiation from APCs due to direct effects of transgene expression (not supported by in vitro data here), 2) enhanced differentiation from APCs secondary to alterations in the properties of FIPs (i.e. changes in secreted factor), or 3) enhanced differentiation from FIPs (possibility raised by in vitro data here). The latter possibility is intriguing as FIPs may be give rise to a functionally distinct adipocytes in this model. Exploring the cellular and molecular underpinnings of this health adipose tissue remodeling will depend on the development of more specific tools to lineage trace and manipulate select progenitor cell subpopulations in vivo.
It is increasingly apparent that maternal obesity and maternal environmental factors influence energy balance and nutrient homeostasis of offspring through durable reprograming of cells 43. Going forward, it will be important to examine how maternal nutrition and energy balance impact the distinct progenitor subpopulations of adipose tissues, and whether long-term changes in these cell populations underly any of the long-term effects on offspring physiology. Moreover, gaining deeper insight into the molecular mechanisms underlying the observed differences between perinatal and adult FIPs may identify strategies to enhance adipogenesis and healthy WAT remodeling in adulthood.
Materials and Methods
Animals and diets
All animal experiments were performed according to procedures approved by the UTSW Animal Care and Use Committee. MuralChaser mice (C57BL/6J) were derived from breeding PdgfrbrtTA (JAX 028570), TRE-Cre (JAX 006234), and Rosa26RmT/mG (JAX 007676) mice as previously described 21. Pdgfrb-Ikk2CA mice (C57BL/6J) were derived through intercrosses of PdgfrbrtTA, TRE-Cre, and Rosa26RIKK2CA (JAX008242) as previously described 16. TRE-Pparg2 transgenic mice were previously described 12. Lipodystrophic Adiponectin-Cre; PpargloxP/loxP animals (C57BL/6J) were derived by crossing Adiponectin-Cre mice (JAX 028020) and PpargloxP/loxP (JAX 004584) animals and were previously described 25. In experiments involving only wild-type mice, C57BL/6N wildtype mice (Charles River Laboratories) were used. Postnatal day 0.5, 3, and 7 (P0.5, P3, P7), 4–6 weeks and 18 weeks old male mice were used in this study.
Mice were maintained on a 12 hr light/dark cycle in a temperature-controlled environment (22°C) or 6 °C for cold exposure with 40–60% humidity and given free access to water and diets as indicated in the manuscript. Diet utilized include, standard rodent chow diet, doxycyline-containing chow diet (Dox-Chow, 600 mg/kg doxycycline, Bio-Serv, S4107), or HFD (HFD; 60% kcal fat; Research Diets no. D12492i).
Histological analysis
Transverse sections through the mid-thoracic to lower abdominal/inguinal region of P0, P3 and P7 pups were fixed in 4% paraformaldehyde for 24h and maintained in 50% ethanol solution. Paraffin embedding, perinatal tissue sectioning and H&E staining was performed by the Molecular Pathology Core Facility at UTSW. Brightfield and fluorescent images were acquired using a Keyence BZ-X710 microscope. Indirect immunofluorescence was performed as previously described 21. Primary antibodies used for immunofluorescence include: guinea pig anti-PERILIPIN 1:1000 (Fitzgerald #20R-PP004), chicken anti-GFP 1:500 (Abcam, ab13970), rabbit anti-MESOTHELIN 1:1000 (LSBio #LS-C407883), rabbit anti-MAC-2 1:500 (Cedarlane #CL8942AP), rabbit anti-EFHD1 1:100 (Sigma #SAB3500392), mouse anti EFHD1 1:100 (Abnova #H00080303-M05), mouse anti-AGT 1:100 (Santa Cruz Biotechnology #sc-374511), rat anti-ENDOMUCIN 1:100 (Santa Cruz Biotechnology #sc-65495).
Gene expression analysis by qPCR
RNA was isolated using RNAqueous-Micro Total RNA Isolation Kit (Thermo Fisher Scientific). cDNA was synthesized using M-MLV Reverse Transcriptase (Invitrogen) and Random Primers (Invitrogen). Relative mRNA levels were determined by quantitative PCR using SYBR Green PCR Master Mix (Applied Biosystems). Values were normalized to Rps18 levels using the 2-CtΔΔ method. Unpaired Student’s t-test was used to evaluate statistical significance. All primer sequences are listed within Supplementary Table 3.
Isolation of adipose SVF and flow cytometry
Adipose tissue from five P3 or P7 pups or one 6–8 weeks old male mouse were combined and minced with scissors in a 1.5 mL tube containing 100ul of digestion buffer (1X HBSS, 1.5% BSA, and 1 mg/mL collagenase D) and then transferred to a 50 mL Falcon tube containing 5 mL digestion buffer. The mixture was incubated in a 37°C shaking water bath for 30 mins or 1h. The solution of digested tissue was passed through a 100 μm cell strainer, diluted to 30 mL with 2% FBS/PBS, and centrifuged at 500 × g for 5 min. The supernatant was aspirated, and cells were washed once with 2% FBS/PBS and resuspended in blocking buffer (2% FBS/PBS containing anti-mouse CD16/CD32 Fc Block (1:200)). Primary antibodies were added to the cells in blocking buffer for 15 mins at 4°C in the dark. After incubation, the cells were washed once with 2% FBS/PBS and resuspended in 200 μl of 2% FBS/PBS for sorting. Cells were sorted for collection into 100% FBS using a BD Biosciences FACSAria cytometer (UTSW Flow Cytometry Core Facility). Flow cytometry plots were generated using FlowJo.
Primary antibodies and the working concentrations were as follows: CD45–PerCP/Cyanine 5.5 1:400 (Biolegend, clone 30-F11, no. 103132), CD31–PerCP/Cyanine 5.5 1:400 (Biolegend, clone 390, no. 102420), PDGFRβ-PE 1:75 (Biolegend, clone APB5, no. 136006), LY6C–APC/Cyanine7 1:400 (Biolegend, clone HK1.4, no. 128026), CD9–FITC 1:400 (Biolegend, clone MZ3, no. 124808), CD26(DPP4)-APC 1:400 (Biolegend, clone H194-112, #137807).
Single-cell RNA-sequencing and analysis
eWAT SVF from P3 or P7 male pups or 5 weeks old male mice were isolated and digested as described above and used immediately for single-cell RNA library preparation using the 10X Genomics Single Cell 3’ v3 kit according to the manufacturer’s instructions and as previously described 9. Sequencing was performed by the McDermott Center Next Generation Sequencing Core in UTSW. Cell Ranger software (v3.1.0) was used to perform demultiplexing, aligning reads, filtering, clustering, and gene expression analyses, using default parameters. GRCh38 was used as the genome reference for reads alignment and aggregation. Further analysis, including clustering, dimensionality reduction and differential gene expression analysis, was performed using Seurat 44. Cells with less than 200 genes and more than 6500 (P3), 5000 (P7) and 5500 (Adult) genes detected were removed. Genes expressed less than 3 cells were removed. Cells with percentage of mitochondrial gene expression greater than 20% and those with percentage of ribosome gene expression less than 5% were also removed. The final input data for Seurat after the quality control and filtering were composed of 23320 cells for P3, 18585 cells for P7 and 11769 for adults. Data from different developmental stages were integrated using SC Transform 45. Cell clusters were then identified for the integrated data using the top 30 dimensions from the principal component analysis (PCA) at the resolution of 1. Cluster marker genes were identified using “FindAllMarkers” function in Seurat. Differential gene expression analysis between developmental stages or cell types was done using “FindMarkers” function in Seurat. Cell types were annotated manually using cell type specific marker genes collected from the literature (citations maybe). Clusters with ambiguous or unknown annotation were removed, resulting in 11553 cells for P3, 14538 cells for P7 and 10442 cells for adults. Trajectory analysis was performed for APC, FIP, SMLC, MLC, and committed preadipocytes using Slingshot (v1.8.0) 46. All Single-cell mRNA-seq data have been deposit to GEO (Accession number: GSE180987).
Bulk mRNA-sequencing and analysis
RNA was isolated using RNAqueous-Micro Total RNA Isolation Kit (Thermo Fisher Scientific). mRNA libraries were prepared using the NEB Poly(A) mRNA Magnetic Isolation Module (NEB #E7490) and NEBNext Ultra II RNA Library Prep Kit for Illumina (NEB #E7770). Indices used were from NEBNext Multiplex Oligos for Illumina (NEB #7335, E7500, E7710). Sequencing was performed by the McDermott Center Next Generation Sequencing Core in UTSW. FASTQ files were aligned by HISAT2 and differential gene expression was determined using DEseq2. All Bulk mRNA-seq data have been deposit to GEO (Accession number: GSE181245).
Cell culture and cellular assays
Sorted PDGFRβ+ sub-populations cells were plated at a density of 4 × 10⁴ cells/well in a 48-well plate or 2 × 10⁴ cells/well in a 96-well plate containing 2% ITS growth media [consisting of 60% low-glucose DMEM, 40% MCDB-201 medium, 2% FBS, 1% ITS premix (Insulin–Transferrin–Selenium) (BD Biosciences, no. 354352), 0.1 mM l-ascorbic acid-2-2phosphate (Sigma, no. A8960-5G), 10 ng ml–1 FGF basic (R&D systems, no.3139-FB-025/CF), penicillin–streptomycin and gentamicin] and incubated at 37°C in 10% CO2.
For in vitro adipocyte differentiation assay, cells were grown to confluence in 2% ITS growth media and switched to induction media (growth media supplemented with 1 mM dexamethasone, 0.5 mM isobutylmethyxanthine, ±1 mM rosiglitazone) for 48 hrs. After 48 hrs., cultures were maintained in 2% ITS growth media. Media were changed every two days until harvesting.
For conditioned media assay, donor cells and recipient cells were derived simultaneously using FACS and plated in separate plates. Media from equally confluent cultures of APCs, FIPs, P7 APCs, P7 FIPs was harvested and placed onto APCs or P7 APCs beginning 48 hrs. after initial plating in a 1:1 ratio with 2% FBS in ITS media. Cells were harvested at the indicated time points for RNA expression analysis. Images were obtained using a Leica DMIL LED microscope and a Leica DFC3000g camera. For LPS treatment, cells were grown to confluence and starved overnight with serum-free ITS medium. Cells were then treated with 100ng/ml LPS or PBS for 2 hrs. prior to harvest. For TNFα treatment, cells were grown to confluence and starved overnight with serum-free ITS medium. Cells were then treated with 20ng/ml TNFa or PBS, for 2 hrs. prior to harvest. For in vitro Ikk2CA expression, cells were grown to confluence and then serum starved starved overnight in serum-free ITS medium. Cells were then treated with 5 μM Doxcycline or PBS for 8 hrs prior to harvest.
Oil red O staining
Cells were pre-fixed in 4% PFA for 15 min at room temperature and then washed twice with ddH2O. Following 1 hour of additional fixation, cells were rinsed with ddH2O six times and then incubated in Oil Red O working solution (2 g Oil red O in 60% isopropanol) for 10 minures. Stained cells were then washed three times with ddH2O and then bright field images were acquired using Keyence BZ-X710 Microscope.
Cell transplantation assays
0.8~1 × 10⁵ cells (P7 APCs or P7FIPs) collected by FACS were suspended in 100 mL transplantation media (50% Matrigel in PBS, supplemented with 2 ng/mL FGF) and injected subcutaneously into the remnant inguinal WAT region of 3-month-old lipodystrophic mice (Adiponectin-Cre; PpargloxP/loxP). Three weeks later, the remnant inguinal WAT depots were harvested for histological analysis.
Glucose tolerance tests.
For glucose tolerance tests, overnight fasted mice were injected i.p. with glucose (Sigma, no. G7021) at the dose of 1 g per kg (body weight). Blood glucose concentrations were determined using Bayer Contour glucometers.
Serum measurements.
Serum levels of ADIPONECTIN and TG were measured using the mouse adiponectin ELISA (Millipore, no. EZMADP-60K) and TG kit, respectively. Assays were performed according to manufacturer instructions.
Statistical analysis
Statistical methods were not used to predetermine sample size. The experiments were not randomized, and the investigators were not blinded. All data were expressed as the mean ±SEM. GraphPad Prism 9.1.2 (GraphPad Software, Inc., La Jolla, CA, USA) were used to perform the statistical analyses. For comparisons between two independent groups, unpaired Student’s t-test was used and p<0.05 was considered statistically significant. All statistical analyses were performed using Microsoft Excel or GraphPad Prism 9.1.2 (GraphPad Software). No data points or animals were excluded from any of the analyses. All statistical information, including P values, samples sizes and repetitions, are provided in the Source Data associated with each figure.
Data availability
All animal models and reagents are freely available to investigators upon reasonable request. scRNA-seq data have been deposited to Gene Expression Omnibus (GEO Accession GSE180987). Bulk-mRNA-seq data have been deposited to Gene Expression Omnibus (GEO Accession GSE181245).
Extended Data
Extended Data Figure 1. Cellular composition of developing eWAT.
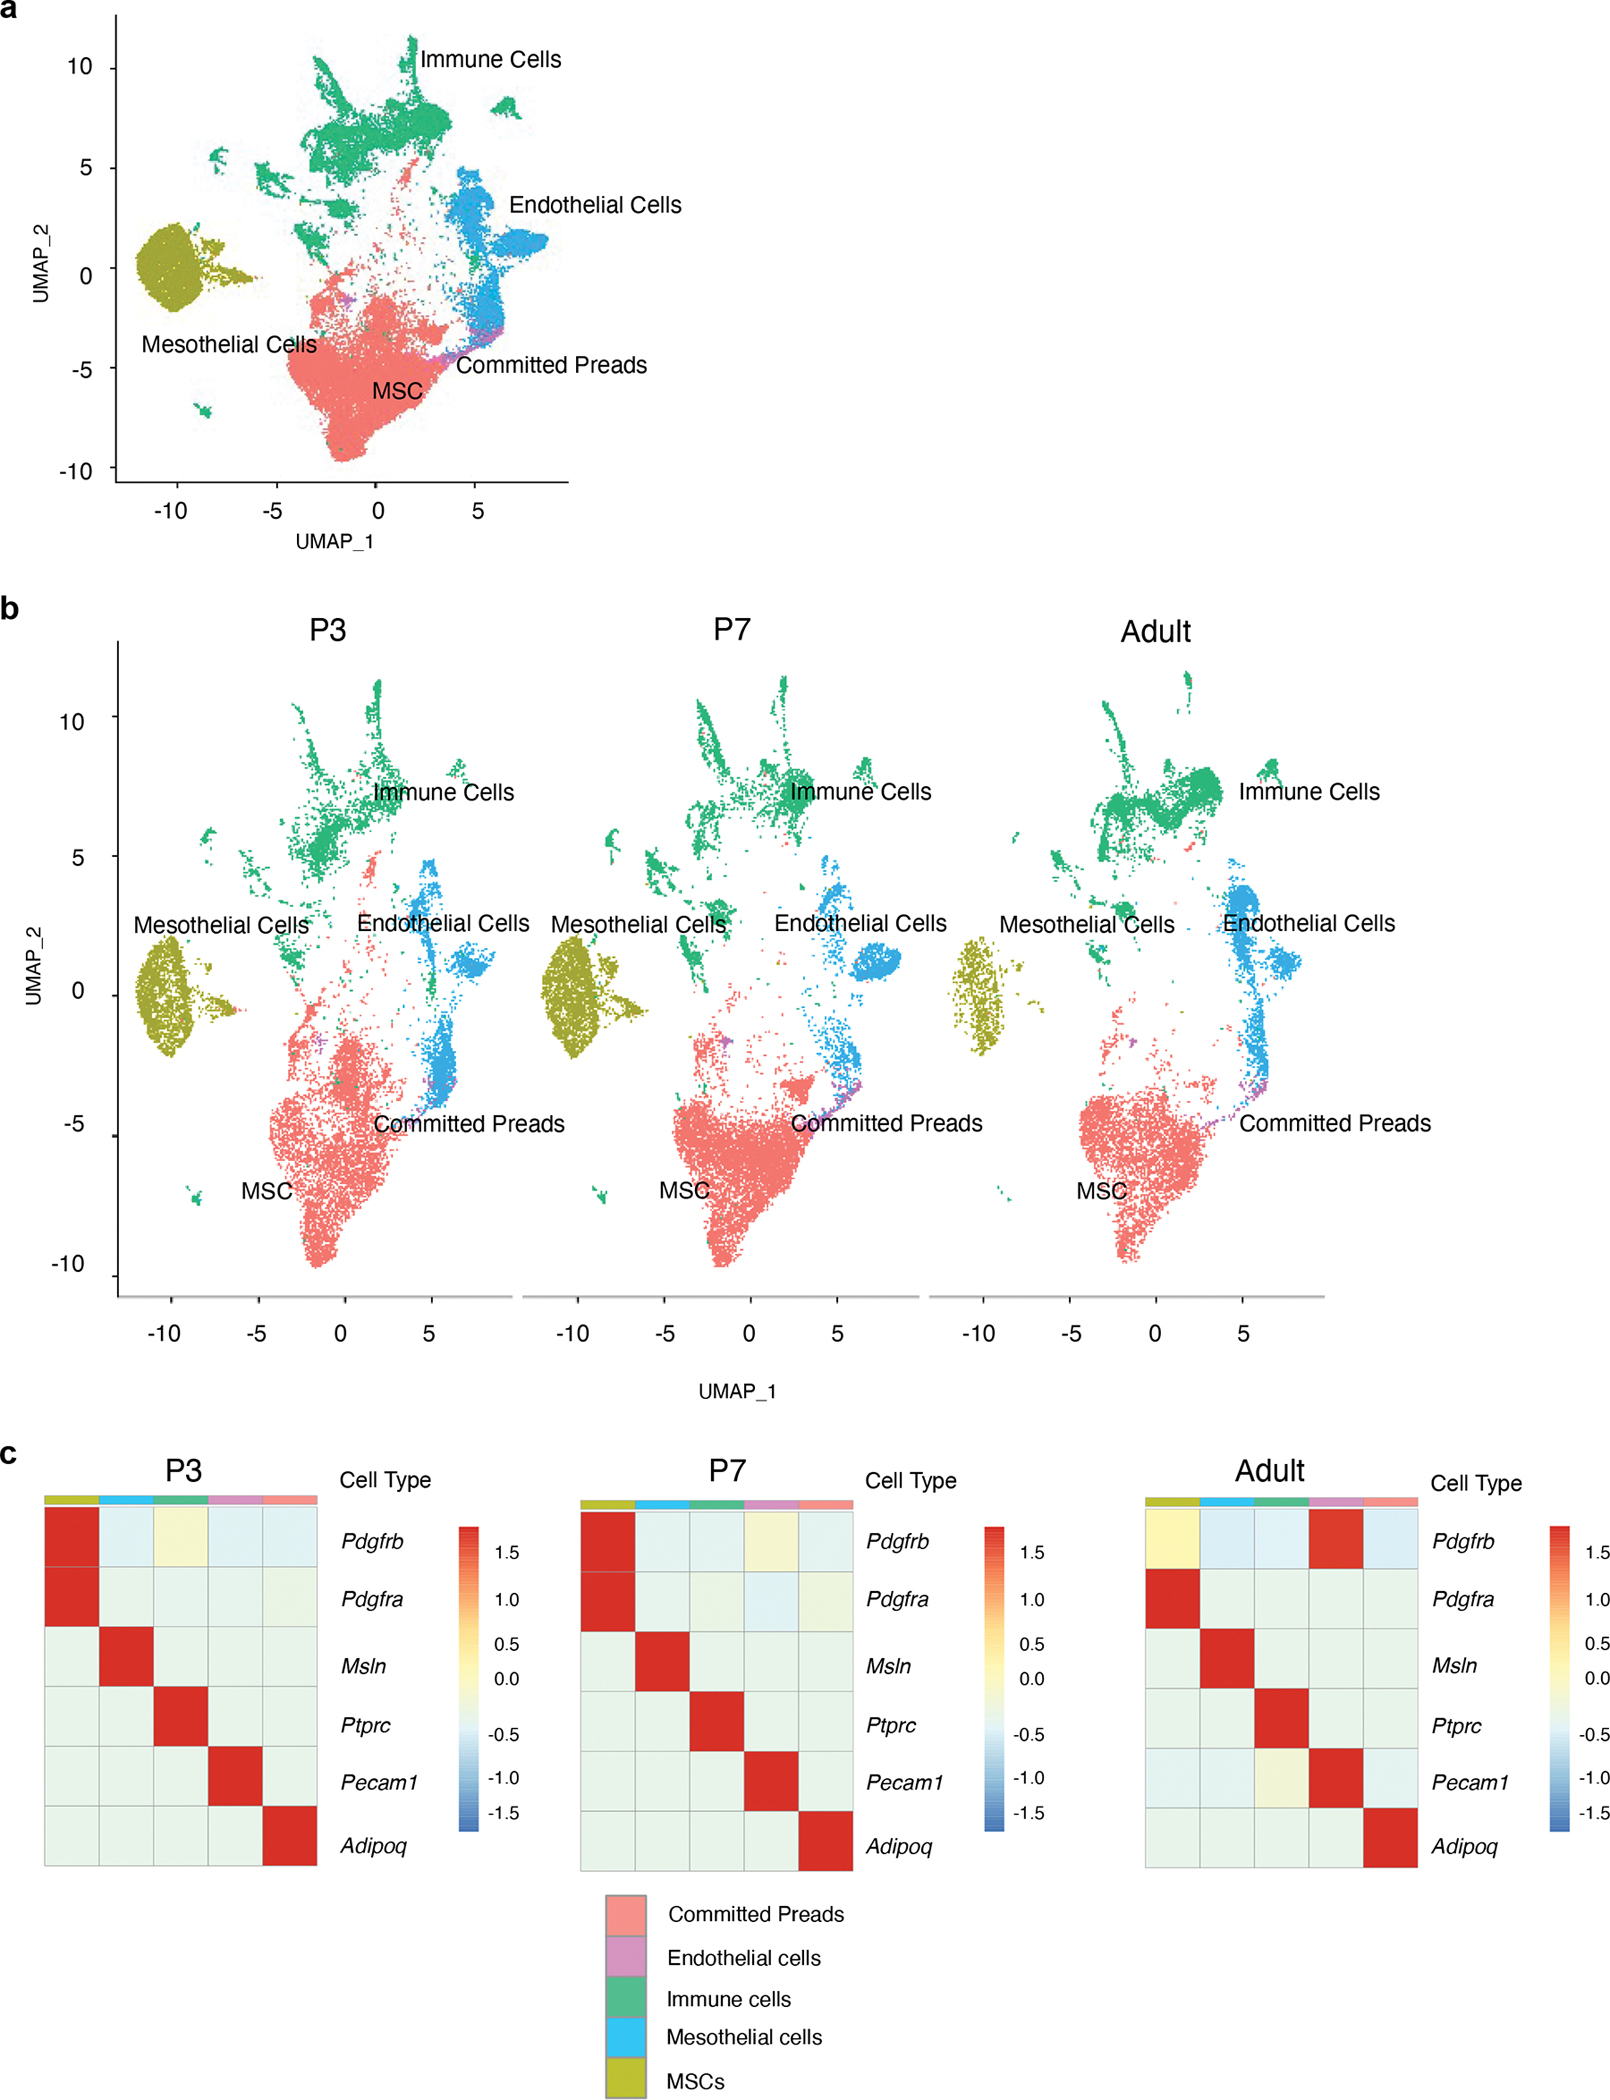
a) Cell clusters of merged transcriptional profiles of eWAT stromal-vascular cells harvested at P3 (n= 11553), P7 (n= 14538) and Adult (5-weeks old, n= 10442). Unsupervised clustering identifies distinct lineages corresponding to mesenchymal stromal cells (MSC), mesothelial cells, immune cells, endothelial cells, and committed preadipocytes (Preads).
b) Cell clusters from a) at each developmental stage.
c) Expression of selected signature genes defining each cell cluster depicted in a) and b).
Extended Data Figure 2. Expression of preadipocyte markers in perinatal PDGFRβ+ subpopulations and committed preadipocytes.
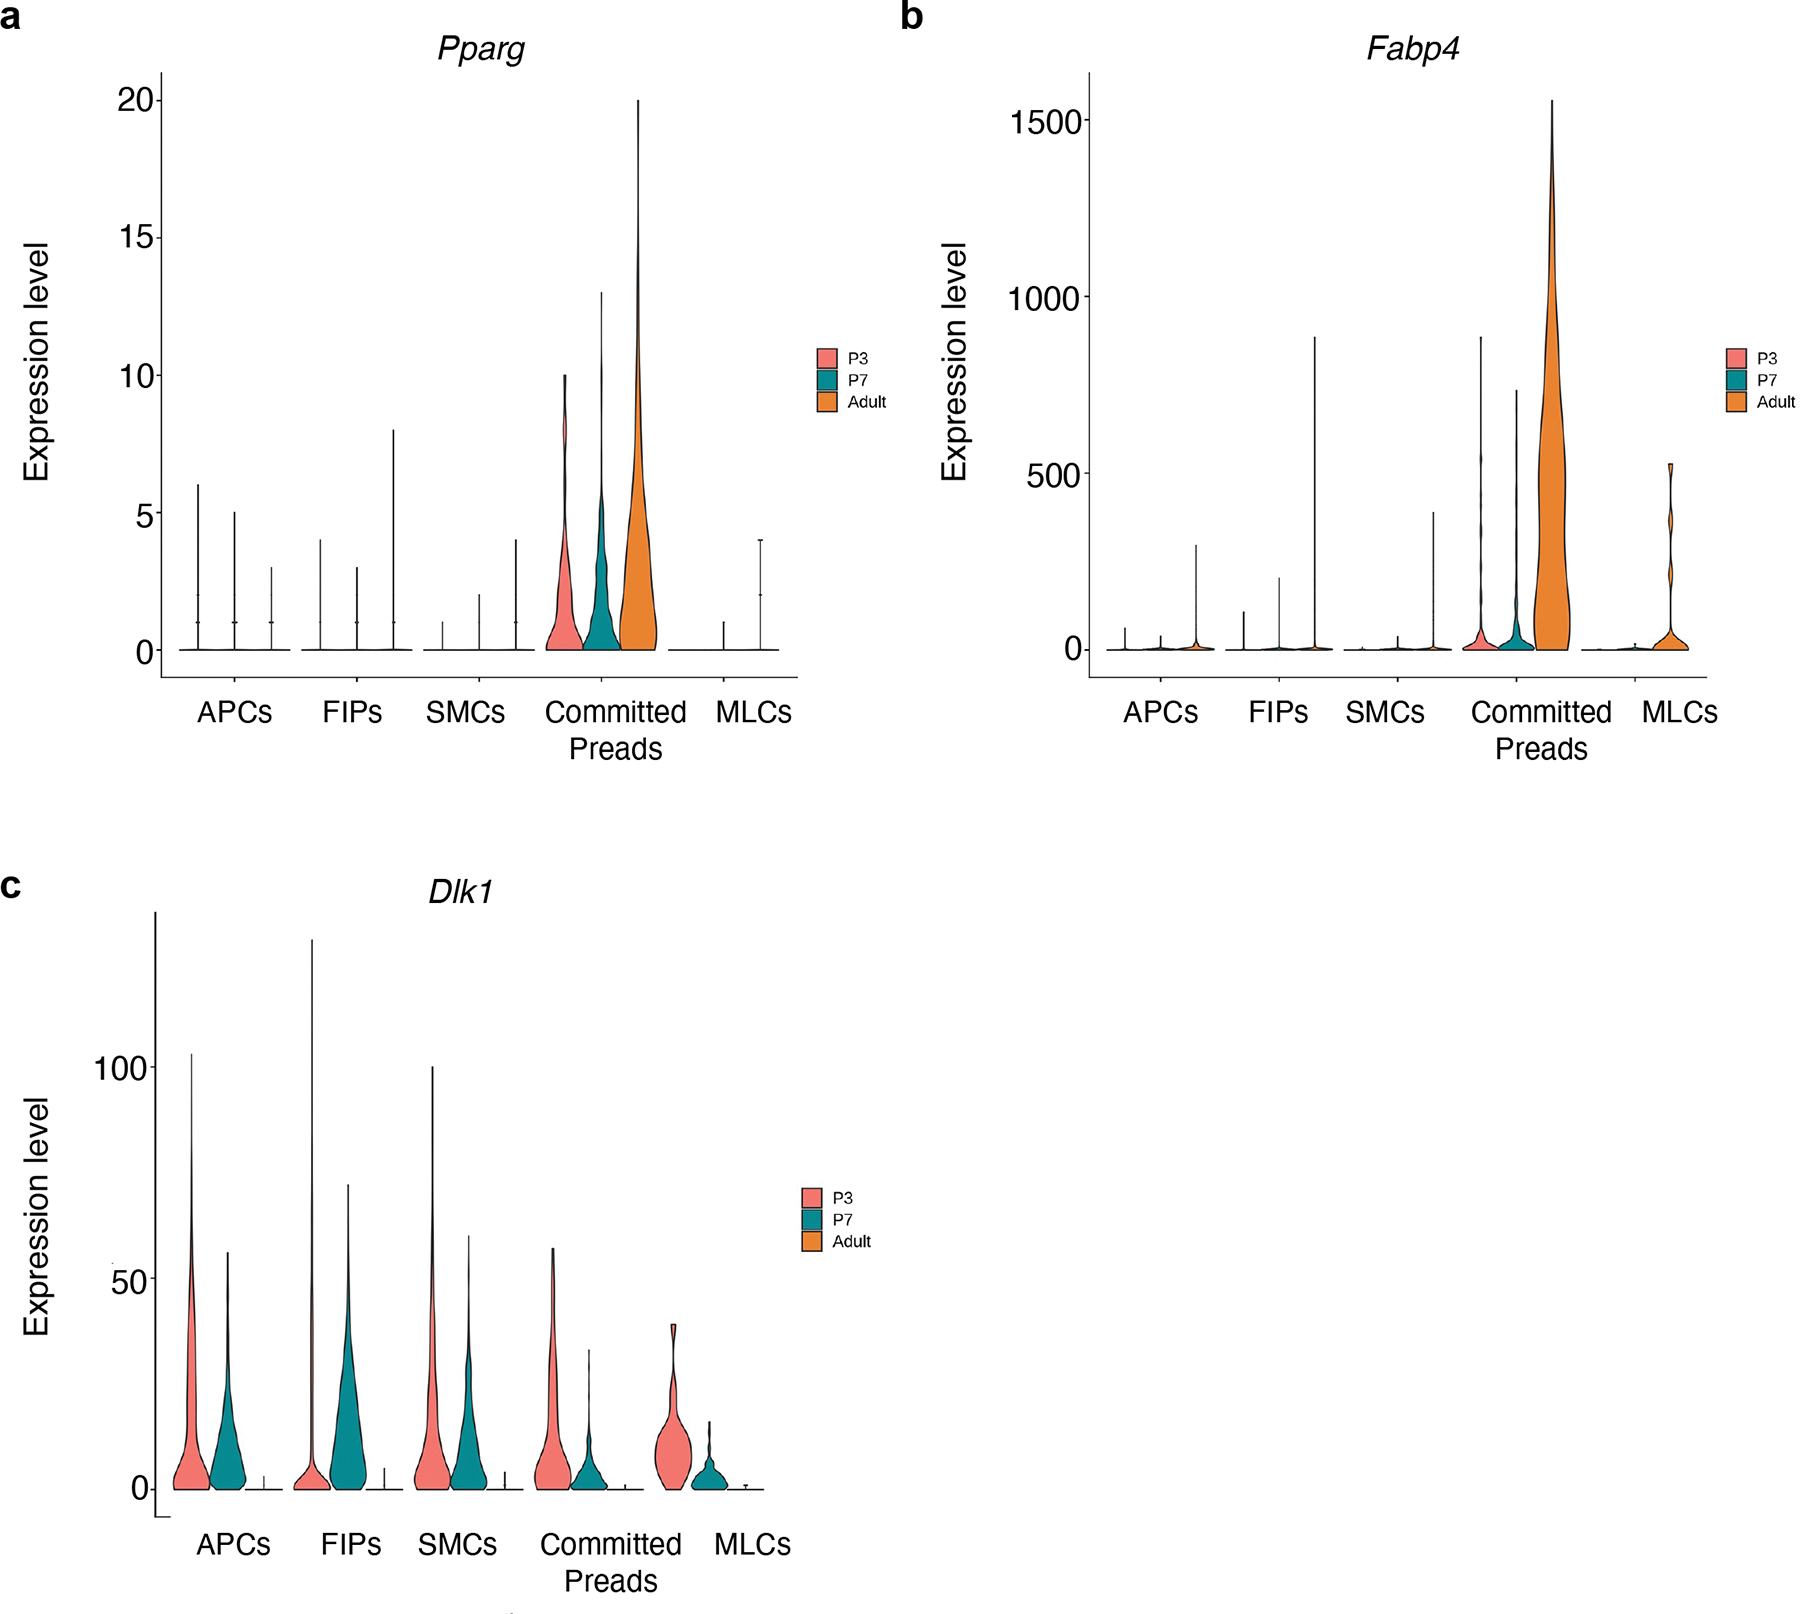
a) Pparg expression in Pdgfrb+ sub-populations and committed preadipocytes.
b) Fabp4 expression in Pdgfrb+ sub-populations and committed preadipocytes.
c) Dlk1 expression in Pdgfrb+ sub-populations and committed preadipocytes.
Extended Data Figure 3. Subclustering analysis of Perinatal FIPs.
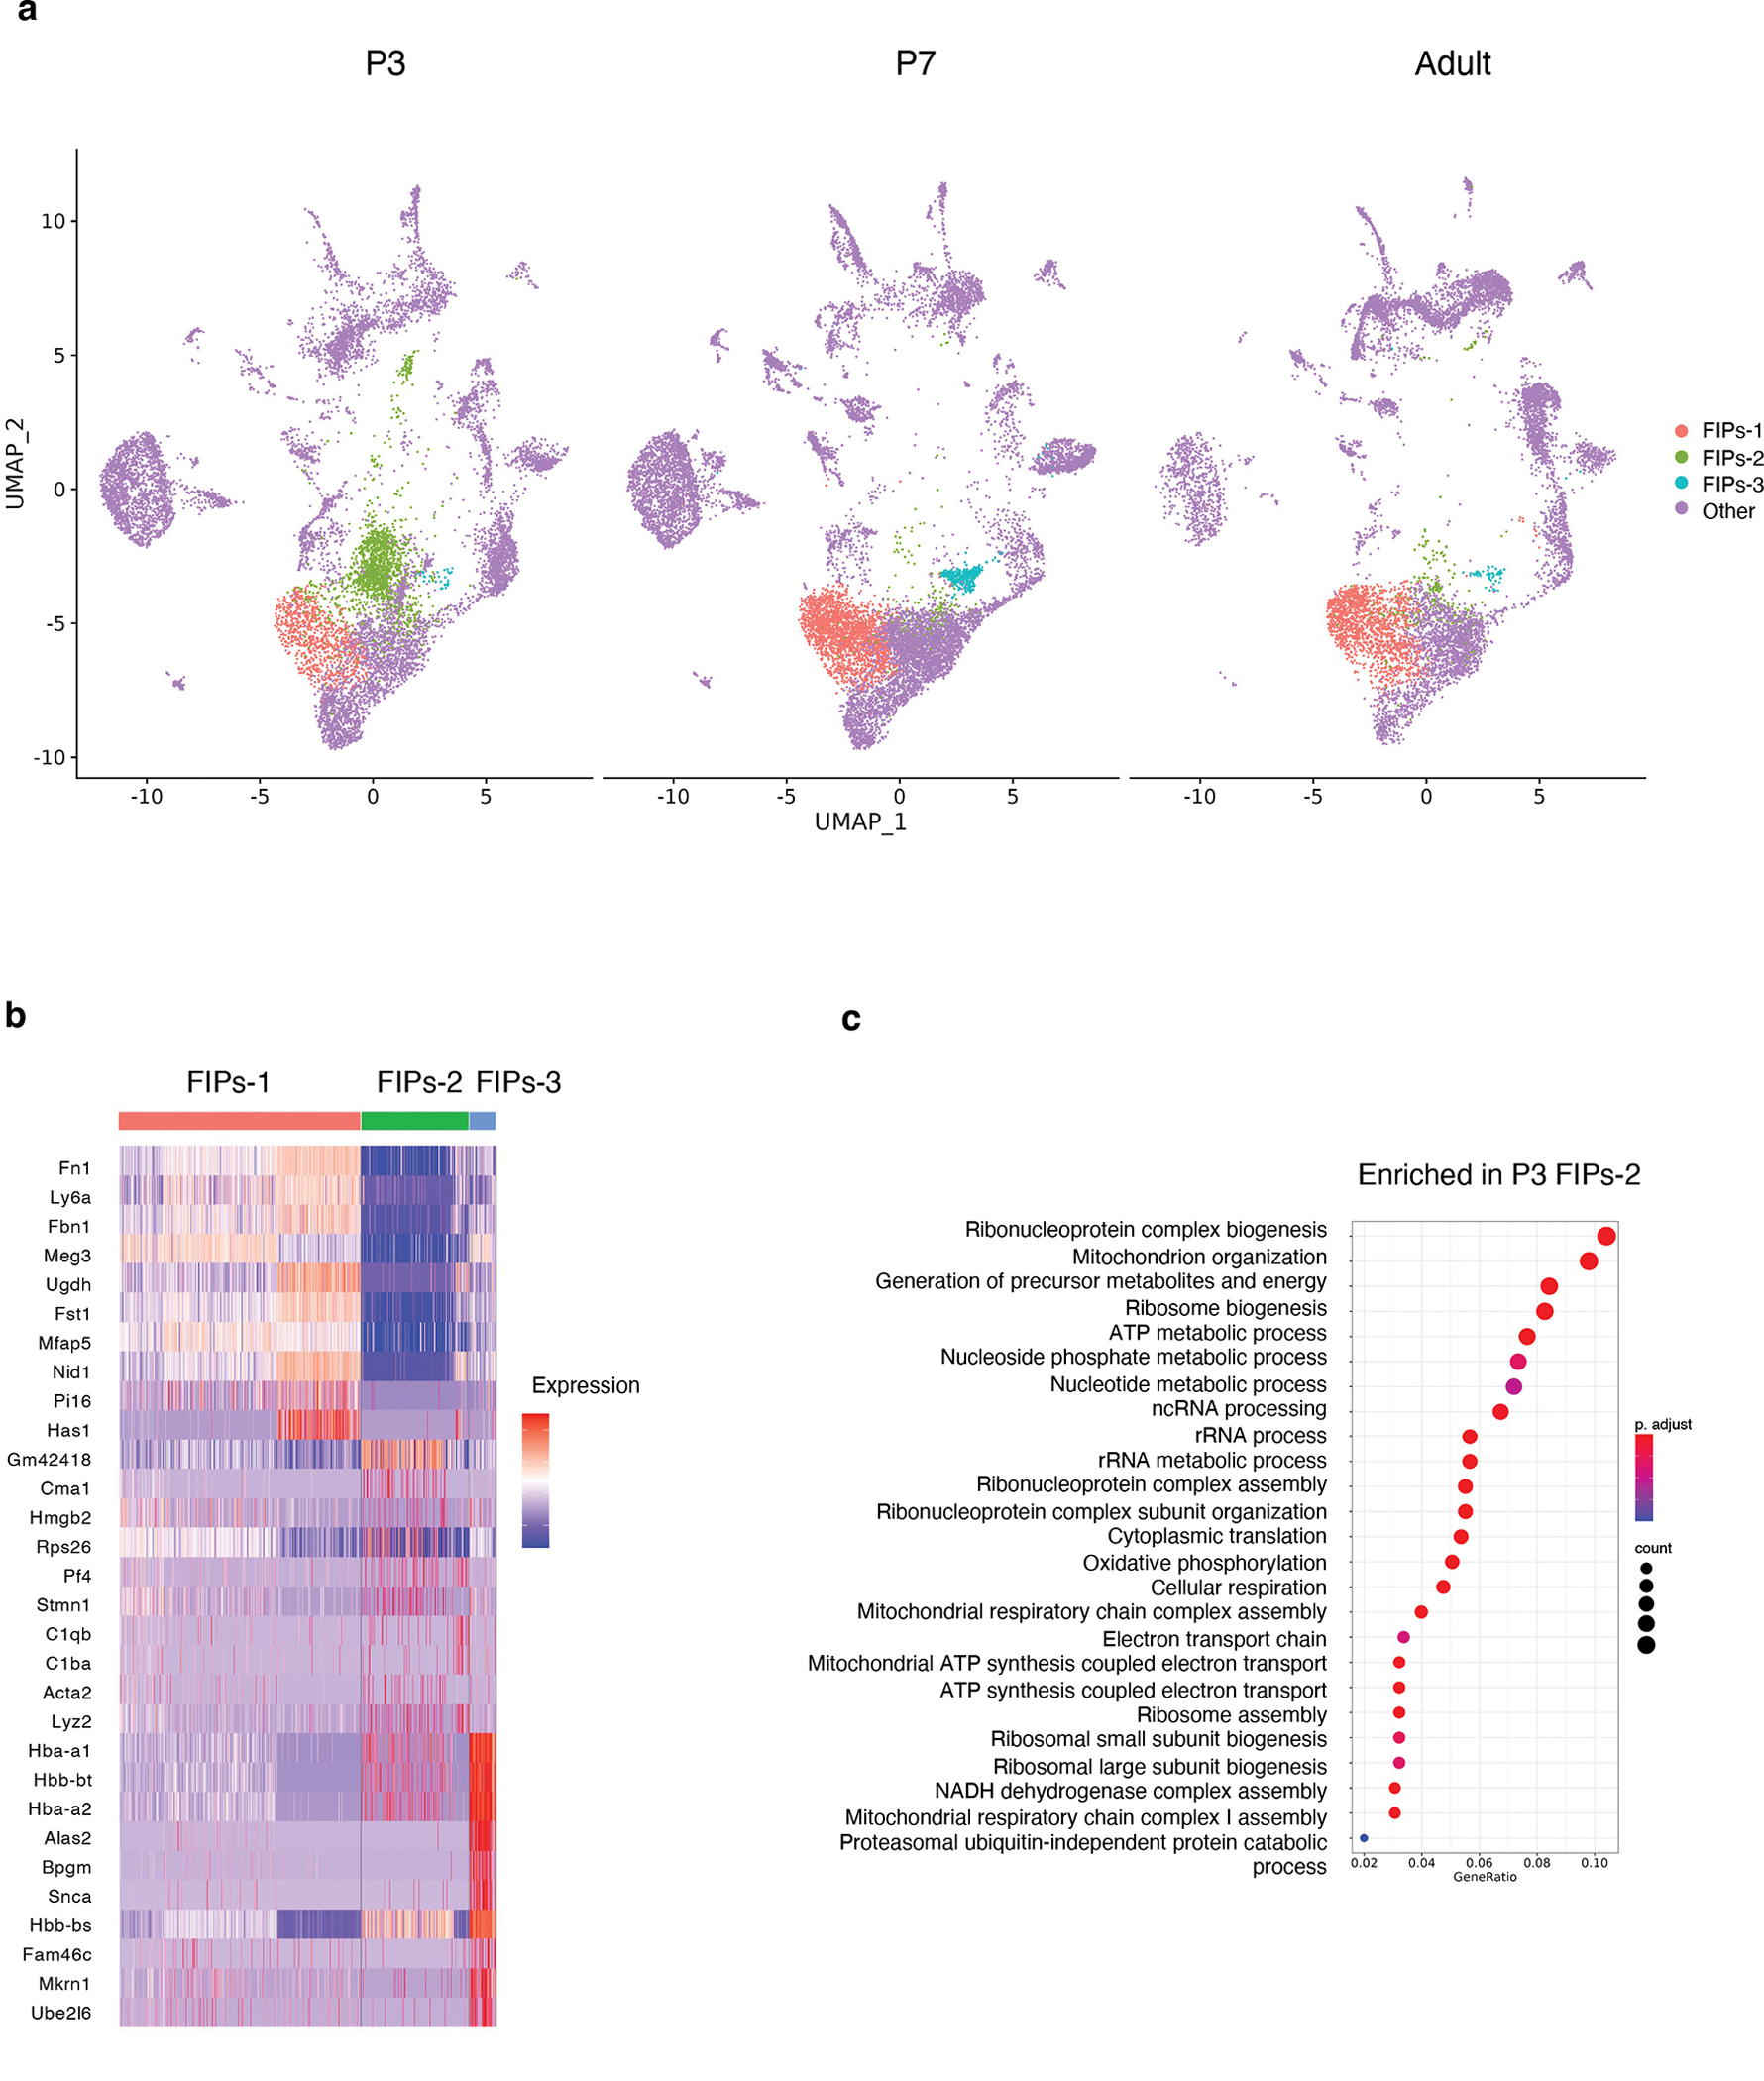
a) Subclusters of FIPs (designated as FIPs-1, FIPs-2, and FIPs-3) at each eWAT developmental stage.
b) Expression of top differentially expressed genes distinguishing FIPs sub-clusters 1–3.
c) Gene signatures enriched in P3 FIPs-2 as determined by GSEA.
Extended Data Figure 4. FACS strategy for isolation of perinatal eWAT Pdgfrb+ sub-populations.
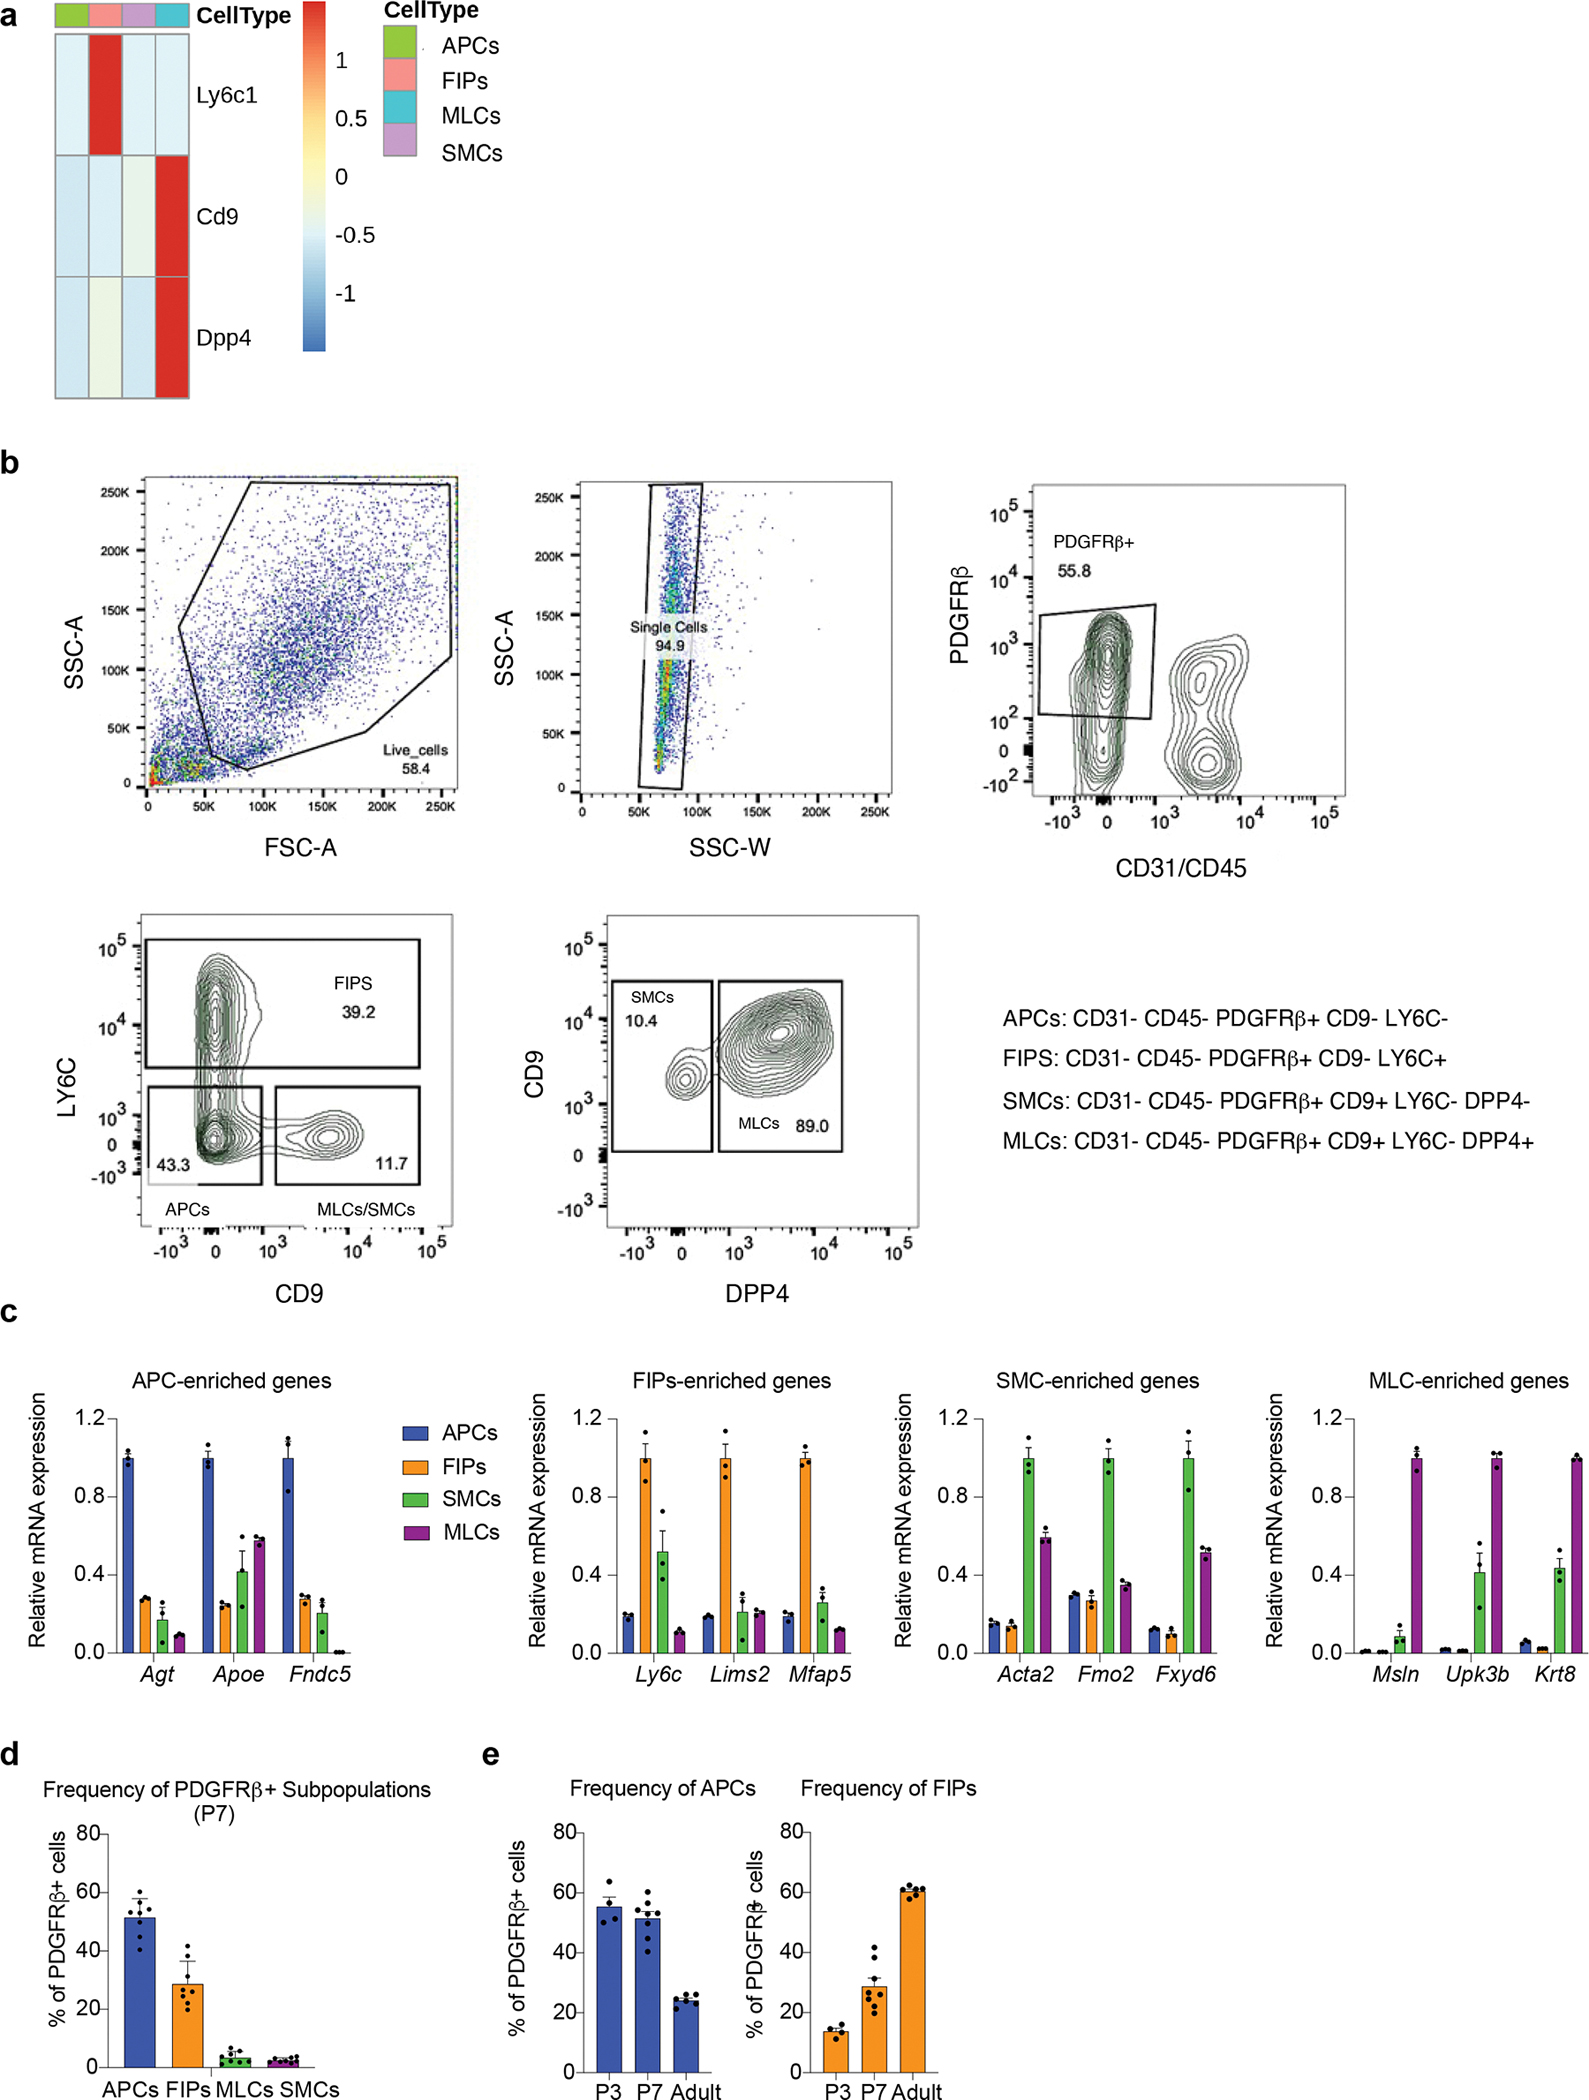
a) Expression of marker genes used for FACS in the single cell clusters.
b) Gating strategy for isolating P7 Pdgfrb+ sub-populations. After live cell and singlet selection, CD31−Cd45− (Lin−) PDGFRβ+ cells are selected. Pdgfrb+ sub-populations can then be separated based on LY6C, CD9, and DPP4, expression.
c) Validation of the sorting strategy: qPCR analysis of the expression of genes identified by scRNA-seq as markers of P7 Pdgfrb+ sub-populations. n=3 for each group.
d) Bar graph depicting the relative frequency of individual PDGFRβ+ subpopulations amongst total eWAT PDGFRβ+ cells based on flow cytometry analysis. n=8 for each group.
e) Bar graph depicting the relative frequency of APCs and FIPs amongst total eWAT PDGFRβ+ cells based on flow cytometry analysis across each developmental stage (P3, P7, Adult). n=4–8 for each group.
Extended Data Figure 5. Bulk-mRNA-seq reveals distinct global transcriptomes of P7 eWAT PDGFRβ+ subpopulations.
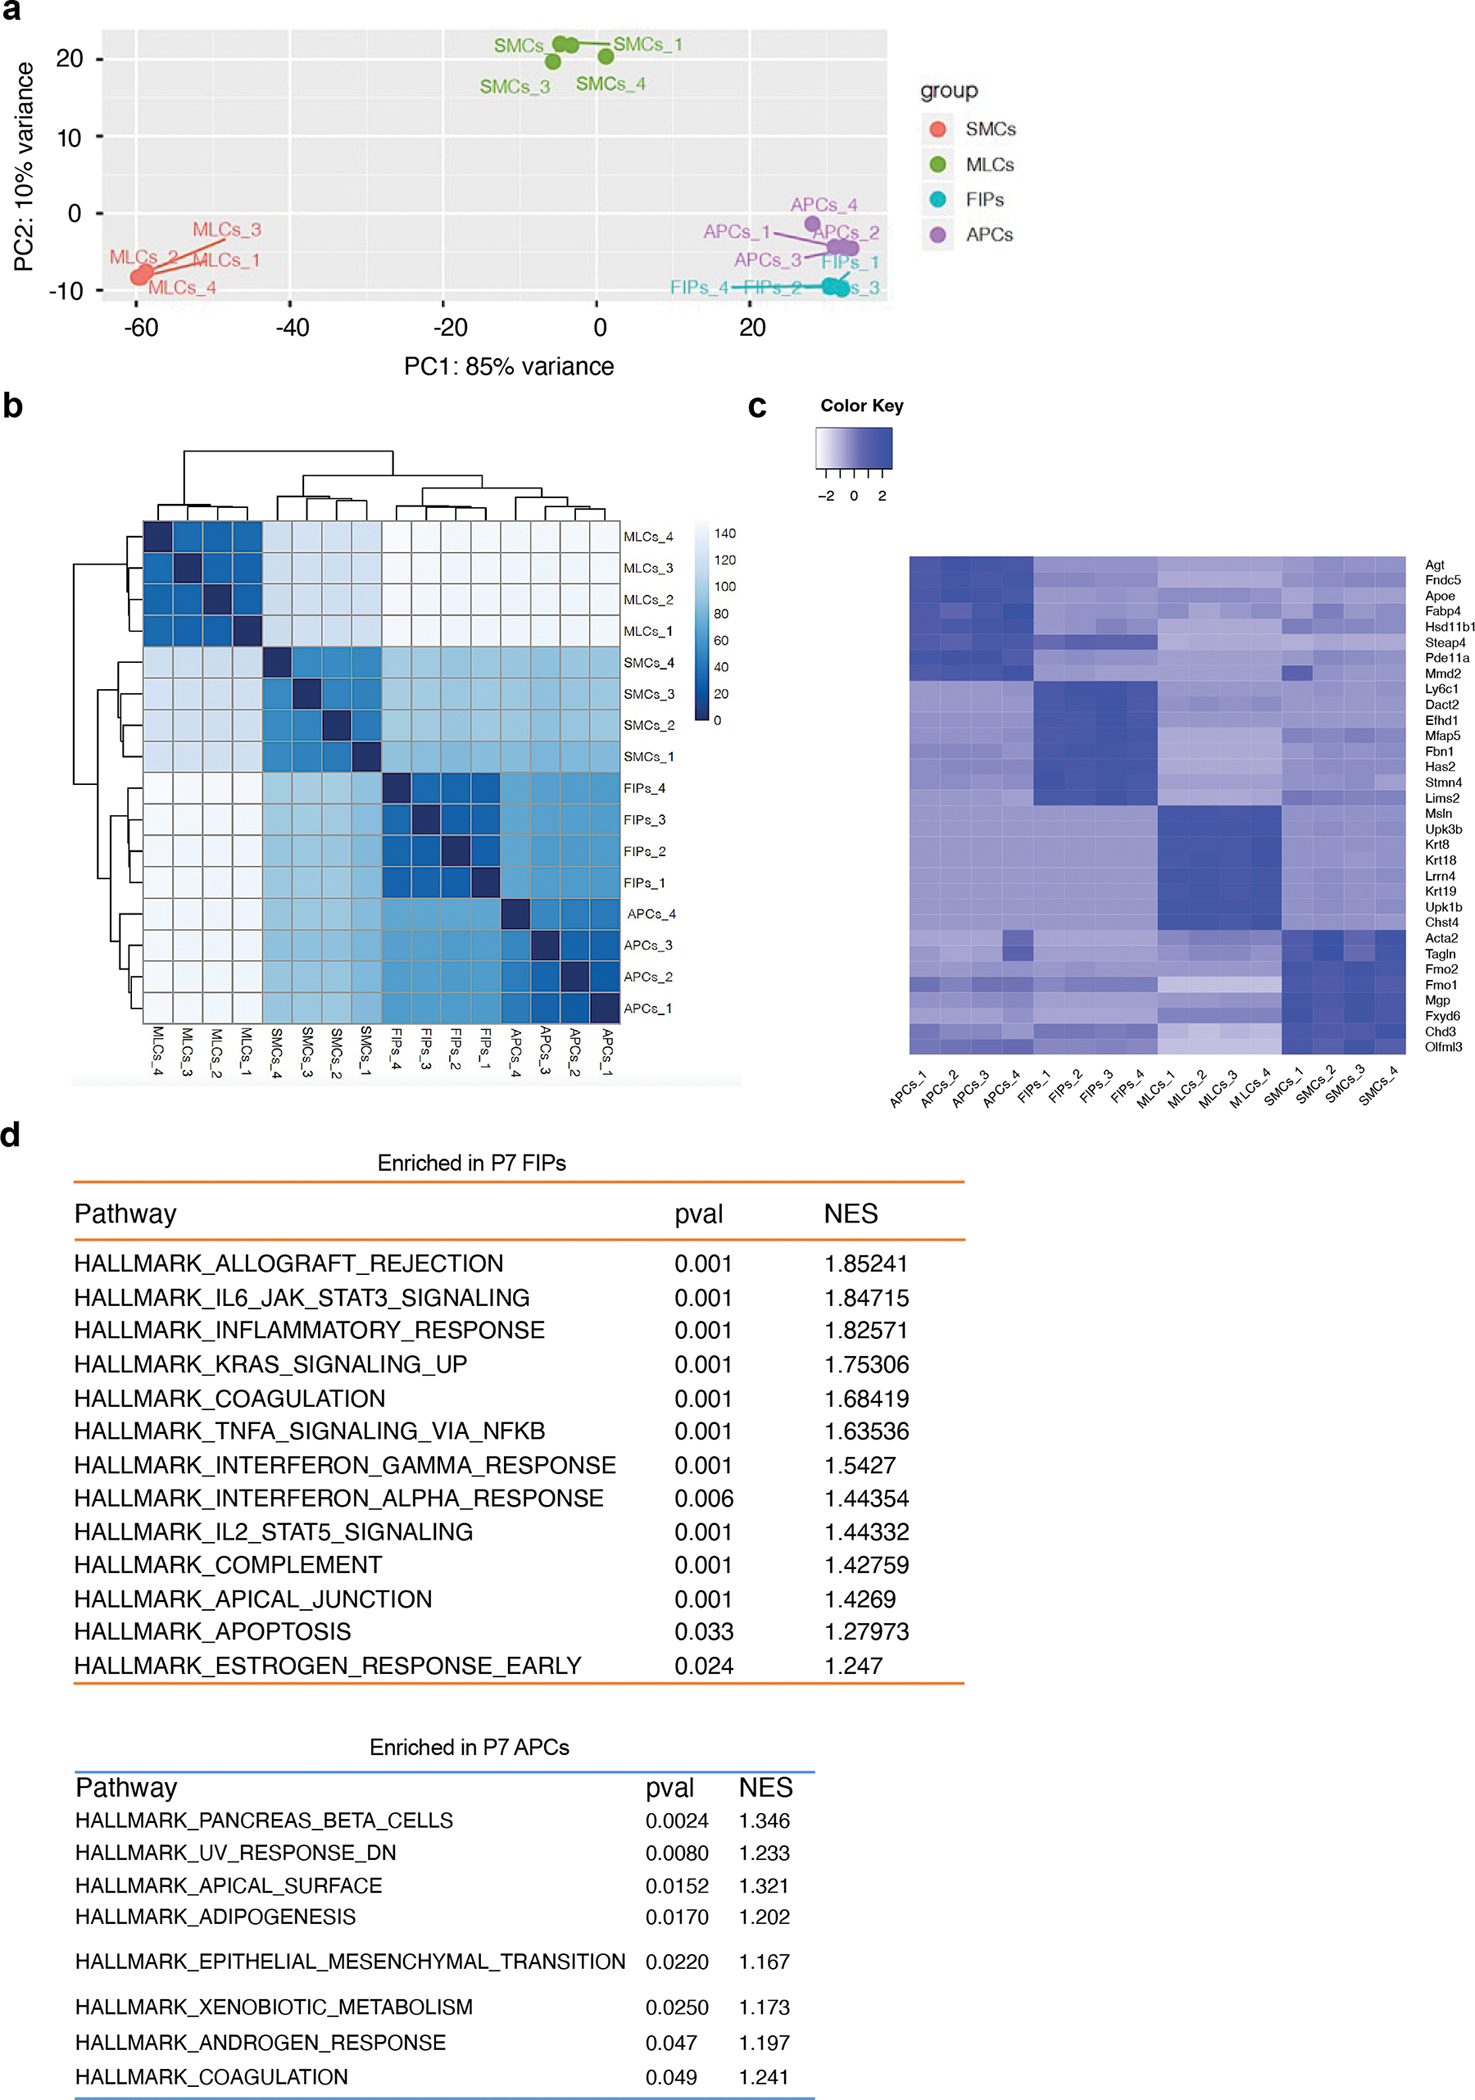
a) Principal component analysis (PCA) of global transcriptomes obtained by bulk-mRNA-seq analysis.
b) Sample clustering based on global transcriptomes obtained by bulk-mRNA-seq analysis.
c) Heatmap depicting the expression of top 10 signature genes defining each P7 PDGFRβ+ sub-populations. Expression normalized by z-score.
d) GSEA reveals gene signatures/pathways differentially expressed between P7 APCs and P7 FIPS. Pathways of statistical significance (Pval < 0.05) are shown. NES = Normalized Enrichment Score.
Extended Data Figure 6. Pro-inflammatory responses of P7 FIPS.
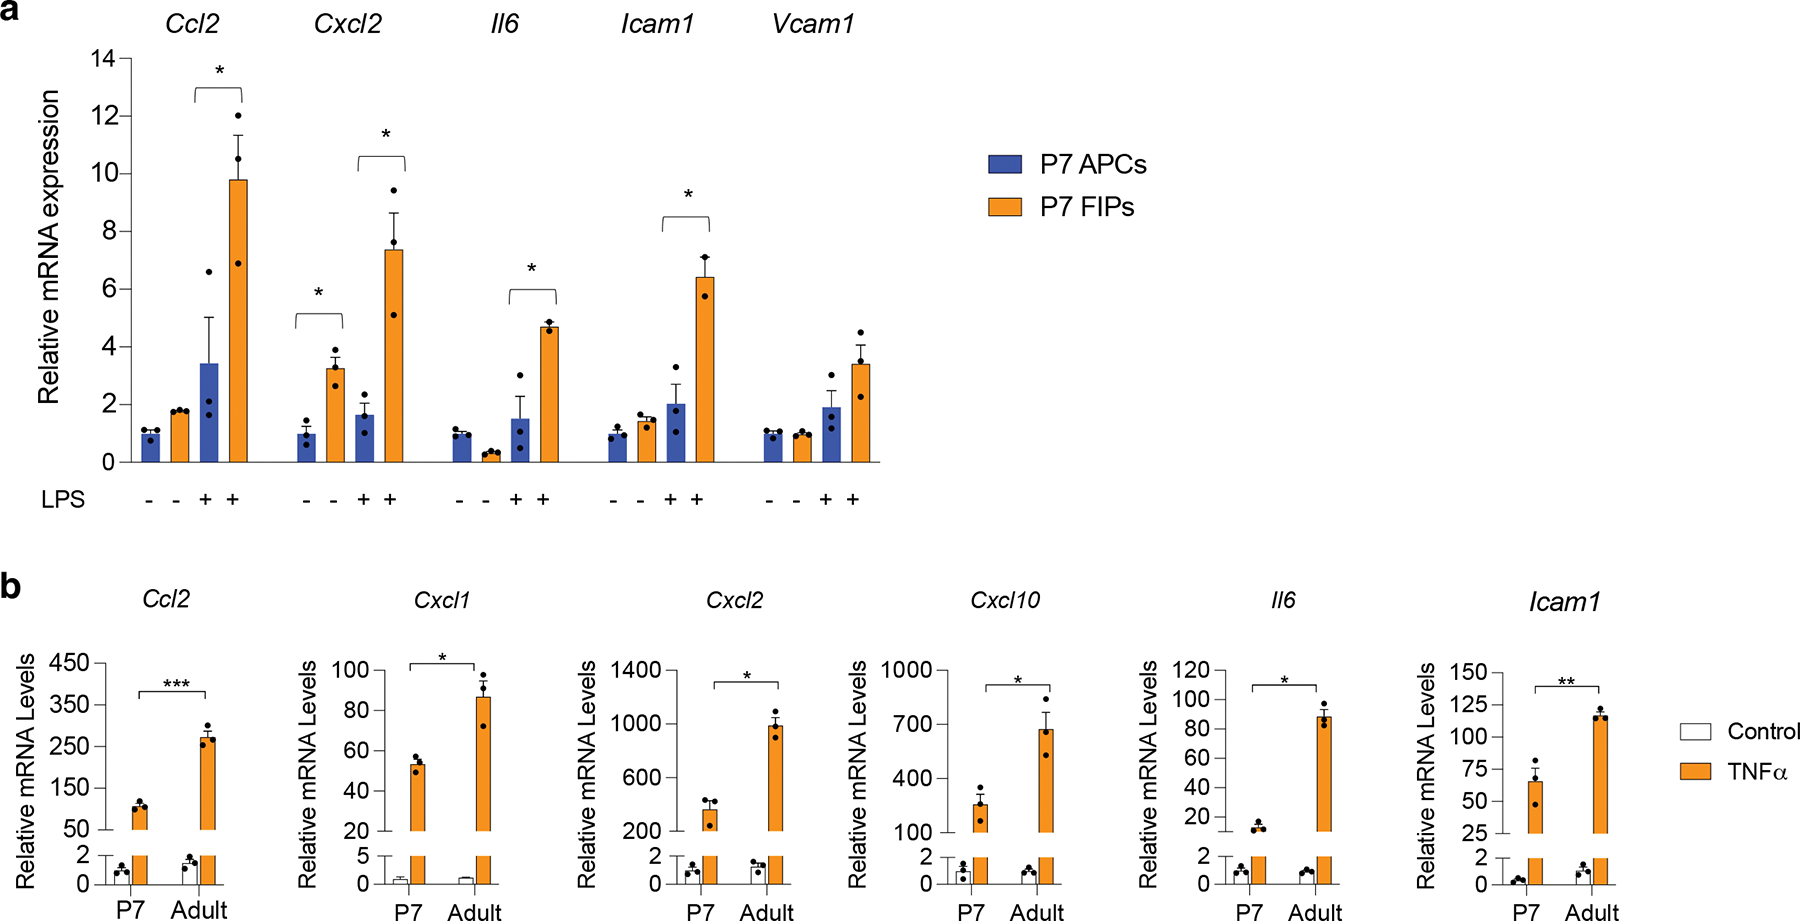
a) mRNA levels of indicated proinflammatory genes in cultured P7 APCs and P7 FIPs treated with PBS or LPS (100ng/ml) for 2 hours. n=3 for each group. Bars represent ± SEM. * denotes p<0.05 by student t-test, ** denotes p<0.01, *** denotes p<0.001.
b) mRNA levels of indicated proinflammatory genes in P7 FIPs and adult (5 weeks-old) FIPs treated with PBS or TNFα (20ng/ml) for 2 hours. n=3 for each group. Bars represent ± SEM. * denotes p<0.05 by student t-test, ** denotes p<0.01, *** denotes p<0.001.
Exact p values and numbers of repetitions can be found in Source Data Extended Data Figure 6.
Extended Data Figure 7. Transient perinatal Pparg overexpression has no apparent long-term effect on APCs differentiation capacity in vitro.
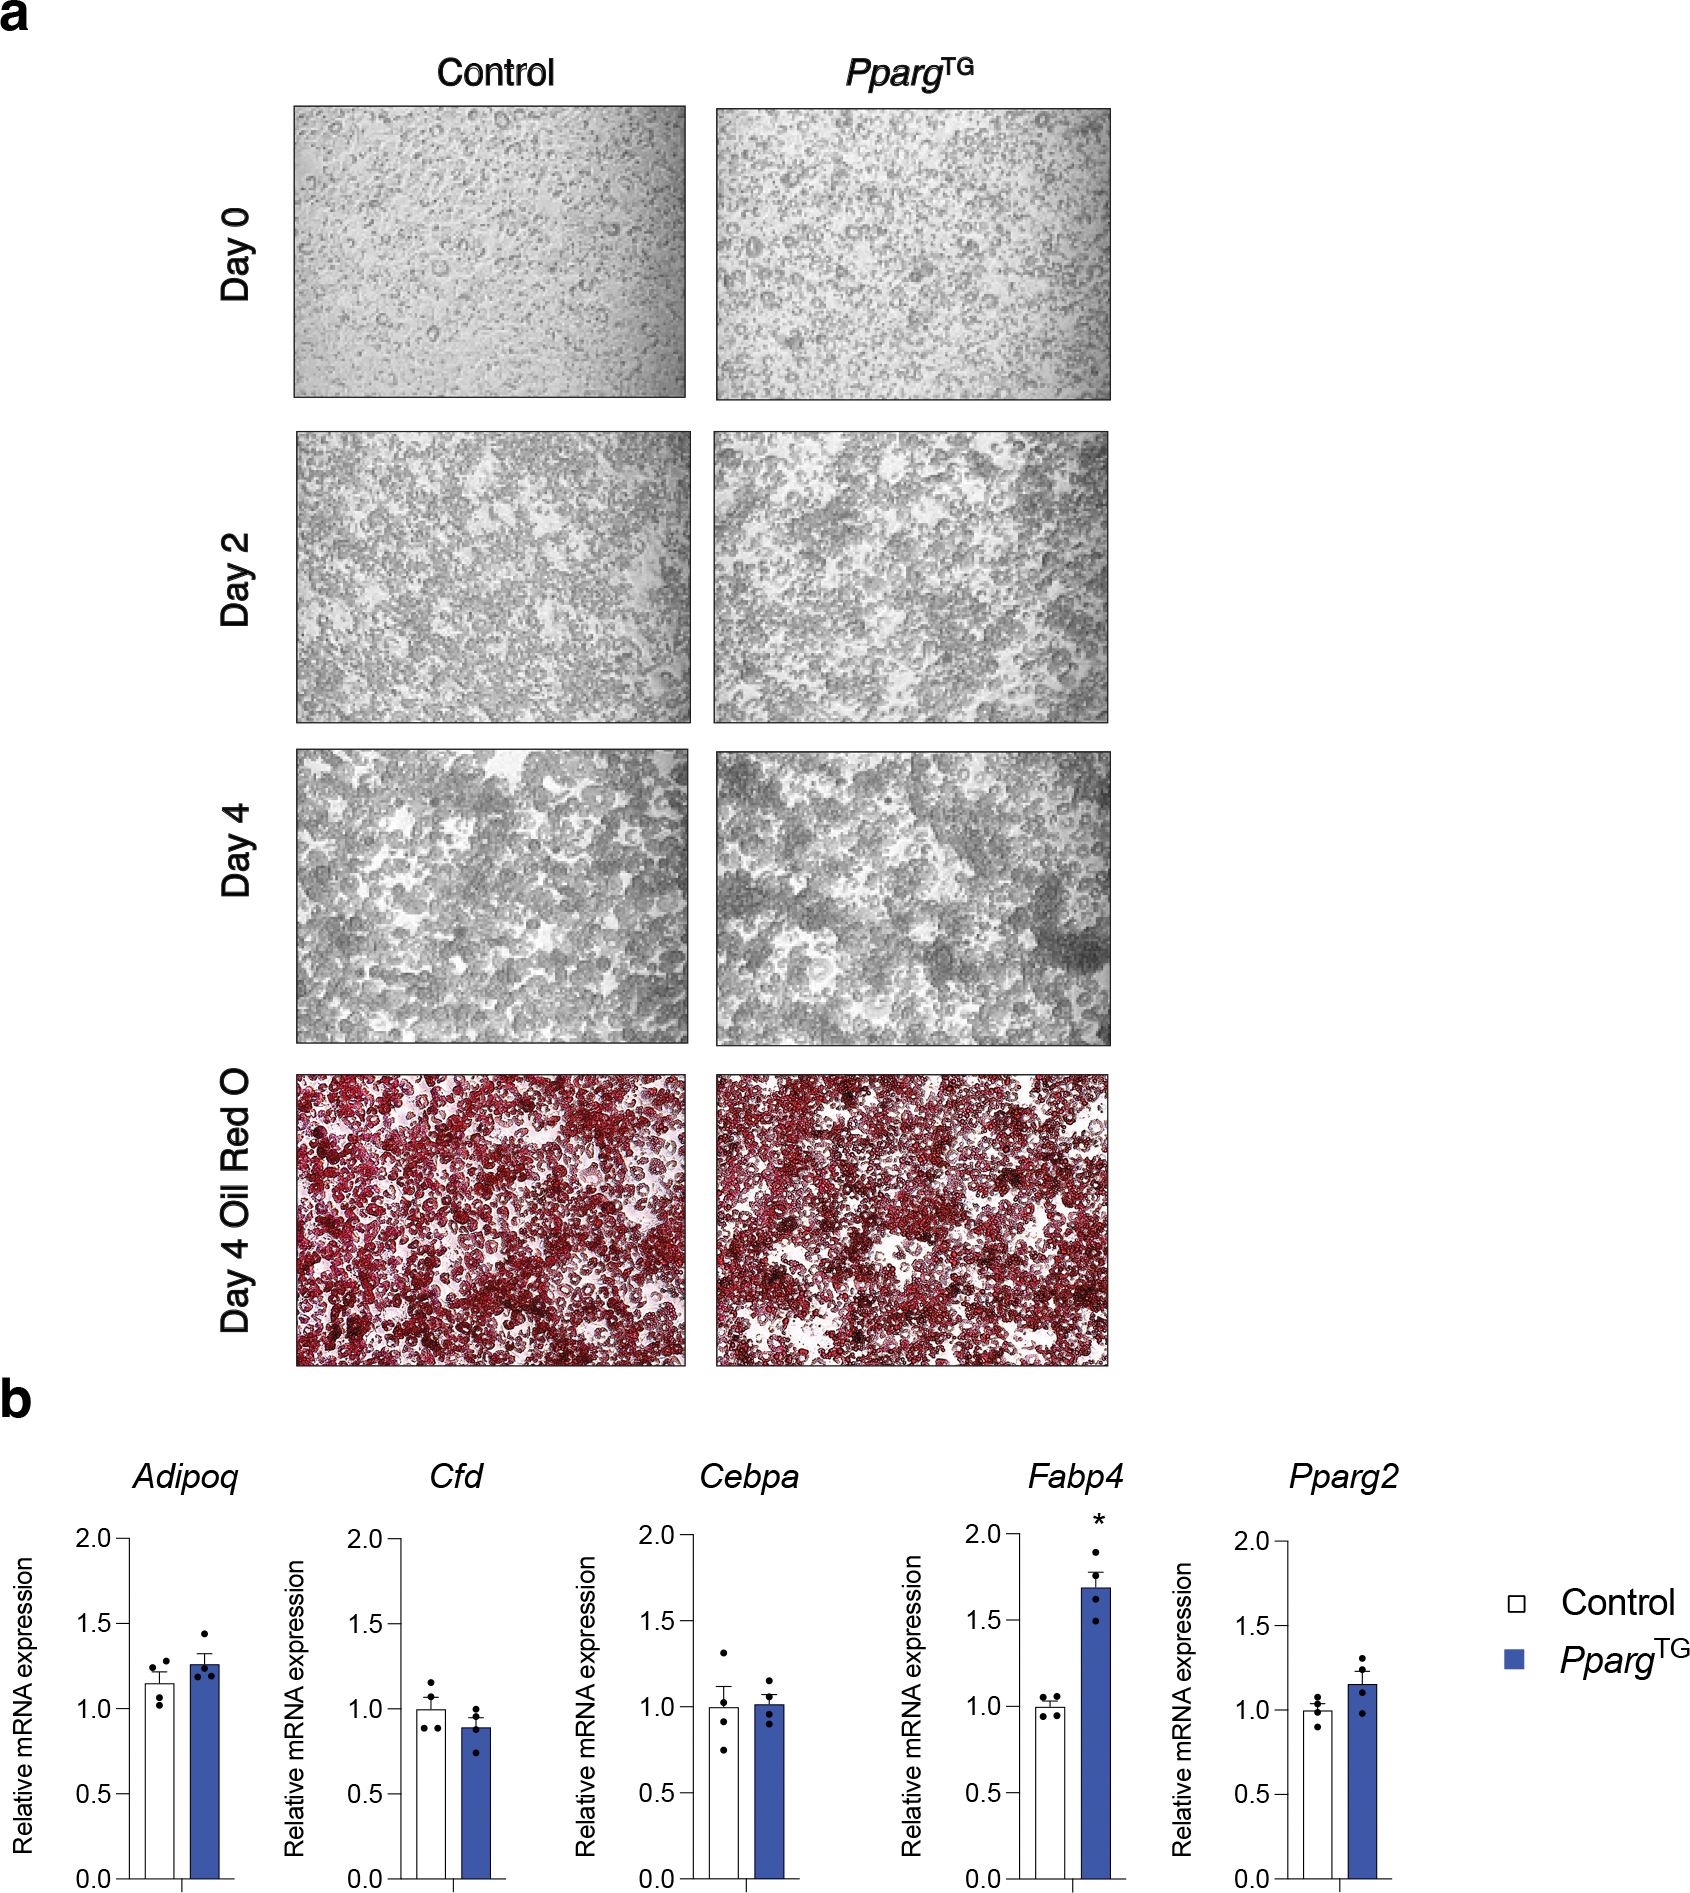
a) 10x brightfield image of indicated cultured APCs at confluence (Day 0), or 2 days (Day 2), or 4 days (Day 4) following the induction of in vitro adipocyte differentiation. APCs obtained from P28 Control and PpargTG mice treated with doxycycline (Dox) from P0.5-P7.5. Oil Red O staining of lipid accumulation and imaging was performed 4 days following the induction of differentiation.
b) mRNA levels of adipocyte-selective genes within differentiated cultures of APCs (Day 4) from P28 Control and PpargTG mice treated with doxycycline (Dox) from P0.5-P7.5. n=4, bars represent ± SEM. * denotes p<0.05 by student t-test.
Exact p values and numbers of repetitions can be found in Source Data Extended Data Figure 7.
Extended Data Figure 8. Impact of transient perinatal Rosiglitazone treatment on adipose tissue in adulthood.
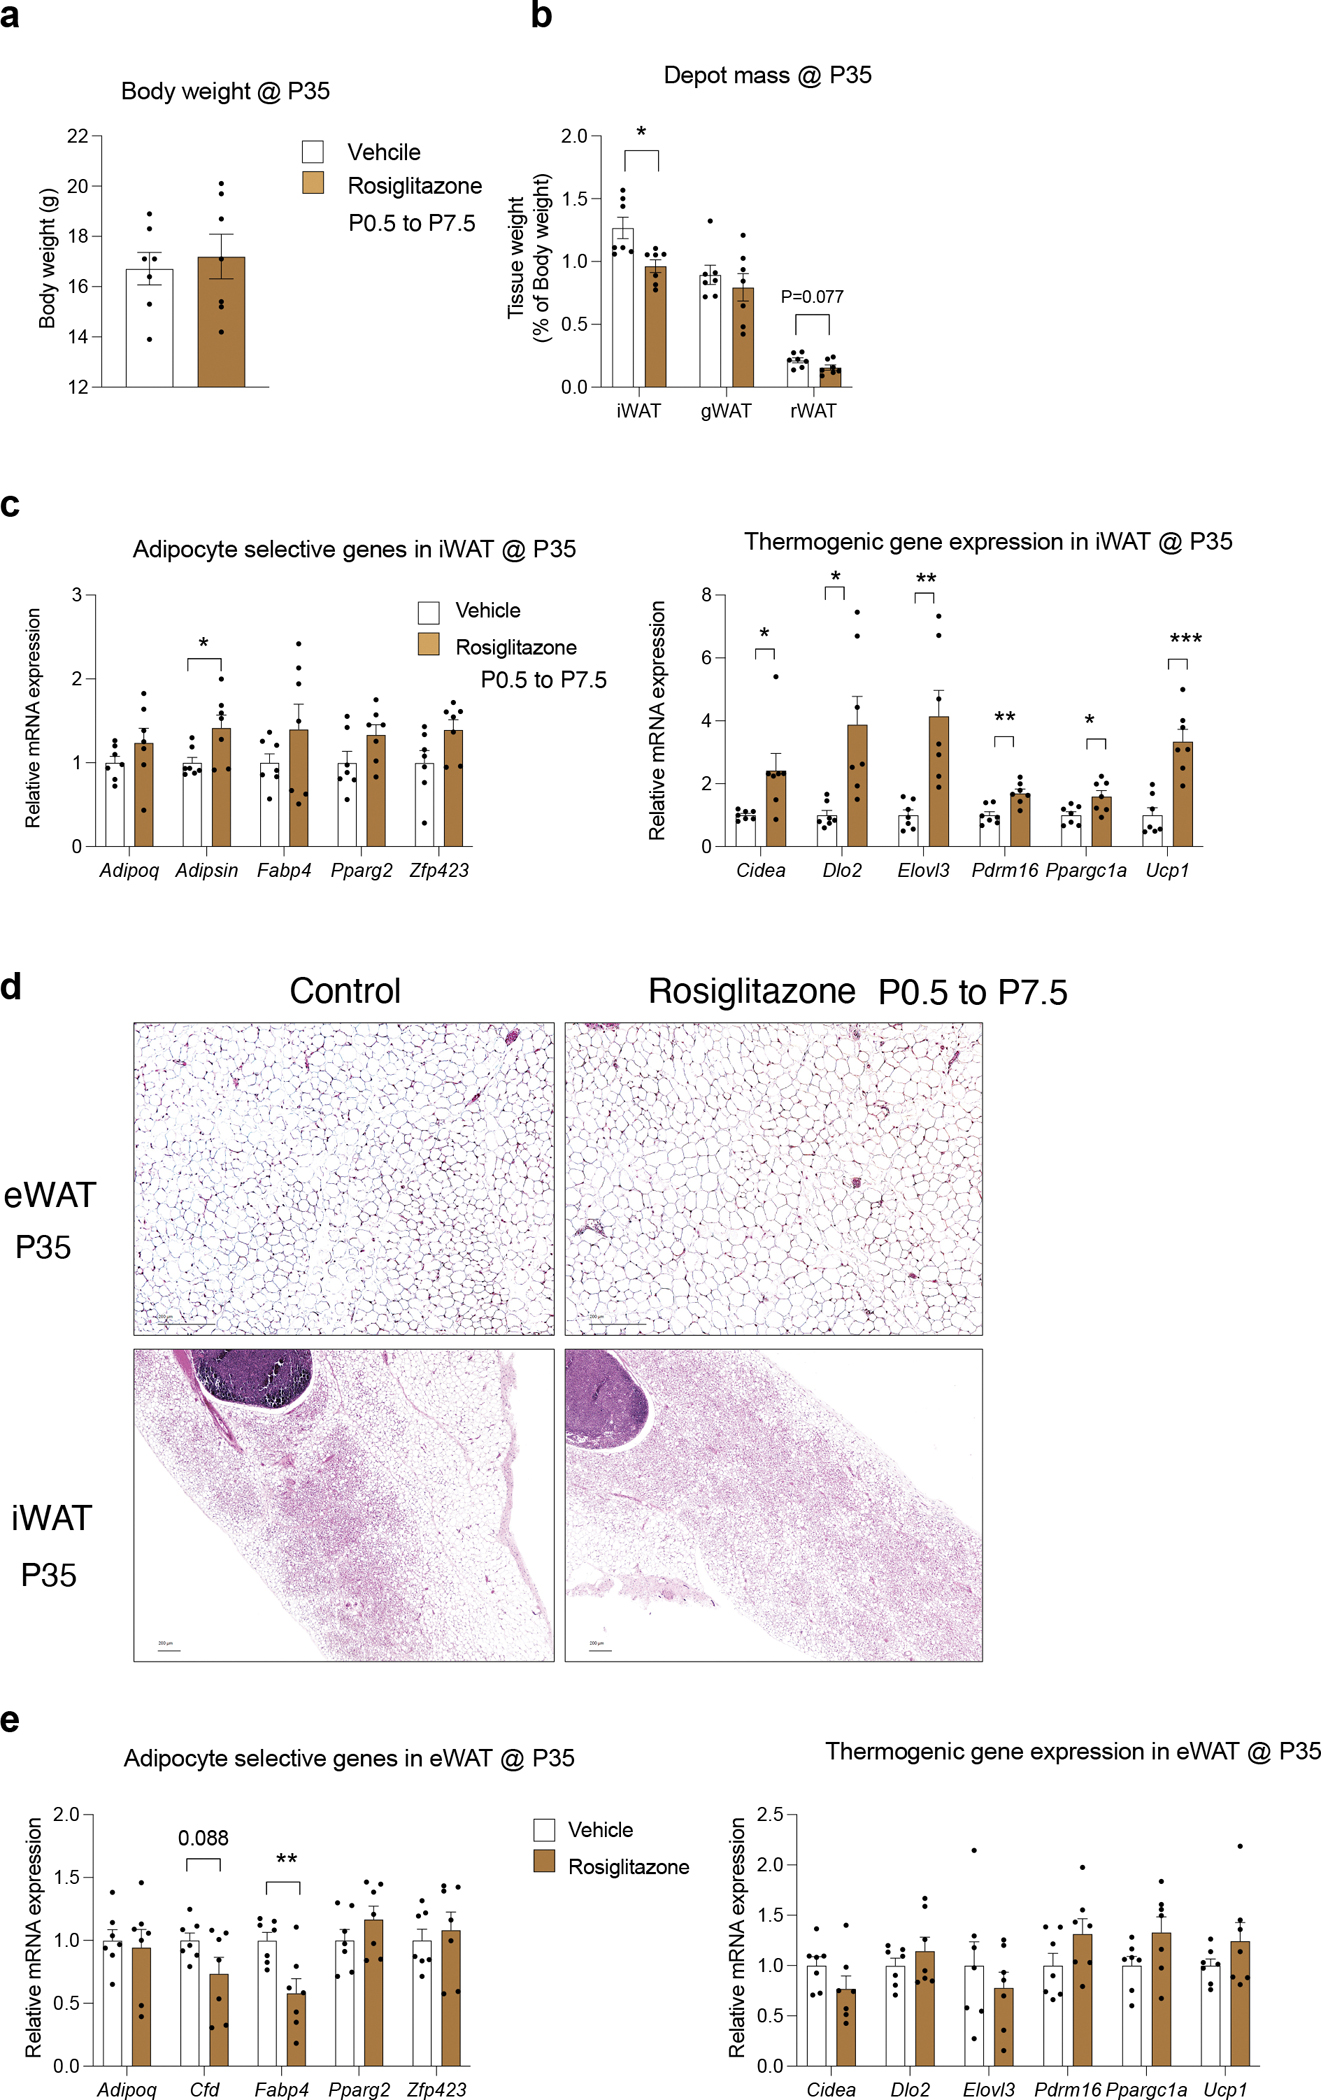
a) Transient perinatal Rosiglitazone treatment from P0.5-P7.5 was induced by exposing newborn pups to Rosiglitazone via lactating mothers oral gavaged with 10mg/kg Rosiglitazone solution daily for 7 days.
Body weights of Control and Rosiglitazone-treated mice at 5 weeks of age (P35). n=7 for each group. Bars represent ± SEM.
b) WAT depot mass of Control and Rosiglitazone treated mice at 5 weeks of age (P35). n=7 for each group. Bars represent ± SEM.
c) mRNA levels of indicated adipocyte-selective genes (right) and thermogenic genes (left) in iWAT from Control and Rosiglitazone treated mice at 5 weeks of age (P35). n=7 for each group. Bars represent ± SEM. * denotes p<0.05 by student t-test, ** denotes p<0.01, *** denotes p<0.001.
d) Representative 10x brightfield images of H&E stained eWAT and iWAT obtained from Control and Rosiglitazone treated mice at 5 weeks of age (P35).
e) mRNA levels of indicated adipocyte-selective genes (right) and thermogenic genes (left) in eWAT from Control and Rosiglitazone treated mice at 5 weeks of age (P35). n=7 for each group. Bars represent ± SEM.
Exact p values and numbers of repetitions can be found in Source Data Extended Data Figure 8.
Extended Data Figure 9. Transient perinatal Pparg overexpression has no apparent long-term effect on eWAT browning potential.
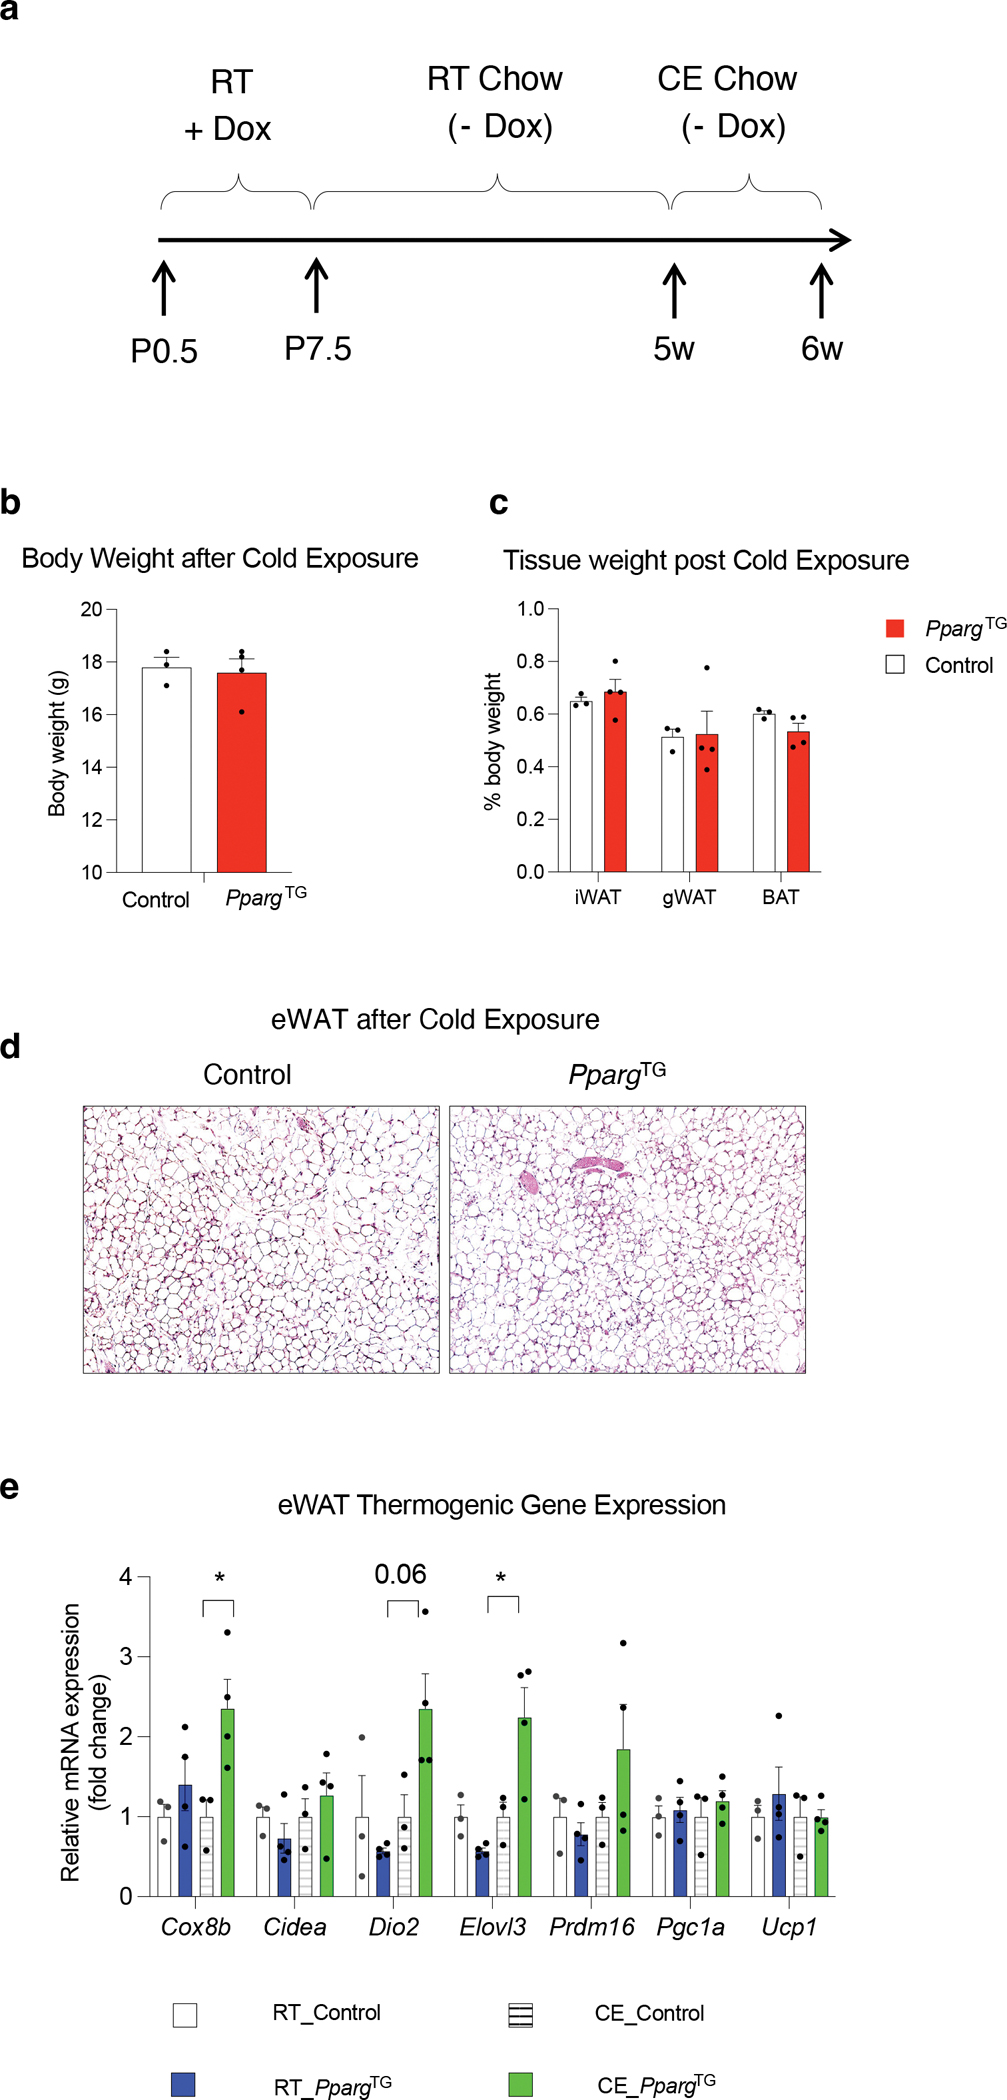
a) Experimental design: Transient perinatal Pparg overexpression from P0.5-P7.5 was induced by exposing newborn pups to doxycycline via lactating mothers fed a Dox-containing chow diet (600 mg/kg) at room temperature (RT). Lactating animals were then switched to a standard chow diet (- Dox) until weaning. 5 weeks-old Control and PpargTG offspring were then exposed to cold temperature (CE) (6°C) for one week prior to analysis.
b) Body weights of Control and PpargTG mice after 1 week cold exposure. n=3–4 for each group. Bars represent ± SEM.
c) Tissue weights of Control and PpargTG mice after 1 week cold exposure. n=3–4 for each group. Bars represent ± SEM.
d) Representative 10x brightfield images of H&E stained eWAT from Control and PpargTG mice after 1 week cold exposure.
e) mRNA levels of indicated thermogenic genes in eWAT from Control and PpargTG mice after 1 week cold exposure. n=3–4 for each group. Bars represent ± SEM. * denotes p<0.05 by student t-test.
Exact p values and numbers of repetitions can be found in Source Data Extended Data Figure 9.
Supplementary Material
Acknowledgements
The authors are grateful to members of the UTSW Touchstone Diabetes Center for critical reading of the manuscript and B. Evers for useful discussions. The authors thank C. Lee, the UTSW Animal Resource Center, Metabolic Phenotyping Core, Pathology Core, Live Cell Imaging Core, Flow Cytometry Core, and McDermott Sequencing Center for excellent guidance and assistance with experiments performed here. This study and/or personnel were supported in part by the NIH NIDDK R01 DK104789, R01 DK119163, and RC2 DK118620 to R.K.G., the American Heart Association postdoctoral fellowship 16POST26420136 and Career Development Award 19CDA34670007 from the American Heart Association and the Harry S. Moss Heart Trust to M.S, and Research Award from Rally Foundation (20IC37), NIH P30 CA142543, NIH R21CA259771 and CPRIT award RP180805 to L.X.
Footnotes
Competing interest statement. The authors declare no competing interests.
References
- 1.Sun W et al. snRNA-seq reveals a subpopulation of adipocytes that regulates thermogenesis. Nature 587, 98–102, doi: 10.1038/s41586-020-2856-x (2020). [DOI] [PubMed] [Google Scholar]
- 2.Hepler C & Gupta RK The expanding problem of adipose depot remodeling and postnatal adipocyte progenitor recruitment. Mol Cell Endocrinol 445, 95–108, doi: 10.1016/j.mce.2016.10.011 (2017). [DOI] [PMC free article] [PubMed] [Google Scholar]
- 3.Ghaben AL & Scherer PE Adipogenesis and metabolic health. Nat Rev Mol Cell Biol 20, 242–258, doi: 10.1038/s41580-018-0093-z (2019). [DOI] [PubMed] [Google Scholar]
- 4.Jeffery E et al. The Adipose Tissue Microenvironment Regulates Depot-Specific Adipogenesis in Obesity. Cell Metab 24, 142–150, doi: 10.1016/j.cmet.2016.05.012 (2016). [DOI] [PMC free article] [PubMed] [Google Scholar]
- 5.Wang W et al. A PRDM16-Driven Metabolic Signal from Adipocytes Regulates Precursor Cell Fate. Cell Metab 30, 174–189 e175, doi: 10.1016/j.cmet.2019.05.005 (2019). [DOI] [PMC free article] [PubMed] [Google Scholar]
- 6.Corvera S Cellular Heterogeneity in Adipose Tissues. Annu Rev Physiol 83, 257–278, doi: 10.1146/annurev-physiol-031620-095446 (2021). [DOI] [PMC free article] [PubMed] [Google Scholar]
- 7.Emont MP et al. A single-cell atlas of human and mouse white adipose tissue. Nature 603, 926–933, doi: 10.1038/s41586-022-04518-2 (2022). [DOI] [PMC free article] [PubMed] [Google Scholar]
- 8.Burl RB et al. Deconstructing Adipogenesis Induced by beta3-Adrenergic Receptor Activation with Single-Cell Expression Profiling. Cell Metab 28, 300–309 e304, doi: 10.1016/j.cmet.2018.05.025 (2018). [DOI] [PMC free article] [PubMed] [Google Scholar]
- 9.Hepler C et al. Identification of functionally distinct fibro-inflammatory and adipogenic stromal subpopulations in visceral adipose tissue of adult mice. Elife 7, doi: 10.7554/eLife.39636 (2018). [DOI] [PMC free article] [PubMed] [Google Scholar]
- 10.Spallanzani RG et al. Distinct immunocyte-promoting and adipocyte-generating stromal components coordinate adipose tissue immune and metabolic tenors. Sci Immunol 4, doi: 10.1126/sciimmunol.aaw3658 (2019). [DOI] [PMC free article] [PubMed] [Google Scholar]
- 11.Sarvari AK et al. Plasticity of Epididymal Adipose Tissue in Response to Diet-Induced Obesity at Single-Nucleus Resolution. Cell Metab 33, 437–453 e435, doi: 10.1016/j.cmet.2020.12.004 (2021). [DOI] [PubMed] [Google Scholar]
- 12.Shao M et al. De novo adipocyte differentiation from Pdgfrbeta(+) preadipocytes protects against pathologic visceral adipose expansion in obesity. Nat Commun 9, 890, doi: 10.1038/s41467-018-03196-x (2018). [DOI] [PMC free article] [PubMed] [Google Scholar]
- 13.Vishvanath L & Gupta RK Contribution of adipogenesis to healthy adipose tissue expansion in obesity. J Clin Invest 129, 4022–4031, doi: 10.1172/JCI129191 (2019). [DOI] [PMC free article] [PubMed] [Google Scholar]
- 14.Shao M et al. Pathologic HIF1alpha signaling drives adipose progenitor dysfunction in obesity. Cell Stem Cell 28, 685–701 e687, doi: 10.1016/j.stem.2020.12.008 (2021). [DOI] [PMC free article] [PubMed] [Google Scholar]
- 15.Buffolo M et al. Identification of a Paracrine Signaling Mechanism Linking CD34(high) Progenitors to the Regulation of Visceral Fat Expansion and Remodeling. Cell Rep 29, 270–282 e275, doi: 10.1016/j.celrep.2019.08.092 (2019). [DOI] [PMC free article] [PubMed] [Google Scholar]
- 16.Shan B et al. Perivascular mesenchymal cells control adipose-tissue macrophage accrual in obesity. Nat Metab 2, 1332–1349, doi: 10.1038/s42255-020-00301-7 (2020). [DOI] [PMC free article] [PubMed] [Google Scholar]
- 17.Joffin N et al. Mitochondrial metabolism is a key regulator of the fibro-inflammatory and adipogenic stromal subpopulations in white adipose tissue. Cell Stem Cell 28, 702–717 e708, doi: 10.1016/j.stem.2021.01.002 (2021). [DOI] [PMC free article] [PubMed] [Google Scholar]
- 18.Rondini EA & Granneman JG Single cell approaches to address adipose tissue stromal cell heterogeneity. Biochem J 477, 583–600, doi: 10.1042/BCJ20190467 (2020). [DOI] [PMC free article] [PubMed] [Google Scholar]
- 19.Han J et al. The spatiotemporal development of adipose tissue. Development 138, 5027–5037, doi: 10.1242/dev.067686 (2011). [DOI] [PubMed] [Google Scholar]
- 20.Wang QA, Tao C, Gupta RK & Scherer PE Tracking adipogenesis during white adipose tissue development, expansion and regeneration. Nat Med 19, 1338–1344, doi: 10.1038/nm.3324 (2013). [DOI] [PMC free article] [PubMed] [Google Scholar]
- 21.Vishvanath L et al. Pdgfrbeta+ Mural Preadipocytes Contribute to Adipocyte Hyperplasia Induced by High-Fat-Diet Feeding and Prolonged Cold Exposure in Adult Mice. Cell Metab 23, 350–359, doi: 10.1016/j.cmet.2015.10.018 (2016). [DOI] [PMC free article] [PubMed] [Google Scholar]
- 22.Hudak CS et al. Pref-1 marks very early mesenchymal precursors required for adipose tissue development and expansion. Cell Rep 8, 678–687, doi: 10.1016/j.celrep.2014.06.060 (2014). [DOI] [PMC free article] [PubMed] [Google Scholar]
- 23.Donati G, Montanaro L & Derenzini M Ribosome biogenesis and control of cell proliferation: p53 is not alone. Cancer Res 72, 1602–1607, doi: 10.1158/0008-5472.CAN-11-3992 (2012). [DOI] [PubMed] [Google Scholar]
- 24.Ilicic T et al. Classification of low quality cells from single-cell RNA-seq data. Genome Biol 17, 29, doi: 10.1186/s13059-016-0888-1 (2016). [DOI] [PMC free article] [PubMed] [Google Scholar]
- 25.Wang F, Mullican SE, DiSpirito JR, Peed LC & Lazar MA Lipoatrophy and severe metabolic disturbance in mice with fat-specific deletion of PPARgamma. Proc Natl Acad Sci U S A 110, 18656–18661, doi: 10.1073/pnas.1314863110 (2013). [DOI] [PMC free article] [PubMed] [Google Scholar]
- 26.Tang W et al. White fat progenitor cells reside in the adipose vasculature. Science 322, 583–586, doi: 10.1126/science.1156232 (2008). [DOI] [PMC free article] [PubMed] [Google Scholar]
- 27.Gupta RK et al. Zfp423 expression identifies committed preadipocytes and localizes to adipose endothelial and perivascular cells. Cell Metab 15, 230–239, doi: 10.1016/j.cmet.2012.01.010 (2012). [DOI] [PMC free article] [PubMed] [Google Scholar]
- 28.Vishvanath L, Long JZ, Spiegelman BM & Gupta RK Do Adipocytes Emerge from Mural Progenitors? Cell Stem Cell 20, 585–586, doi: 10.1016/j.stem.2017.03.013 (2017). [DOI] [PubMed] [Google Scholar]
- 29.Xie T et al. Single-Cell Deconvolution of Fibroblast Heterogeneity in Mouse Pulmonary Fibrosis. Cell Rep 22, 3625–3640, doi: 10.1016/j.celrep.2018.03.010 (2018). [DOI] [PMC free article] [PubMed] [Google Scholar]
- 30.Lehmann JM et al. An antidiabetic thiazolidinedione is a high affinity ligand for peroxisome proliferator-activated receptor gamma (PPAR gamma). J Biol Chem 270, 12953–12956, doi: 10.1074/jbc.270.22.12953 (1995). [DOI] [PubMed] [Google Scholar]
- 31.Holtrup B et al. Puberty is an important developmental period for the establishment of adipose tissue mass and metabolic homeostasis. Adipocyte 6, 224–233, doi: 10.1080/21623945.2017.1349042 (2017). [DOI] [PMC free article] [PubMed] [Google Scholar]
- 32.Hepler C et al. Directing visceral white adipocyte precursors to a thermogenic adipocyte fate improves insulin sensitivity in obese mice. Elife 6, doi: 10.7554/eLife.27669 (2017). [DOI] [PMC free article] [PubMed] [Google Scholar]
- 33.Berry DC et al. Cellular Aging Contributes to Failure of Cold-Induced Beige Adipocyte Formation in Old Mice and Humans. Cell Metab 25, 166–181, doi: 10.1016/j.cmet.2016.10.023 (2017). [DOI] [PMC free article] [PubMed] [Google Scholar]
- 34.Gao Z et al. Age-associated telomere attrition in adipocyte progenitors predisposes to metabolic disease. Nat Metab 2, 1482–1497, doi: 10.1038/s42255-020-00320-4 (2020). [DOI] [PubMed] [Google Scholar]
- 35.Kodani SD & Tseng YH Narrating the story ARC of adipose tissue aging. Dev Cell 56, 1359–1360, doi: 10.1016/j.devcel.2021.04.020 (2021). [DOI] [PubMed] [Google Scholar]
- 36.Nguyen HP et al. Aging-dependent regulatory cells emerge in subcutaneous fat to inhibit adipogenesis. Dev Cell 56, 1437–1451 e1433, doi: 10.1016/j.devcel.2021.03.026 (2021). [DOI] [PMC free article] [PubMed] [Google Scholar]
- 37.Sebo ZL & Rodeheffer MS Assembling the adipose organ: adipocyte lineage segregation and adipogenesis in vivo. Development 146, doi: 10.1242/dev.172098 (2019). [DOI] [PMC free article] [PubMed] [Google Scholar]
- 38.Chau YY et al. Visceral and subcutaneous fat have different origins and evidence supports a mesothelial source. Nat Cell Biol 16, 367–375, doi: 10.1038/ncb2922 (2014). [DOI] [PMC free article] [PubMed] [Google Scholar]
- 39.Gupta OT & Gupta RK Visceral Adipose Tissue Mesothelial Cells: Living on the Edge or Just Taking Up Space? Trends Endocrinol Metab 26, 515–523, doi: 10.1016/j.tem.2015.07.003 (2015). [DOI] [PubMed] [Google Scholar]
- 40.Westcott GP et al. Mesothelial cells are not a source of adipocytes in mice. Cell Rep 36, 109388, doi: 10.1016/j.celrep.2021.109388 (2021). [DOI] [PMC free article] [PubMed] [Google Scholar]
- 41.Rinkevich Y et al. Identification and prospective isolation of a mesothelial precursor lineage giving rise to smooth muscle cells and fibroblasts for mammalian internal organs, and their vasculature. Nat Cell Biol 14, 1251–1260, doi: 10.1038/ncb2610 (2012). [DOI] [PMC free article] [PubMed] [Google Scholar]
- 42.Lee KY et al. Developmental and functional heterogeneity of white adipocytes within a single fat depot. EMBO J 38, doi: 10.15252/embj.201899291 (2019). [DOI] [PMC free article] [PubMed] [Google Scholar]
- 43.Rando OJ & Simmons RA I’m eating for two: parental dietary effects on offspring metabolism. Cell 161, 93–105, doi: 10.1016/j.cell.2015.02.021 (2015). [DOI] [PMC free article] [PubMed] [Google Scholar]
- 44.Hao Y et al. Integrated analysis of multimodal single-cell data. Cell 184, 3573–3587 e3529, doi: 10.1016/j.cell.2021.04.048 (2021). [DOI] [PMC free article] [PubMed] [Google Scholar]
- 45.Hafemeister C & Satija R Normalization and variance stabilization of single-cell RNA-seq data using regularized negative binomial regression. Genome Biol 20, 296, doi: 10.1186/s13059-019-1874-1 (2019). [DOI] [PMC free article] [PubMed] [Google Scholar]
- 46.Street K et al. Slingshot: cell lineage and pseudotime inference for single-cell transcriptomics. BMC Genomics 19, 477, doi: 10.1186/s12864-018-4772-0 (2018). [DOI] [PMC free article] [PubMed] [Google Scholar]
Associated Data
This section collects any data citations, data availability statements, or supplementary materials included in this article.
Supplementary Materials
Data Availability Statement
All animal models and reagents are freely available to investigators upon reasonable request. scRNA-seq data have been deposited to Gene Expression Omnibus (GEO Accession GSE180987). Bulk-mRNA-seq data have been deposited to Gene Expression Omnibus (GEO Accession GSE181245).


