Summary
Phospholipid levels are influenced by peripheral metabolism. Within the central nervous system, synaptic phospholipids regulate glutamatergic transmission and cortical excitability. Whether changes in peripheral metabolism affect brain lipid levels and cortical excitability remains unknown. Here we show that levels of lysophosphatidic acid (LPA) species in the blood and cerebrospinal fluid are elevated after overnight fasting and lead to higher cortical excitability. LPA-related cortical excitability increases fasting-induced hyperphagia, and is decreased following inhibition of LPA synthesis. Mice expressing a human mutation leading to higher synaptic lipid-mediated cortical excitability (Prg-1R346T) display increased fasting-induced hyperphagia. Accordingly, human subjects with this mutation have higher body mass index and prevalence of type 2 diabetes. We further show that the effects of LPA following fasting are under the control of hypothalamic agouti-related peptide (AgRP) neurons. Depletion of AgRP-expressing cells in adult mice decreases fasting-induced elevation of circulating LPAs, as well as cortical excitability, while blunting hyperphagia. These findings reveal a direct influence of circulating LPAs under the control of hypothalamic AgRP neurons on cortical excitability, unmasking an alternative non-neuronal route by which the hypothalamus can exert a robust impact on the cortex affecting food intake.
Keywords: Metabolism, synaptic lipid signaling, cortical excitability, ATX-inhibition, cortical control of food intake, rebound hyperphagia
Introduction
Recent research has shown that bioactive phospholipids such as lysophosphatidic acids (LPA) play an important regulatory role in synaptic neurotransmission and plasticity1–4. LPA is a short-lived, but potent signaling molecule5 that acts via specific G-protein coupled receptors, LPA-R1-66,7. LPA-levels are tightly regulated by specific phosphatases (LPP1-38) suggesting that LPA synthesis and action are locally restricted. We have previously shown that LPA is locally synthesized at the synaptic cleft of glutamatergic synapses by autotaxin (ATX/Enpp2 9–11), which is expressed by astrocytic processes covering cortical glutamatergic synapses4. Here, LPA is a powerful modulator of presynaptic glutamate release by activation of presynaptic LPA2 receptors, which regulate glutamate release probabilities and hereby neuronal excitabilty1. In cortical networks, LPA regulates the cortical excitation-inhibition (E/I) balance and controls cortical sensory information processing in mice and humans3. LPA synthesis in the brain depends on the presence of its precursor lysophosphatidyl choline (LPC), which is secreted by the liver and reflects changes in peripheral energy metabolism 12,13, and is actively transported via the blood-brain barrier14. However, in contrast to blood plasma, LPC is only present at very low concentrations in the CSF 6,15,16, indicating that LPC-levels may be a limiting factor for LPA-synthesis in the CNS. Taken together, these findings suggest that changes in peripheral energy metabolism may affect brain lipid levels and thereby cortical excitability. Since food restriction rapidly depletes glycogen stores and induces lipolysis, thereby altering body lipid levels17, and hypothalamic AgRP neurons have been shown to control peripheral lipid metabolism 18,19 and complex behaviors beyond feeding 19–21, we interrogated the effect of fasting and AgRP circuit integrity on brain phospholipid levels, as well as its impact on cortical excitability, and on food intake control.
Results
Fasting increases cortical excitability via synaptic lipid signaling
Overnight fasting of mice is sufficient to deplete liver glycogen content, it significantly reduces blood glucose levels and induces liver lipolysis and lipid secretion into the blood 17. One lipid secreted by the liver is LPC, which is rapidly converted to LPA by ATX, an enzyme that is abundantly present in blood 11. We analyzed fasting-induced LPA-levels (experimental scheme in Fig. 1a) and found that overnight fasting resulted in increased blood plasma levels as well as in an increase of most LPA subtypes in blood plasma (Fig. 1b,c). Moreover, we found higher levels of LPA18:1, which was described to have a high affinity to the presynaptic LPA2-receptor 22 and to be a potent mediator in the periphery 23 (Fig. 1d). Further analysis of the cerebrospinal fluid (CSF) revealed significantly increased LPA-levels including LPA 18:1 after overnight fasting (Fig. 1e,f).
Figure 1. Fasting increases synaptic active LPA subtypes in the brain and enhances glutamatergic transmission.
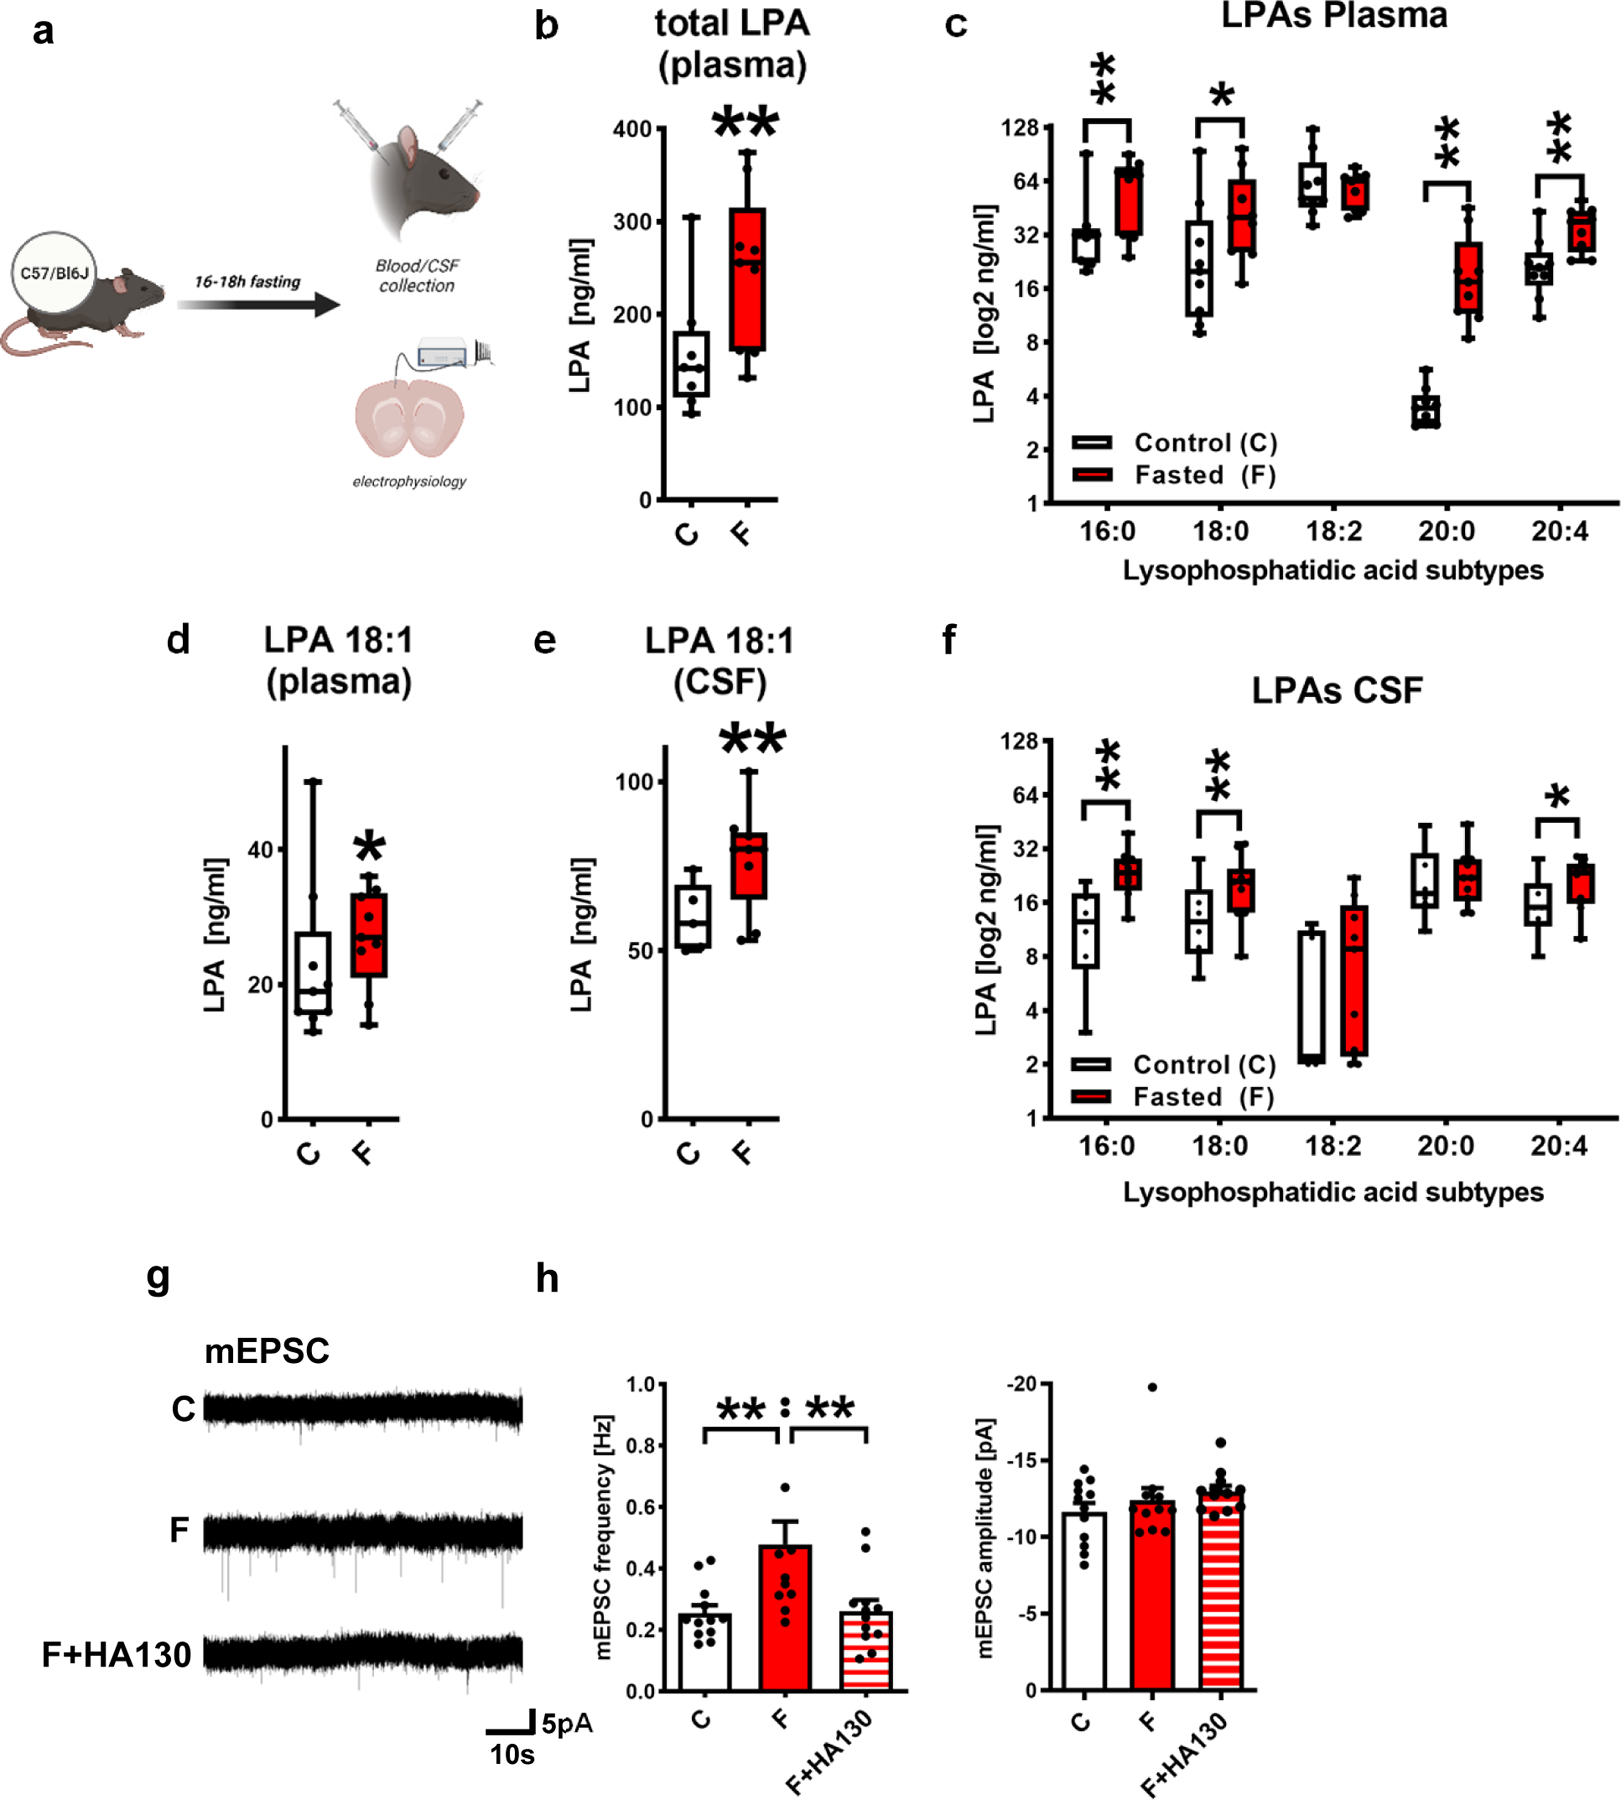
a. Experimental design for blood plasma and CSF collection.
b. Total LPA blood plasma levels were increased in wild type (wt) animals after fasting (n= 8 control animals [C] and 10 fasted animals [F], group differences: 96.9%, Bayesian analysis).
c. LPA subtype analysis revealed increased blood plasma levels in wt fasted animals (n= 9 controls for LPA 18:0, 18:2, 20:0, 20:4 and 8 for LPA 16:0 and n = 9 fasted animals, group differences for LPA 16:0 97.1%, for LPA 18:0 89.9%, for LPA 18:2 60.9%, for LPA 20:0 99.7%, for LPA 20:4 99.1%, Bayesian analysis).
d. Blood plasma levels of LPA 18:1 were increased in fasted wt animals (n= 9 control animals and n = 9 fasted animals, group differences: 83.8%, Bayesian analysis).
e. Fasting resulted in increased CSF LPA 18:1 levels (n= 5 control animals and n = 9 fasted animals, group differences: 96.4%, Bayesian analysis).
f. In the CSF, fasting increased specific LPA levels (n= 6 controls for LPA 16:0, 18:0, 20:0, 20:4 and 5 for 18:2 and n = 10 fasted animals for LPA 16:0, 18:0, 20:0, 20:4 and 9 for LPA 18:2, group differences for LPA 16:0 98.7%, for LPA 18:0 90.3%, for LPA 18:2 76.9%, for LPA 20:0 60.0%, for LPA 20:4 89.2%, Bayesian analysis).
g. Original miniature excitatory postsynaptic currents (mEPSC) traces illustrating presynaptic release probabilities under control conditions, after fasting (F) and after application of the ATX-inhibitor HA130 after fasting (F + HA130).
h. mEPSC frequencies were significantly increased after fasting (F, P=0.0058) and were reduced to control values (C) when ATX was inhibited by HA-130 (F+HA130, P=0.0077) (n = 12 for C, n = 11 for F, n = 12 for F+HA130, one-way ANOVA with Bonferroni correction (frequencies, left) or Kruskal-Wallis test (amplitudes, right)). Bars represent mean and SEM.
Box plots and whiskers show data from min to max, line shows median. Points represent individual values. **p<0.01 or group differences of * >80% or **>90% for Bayesian analysis. Illustration was created with BioRender.
Since increases in synaptic LPA have been associated with higher miniature excitatory postsynaptic current (mEPSC) frequencies, which reflect glutamatergic release probabilities 1,2, we assessed mEPSCs in hippocampal neurons, which are located in regions with high expression of the LPA-synthesizing molecule ATX and of the LPA-interacting molecule PRG-1 (for expression of Atx and Prg-1 see Extended Data Fig. 1a–j). First, we measured mEPSCs in fasted animals finding significantly increased mEPSC frequencies after overnight fasting (Fig. 1g,h). In order to interrogate that the above described changes in cortical excitability are the result of increased LPA, we inhibited LPA synthesis at the synaptic cleft by application of HA-130 blocking the LPA-synthesizing enzyme ATX, which is released from perisynaptic astrocyte processes 4. In fact, we have previously shown that HA130 decreased mEPSC frequencies to control values under conditions of hyperexcitability while not affecting mEPSCs under control conditions 4. HA130 application after fasting resulted in mEPSC frequencies at control levels (Fig 1g,h). Since unsaturated LPA subtypes like LPA 18:1 have a preference to LPA2 receptors 22, and this LPA subtype was increased after fasting, we tested the action of the LPA 18:1 on presynaptic glutamatergic release probabilities. LPA 18:1 significantly enhanced mEPSC frequencies (Extended Data Fig. 2a–c), while the saturated LPA 18:0 showed no significant changes in mEPSC frequencies (Extended Data Fig. 2d–f). This is consistent with previous in-vitro reports using LPA receptor expression in heterologous systems 22. Thus, these data show that during fasting, synaptically active LPA subtype levels like LPA 18:1 (acting via presynaptic LPA2-R as described 1,22) were enhanced in the brain leading to increased cortical excitability.
Fasting-related cortical excitability affects exploratory behavior
According to the high expression of the LPA modulating molecules ATX and PRG-1 in the upper cortical layers (shown also in Extended Data Fig. 1), we assessed the effect of fasting-increased cortical excitability on a cortex-related behavior. Here, we tested the exploratory behavior of mice exposed to a novel, non-food related object 24 finding a significantly longer interaction time of fasted animals exposed to a novel object (Extended Data Fig. 3b). However, inhibition of the LPA synthesis molecule ATX by PF8380, which significantly reduced synaptic active LPA 18:1 levels in the CSF (Extended Data Fig. 4b), completely blunted the fasting-induced exploratory drive (Extended Data Fig. 3b), while it did not affect basic motor function (Extended Data Fig. 4c). To prove the involvement of fasting-related LPA-changes in the cortex, we disrupted cortical LPA signaling (AtxΔcortex using a cortex-specific Emx-1 Cre mouse line). Cortical ATX-disruption resulted in a decreased exploratory behavior after fasting while no differences were observed under control conditions (Extended Data Fig. 3c). Interestingly, following cortical ATX-disruption, exploratory drive was not significantly different in non-fasted and fasted mice (Extended Data Fig. 3d) and was not affected anymore by ATX-inhibition (Extended Data Fig. 3e). In sum, these data suggest that fasting-induced exploratory behavior is modulated by cortical ATX. In order to further confirm the impact of synaptic LPA signaling on exploratory behavior, we assessed the role of the downstream presynaptic LPA2-receptor, which has been shown to mediate LPA-related cortical excitability 1. Here, exploratory behavior of fasted LPA2-receptor knockout mice (Lpa2−/−) was significantly lower than their wild type litters, while no difference was observed under non-fasted conditions or after ATX-inhibition (Extended Data Fig. 3f,g).
Finally, we tested whether a pre-existing, synaptic LPA-related increase in cortical excitability is able to potentiate the fasting-induced cortex-related behavior. To do this, we assessed exploratory behavior of fasted Prg-1R346T/+ mice, which express a monoallelic single-nucleotide polymorphism (SNP) in the plasticity-related gene (Prg-1/Lppr4), as described in humans 3. This SNP (with a population frequency of around 0.6% in humans) leads to a single amino acid change (PRG-1R346T) resulting in a loss of PRG-1`s ability to take up LPA and to clear it from the synaptic cleft, which would thus lead to increased synaptic LPA signaling and altered glutamatergic transmission 3,4. Overnight fasted Prg-1R346T/+ mice showed a significant increase in exploration time compared to their fasted wild type litters (Extended Data Fig. 3h). In line with the predominant cortical PRG-1 expression on glutamatergic neurons and due to the fact that the human PRG-1R345T variant is a loss-of-function mutation selectively affecting the ability to remove LPA from the synaptic cleft 3, these data suggest that following fasting, increased synaptic LPA signaling in the cortex leads to a higher exploratory drive, which in the normal habitat of an animal is part of the food search activity.
LPA-modulated cortical excitability influences fasting-induced hyperphagia
Fasting-induced hyperphagia is a well-described phenomenon leading to rapid reversal of fasting-induced changes in peripheral energy metabolism 17. While part of the effect of fasting-induced hyperphagia was associated with ghrelin signaling 25 or specific potassium currents in hypothalamic neurons 26, the role of higher order cortical regulation as well as the underlying metabolic signaling pathway are not yet clear. Since we found synaptic lipid signaling to be modulated by changes in peripheral energy metabolism, we assessed the effect of ATX inhibition by PF8380 on fasting-induced hyperphagia (see schematic experimental overview in Fig. 2a). ATX-inhibition by PF8380 significantly decreased fasting-induced hyperphagia when compared to non-treated fasted mice, while ATX-inhibition had no effect on food intake under non-fasted conditions (Fig. 2b). The cortex-dominated action was corroborated by cortical deletion of the LPA-synthesizing molecule ATX (AtxΔcortex mice) as well as by deletion of the LPA2 receptor (Lpa2−/− mice), both of which have been previously reported to reduce LPA-related cortical excitability to wild type levels 1,4. Here, we observed a significant reduction of fasting-induced hyperphagia after disruption of the ATX-LPA-LPA2 signaling axis when compared to wild type litters, while food intake in these transgenic mouse lines was not different to their wild type litters under non-fasting conditions (Fig. 2c,d) suggesting that the ATX-LPA-LPA2 signaling axis is activated under altered metabolic conditions.
Figure 2. Fasting-induced hyperphagia is regulated by cortical synaptic lipid signaling.
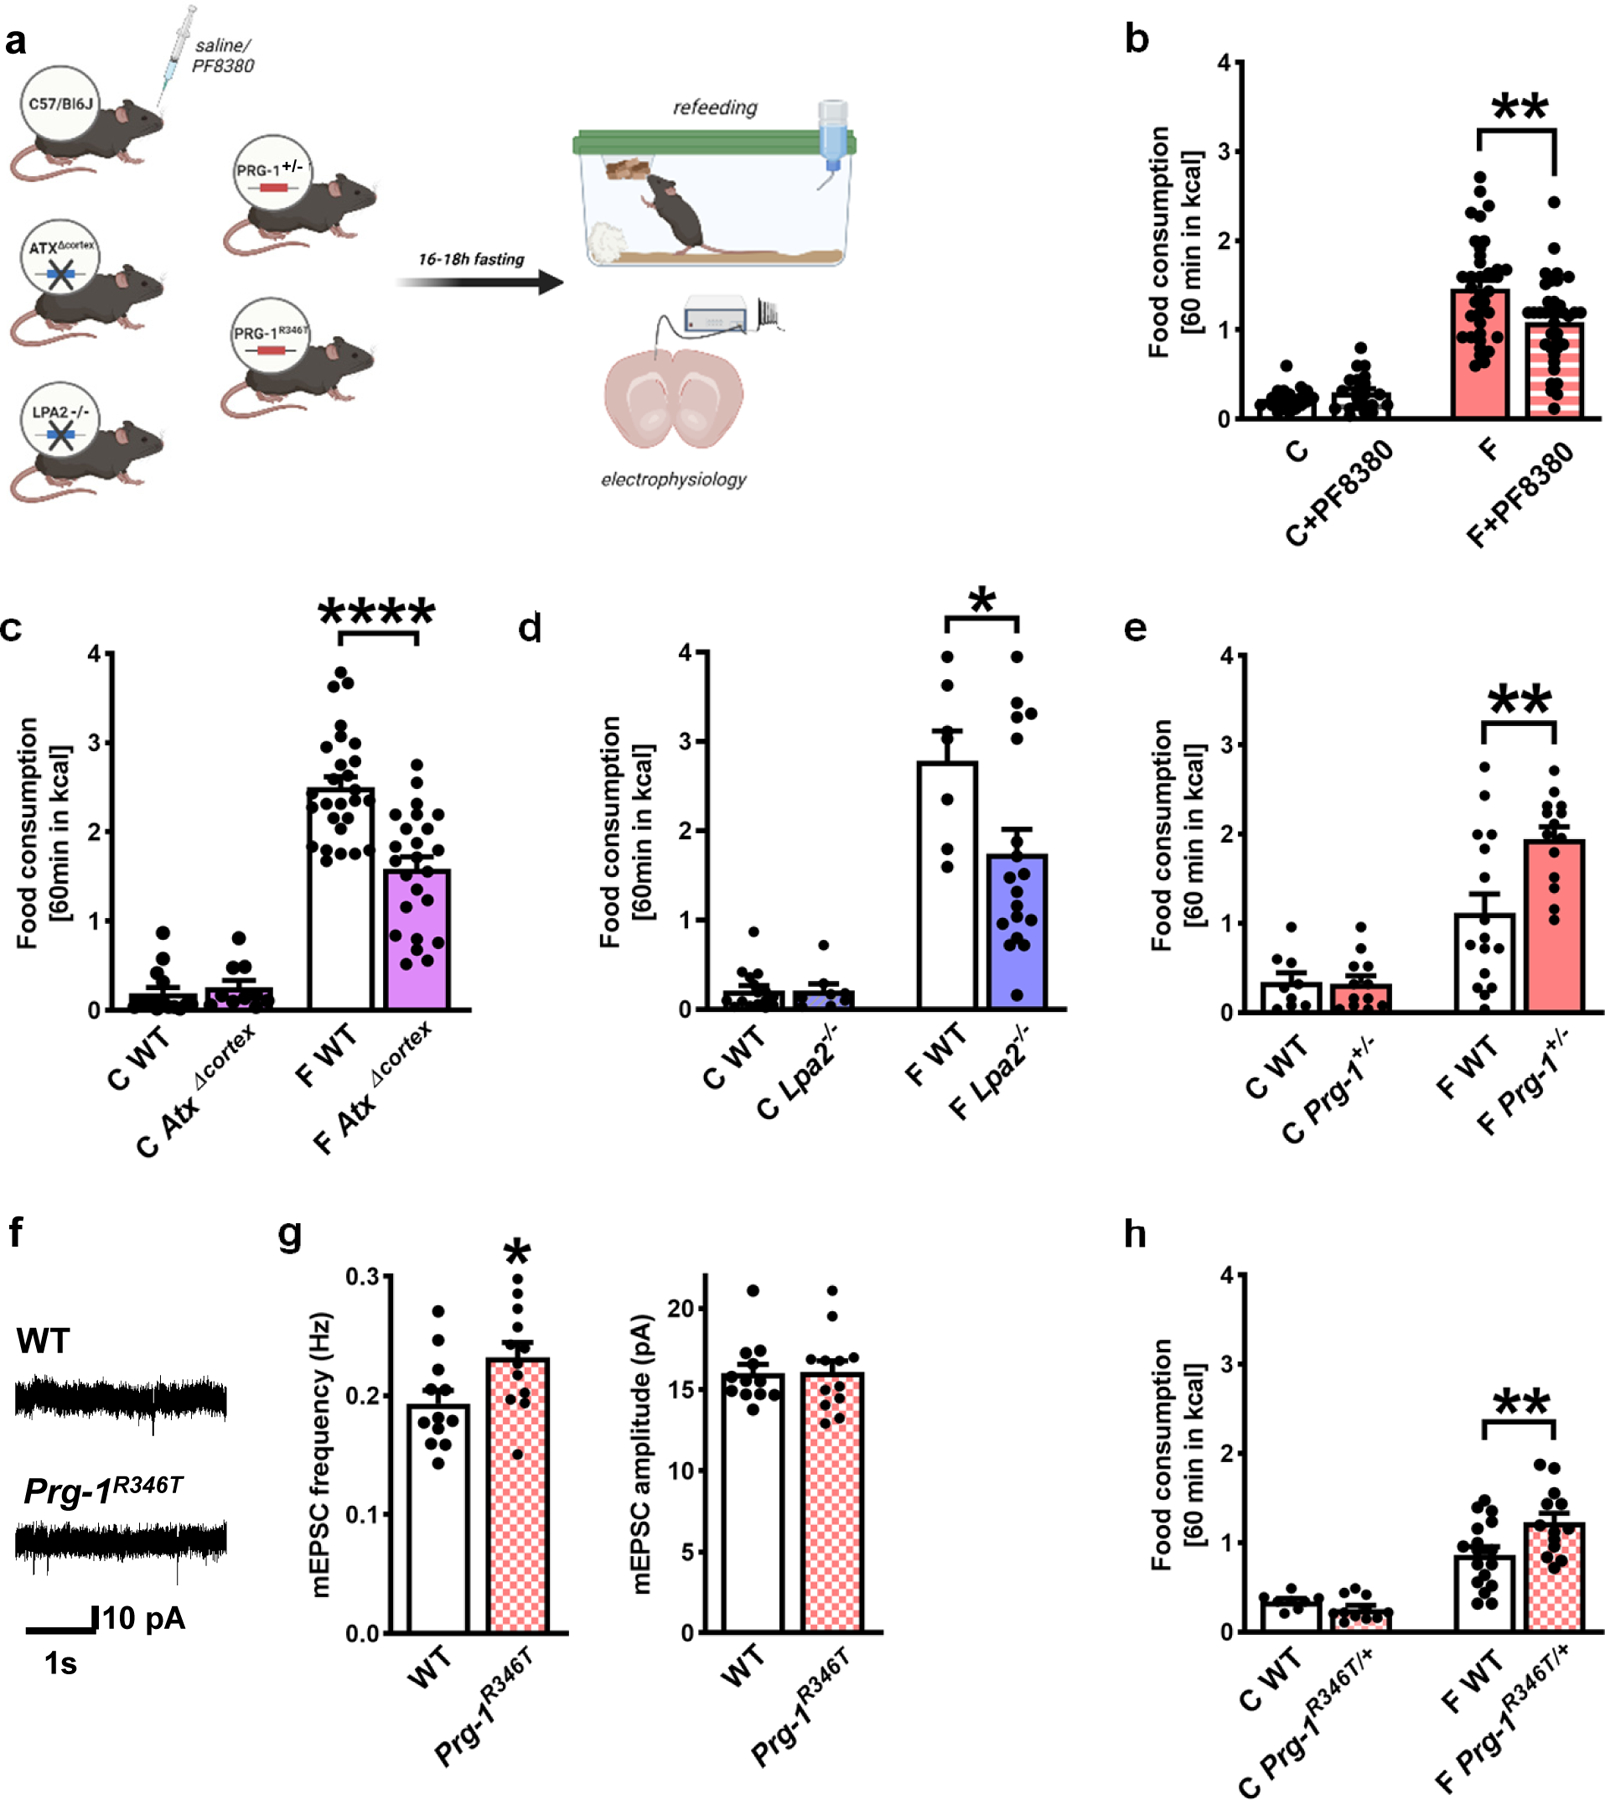
a. Experimental design.
b. Disruption of LPA-signaling by systemic ATX-inhibition (by PF8380) did not alter food intake under non-fasting conditions (n = 20 C, n = 21 C + PF8380, Mann-Whitney test), while ATX-inhibition significantly reduced fasting-induced hyperphagia (n = 36 F and n = 37 F + PF8380, P=0.0028, two-tailed t-test).
c. Food intake under control conditions was comparable in non-fasted WT and AtxΔcortex mice (n = 15 C WT and n = 10 AtxΔcortex, two tailed t-test), while fasting-induced hyperphagia was significantly reduced in AtxΔcortex mice when compared to their WT litters (n = 27 F WT and n = 24 F AtxΔcortex mice, P<0.0001, two tailed t-test)
d. Food intake under control conditions was not different in Lpa2−/− mice when compared to their WT litters (n = 16 C WT and n = 8 Lpa2−/−), however, fasting-induced hyperphagia was significantly reduced in Lpa2−/− mice when compared to their WT litters (n = 7 F WT and n = 18 F Lpa2−/− mice, P=0.031, two tailed t-test).
e. Food consumption under non-fasted, control conditions was similar in PRG-1+/− (n = 12) and their WT litters (n = 9, two-tailed t-test). However, after overnight fasting, fasting-induced hyperphagia was significantly increased in PRG-1+/− mice when compared to their wild type litters (n = 16 fasted WT and 14 fasted Prg-1+/− mice, P=0.003, two-tailed t-test).
f. Original traces of mEPSCs from Prg-1R346T mice and WT litters.
g. mEPSC showed significantly increased mEPSC frequencies with unaltered amplitudes in Prg-1R346T mice (n = 12 WT and n = 12 PRG-1R346T, P=0.028, two-tailed t-test).
h. Under non-fasting, control conditions food intake was not different between mice expressing the human PRG-1R345T SNP (Prg-1R346T/+ mice) and their WT litters (n = 8 C WT, n = 11 Prg-1R346T/+). After fasting, however, Prg-1R346T/+ mice displayed significantly increased fasting induced hyperphagia when compared to their WT litters (n = 17 F WT and n = 13 F Prg-1R346T/+ mice, P=0.007,one-tailed t-test).
Bars represent mean and SEM, points represent individual values. *p<0.05, **p<0.01, ****p<0.0001. Illustration was created with BioRender.
Next, we tested whether a pre-existing, synaptic LPA-related increase in cortical excitability is able to potentiate fasting-induced hyperphagia. To accomplish this, we assessed Prg-1+/− animals, which have been previously shown to display a gene-dosage effect leading to 50% reduction in PRG-1 protein levels and resulting in a cortical hyperexcitability half-way between wild type and Prg-1−/− animals 1. Here, Prg-1+/− animals showed a significant increase in fasting-induced hyperphagia when compared to their wild type litters while food intake per se was not altered under non-fasting conditions (Fig. 2e). In order to assess the translational potential of our findings, we next assessed fasting-induced hyperphagia in Prg-1R346T/+ mice. Loss of PRG-1`s synaptic function, as induced by the Prg-1R346T SNP, would thus lead to increased synaptic LPA signaling and augmented glutamatergic transmission 3,4. To test for this, we first assessed mEPSCs in PRG-1R346T animals. We detected an increased glutamatergic release probability pointing to a constitutively higher cortical network excitability under baseline conditions (Fig. 2f,g). Prg-1R346T/+ mice displayed a significant increase in fasting-induced hyperphagia, which was comparable to fasting-induced hyperphagia in Prg-1R346T/+ animals and points to a critical role of LPA-mediated cortical excitability in food-intake control (Fig. 2h, Extended Data Fig. 5a). In order to exclude that our observations might have been influenced by secondary effects like altered locomotion, we assessed spontaneous locomotion of non-fasted and fasted animals in an open field setting. Here, we did not observe a significant changes in locomotion after 18h fasting (Extended Data. Fig. 4c–f), which is in line with data from other groups for a similar fasting period 27.
In sum, our observation may thus point to a causal relationship between cortical hyperexcitability in human subjects with eating disorders, as successful therapeutic intervention modulating cortical excitability was shown in these subjects by repeated transcranial magnetic stimulation (rTMS) and transcranial direct current stimulation (tDCS) 28.
Synaptic lipid signaling modulates food intake and body weight
Since LPA-related cortical excitability modulates fasting-induced hyperphagia, we assessed the role of cortical excitability in long-time body weight changes (see the experimental setting in Figure 3a). Already under standard diet conditions Prg-1R346T/+ mice displayed a significantly higher body weight (Fig. 3b). Regular body weight assessed over six weeks confirmed the significant higher body weight increase in Prg-1R346T/+ mice when compared to wild type animals (Fig. 3c). Food intake assessment under control conditions over a full 24h period revealed higher food intake in Prg-1R346T/+ mice when compared to WT littermates (Extended data Fig. 5b). In order to assess the translational potential of this finding, we assessed human PRG-1R345T/+ mutation carriers finding a higher BMI and a higher prevalence for Diabetes type II (Extended data Fig. 5c,d). These data suggest that higher synaptic lipid-induced cortical excitability in PRG-1R345T/+ mutation carriers leading to a putative higher food intake has long-term effects in humans resulting in a higher BMI, which is associated with metabolic disorders like Diabetes mellitus Type 2. To clarify the role of higher cortical excitability in more detail, we assessed body weight changes in wild type and Prg-1−/− animals under high fat diet finding a significant body weight increase in the latter animals when compared to wild mice (Fig. 3d). ATX-inhibition significantly reduced wild type animals body weight under continuation of high fat diet, however, it led to a significantly higher body weight reduction in Prg-1−/− animals when compared to their wild type litters (Fig. 3e). Assessment of food intake suggests that the observed weight loss could be attributed to lower food intake in PF8380-treated wild type animals when compared to non-treated litters (Fig. 3f). These data were confirmed in Prg-1+/− animals on high fat diet, which displayed significant body weight reduction and lower food intake under PF8380 treatment (Fig. 3g,h). However, pharmacological assessment of the ATX-inhibitor PF8380 showed rapid appearance of a metabolic product suggesting relatively low metabolic stability of PF8380 (Extended Data Fig. 5 e,f).
Figure 3. Synaptic lipid signaling modulates body weight under control diet and under high fat diet.
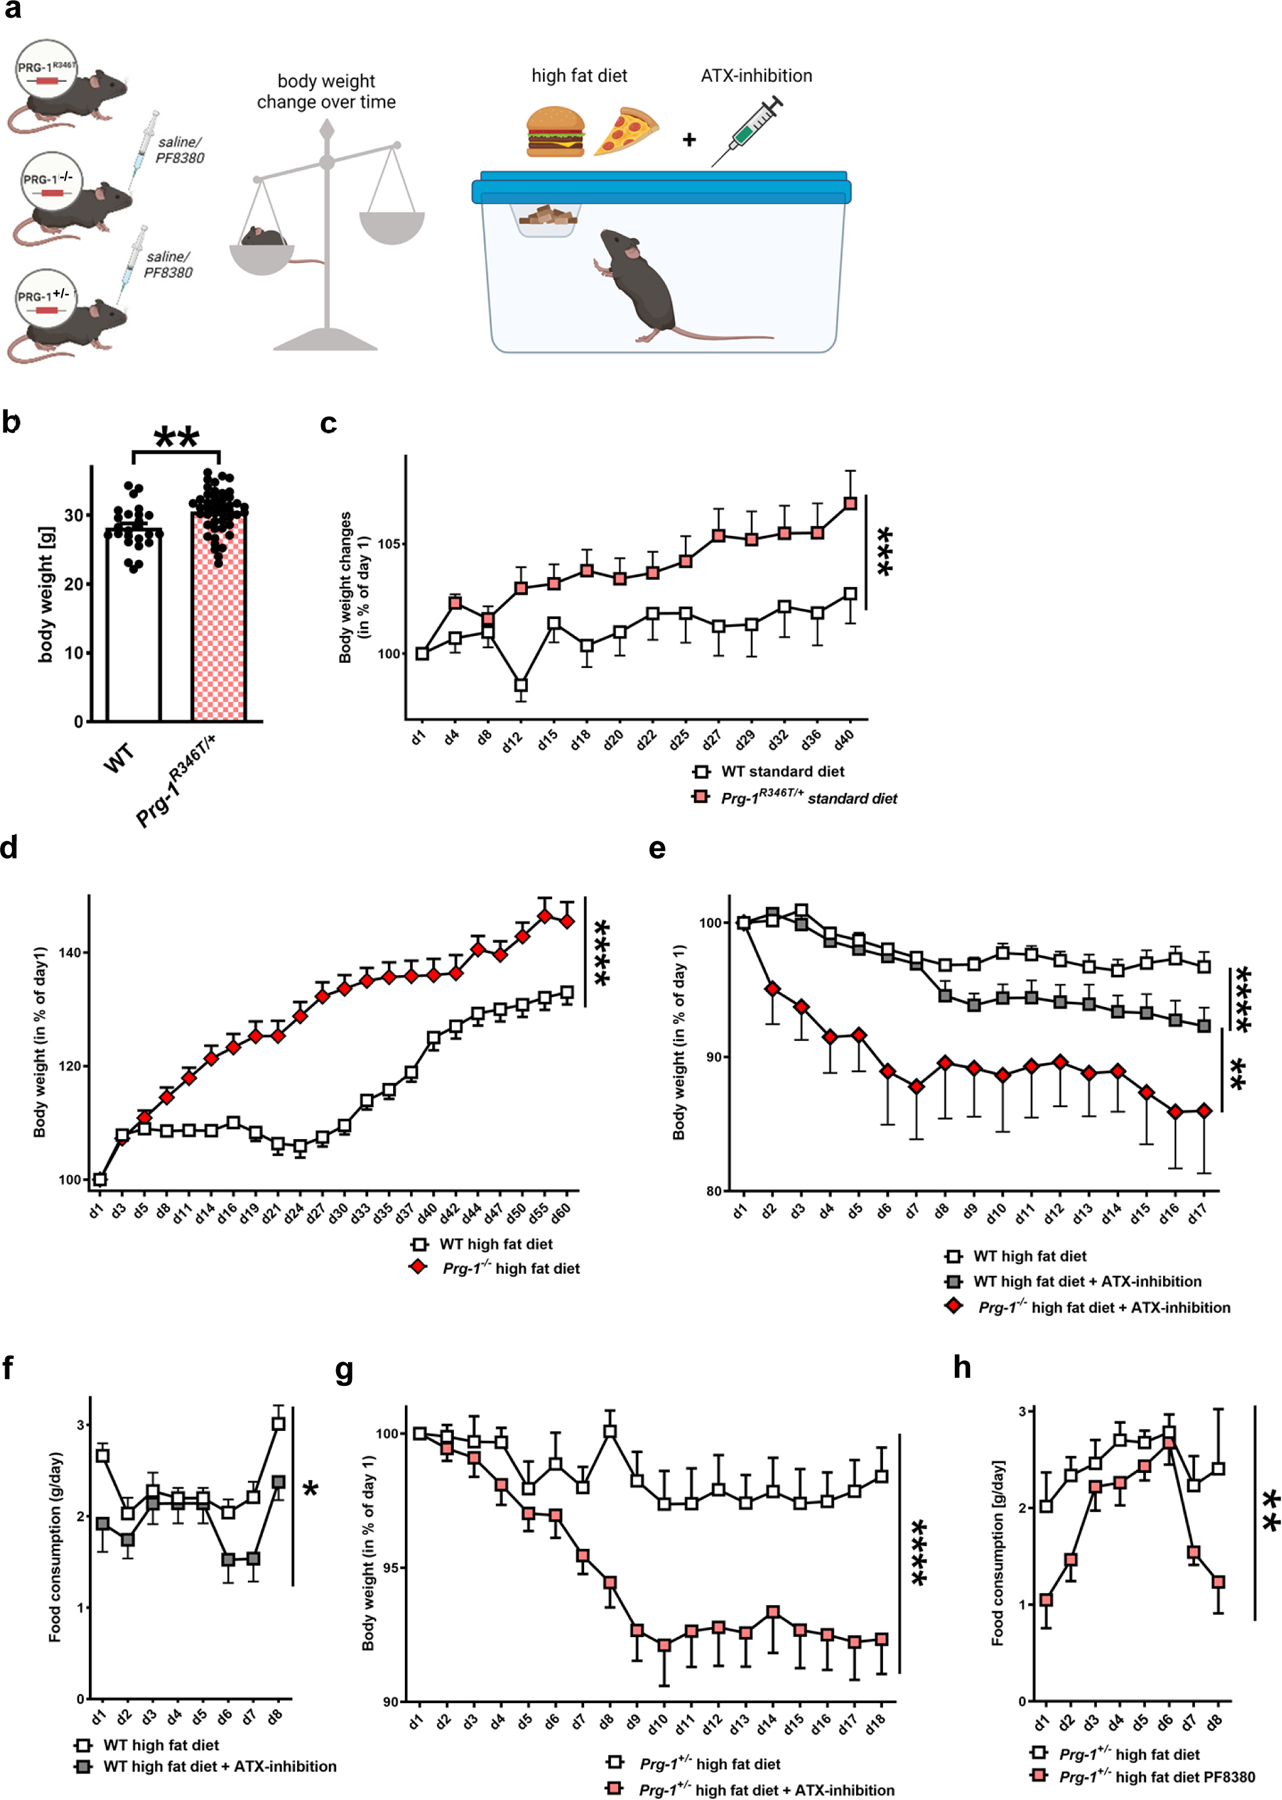
a. Experimental design.
b. Prg-1R346T/+ (17,1 ± 3 weeks) mice display significantly higher BW than WT at similar age (WT 16,9 ± 3 weeks) (n = 25 WT mice and 46 Prg-1R346T/+ mice, P=0.0032, two-sided t-test).
c. BW changes over 6 weeks (+/− 1 day started at around 17 weeks) on standard diet revealed higher increase in Prg-1R346T/+ animals (n = 25 WT mice and 31 Prg-1R346T/+ mice, 2 way ANOVA, P=0.0008 for days on standard food x genotype).
d. Prg-1−/− animals show higher increase in BW during a high fat diet when compared to WT mice (n = 27 WT mice and 12 Prg-1−/− mice, 2-way RM ANOVA, P<0.0001, days on high fat diet x genotype).
e. ATX-inhibition by PF8380 under continuation of high fat diet resulted in significant weight loss in WT animals when compared to non-treated WT animals. However, Prg-1−/− animals under ATX-inhibition by PF8380 displayed significantly higher weight loss than WT mice under ATX-inhibition by PF8380 (n = 13 WT, 14 WT + PF8380 animals and 5 Prg-1−/− + PF8380 animals, P<0.0001, 2-way RM ANOVA, time x PF-8380-treatment for WT vs. WT+PF8380 and PF-8389 treatment x genotype for WT+PF8380 and PRG-1−/−+PF8380, P=0.008, 2-way RM ANOVA).
f. Food intake under ATX-inhibition by PF8380 was significantly reduced in WT mice (n = 13 controls and 14 PF-8380 treated WT animals, 2way RM-ANOVA, P=0.044, PF8380 treatment)
g. Following high fat diet, ATX-inhibition by PF8380 under continuation of high fat diet resulted in significant BW reduction in treated Prg-1+/− mice when compared to non-treated Prg-1+/− mice (n = 16 Prg-1+/− mice and 18 Prg-1+/− PF8380 treated mice, 2way RM ANOVA, P<0.0001, time x PF8380 treatment)
h. Food intake in Prg-1+/− animals was signficantly reduced following ATX-inhibition by PF8380 (n = 9 Prg-1+/− mice and 9 Prg-1+/− PF8380-treated mice, 2way RM ANOVA, P=0.0076, Pf8380 treatment)
Dots show single values, bars represent mean, error bars represent SEM, which are shown for better visibility in c-h only in one direction. p*<0.05, p**<0.01, p***<0.001, p****<0.0001. Illustration was created with BioRender.
Fasting-induced cortical excitability via synaptic lipid signaling relies on AgRP circuit integrity
NPY/AgRP expressing neurons in the hypothalamic arcuate nucleus are critical for peripheral lipid mobilization and complex behaviors during food-restricted periods 19. Thus, we next tested whether hypothalamic AgRP circuit integrity is involved in fasting-associated LPA changes. We analyzed LPA-levels in the blood plasma of fasted controls and fasted animals following diphtheria toxin (DT) ablation of AgRP neurons expressing the diphtheria toxin receptor (AgRPDTR) 29. While under fed conditions control and AgRPDTR mice did not show differences in blood free fatty acids as shown previously in periadolescence 19, after fasting we found reduced total LPC and total LPA plasma levels as well as diminished LPC 18:1 and LPA 18:1 levels in the blood plasma of fasted DT-treated AgRPDTR animals when compared to fasted control animals (saline treated AgRPDTR mice; Fig. 4b,c and Extended Data Fig. 6a,b). In addition, we analyzed CSF levels of the synaptically active LPA 18:1 as well as total LPA levels. Since high inter-individual variations may obscure group differences for single metabolites 30 and due to the high variation of total CSF LPA levels in the analyzed animals (Fig. 4d and Extended Data Fig. 6c,d), LPA 18:1 levels were calculated as ratio to total CSF LPA levels as previously described by others 31,32. Here, we found a significantly reduced ratio of LPA 18:1 to total LPAs as well as reduction of other LPA subtypes ratio in the CSF of AgRPDTR mice when compared to control animals (Fig. 4e, Extended Data Fig. 6e). This ratiometric data allows for a functional understanding of phospholipid effects at the synapse where high levels of other LPA subtypes may compete out LPA 18:1. Since the LPA-modulatory molecules ATX and PRG-1 are well-expressed in the upper layers of the prefrontal cortex (Extended Data Fig. 7), we assessed mEPSCs in the prefrontal cortex (layer II/III) of fasted control and fasted AgRP neuron ablated animals (AgRPDTR). Here, we detected significant lower frequencies and lower amplitudes of mEPSCs on cortical principal cells of fasted AgRPDTR mice when compared to controls (Fig. 4f,g) pointing to reduced fasting-induced cortical excitability in AgRPDTR animals. In order to assess the magnitude of the effect of hypothalamic AgRP depletion on fasting-induced increase of cortical excitability, we compared the reduction of mEPSCs in fasted AgRPDTR mice (when compared to mEPSCs of fasted controls) to the mEPSC increase in fasted control mice (when compared to mEPSCs of non-fasted mice) finding no significant difference (Fig. 4h). These data indicate that fasting-induced LPA-increases depend on AgRP neuronal activity leading to an increased presynaptic glutamatergic release probability, which in turn results in an increased cortical network excitability. This synaptic lipid signaling has been shown to play a role in psychiatric disorders 1–4, and our data may also be relevant to other altered complex behaviors, including stereotypy and anorexia nervosa symptomatology in mice with altered AgRP neuronal activity in different ages 19,21.
Figure 4. Fasting-induced hyperphagia depends on AgRP circuit integrity.
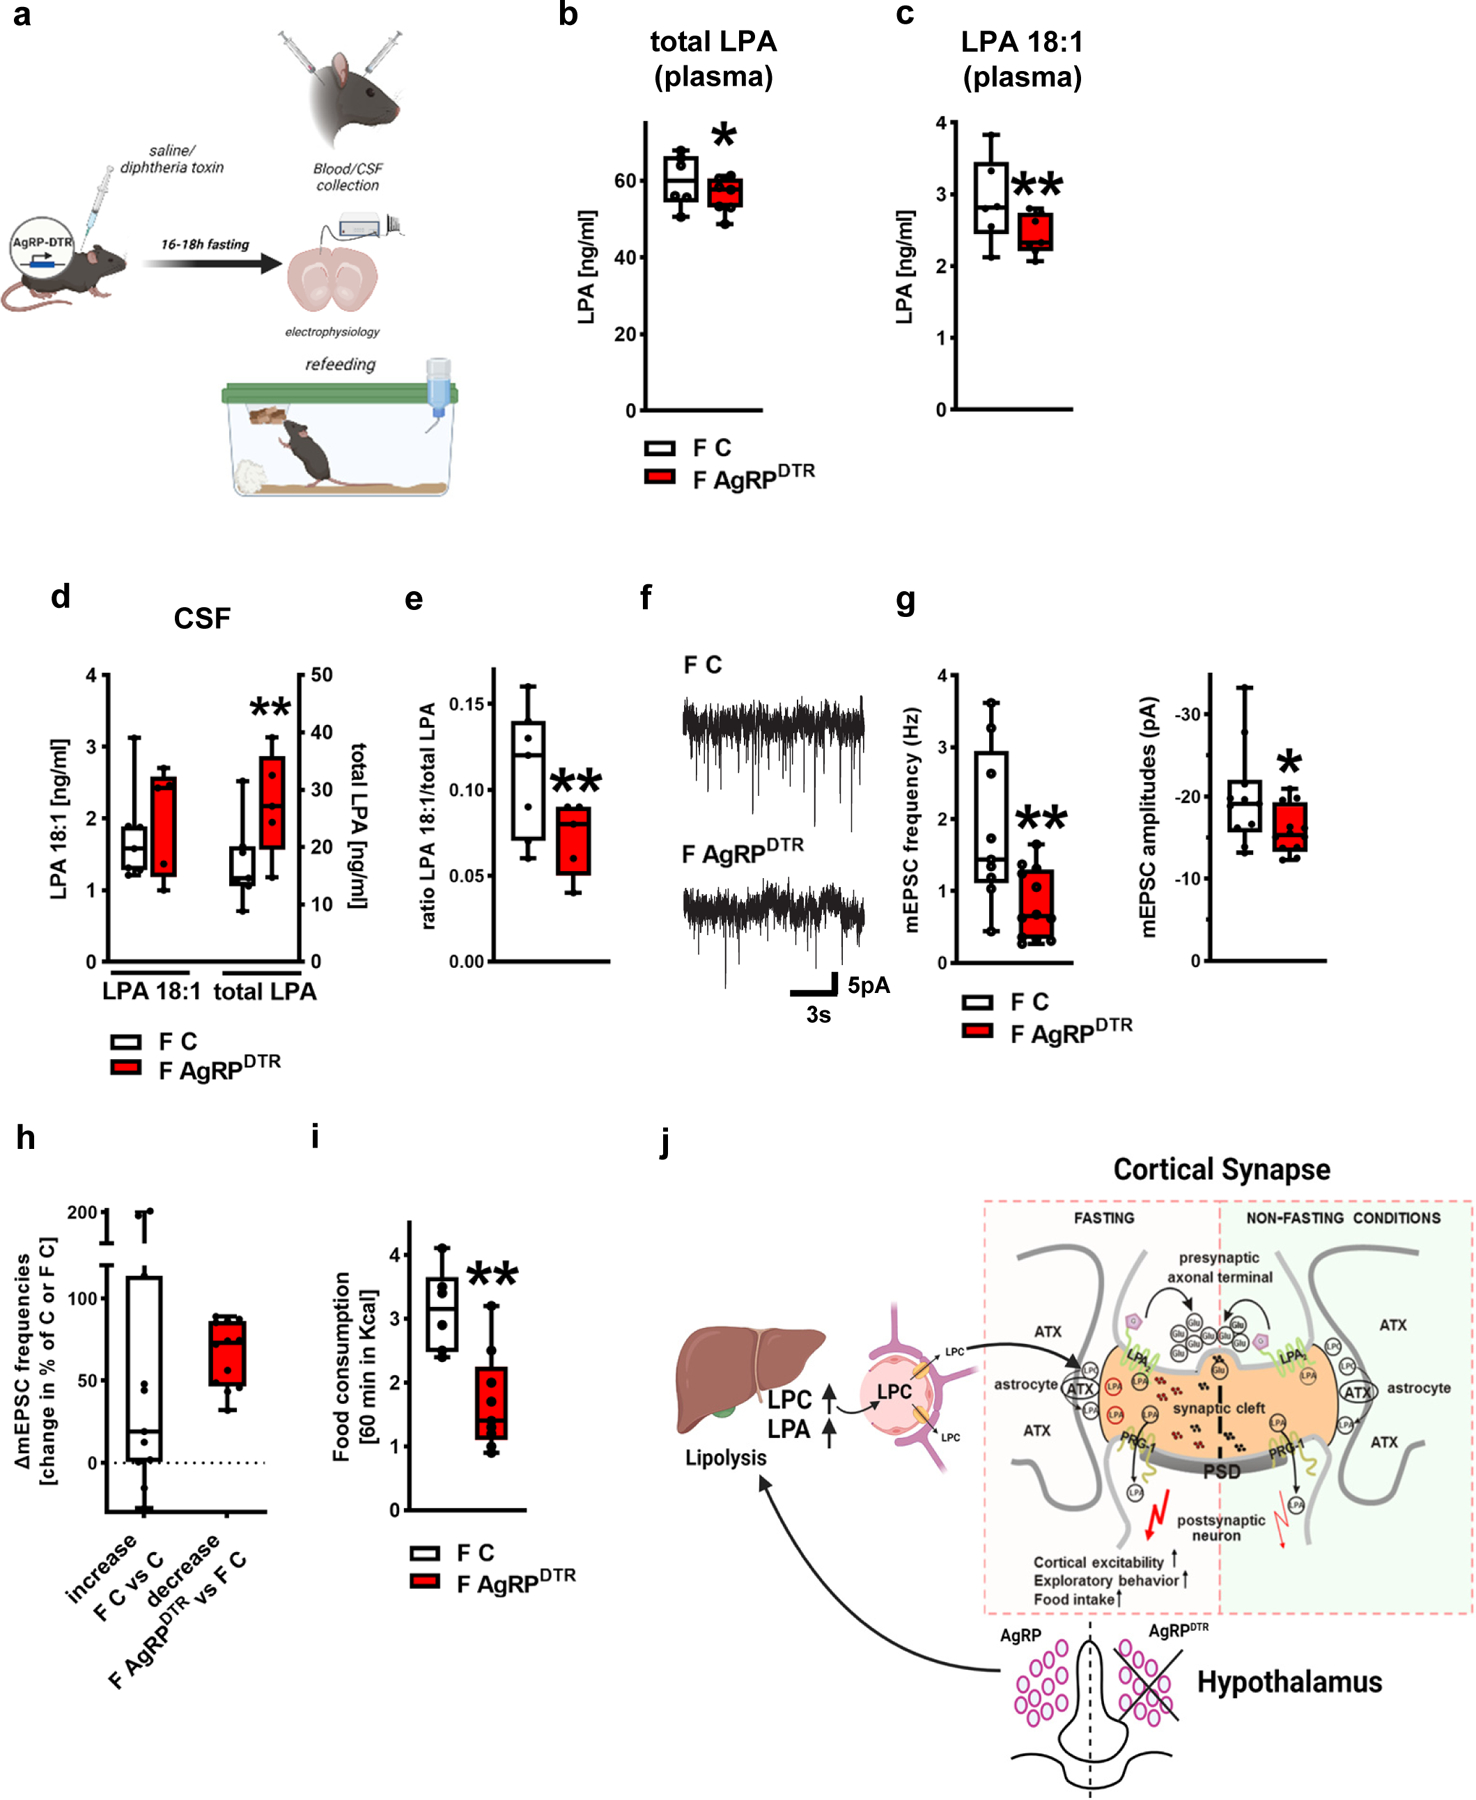
a. Experimental design.
b. Total LPA blood plasma levels were significantly decreased in fasted AgRPDTR (F AgRPDTR) mice (F C, n= 6 fasted controls (F C) and 7 fasted AgRPDTR mice, group differences: 81.0%, Bayesian analysis).
c. Analysis revealed reduced plasma LPA 18:1 levels in fasted AgRPDTR mice (n = 6 F C and 7 F AgRPDTR mice, group differences: 90.5%, Bayesian analysis).
d. CSF LPA 18:1 levels were comparable in fasted AgRPDTR mice and fasted control animals (left, group differences: 68.4%) while total LPA levels were significantly increased in fasted AgRPDTR mice displaying a high variation (n = 7 fasted control mice and 5 fasted AgRPDTR mice, group differences: 92,6%, Bayesian analysis).
e. CSF levels of the synaptic active LPA 18:1 calculated as ratio to total CSF LPA levels in the corresponding animals showed significant reduction in fasted AgRPDTR mice (n = 7 fasted control mice and 5 fasted AgRPDTR mice, group differences: 93.5%, Bayesian analysis).
f. Original traces displaying mEPSCs from prefrontal cortical neurons from fasted control (F C) and fasted, DT-treated AgRPDTR animals (F AgRPDTR).
g. mEPSCs frequency and amplitudes were reduced in neurons of fasted AgRPDTR animals (n = 9 [frequency] and 11 [amplitudes] of fasted controls (F C) and n = 12 for fasted AgRPDTR mice, P = 0.0077 for frequency and P = 0.044 for amplitudes, two sided t-test).
h. mEPSC changes of fasted controls (n = 9 F C increase compared to mean of non-fasted controls shown in Fig. 1h) and fasted AgRPDTR animals (n = 12 F AgRPDTR reduction compared to mean of fasted controls shown in Fig. 4g, two sided Mann Whitney test) did not reveal significant differences.
i. Fasting-induced hyperphagia was significantly decreased in AgRPDTR mice (n = 6 F C and n = 9 F AgRPDTR, P = 0.0022, two tailed t-test).
j. Scheme of fasting-induced increase of cortical excitability by peripheral produced LPA precursors. Following overnight fasting, glycogen stores in the liver are depleted and lipolysis is increased leading to LPC-release in the blood causing increased LPA-levels after overnight fasting via ATX-dependent synthesis in the blood. Our data suggests that this first step in metabolic adaptation to fasting conditions is regulated by AgRP neurons in the hypothalamus. However, following peripheral release upon fasting, LPC is selectively transported across the blood-brain barrier and is metabolized by astrocytic ATX at glutamatergic synapses to generate local LPA which stimulates presynaptic LPA2-receptors leading to fasting-induced increase of glutamatergic transmission and cortical network excitability. In turn, fasting-induced cortical excitability drives fasting-induced hyperphagia as shown by present data.
Box plots and whiskers show data from min to max, line shows median, points represent individual values. *p<0.05, **p<0.01 or group differences of * >80% or **>90% for Bayesian analysis. Illustration was created with BioRender.
Fasting-induced hyperphagia is dependent on AgRP circuit integrity
Finally, in support of the above data sets, we assessed fasting-related hyperphagia in control and AgRP neuron depleted animals (AgRPDTR). While under control conditions (ad libitum fed mice) control and AgRPDTR mice did not show differences in food intake as reported previously in perybupertal mice 19, here, we observed diminished fasting-related hyperphagia in fasted DT-treated AgRPDTR animals when compared to control animals (Fig. 4i). These data show that changes in peripheral energy metabolism alter cortical LPA levels and subsequent cortical excitability, which both seem to depend on the integrity of the AgRP circuit. Cortical hyperexcitability led to higher fasting-induced hyperphagia, while reduction of fasting-induced increase in the peripheral LPC/LPA axis as seen in DT-treated AgRPDTR animals, which showed no cortical hyperexcitability, resulted in significant reduction of fasting-induced hyperphagia. These findings point to a body-to-brain pathway how the hypothalamus controls cortical excitability and food-intake behaviors through peripheral modulation of lysophospholipid signaling (for schematic overview of the analyzed circuitry involving central-peripheral interaction see Fig. 4j).
Discussion
It is widely accepted that changes in peripheral energy metabolism affect neuronal activity in the brain, including the cerebral cortex 33. However, the molecular pathways linking changes in peripheral energy metabolism with cortical functions are not yet well understood.. Based on principles of contemporary neurobiology pioneered by early 20th century researchers, most notably by Santiago Ramon y Cajal 34, it has been assumed that cortical functions are impacted by lower brain regions via ascending neuronal pathways originating, for example, in the hypothalamus. Indeed, increasingly sophisticated methods have been brought to bear on these issues in the past 20 years, and dozens of rigorous studies unmasked multiple ways how these hypothalamic neurons receiving metabolic signals forward ascending information via neuronal routes 35. In relation to hunger, hypothalamic AgRP neurons have been found to play a crucial role in organizing complex behaviors 19,21. In fact, our results revealed that the peripheral metabolic state under the control of hypothalamic AgRP neurons has a direct impact on cortical excitability via the LPC-LPA signaling axis (see also schematic overview in Fig. 4j). Fasting-induced cortical excitability likely resulted from peripheral adaptation of lysophospholipid metabolism, which was under control of hypothalamic AgRP neurons. In turn, these quantitative changes in circulating lipid species, specifically LPA 18:1, themselves, served as downstream signaling molecules to align cortical adaptation to the changing metabolic state. However, there are remaining important questions to be resolved. For example, we do not predict that the robust phenotype triggered by adult depletion of AgRP neurons using diphteria toxin can be rescued by central augmentation of LPA. Our work is not arguing of an exclusive role of the AgRP-LPA pathway in feeding control. For example, the kinetics of the rise of the studied lipid species during food deprivation indicate that LPA action may not explain rapid feeding triggered by opto- or chemogenetic activation of AgRP neurons. At present, we do not know what subpopulation of AgRP neurons within the arcuate nucleus are responsible for the action on LPA. Whether it is via collaterals of the same AgRP cells that are involved with other mechanisms of feeding control as well or they represent a unique sub-population of AgRP neurons, will need to be determined. With that information in hand, selective manipulation of those neurons may be achieved through which we may be able to more precisely decipher the quantitative and qualitative contribution of AgRP cells to brain functions associated with the central LPA system.
Our observations have multiple implications and identified peripheral lipid species as potential targets for control of cortical functions in physiology and disease. In this regard, it is of interest to note that we recently showed the relevance of AgRP circuit-controlled peripheral lipid metabolism as core to short- and long-term consequences in animal models of anorexia nervosa 19. Based on our current observations, we suggest that alterations in LPC and LPA species may have a direct role in the etiology of cortical hyperexcitability in anorexia nervosa 36 and other psychiatric conditions associated with changes in inhibition/excitation balance as suggested by recent studies 4. Our data suggest that optimization towards improved target engagement and metabolic stability of ATX inhibitors such as PF8380 might represent a starting point for the design of novel drugs supporting therapies of eating disorders. Along these lines, our studies give further support to the notion that AgRP circuit integrity is a significant contributor to healthy and diseased functions of the brain beyond feeding and energy homeostasis 19–21,35. Finally, while our studies do not indicate exclusivity of the pathway, we identified a lipid-mediated control of complex behaviors. In conjunctions with other works, our results suggest that the information flow between homeostatic brain regions and higher executive brain regions occur via both ascending brain circuits as well as via mediation of the periphery.
Experimental Model and Subject Details
Mouse models
Husbandry: all animal procedures were conducted in compliance with protocols approved by the local authorities (Landesuntersuchungsamt Rheinland-Pfalz or by the Institutional Animal Care and Use Committee (IACUC) at Yale University) and are in accordance with NIH guidelines. Mice were housed at 22-24°C in humidity-controlled rooms (55%) with 12 hr light/dark cycle. Animals had ad libitum access to water and standard rodent chow (V1124-300, sniff Spezialdiäten GmbH, D-59494 Soest, Germany) with exception of the fasting experiments.
Mouse lines
C57Bl/6J were obtained from Janvier, France. Lpa2−/− male mice were generated as previously been described 37. Generation of male Atxfl/fl mice as well as their genotyping was previously described 37. For cortex-specific deletion Atxfl/fl animals were crossed with an Emx1-Cre line 39. Prg-1R346T and PRG-1+/− male transgenic mice were generated as previously described and were genotyped accordingly 1,4. Male and female animals expressing the human diphtheria toxin receptor to the Agrp locus (AgRPDTR) were generated as previously described 29.
Ablation of AgRP neurons
Adult AgRPDTR animals were injected once with diphtheria toxin (50 μg/kg, i.p.) diluted in sterile saline (0.9% NaCl).
Methods
Fasting, behavioral experiments, refeeding and high fat diet
C57Bl/6J male animals (at least 10-12 weeks old) or genetic modified mice as indicated were acclimatized in the facility for 7 days prior to the experiment and habituated to the experimental conditions. Animals analyzed under different conditions were matched for weight and/or age. Experiments were performed – if not otherwise stated - during the light phase after a fasting period of at least 16-18h (started 1h before beginning of the dark phase on the previous day), while water was available ad libitum. For assessment of food consumption, food was weighted before and after an interval of 60 min for fasted mice, and during an interval of 4h in the light phase for obtaining baseline values of non-fasted mice. Behavioral analyses were performed following habituation to the test arena. Spontaneous activity was assessed using Noldus Ethovision video-tracking in the open field arena (50 cm x 50 cm x 50cm; illumination 120 lux). Here, mice were placed in the center and allowed to explore the open field arena for 10 min. The behavior was recorded to calculate the distance traveled. For assessment of the exploratory behavior 24 animals were exposed to a novel object and interaction was measured for 5 min. Exploration was defined as an object investigation when the mouse nose was closer than 2 cm to the object. Animals showing no interaction were excluded. High fat diet was provided by feeding DIO series diets from Research Diets, Inc. (New Brunswick, NJ, USA). Briefly, D12451 (45% kcal fat) and D12450 as a control diet. Animal weight was regularly assessed and changes were calculated to the corresponding days after diet start (± 1 day). The ATX-inhibitor PF8380 was administered daily or 3h before animal testing via i.p. application at a concentration of 30mg/Kg body weight (using DMSO as a vehicle) as previously described or by daily application during high fat diet 3,4,40. Control animals received the vehicle DMSO.
Experimentators were blind to the genotypes when analyzing animals of different genotypes. Experimental design figures were created with BioRender.com.
Blood plasma and CSF sample collection
Mice were injected with a mixture of ketamine (100 mg/kg) and xylazine (10 mg/kg) and placed in the stereotaxic frame when deeply anesthetized. The head overlying skin was incised to expose the skull and the posterior neck muscles. The latter were cut off until the cisterna magna was visible through the translucent dura mater. After cleaning any blood residue with a cotton swab, the CSF was collected using a 31-gauge insulin needle (Becton Dickinson) and stored at −80°C. Collection of blood plasma followed CSF collection. Blood was collected and centrifuged at 12,000 xG for 15 minutes. Plasma was collected and stored at −80°C.
LC-MS/MS analysis of LPAs and LPCs
LPA analysis in blood plasma and CSF samples was performed with liquid chromatography-electrospray ionization-tandem mass spectrometry (LC-ESI-MS/MS) are described in detail in the Supplemental Material and Methods 41. The methods were adapted to low sample sizes to allow for analysis of LPAs in individual mouse CSF samples.
Electrophysiology
C57Bl/6J mice, weaned around postnatal day P16 and habituated to standard chow for at least 4 days before starvation, or adult AgRPDTR animals were used for electrophysiological analysis of hippocampal neurons or of prefrontal cortical neurons. After starvation, animals were anesthetized with isofluorane, decapitated and brain was rapidly removed and transferred to ice cold oxygenated ACSF (in mM: 126 NaCl, 2.5 KCl, 1.25 NaH2PO4, 1 MgCl2, CaCl2, 26 NaHCO3, 10 D-glucose). After cutting with a vibratome (Leica Biosystems), horizontal brain slices containing the hippocampus or the prefrontal cortex were equilibrated for at least 1h. Whole cell neuronal recordings (hippocampal CA1 neurons or layer II/III prefrontal neurons) were performed at 32°C at a holding potential of −70mV using patch pipettes (3-9 MOhm) filled with (in mM): 110 K-gluconate, 20 KCl, 5 NaCl, 5 EGTA, 20 K-HEPES, 0.5 CaCl2, 2 MgATP, 0,3 NaGTP. mEPSC measurements were recorded after addition of 0,5µM TTX and 10µM SR-95531 to the ACSF. 1µM HA-130, 10µM 18:0 or 18:1 LPA) were added via continuous flow as bath application 4. For the analysis of mEPSCs following application of LPA 18:0 and LPA 18:1 slices were pretreated with 100 µM cyclothiazide for 30 min 1. Recordings were performed using a low-pass filter at 2 kHz using an ELC-03XS amplifier (npi electronic) with a power3 1401 A/D converter (CED) and analyzed using Spike2 software (CED).
Statistics
Statistical analyses were performed with GraphPad Prism software (version 9) or with the BEST R package (version 4.1.2) for estimation of the Bayesian posterior distribution (for details see Suppl. Mat. and Meth.). Data are expressed as single values in box plots showing all data points or as bars representing the mean ± standard error of the mean (SEM) and dots representing single values. Appropriate statistical tests were chosen based on the experimental condition. Following outlier identification (using ROUT or Grubbs analysis), normal distribution of data was assessed using a corresponding normality test. For data analyzed with Bayesian statistical methods (using the BEST R package 4.1.2) see Extended Data Table 1 and Supplemental Material and Methods for details. When normal distribution was rejected, a non-parametric test was used as described. Significance was considered for p ≤ 0.05. For Bayesian posterior distribution, significance was defined as ≥ 80% difference between the means of the group values as well as an effect size ≥ 80% and were labelled with *, differences of the means ≥ 90% as well as an effect size ≥ 90% were considered highly significant and were labelled with ** 42.
Extended Data Table 1.
Group differences calculated as differences of the means are displayed as differences between the groups, which describes the ability to separate the compared groups. Accuracy ranges for the differences of the means ≥80% as well as an effect size ≥80% were considered significant (*), differences of the means ≥ 90% as well as an effect size ≥ 90% were considered highly significant (**) (Johnson 2013).
| Bayesian posterior analysis | ||||
|---|---|---|---|---|
| group comparison | accuracy ranges of the differences of the means | significance | ||
| Fig. 1B | total LPA levels plasma | wt control vs. wt fasted | 96,9% | highly significant |
|
| ||||
| Fig. 1C | LPA subtypes plasma levels | wt control vs. wt fasted | ||
| LPA 16:0 plasma | 97,1% | highly significant | ||
| LPA 18:0 plasma | 89,9% | significant | ||
| LPA 18:2 plasma | 60,9% | n.s. | ||
| LPA 20:0 plasma | 99,7% | highly significant | ||
| LPA 20:4 plasma | 99,1% | highly significant | ||
|
| ||||
| Fig. 1D | LPA 18:1 plasma | wt control vs. wt fasted | 83,8% | significant |
|
| ||||
| Fig. 1E | LPA 18:1 CSF | wt control vs. wt fasted | 96,4% | highly significant |
|
| ||||
| Fig. 1F | LPA subtypes CSF levels | wt control vs. wt fasted | ||
| LPA 16:0 CSF | 98,7% | highly significant | ||
| LPA 18:0 CSF | 90,3% | highly significant | ||
| LPA 18:2 CSF | 76,9% | n.s. | ||
| LPA 20:0 CSF | 60,0% | n.s. | ||
| LPA 20:4 CSF | 89,2% | significant | ||
|
| ||||
| Fig. 4B | total LPA levels plasma | fasted control vs fasted AgRPDTR | 81% | significant |
|
| ||||
| Fig. 4C | LPA 18:1 plasma | fasted control vs fasted AgRPDTR | 90,5% | highly significant |
|
| ||||
| Fig. 4D | total LPA levels CSF | fasted control vs fasted AgRPDTR | 92,6% | highly significant |
| LPA 18:1 CSF | 68,4% | n.s. | ||
|
| ||||
| Fig. 4E | ratio LPA 18:1 / total LPA | fasted control vs fasted AgRPDTR | 93,5% | highly significant |
|
| ||||
| Suppl Fig. S4B | LPA subtypes CSF levels | wt control vs. wt + PF8380 | ||
| LPA 16:0 | 97,6% | highly significant | ||
| LPA 18:1 | 99,2% | highly significant | ||
| LPA 18:2 | 84,5% | significant | ||
| LPA 20:4 | 69,9% | n.s. | ||
|
| ||||
| Suppl. Fig. S5B | Food intake | Wt control vs. PRG-1R346T/+ | 86,7% | significant |
|
| ||||
| Suppl Fig. S6A | total LPC LPC 18:1 |
fasted control vs fasted AgRPDTR | 88,0% 86,8% |
significant significant |
|
| ||||
| Suppl Fig. S6B | LPA subtypes plasma levels | fasted control vs fasted AgRPDTR | ||
| LPA 16:0 plasma | 79,7% | n.s. | ||
| LPA 18:0 plasma | 84,4% | significant | ||
| LPA 18:2 plasma | 68,4% | n.s. | ||
| LPA18:3 plasma | 85,7% | significant | ||
| LPA 20:4 plasma | 55,1% | n.s. | ||
|
| ||||
| Suppl Fig. S6C | LPA subtypes CSF levels | fasted control vs fasted AgRPDTR | ||
| LPA 16:0 plasma | 68,8% | n.s. | ||
| LPA 18:0 plasma | 69,4% | n.s. | ||
| LPA 18:2 plasma | 97,3% | highly significant | ||
| LPA 20:4 plasma | 95,5% | highly significant | ||
|
| ||||
| Suppl Fig. S6E | ratio LPA subtypes / total LPA | fasted control vs fasted AgRPDTR | ||
| LPA 16:0 plasma | 90,2% | highly significant | ||
| LPA 18:0 plasma | 97,5% | highly significant | ||
| LPA 18:1 plasma | 93,5% | highly significant | ||
| LPA 18:2 plasma | 98,8% | highly significant | ||
| LPA 20:4 plasma | 70,5% | n.s. | ||
Extended Data
Extended Data Fig. 1. ATX and PRG-1 expression in cortical neurons.
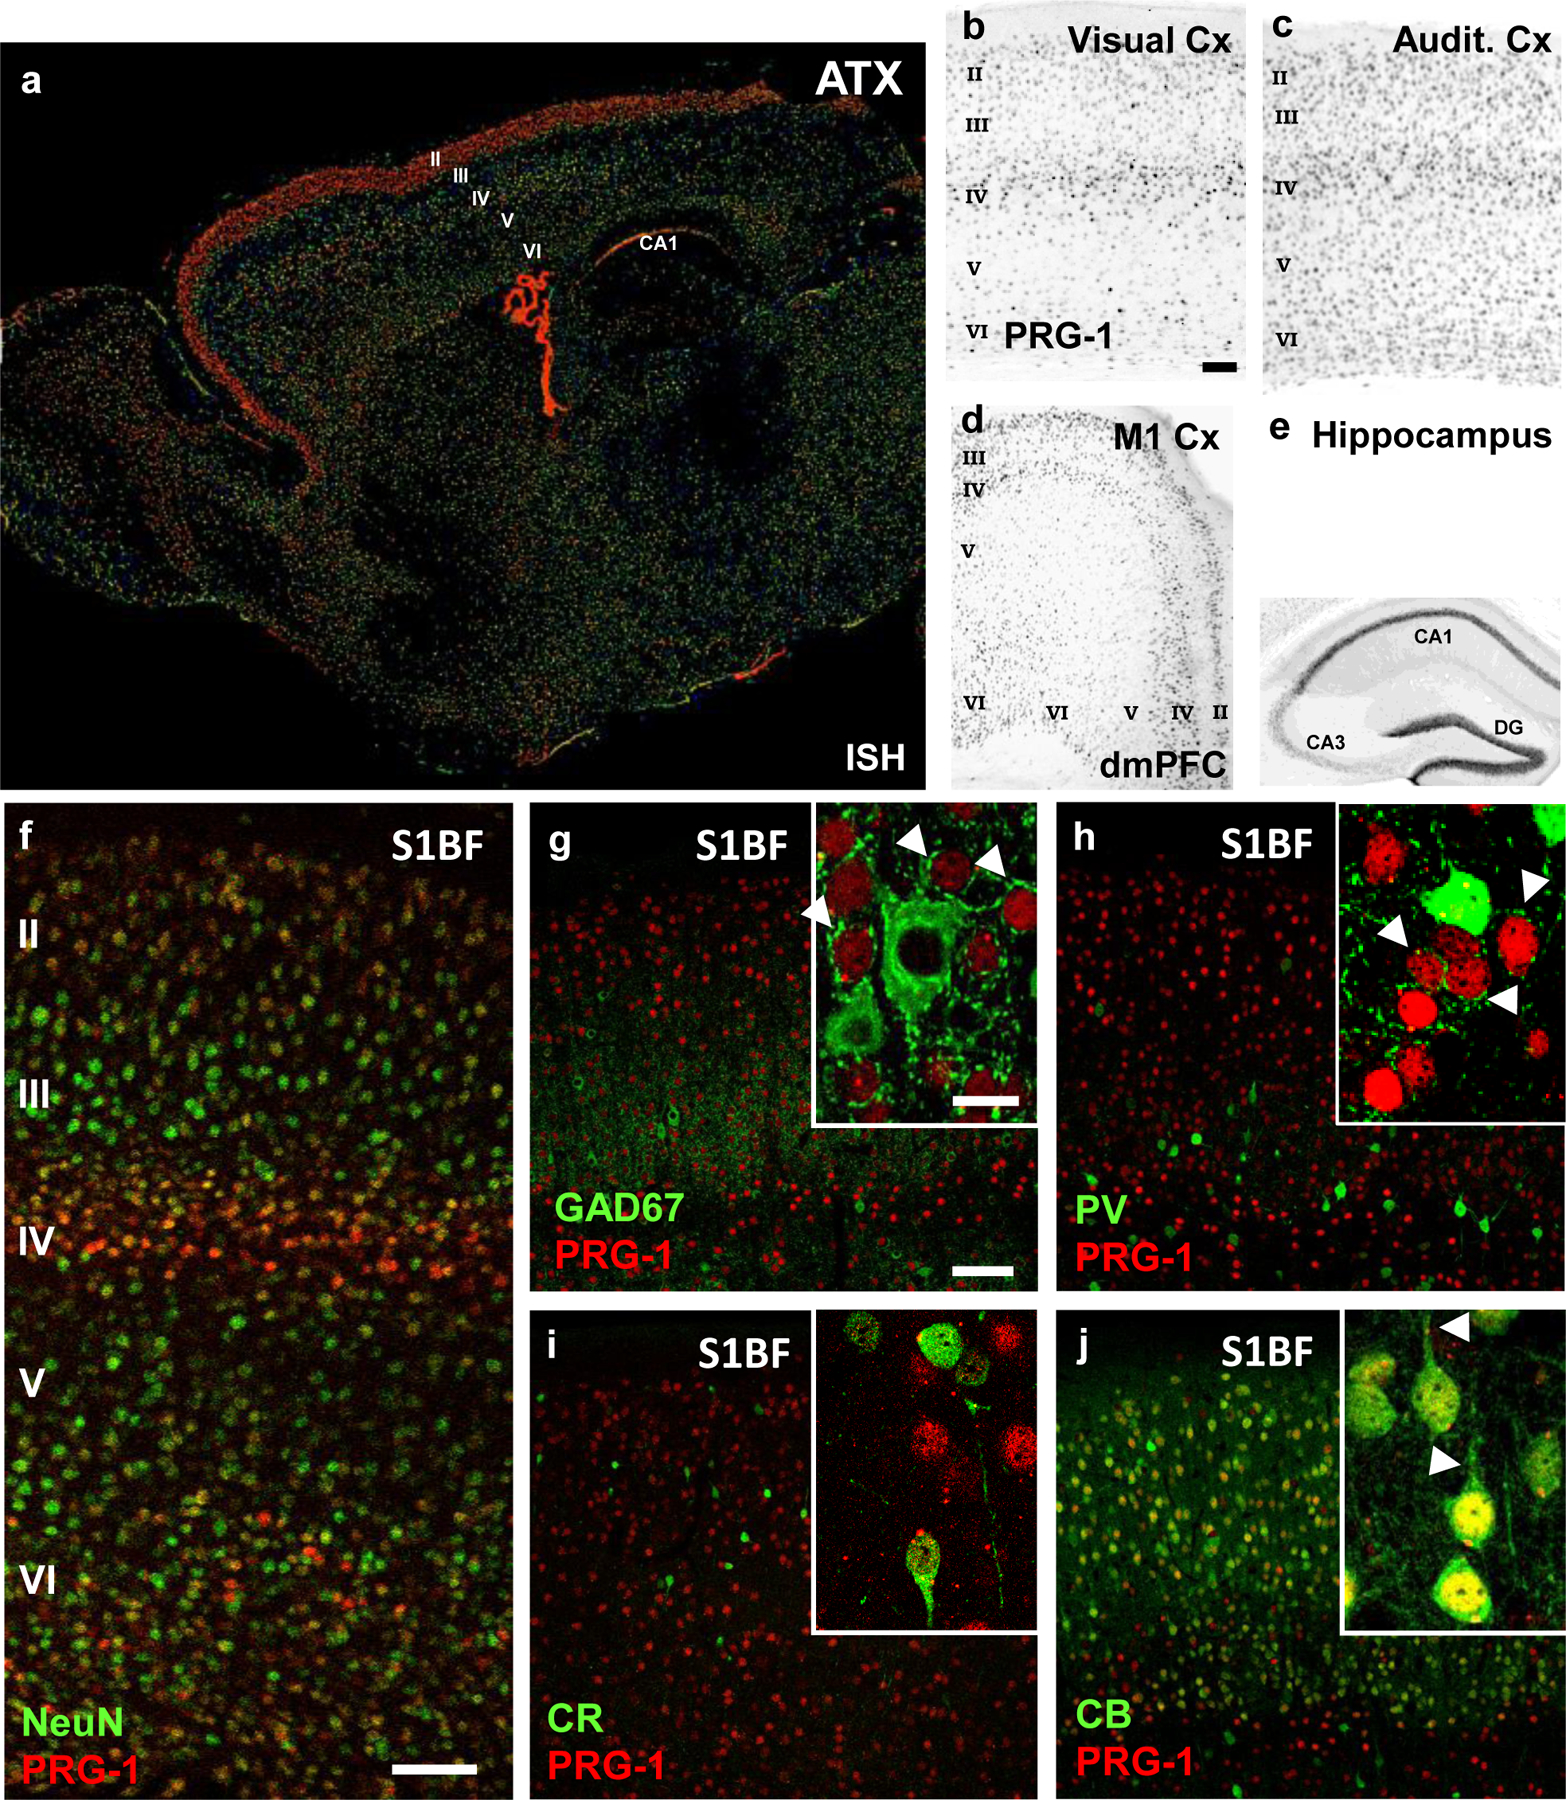
a. ATX expression as shown by in-situ hybridization is present in the cortex and in the choroid ventricular plexus. Interestingly, strong expression in the cortex can be observed in the upper cortical layers (most prominent in layer II), which are important for cortical information processing. Image from the Allen Mouse Brain Atlas (mouse.brain-map.org).
b-f. PRG-1 expression, as demonstrated by the ß-Gal reporter (for genetic details see Trimbuch et al., 2009), is predominantly found in the layers 2/3, 4 and 6 of the neocortex (visual cortex [A], auditory cortex [B], primary motor cortex [M1, C], dorsomedial prefrontal cortex [dmPFC,C] and primary sensory cortex [S1BF, F]). Strong expression was also found in the hippocampal formation (shown in E), as previously demonstrated.
g-i. Staining for inhibitory neurons (GAD67, parvalbumin [PV] and calretinin [CR]) in the primary somatosensory cortex revealed no expression of PRG-1 in interneurons. Note the strong perisomatic inhibitory synapses of the excitatory, PRG-1-expressing neurons (arrowheads in the inserts in G and H).
j. PRG-1 expression was detected in pyramidal (excitatory) neurons of the layer II, which express calbindin. Note the clear apical dendrites of these pyramidal neurons (arrowheads).
Scale bars: b-e 250 µm, f-j 100µm, insets 15 µm.
Extended Data Fig. 2. LPA 18:1 is a synaptic active LPA.
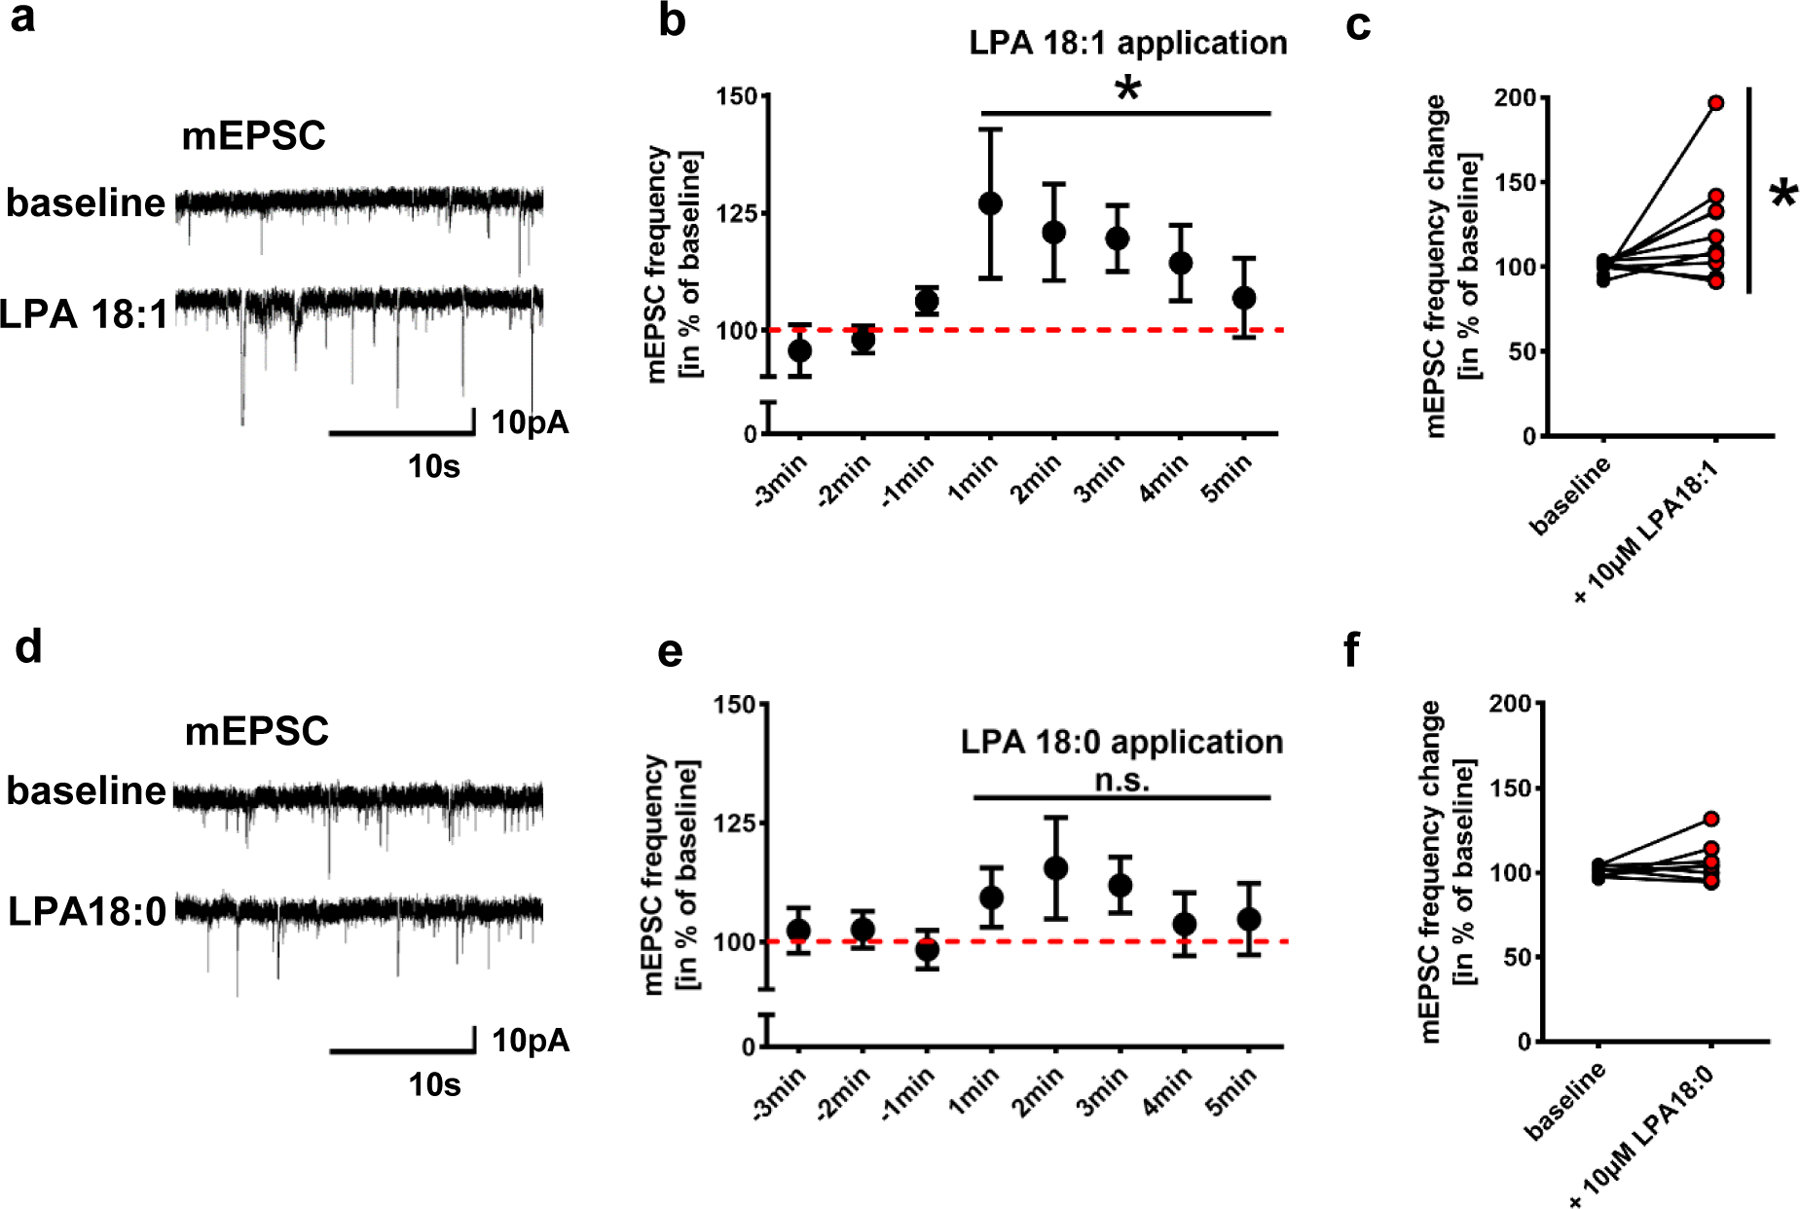
a. Original traces of patched neurons before and after LPA 18:1 application suggest higher number of miniature inward currents (mEPSCs) when compared to values before LPA18:1 application
b. Quantitative analysis of mEPSC frequencies following LPA 18:1 application were significantly increased when compared to baseline values before LPA 18:1 application (n = 10; P=0.0327, repeated measures one-way ANOVA). Data was calculated in % of the mean baseline over 5 min before drug application.
c. For better evaluation, mean of the baseline of individual neurons over 3 min before LPA 18:1 stimulation was compared to that during the first 3 min after LPA18:1 application finding significant differences (n = 10, P=0.027, two-tailed Wilcoxon matched-pairs signed rank test).
d. Original traces before and following of LPA 18:0 application show comparable mEPSCs.
e,f. Quantitative analysis revealed no significant effect of LPA 18:0 application on mEPSC frequency (n = 9; repeated measures one-way ANOVA). Before and after LPA 18:0 application mean values of individual neurons were calculated as described above and shown in f (n = 8, two tailed Wilcoxon matched-pairs signed rank test).
Points and bars in b and e represent mean and s.e.m.
Extended Data Fig. 3. Fasting increases cortex-related exploratory behavior.
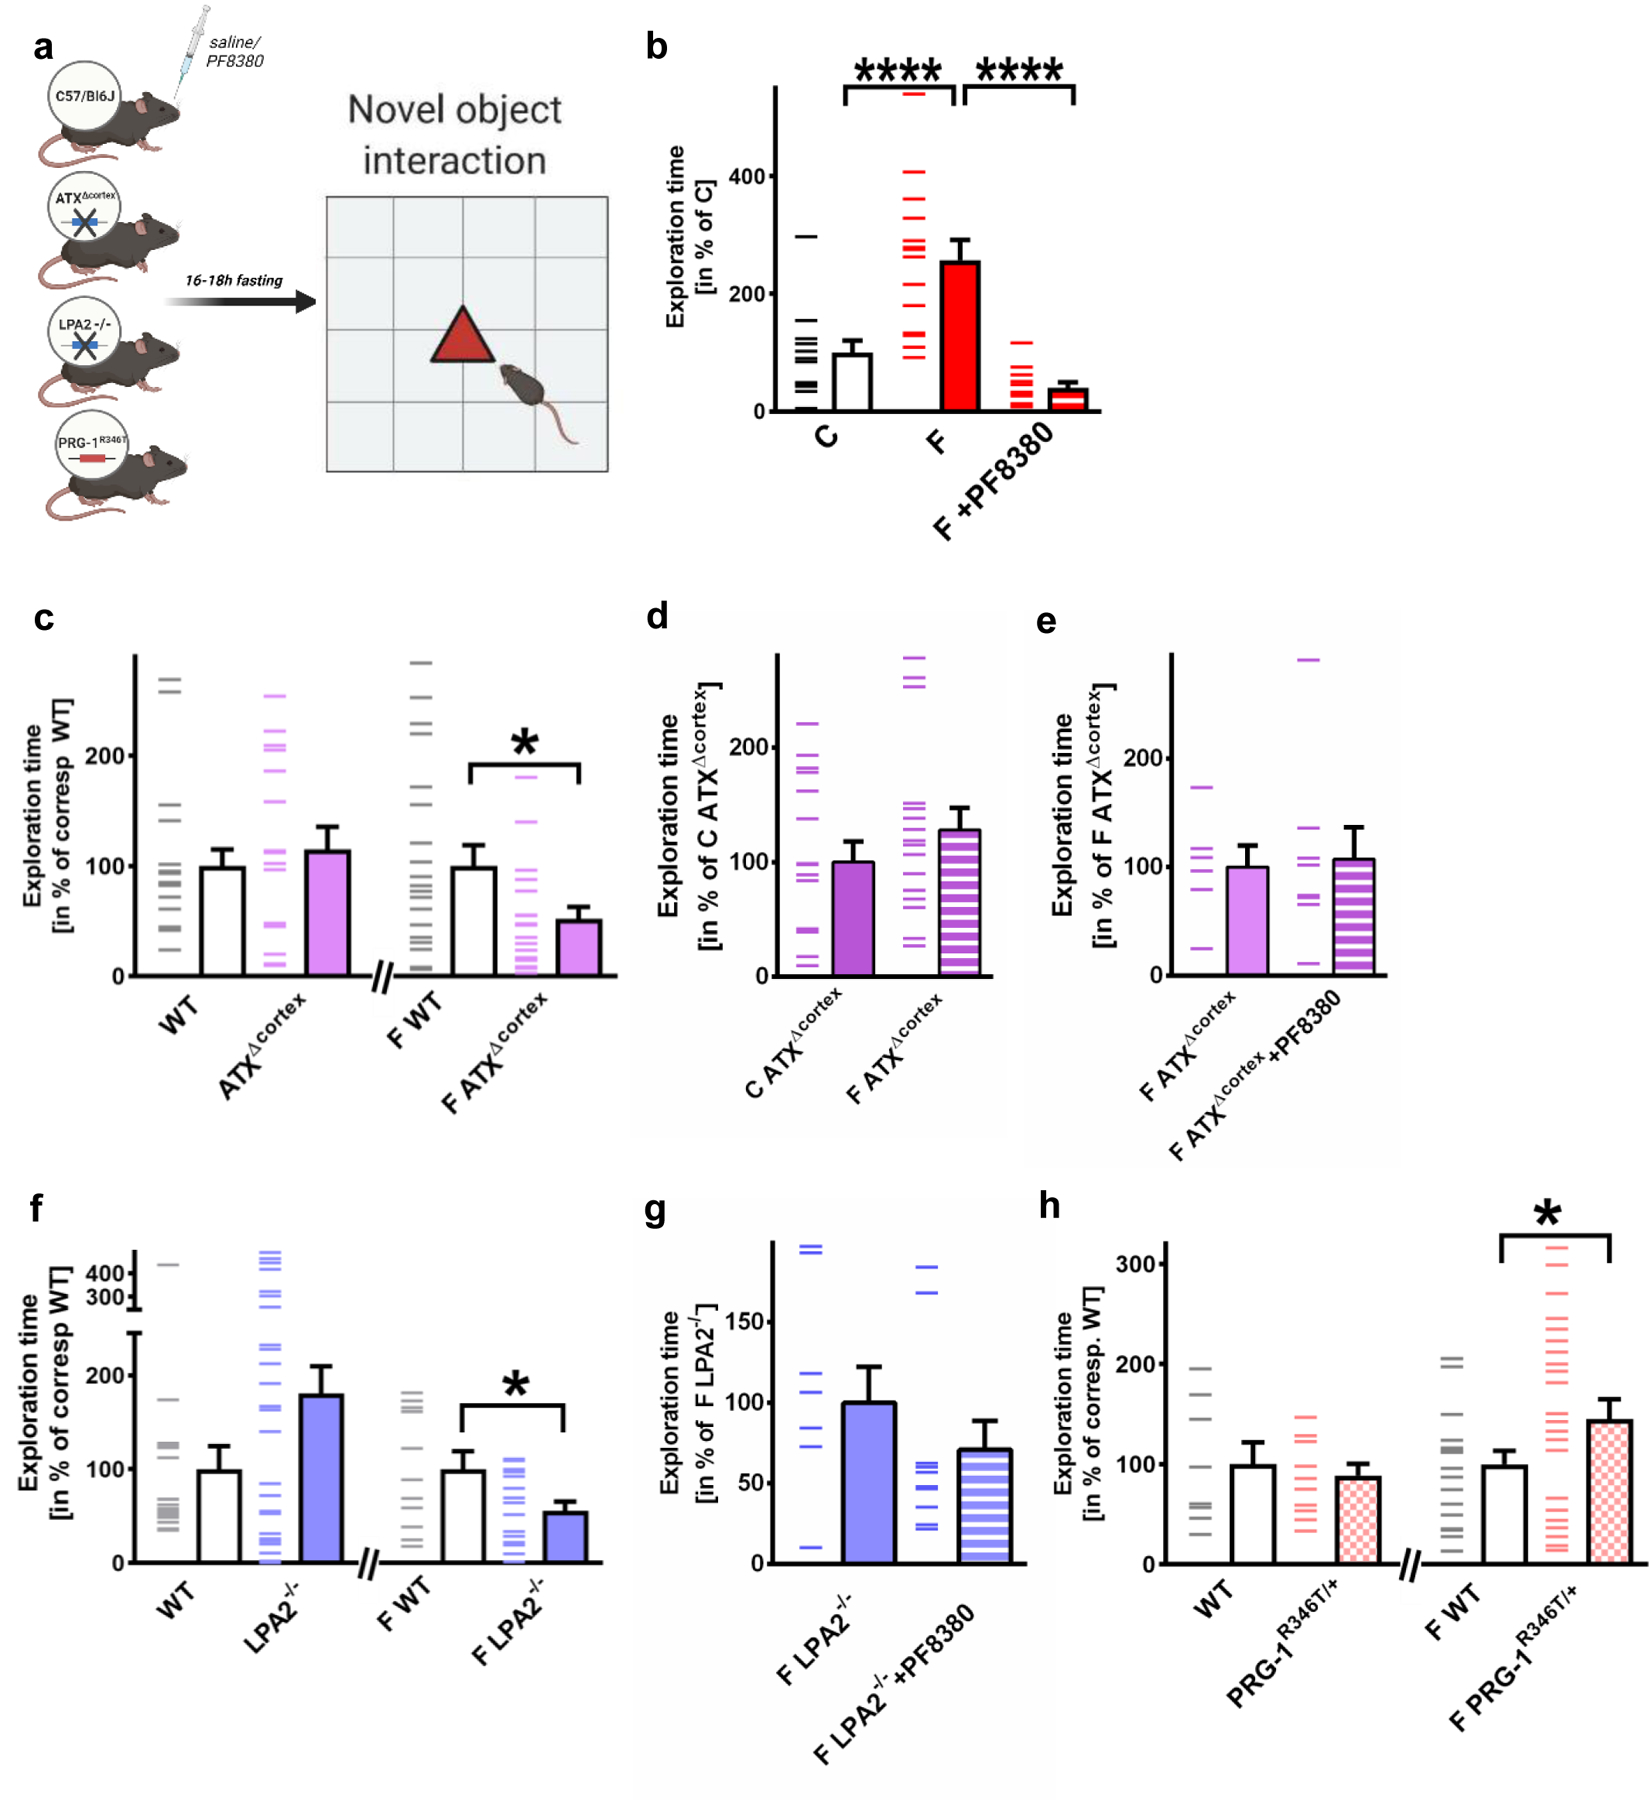
a. Experimental design for assessment of fasting-modulated exploratory behavior using pharmacological ATX-inhibition (by PF8380), animals with cortex-specific ATX-deletion (ATXΔcortex), LPA2-/- mice and animals with pre-existing increase of synaptic LPA-mediated cortical excitability (PRG-1R346T/+).
b. Fasting significantly increased exploratory behavior, which was reduced to control values by ATX-inhibition via PF8380 (n = 13 for control mice [C], n = 14 for fasted mice [F], and n = 12 for PF8380-treated fasted mice [F+PF8380]; P<0.0001, one-way ANOVA with Bonferroni correction).
c. Cortex-specific ATX-deletion (ATXΔcortex) did not affect exploratory behavior under non-fasting conditions (n = 20 wild type mice [WT] and n = 16 ATXΔcortex mice, two-tailed Mann-Whitney test). However, significantly reduced exploratory behavior after fasting was observed when ATXΔcortex mice were compared to fasted WT litters (n = 21 fasted wild type mice [F WT] and n = 19 fasted ATXΔcortex [F ATXΔcortex] mice; P = 0.0155, two-tailed t-test).
d. Following cortical ATX-deletion, fasting-induced exploratory behavior was not different to exploratory behavior under non fasting conditions. These data suggest that cortical ATX-deletion abolished fasting-induced exploratory behavior (n = 16 non-fasted mice [C ATXΔcortex] mice and n = 16 fasted ATXΔcortex [F ATXΔcortex] mice, two-tailed t-test).
e. Exploratory behavior of fasted mice with cortex-specific ATX deletion (F ATXΔcortex) was not altered by systemic ATX-inhibition. These data suggest that cortical ATX mediates fasting-induced exploratory behavior (n = 6 fasted ATXΔcortex mice [F ATXΔcortex] and n = 8 fasted ATXΔcortex+PF8380 mice [F ATXΔcortex+PF8380], two-tailed t-test).
f. LPA2-/- mice showed no significant difference in their exploratory behavior when compared to WT litters (n = 16 wild type mice [WT] and n = 27 LPA2-/- mice [LPA2-/-], two-tailed Mann-Whitney test). However, exploratory behavior after fasting was significantly decreased when fasted LPA2-/- mice were compared to fasted WT litters (n = 11 fasted wild type litters [F WT] and n = 16 fasted LPA2-/- [F LPA2-/-] mice, P = 0.037, two-tailed t-test).
g. Systemic ATX-inhibition following deletion of synaptic LPA-signaling did not alter fasting-induced exploratory behavior in LPA2-/- mice when compared to non-treated, fasted LPA2-/- mice (n = 9 fasted LPA2-/- mice [F LPA2-/-] and n = 10 fasted LPA2-/-+PF8380 [F LPA2-/-+PF8380] mice, two-tailed Mann-Whitney test).
h. Under non-fasted conditions, PRG-1R346T/+ mice did not show significant differences in exploratory behavior when compared to their WT litters (n = 8 WT and n = 11 PRG-1R346T/+ mice, one-tailed t-test). However, pre-existing cortical excitability, as present in PRG-1R346T/+ mice, significantly potentiated fasting-induced cortex-related exploratory behavior in fasted PRG-1R346T/+ mice when compared to fasted wild type litters (n = 20 fasted WT [F WT] and n = 23 fasted PRG-1R346T/+ mice [F PRG-1R346T/+]; P = 0.038, one-tailed t-test).
Experimental design figures were created with BioRender.com. Dashes represent single values, bars represent mean and s.e.m., *p<0.05, ****p<0.0001.
Extended Data Fig. 4. Fasting does not alter basic locomotion behavior after fasting.
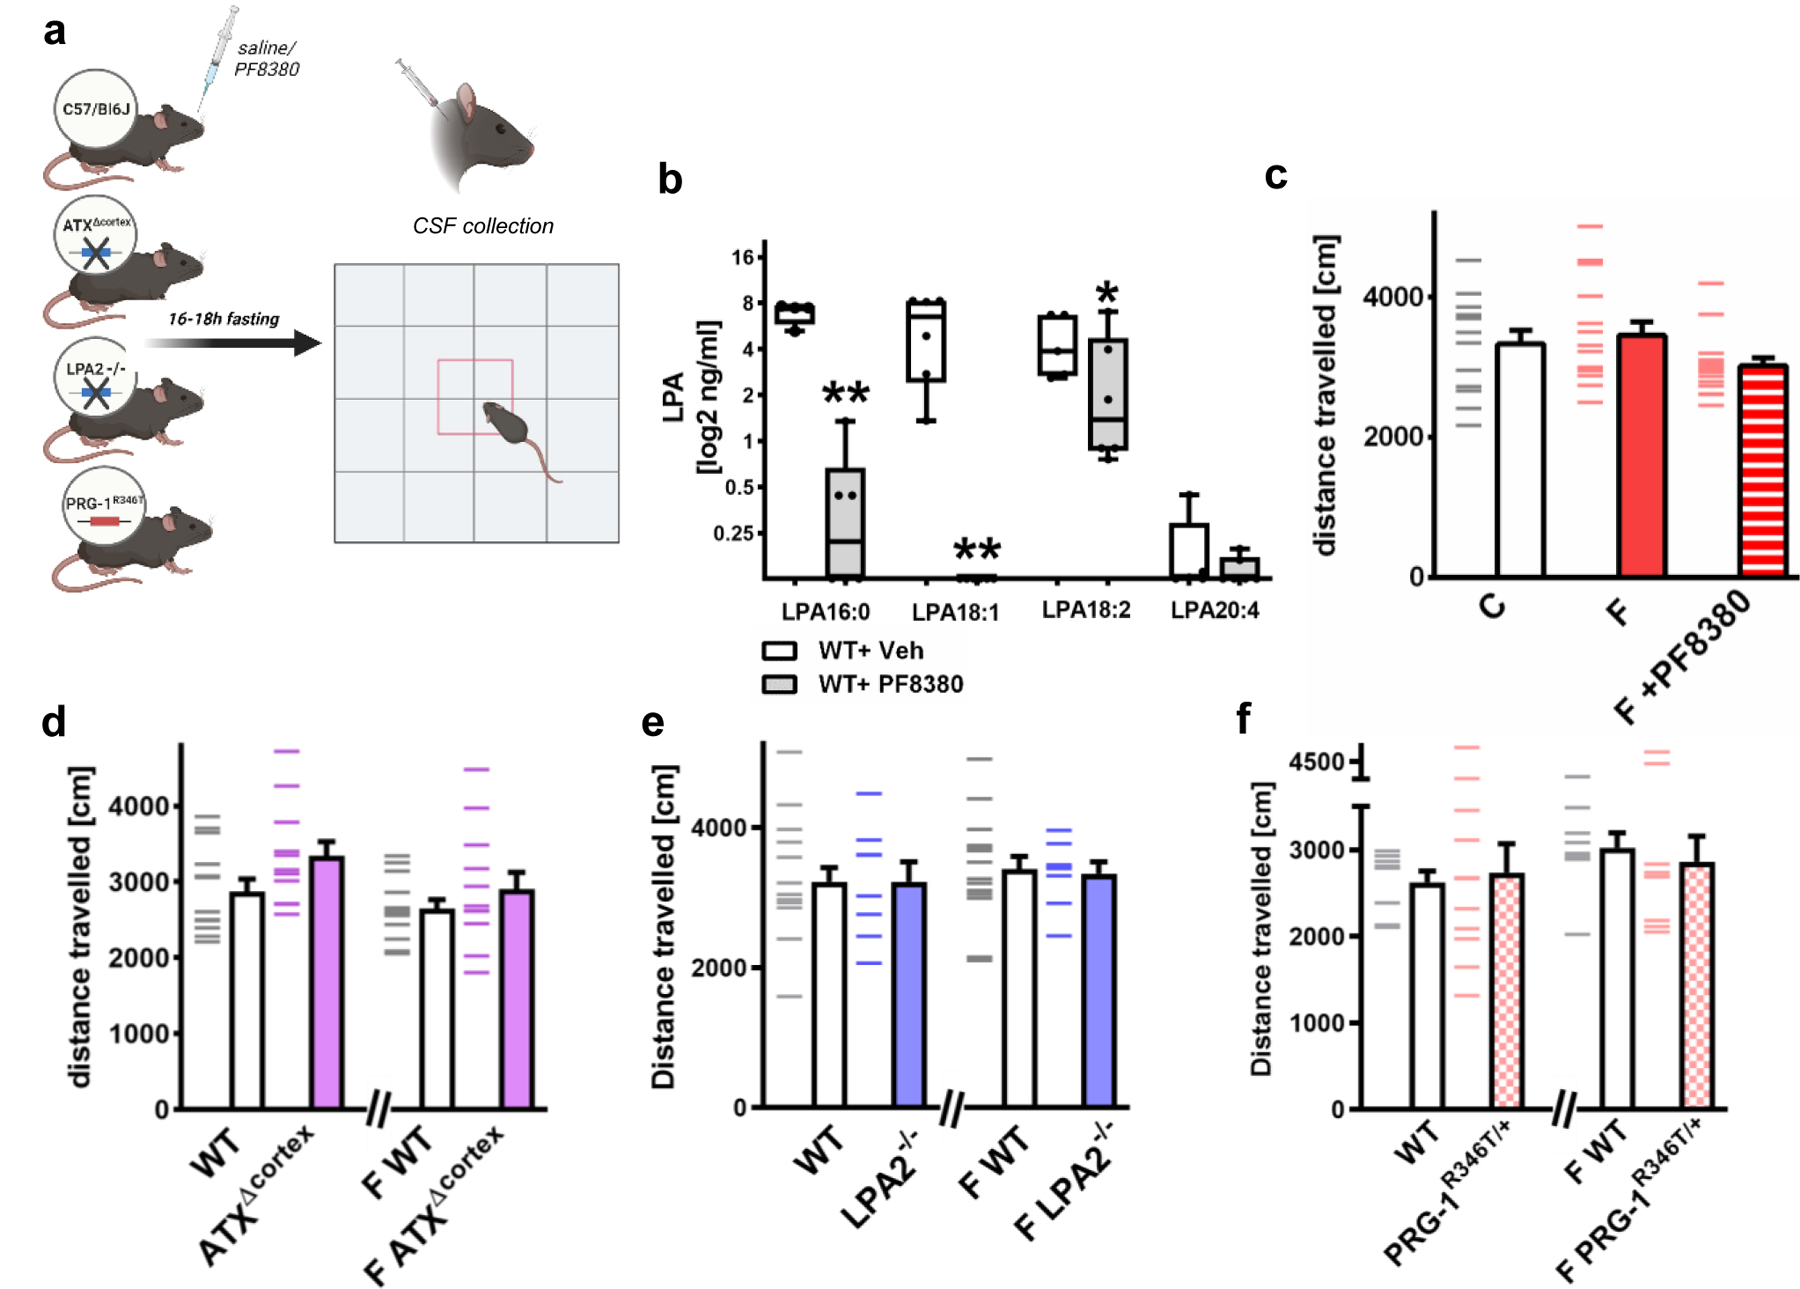
a. Experimental open field [OF] design for assessment of locomotion of wild type animals after fasting using pharmacological ATX-inhibition (by PF8380) and for assessment of locomotion of fasted animals with cortex-specific ATX-deletion (ATXΔcortex), of LPA2-/- mice and of animals with pre-existing increase of synaptic LPA-mediated cortical excitability (PRG-1R346T/+).
b. PF8380 i.p. application (30mg/kg body weight) significantly reduced LPA-subtype levels in the CSF when compared to vehicle-treated WT animals. Note that some values in the CSF after ATX-inhibition by PF8380 were below the lower level of quantification and set to 0 (n = 4 WT and 6 WT + PF8380 for LPA 16:0, n = 6 WT and WT + PF8380 for LPA 18:1, n = 5 WT and 6 WT+ PF8380 for LPA 18:2 and LPA 20:4, group differences for LPA 16:0 97.6%, for LPA 18:1 99.2%, for LPA 18:2 84.5%, for LPA 20:4 69.9%,Bayesian analysis. Box plots and whiskers show data from min to max, line shows median; group differences represent * >80% or **>90% differences of the mean.
c. Basic spontaneous motor function was not altered after fasting or after PF8380-treatment (n = 13 non-fasted wild type mice [C], 15 fasted wild type mice [F] and n = 15 wild type fasted +PF8380 mice [F + PF8380], one-way ANOVA).
d. Basic spontaneous motor function was not altered in ATXΔcortex mice when compared to wild type litters under control conditions or after fasting [F] (n = 13 wild type mice [WT and F WT] and n = 12 ATXΔcortex mice [ATXΔcortex and F ATXΔcortex], two-tailed t-test).
e. Basic spontaneous motor function was not altered in LPA2-/- mice when compared to wild type litters under control conditions or after fasting (n = 16 WT litter mice [WT and F WT] and n = 8 LPA2-/- mice [LPA2-/- and F LPA2-/-], t-test) under control conditions or after fasting.
f. Basic spontaneous locomotion was not altered in PRG-1R346T/+ animals when compared to wild type litters under control conditions or after fasting (n = 8 wild type mice [WT and F WT] and n = 11 PRG-1R346T/+ mice [PRG-1R346T/+ and F PRG-1R346T/+], two-tailed t-test).
Experimental design figures were created with BioRender.com. Dashes show single values, bars show mean and s.e.m.
Extended Data Fig. 5. Altered synaptic lipid signaling is associated with increased body weight in mice and humans.
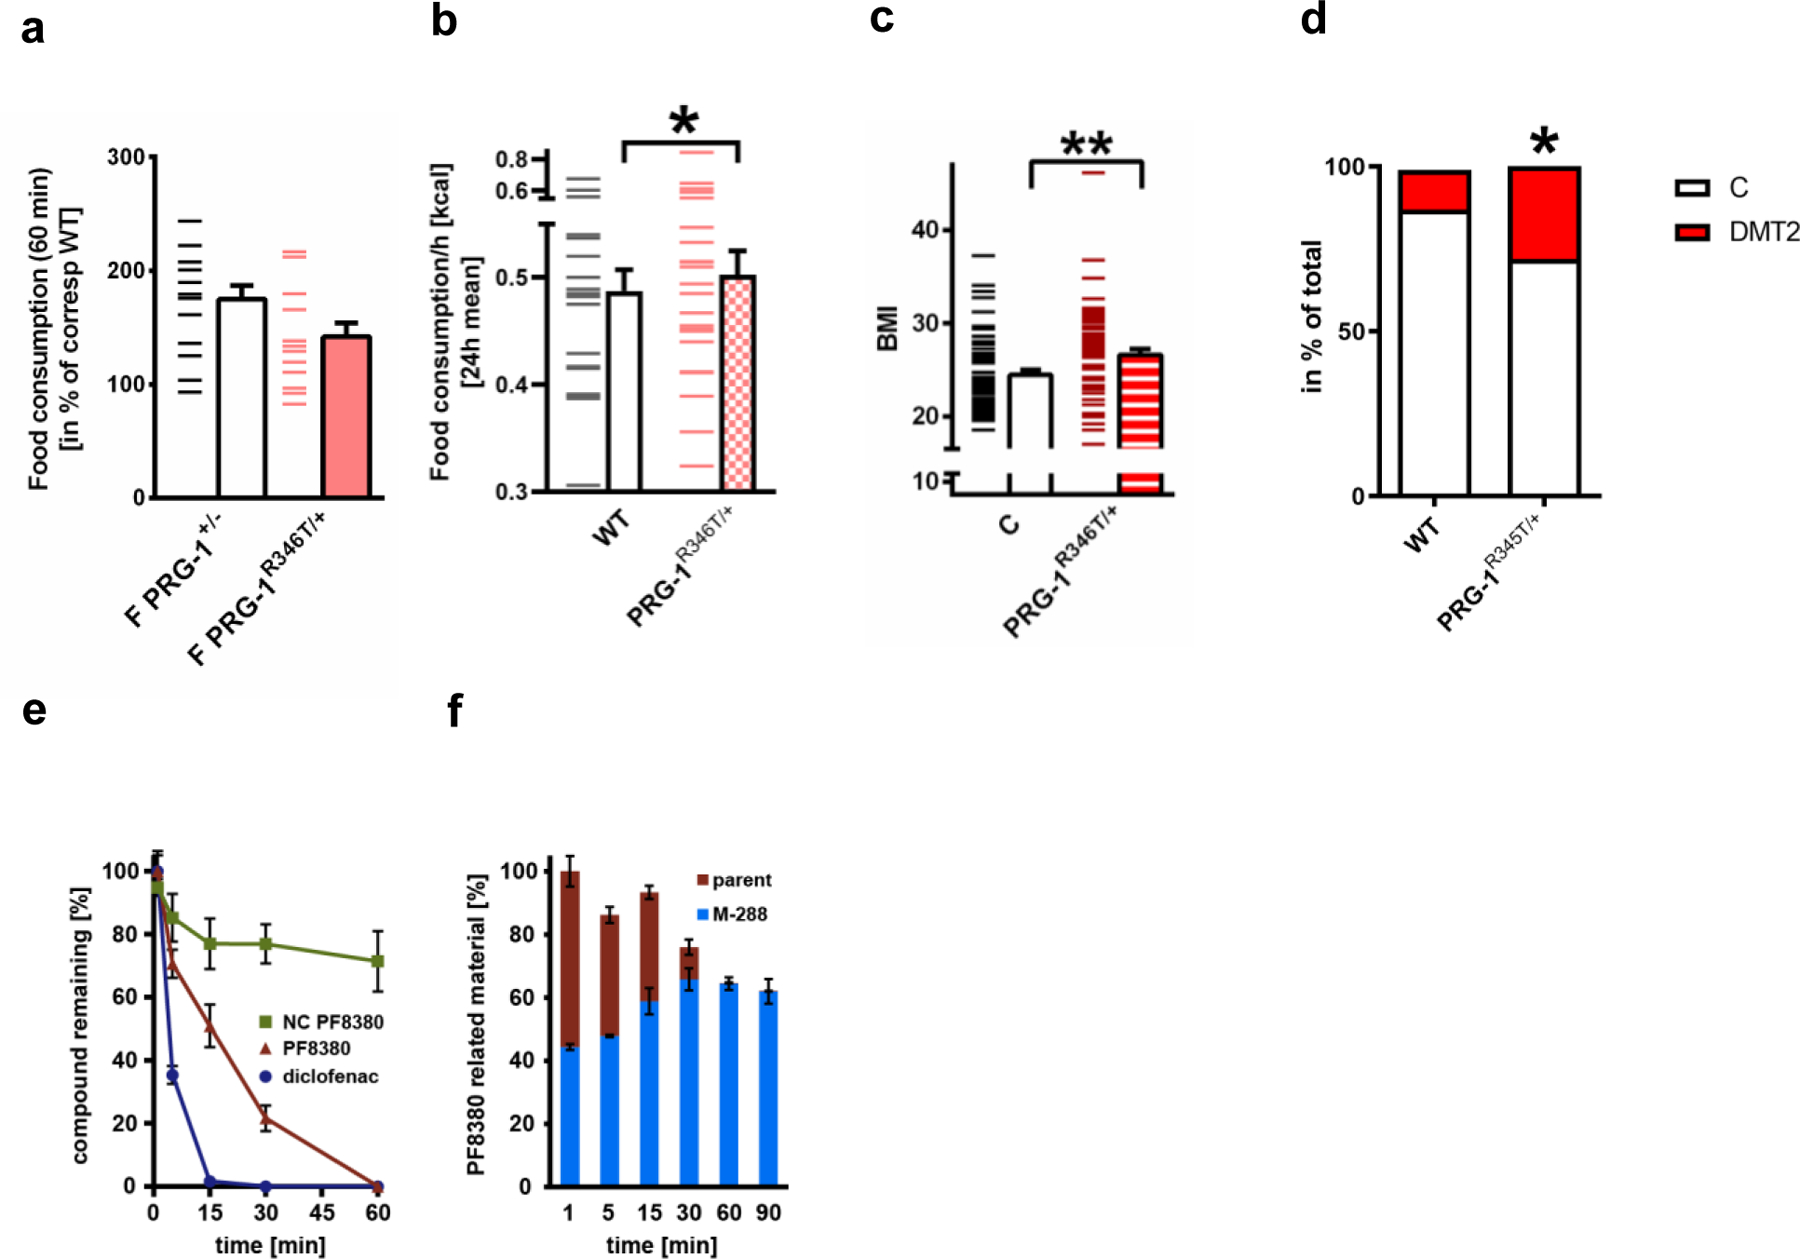
a. Fasting induced hyperphagia was not different in PRG-1+/- and PRG-1R346T/+ animals (n = 14 PRG-1+/- and n = 13 PRG-1R346T/+, two-sided t-test, dashes represent single values, bars represent mean and s.e.m)
b. Baseline food consumption per hour averaged for a 24h interval revealed significant higher food intake in PRG-1R346T/+ animals when compared to WT littermates (n = 20 WT and n = 23 PRG-1R346T/+ mice, group differences 86,7%, Bayesian analysis.
c. BMI was significantly increased in human PRG-1R345T SNP monoallelic mutation carriers (n = 58 PRG-1R346T/WT and n = 60 PRG-1WT sex, age, height and education matched controls, P = 0.0041, two-tailed t-test, **p<0.01). A-E: Bars represent mean and SE.
d. Diabetes type 2 (DMT2) prevalence was significantly increased in male PRG-1R346T/WT carriers, which displayed a significantly higher odds ratio (OR) for DMT2 of 2.45 (p = 0.037, logistic regression was adjusted for age, sex and cohort)(n = 3947 control cohort with 443 individuals with diabetes; n = 32 PRG-1R345T/WT mutation carriers with 7 individuals with diabetes; P = 0.0291, chi square test, p*<0.05). For better comparison, graph shows number of diabetic individuals as a percentage of the corresponding group.
e,f. PF8380 was quickly metabolized by human liver microsomes (n = 3; CLint >100 µl∙(min ∙ mg)-1, diclofenac was used as a positive control. PF8380 was mainly degraded to a putative metabolite with 288 g∙mol-1.
Dashes represent single values, bars represent mean and SEM.*p<0.05, **p<0.01, or group differences of * >80% for Bayesian analysis..
Extended Data Fig. 6. LPC and LPA levels in blood plasma and LPA concentrations in the CSF of AgRPDTR and control animals.
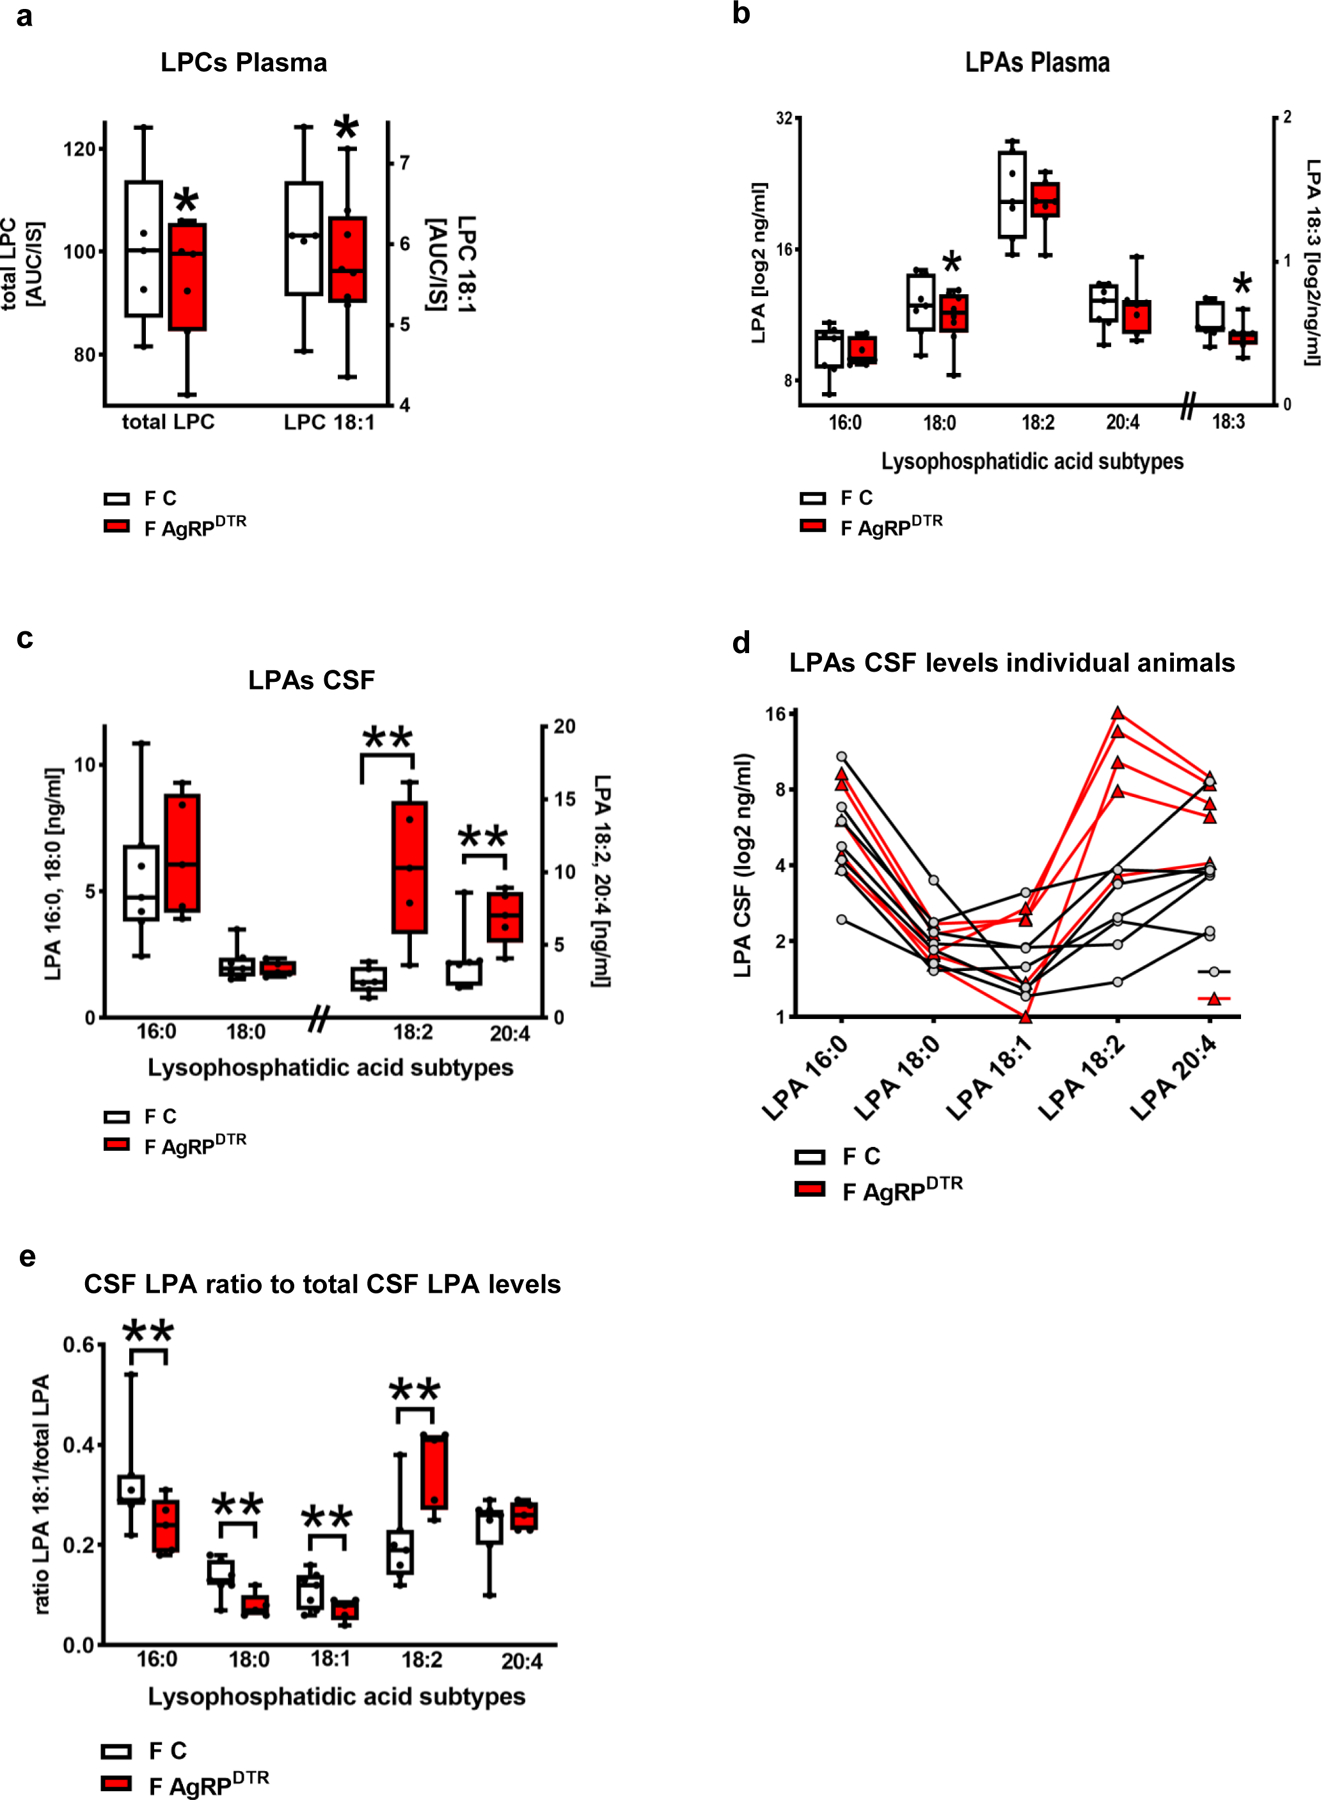
a. Blood plasma concentrations of total LPCs and 18:0 LPC revealed decreased concentrations in fasted AgRPDTR animals when compared to fasted control animals (n = 5 for fasted WT and n = 7 for fasted AgRPDTR mice, group differences for total LPC concentrations: 88.0%, for LPC 18:1 86,8%, Bayesian analysis).
b. Blood plasma levels of different LPA subtypes in fasted control and fasted AgRPDTR animals (n= 6 for LPA 16:0, 18:0,18:1 and n = 7 for 18:2, 18:3 and 20:4 for fasted control animals; n = 8 for LPA 18:0 and 7 for all other LPA subtypes for fasted AgRPDTR animals, group differences for LPA 16:0 79.7%, for LPA 18:0 84.4%, for LPA 18:2 68.4%, for LPA 18:3 85.7%, for LPA 20:4 55.1%, Bayesian analysis).
c. CSF levels of the different LPA subtypes in fasted control [F C] and fasted AgRPDTR [F AgRPDTR] mice (n = 6 for LPA 18:2 and 7 for all other LPAs in fasted controls and n = 5 for fasted AgRPDTR mice, group differences for LPA 16:0 68.8%, for LPA 18:0 69.4%, for LPA 18:2 97.3%, for LPA 20:4 95.5%, Bayesian analysis).
d. Individual CSF LPA levels displayed for the corresponding animals show high variance (n = 6 for LPA 18:2 and 7 for all other LPAs in fasted controls and n = 5 for fasted AgRPDTR mice). .
e. Ratio calculated for the different LPA subtypes to the total LPA levels in the corresponding animals (n = 6 for LPA 18:2 and 7 for all other LPAs in fasted controls and n = 5 for fasted AgRPDTR mice, group differences for LPA 16:0 90.2%, for LPA 18:0 97.5%, for LPA 18:1 93.5%, for LPA 18:2 98.8%, for LPA 20:4 70.5%, Bayesian analysis).
Data in b and d show log2 transformed values. Whiskers represent min to max, box extends from the 25th to the 75th percentile, middle line represents the median. Single points represent individual values. Group differences of * >80% or **>90% are shown for Bayesian analysis.
Extended Data Fig. 7. Expression of synaptic lipid modulating molecules ATX and PRG-1 in the prefrontal cortex.
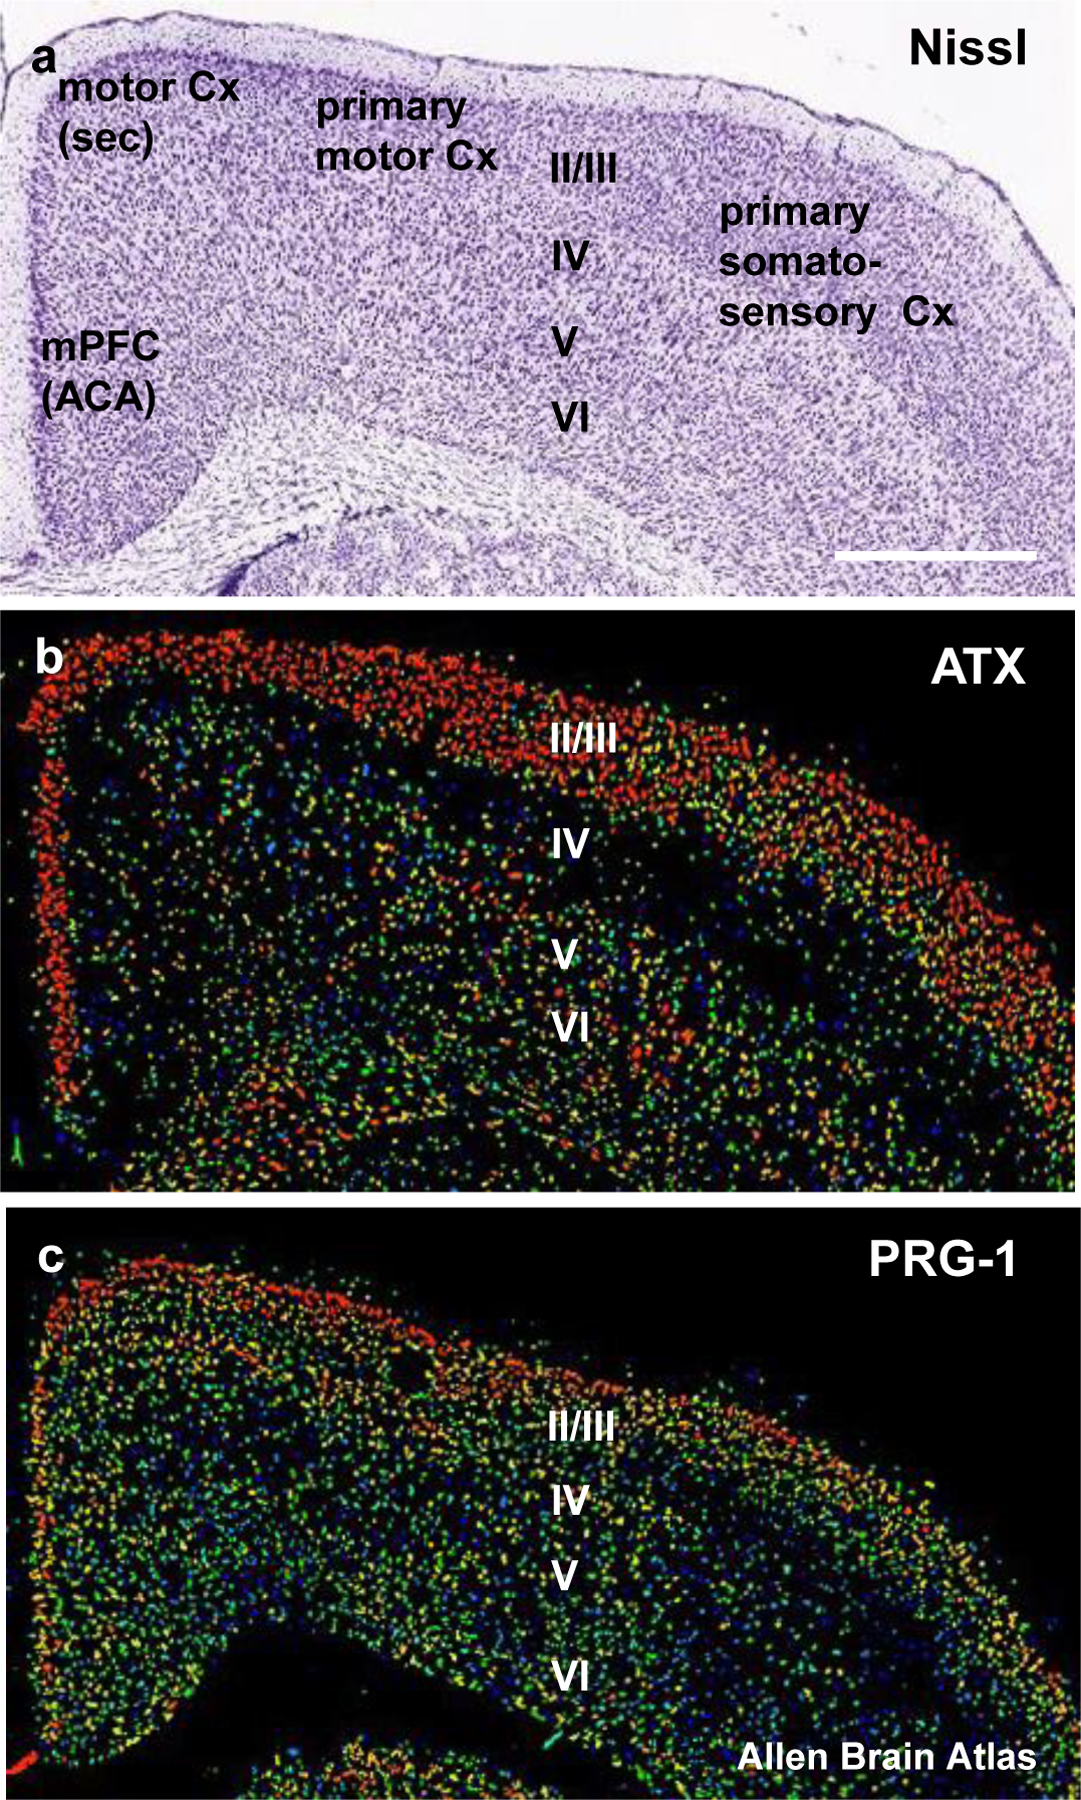
a. Nissl stained coronal section of the prefrontal cortex reaching up to the medial prefrontal cortex (mPFC, ACA anterior cingular area) and corresponding to the coronal levels of the in-situ hybridisations shown for ATX and PRG-1. Scale bar: 800µm
b. ATX-expression is predominantly found in the upper prefrontal cortex layers (especially in layers II/III).
c. PRG-1 is strongly expressed in the layers II/III of the prefrontal cortex but is also found at high expression levels in the layer IV.
Supplementary Material
Highlights.
Fasting-induced peripheral metabolic changes increase synaptic active lysophospholipid (LPA) levels in the brain leading to cortical hyperexcitability
Fasting-induced hyperphagia and body weight gain under high fat diet are modulated by cortical hyperexcitability and are reduced following inhibition of the LPA-synthetizing enzyme ATX
Hypothalamic AgRP are part of an overarching loop regulating peripheral and subsequent CNS lipid changes during fasting, and thereby modulating fasting-related cortical excitability and fasting-induced hyperphagia
Acknowledgements
We thank Cheryl Ernest for proofreading the manuscript.
Funding
This work was supported by the Deutsche Forschungsgemeinschaft (SFB 1039, 1080, 1193 and 1451) to JV, RN, IT and SG, and under the Germanýs Excellence Strategy – EXC 2030 – 390661388 to JV, by the European Research Council (ERC-AG “LiPsyD” and ERC-PoC “PsychAid”) to RN, by the Boehringer-Ingelheim Foundation to JV and SG, the Stiftung Rheinland-Pfalz to JV, RN, and FZ, by InfectControl 03ZZ0826 to YL and 03ZZ0835 to FK, and by the German Research Foundation (DFG, grant FOR2107 DA1151/5-1 and DA1151/5-2 to UD; SFB-TRR58, Projects C09 and Z02 to UD), the Interdisciplinary Center for Clinical Research (IZKF) of the medical faculty of Münster (grant Dan3/012/17 to UD); SHIP is part of the Community Medicine Research net of the University of Greifswald which receives grants by the Federal Ministry of Education and Research (01ZZ9603, 01ZZ0103, and 01ZZ0403), the Ministry of Cultural Affairs and the Social Ministry of the Federal State of Mecklenburg-West Pomerania. Genome-wide SNP typing in SHIP has been supported by a joint grant from Siemens Healthineers, Erlangen and the Federal Ministry of Education and Research (03ZIK012); European Union and European Social Fund grant (EFOP-3.6.2-16-2017-0008) and an NKFIH grant (KKP126998) to B.R.; and NIH grants AG052005, AG067329, DK126447 and a Klarman Family Foundation Grant to T.L.H.
Footnotes
Competing interests: HJG has received travel grants and speakers honoraria from Fresenius Medical Care, Neuraxpharm, Servier and Janssen Cilag as well as research funding from Fresenius Medical Care.
The other authors declare no competing interests.
Data availability:
The data that support the findings of our study can be found in the source data which is provided with this article. Expression data of Enpp2/Atx and Prg-1/Lppr4 was analyzed using the Allen Mouse Brain Atlas.
References
- 1.Trimbuch T et al. Synaptic PRG-1 modulates excitatory transmission via lipid phosphate-mediated signaling. Cell 138, 1222–1235 (2009). [DOI] [PMC free article] [PubMed] [Google Scholar]
- 2.Unichenko P et al. Plasticity-Related Gene 1 Affects Mouse Barrel Cortex Function via Strengthening of Glutamatergic Thalamocortical Transmission. Cerebral cortex 26, 3260–3272, doi: 10.1093/cercor/bhw066 (2016). [DOI] [PMC free article] [PubMed] [Google Scholar]
- 3.Vogt J et al. Molecular cause and functional impact of altered synaptic lipid signaling due to a prg-1 gene SNP. EMBO molecular medicine 8, 25–38, doi: 10.15252/emmm.201505677 (2016). [DOI] [PMC free article] [PubMed] [Google Scholar]
- 4.Thalman C et al. Synaptic phospholipids as a new target for cortical hyperexcitability and E/I balance in psychiatric disorders. Molecular psychiatry 23, 1699–1710, doi: 10.1038/s41380-018-0053-1 (2018). [DOI] [PMC free article] [PubMed] [Google Scholar]
- 5.Moolenaar WH, van Meeteren LA & Giepmans BN The ins and outs of lysophosphatidic acid signaling. BioEssays : news and reviews in molecular, cellular and developmental biology 26, 870–881 (2004). [DOI] [PubMed] [Google Scholar]
- 6.Yung YC, Stoddard NC, Mirendil H & Chun J Lysophosphatidic Acid signaling in the nervous system. Neuron 85, 669–682, doi: 10.1016/j.neuron.2015.01.009 (2015). [DOI] [PMC free article] [PubMed] [Google Scholar]
- 7.Yung YC, Stoddard NC & Chun J LPA receptor signaling: pharmacology, physiology, and pathophysiology. Journal of lipid research 55, 1192–1214, doi: 10.1194/jlr.R046458 (2014). [DOI] [PMC free article] [PubMed] [Google Scholar]
- 8.Tang X, Benesch MG & Brindley DN Lipid phosphate phosphatases and their roles in mammalian physiology and pathology. Journal of lipid research 56, 2048–2060, doi: 10.1194/jlr.R058362 (2015). [DOI] [PMC free article] [PubMed] [Google Scholar]
- 9.Moolenaar WH Lysophospholipids in the limelight: autotaxin takes center stage. The Journal of cell biology 158, 197–199, doi: 10.1083/jcb.200206094 [pii] (2002). [DOI] [PMC free article] [PubMed] [Google Scholar]
- 10.Stracke ML et al. Identification, purification, and partial sequence analysis of autotaxin, a novel motility-stimulating protein. The Journal of biological chemistry 267, 2524–2529 (1992). [PubMed] [Google Scholar]
- 11.Hausmann J et al. Structural basis of substrate discrimination and integrin binding by autotaxin. Nature structural & molecular biology 18, 198–204, doi: 10.1038/nsmb.1980 (2011). [DOI] [PMC free article] [PubMed] [Google Scholar]
- 12.Sekas G, Patton GM, Lincoln EC & Robins SJ Origin of plasma lysophosphatidylcholine: evidence for direct hepatic secretion in the rat. The Journal of laboratory and clinical medicine 105, 190–194 (1985). [PubMed] [Google Scholar]
- 13.Brindley. Hepatic secretion of lysophosphatidylcholine: A novel transport system for polyunsaturated fatty acids and choline. J. Nutr. Biochem 4, 442–449 (1993). [Google Scholar]
- 14.Nguyen LN et al. Mfsd2a is a transporter for the essential omega-3 fatty acid docosahexaenoic acid. Nature 509, 503–506, doi: 10.1038/nature13241 (2014). [DOI] [PubMed] [Google Scholar]
- 15.Nakamura K et al. Autotaxin enzyme immunoassay in human cerebrospinal fluid samples. Clin Chim Acta 405, 160–162, doi: 10.1016/j.cca.2009.04.025 (2009). [DOI] [PubMed] [Google Scholar]
- 16.Sato K et al. Identification of autotaxin as a neurite retraction-inducing factor of PC12 cells in cerebrospinal fluid and its possible sources. Journal of neurochemistry 92, 904–914, doi: 10.1111/j.1471-4159.2004.02933.x (2005). [DOI] [PubMed] [Google Scholar]
- 17.Geisler CE, Hepler C, Higgins MR & Renquist BJ Hepatic adaptations to maintain metabolic homeostasis in response to fasting and refeeding in mice. Nutrition & metabolism 13, 62, doi: 10.1186/s12986-016-0122-x (2016). [DOI] [PMC free article] [PubMed] [Google Scholar]
- 18.Joly-Amado A et al. Hypothalamic AgRP-neurons control peripheral substrate utilization and nutrient partitioning. The EMBO journal 31, 4276–4288, doi: 10.1038/emboj.2012.250 (2012). [DOI] [PMC free article] [PubMed] [Google Scholar]
- 19.Miletta MC et al. AgRP neurons control compulsive exercise and survival in an activity-based anorexia model. Nat Metab 2, 1204–1211, doi: 10.1038/s42255-020-00300-8 (2020). [DOI] [PubMed] [Google Scholar]
- 20.Dietrich MO et al. AgRP neurons regulate development of dopamine neuronal plasticity and nonfood-associated behaviors. Nature neuroscience 15, 1108–1110, doi: 10.1038/nn.3147 (2012). [DOI] [PMC free article] [PubMed] [Google Scholar]
- 21.Dietrich MO, Zimmer MR, Bober J & Horvath TL Hypothalamic Agrp neurons drive stereotypic behaviors beyond feeding. Cell 160, 1222–1232, doi: 10.1016/j.cell.2015.02.024 (2015). [DOI] [PMC free article] [PubMed] [Google Scholar]
- 22.Schmitz K et al. Dysregulation of lysophosphatidic acids in multiple sclerosis and autoimmune encephalomyelitis. Acta neuropathologica communications 5, 42, doi: 10.1186/s40478-017-0446-4 (2017). [DOI] [PMC free article] [PubMed] [Google Scholar]
- 23.Kano K et al. Molecular mechanism of lysophosphatidic acid-induced hypertensive response. Scientific reports 9, 2662, doi: 10.1038/s41598-019-39041-4 (2019). [DOI] [PMC free article] [PubMed] [Google Scholar]
- 24.Leger M et al. Object recognition test in mice. Nature protocols 8, 2531–2537, doi: 10.1038/nprot.2013.155 (2013). [DOI] [PubMed] [Google Scholar]
- 25.Fernandez G et al. Evidence Supporting a Role for Constitutive Ghrelin Receptor Signaling in Fasting-Induced Hyperphagia in Male Mice. Endocrinology 159, 1021–1034, doi: 10.1210/en.2017-03101 (2018). [DOI] [PubMed] [Google Scholar]
- 26.He Y et al. A Small Potassium Current in AgRP/NPY Neurons Regulates Feeding Behavior and Energy Metabolism. Cell reports 17, 1807–1818, doi: 10.1016/j.celrep.2016.10.044 (2016). [DOI] [PMC free article] [PubMed] [Google Scholar]
- 27.Krizo JA et al. Regulation of Locomotor activity in fed, fasted, and food-restricted mice lacking tissue-type plasminogen activator. BMC Physiol 18, 2, doi: 10.1186/s12899-018-0036-0 (2018). [DOI] [PMC free article] [PubMed] [Google Scholar]
- 28.Dunlop KA, Woodside B & Downar J Targeting Neural Endophenotypes of Eating Disorders with Non-invasive Brain Stimulation. Frontiers in neuroscience 10, 30, doi: 10.3389/fnins.2016.00030 (2016). [DOI] [PMC free article] [PubMed] [Google Scholar]
- 29.Luquet S, Perez FA, Hnasko TS & Palmiter RD NPY/AgRP neurons are essential for feeding in adult mice but can be ablated in neonates. Science 310, 683–685, doi: 10.1126/science.1115524 (2005). [DOI] [PubMed] [Google Scholar]
- 30.Kaluarachchi M et al. A comparison of human serum and plasma metabolites using untargeted (1)H NMR spectroscopy and UPLC-MS. Metabolomics 14, 32, doi: 10.1007/s11306-018-1332-1 (2018). [DOI] [PMC free article] [PubMed] [Google Scholar]
- 31.Tabbai S et al. Effects of the LPA1 Receptor Deficiency and Stress on the Hippocampal LPA Species in Mice. Front Mol Neurosci 12, 146, doi: 10.3389/fnmol.2019.00146 (2019). [DOI] [PMC free article] [PubMed] [Google Scholar]
- 32.Oliveira TG et al. The impact of chronic stress on the rat brain lipidome. Molecular psychiatry 21, 80–88, doi: 10.1038/mp.2015.14 (2016). [DOI] [PMC free article] [PubMed] [Google Scholar]
- 33.Tataranni PA et al. Neuroanatomical correlates of hunger and satiation in humans using positron emission tomography. Proceedings of the National Academy of Sciences of the United States of America 96, 4569–4574, doi: 10.1073/pnas.96.8.4569 (1999). [DOI] [PMC free article] [PubMed] [Google Scholar]
- 34.Cajal S. R. y Textura del Sistema Nervioso del Hombre y de los Vertebrados (1899).
- 35.Waterson MJ & Horvath TL Neuronal Regulation of Energy Homeostasis: Beyond the Hypothalamus and Feeding. Cell metabolism 22, 962–970, doi: 10.1016/j.cmet.2015.09.026 (2015). [DOI] [PubMed] [Google Scholar]
- 36.Focker M et al. Evaluation of Metabolic Profiles of Patients with Anorexia Nervosa at Inpatient Admission, Short- and Long-Term Weight Regain-Descriptive and Pattern Analysis. Metabolites 11, doi: 10.3390/metabo11010007 (2020). [DOI] [PMC free article] [PubMed] [Google Scholar]
- 37.Contos JJ et al. Characterization of lpa(2) (Edg4) and lpa(1)/lpa(2) (Edg2 /Edg4) lysophosphatidic acid receptor knockout mice: signaling deficits without obvious phenotypic abnormality attributable to lpa(2). Molecular and cellular biology 22, 6921–6929 (2002). [DOI] [PMC free article] [PubMed] [Google Scholar]
- 38.Fotopoulou S et al. ATX expression and LPA signalling are vital for the development of the nervous system. Developmental biology 339, 451–464, doi:S0012-1606(10)00014-X 10.1016/j.ydbio.2010.01.007 (2010). [DOI] [PubMed] [Google Scholar]
- 39.Gorski JA et al. Cortical excitatory neurons and glia, but not GABAergic neurons, are produced in the Emx1-expressing lineage. The Journal of neuroscience : the official journal of the Society for Neuroscience 22, 6309–6314, doi:20026564 (2002). [DOI] [PMC free article] [PubMed] [Google Scholar]
- 40.Gierse J et al. A novel autotaxin inhibitor reduces lysophosphatidic acid levels in plasma and the site of inflammation. The Journal of pharmacology and experimental therapeutics 334, 310–317, doi: 10.1124/jpet.110.165845 (2010). [DOI] [PubMed] [Google Scholar]
- 41.Brunkhorst-Kanaan N et al. Targeted lipidomics reveal derangement of ceramides in major depression and bipolar disorder. Metabolism: clinical and experimental 95, 65–76, doi: 10.1016/j.metabol.2019.04.002 (2019). [DOI] [PubMed] [Google Scholar]
- 42.Johnson VE Revised standards for statistical evidence. Proceedings of the National Academy of Sciences of the United States of America 110, 19313–19317, doi: 10.1073/pnas.1313476110 (2013). [DOI] [PMC free article] [PubMed] [Google Scholar]
Associated Data
This section collects any data citations, data availability statements, or supplementary materials included in this article.
Supplementary Materials
Data Availability Statement
The data that support the findings of our study can be found in the source data which is provided with this article. Expression data of Enpp2/Atx and Prg-1/Lppr4 was analyzed using the Allen Mouse Brain Atlas.


