

Abstract
This retrospective study investigated growth outcomes of Kenyan children born to women living with HIV, comparing children who were orphaned maternally, paternally, and totally (both parents deceased) to those who were non-orphaned. We reviewed HIV clinic visits performed in Kenya from January 2011 to August 2016 in children 0 to 4 years of age. Malnutrition was assessed using stunting, underweight status, and wasting (z-scores of ≤−2). Descriptive statistics, Chi-square, t-tests, multivariable logistic regression, and ANCOVA models were performed. Of 15 027 total children in the study population, 3.5% (n = 520) were orphaned maternally, 8.1% (n = 1222) were orphaned paternally, and 2.2% (n = 336) were orphaned totally. Children who were orphans had higher rates of malnutrition compared to non-orphans (P < .001). Children who were orphaned maternally and totally had lower anthropometric mean scores, presented to clinic later, and were more likely to be living with HIV. Children who are orphaned maternally or totally should be targeted in interventional strategies.
Keywords: malnutrition, growth, anthropometric, orphan, children, maternal orphan, paternal orphan, total orphan, child development, epidemiology, growth
Introduction
Malnutrition contributes to 45% of deaths in children younger than 5 years.1 In many African countries, the prevalence of stunting in children, a measure of chronic linear growth retardation,2 remains >30% and impacts 149 million children worldwide.1,3-5 This chronic nutritional marker differs from other acute measures of malnutrition, such as underweight and wasting, which impacts more than 85 and 49 million children worldwide, respectively.1,6 Stunting, underweight, and wasting are associated with increased mortality and consequences on cognitive development and brain functional connectivity in early childhood, an essential time period for establishing growth and development trajectories for a lifetime.5,7-10
Children born to women living with HIV (WLHIV) have higher rates of malnutrition compared to children born to HIV-uninfected mothers, even when the children themselves are uninfected.4,11 The etiology of this trend has not been clearly identified, however, it is likely multifactorial, including viral loads, prenatal drug exposure, familial stress, and parental illness limiting the care of children.12,13 Parental HIV increases the likelihood of orphanhood in young children, which makes them particularly vulnerable to malnutrition.14,15 The HIV pandemic has resulted in over 17 million children who are orphaned, with 15 million living in sub-Saharan Africa.16,17 Although orphaned children born to WLHIV are at higher risk for poor health outcomes and increased mortality, it remains unclear if the mechanism by which a child is orphaned (ie, maternally, paternally, or totally) disparately alters the risk for this population. Children orphaned maternally experience stigma and discrimination, while children orphaned paternally experience heightened poverty.18
Current literature reports mixed findings regarding the factors associated with malnutrition in children who are orphaned, including age, gender, family size, and living context (village/orphanage).19-22 The unique maternal and paternal roles in a child’s development may lead to different risks of impaired growth in children who are orphaned maternally or paternally.15 Comparing children who are orphaned differently may provide further insight toward identifying populations at risk for poor growth and health outcomes within the vulnerable population of children born to WLHIV. The objective of this study was to evaluate the growth of young children who are born to WLHIV in western Kenya, comparing children who are non-orphaned and orphaned (maternally, paternally, or totally).
Methods
Study Design and Setting
This is a secondary analysis of data collected prospectively during routine clinical care and stored in the Academic Model Providing Access to Healthcare (AMPATH) electronic medical record system.23 The primary study for which these data variables were derived has been published elsewhere.11 Data were pulled for all children enrolled in the AMPATH HIV clinical care system. AMPATH was born from a 20-year partnership between Moi University School of Medicine (MUSM), Moi Teaching and Referral Hospital, and a consortium of North American universities, led by Indiana University School of Medicine (IUSM). The AMPATH HIV care program has enrolled over 200 000 patients and currently provides care for approximately 15 000 children born to WLHIV in 65 clinics across western Kenya.24
Study Participants
Participants were eligible if they were seen in an AMPATH clinic between January 2011 and August 2016 and were <4 years of age. All children exposed to HIV but with negative confirmatory testing between 18 and 24 months of life are referred to as being HIV-exposed. Children who were HIV-exposed were eligible to receive free follow-up care with well-child visits in the AMPATH system. No children unexposed to HIV are included in this cohort.
During the period of data collection, pregnant WLHIV were on an antiretroviral (ARV) regimen of tenofovir, lamivudine, and efavirenz (Option B+). Infants attending AMPATH clinics received nevirapine prophylaxis from birth to 6 weeks and co-trimoxazole from 6 weeks of life until confirmatory testing at 18 months of age.25 If a child was diagnosed with HIV, they were switched to a regimen of zidovudine/lamivudine/nevirapine or abacavir/lamivudine/nevirapine as first-line treatment. In late 2013, the first-line regimen for children was changed to abacavir/lamivudine/lopinavir/ritonavir in accordance with changes in the World Health Organizations (WHO) guidelines.26 Per AMPATH standard operating procedures, all children included in this study from 2010 to 2015 were recommended to attend monthly follow-up visits until 5 years of age.27 In 2016, the national policy guided a change to monthly visits until 18 months, followed by biannual visits until 5 years of age.25
Data Collection
Data collection for the original study used variables from clinic visit forms completed by a clinician and entered into the electronic medical record system. These variables included age at enrollment, sex, clinic location/type, person accompanying child, orphan status, visit height/weights, feeding method, maternal or child ARV, HIV-infected sibling, and final HIV testing result. Patient identifiers were removed during data extraction. All analyzed data were handled and transferred using password protected, encrypted methodologies compliant with the United States’ Health Insurance Portability and Accountability Act standards.
For this study, we calculated anthropometric z-scores using the modeling defined by the WHO.28 Z-scores are helpful for grouping growth data by age and sex, due to their expression of standard deviations that are below or above the reference mean or median values.29 To characterize malnutrition, 3 variables from WHO’s definition of “moderate-severe malnutrition” were evaluated: stunting, wasting, and underweight. In these analyses, “stunting” refers to height-for-age (HAZ) z-scores ≤ −2. “Wasting” refers to weight-for-height (WHZ) z-scores ≤ −2. “Underweight” refers to weight-for-age (WAZ) z-scores ≤ −2. Malnutrition is defined as HAZ ≤ −2 or WAZ ≤ −2 or WHZ ≤ −2. In this study, undernutrition refers to z-scores < 0.
Statistical Analysis
We conducted a due-diligence examination of the height and weight growth data to minimize errors and data irregularity. This included restricting the weight change to no more than ±3 kg/month and the height change to no more than 10 cm per month. We excluded height measures that were shorter than previously recorded and z-scores (WAZ, HAZ, WHZ) that changed more than ±2 units/month upon review of WHO growth charts and the current dataset by use of clinical judgment.
Participant characteristics at study entry were evaluated descriptively and summarized in a tabular form for the full and sub-samples defined by the orphan groups. Frequencies and percentages were calculated for categorical variables. Means and standard deviations were calculated for continuous variables. Comparisons between children orphaned maternally, paternally, totally, and children who are non-orphaned were analyzed using Chi-squared tests, while comparisons of means between the 2 groups were analyzed using independent t-tests. Frequency of malnutrition across orphan groups at different ages was analyzed using cross tabulation statistical analyses. Post-hoc pairwise comparisons with Pearson Chi-squared tests detected significant differences in malnutrition frequencies. To compare anthropometrics across groups, an analysis of covariance (ANCOVA) model with random effect was implemented. The covariate factors included gender, HIV status, and clinic type, as these factors were associated with an increased risk of malnutrition in the primary analysis of these data. The random effect accounted for repeat clinic visits by the same child. Post-hoc pairwise comparisons with Sidak adjustments detected differences in anthropometrics between orphan groups. A multiple variable logistic regression model was used to assess factors associated with stunting, underweight, and wasting. Estimated adjusted odds ratios and related confidence intervals were reported. All analyses were implemented in SPSS 25 and R. Alpha was set at .05.
Ethics
This study was approved by the IUSM Institutional Review Board and the MUSM Institutional Research and Ethics Committee. The requirement for informed consent was waived by both ethical governing bodies.
Results
Participant Characteristics
During the time period of interest, 15 027 children met the inclusion criteria, with 144 541 clinic visits included among them. Children without recorded anthropometric data (n = 89) were removed from the dataset (Figure 1).
Figure 1.

Flow diagram of study population selection.
In this cohort, 51.6% (n = 7766) of children were female, 85.5% (n = 12 847) were HIV-exposed, and the remaining 14.5% (n = 2180) were living with HIV. Between clinic visits, the number of children in each orphan group increased. At the first visit for each child, 1.2% (n = 190) were orphaned maternally, 3.0% (n = 456) were orphaned paternally, and 0.4% (n = 61) were orphaned totally. By the last visit for each child, 3.5% (n = 520) were orphaned maternally, 8.1% (n = 1222) were orphaned paternally, and 2.2% (n = 336) were orphaned totally (Figure 2).
Figure 2.
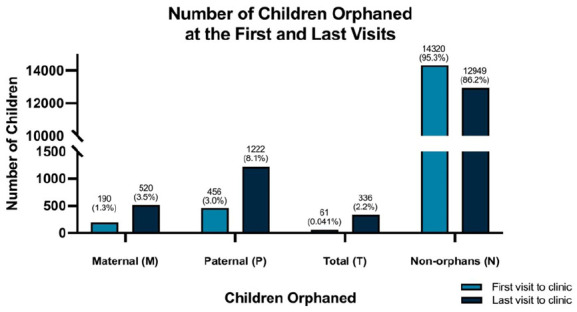
Orphan groups.
A higher proportion of children who were orphaned totally were also living with HIV (42.6%) compared to other groups. Children who were orphaned maternally or totally were first enrolled at clinic significantly later (0.8 ± 1.1 and 0.93 ± 1.1 years respectively) than children orphaned paternally (0.54 ± 0.9 years) or non-orphaned (0.36 ± 0.7 years) (Table 1).
Table 1.
Basic Study Participant Characteristics.
| Total: N = 15 027 | Maternal orphans: n = 520 | Paternal orphans: n = 1222 | Total orphans: n = 336 | Non-orphans: n = 12 949 | P-value | |
|---|---|---|---|---|---|---|
| n/total (%) | n/total (%) | n/total (%) | n/total (%) | n/total (%) | ||
| Gender | ||||||
| Female | 7766 (51.7) | 289 (55.6) | 616 (50.4) | 179 (53.3) | 6682 (51.6) | .228 |
| HIV status | ||||||
| HIV infected | 2180 (14.5) | 178 (34.2) | 255 (20.9) | 143 (42.6) | 1604 (12.4) | .000 |
| HIV exposed | 12 847 (85.5) | 342 (65.8) | 967 (79.1) | 193 (57.4) | 11 345 (87.6) | |
| Mean at age at enrollment (SD) in years | 0.40 (±0.8) | 0.80 (±1.1) | 0.54 (±0.9) | 0.93 (±1.1) | 0.36 (±0.7) | .000 |
| Clinic location | ||||||
| County/sub-county level | 6732 (44.8) | 223 (42.9) | 447 (39.0) | 113 (33.6) | 5919 (45.7) | .000 |
| Referral hospital | 2441 (16.2) | 60 (11.5) | 237 (19.4) | 40 (11.9) | 2104 (16.2) | |
| Rural health clinic | 5541 (36.9) | 221 (42.5) | 479 (39.2) | 173 (51.5) | 4668 (36.0) |
P-values were calculated using Chi-square testing.
Abbreviation: SD, standard deviation.
Anthropometrics
Orphan status had a significant negative effect on the children’s nutritional status, while accounting for gender, HIV status, and clinic type. All anthropometric parameters were significantly lower in orphan groups when compared to the non-orphan group (P < .001), with the exception of wasting among children orphaned maternally (Table 2). Children orphaned maternally and totally generally had higher rates of malnutrition when compared to children orphaned paternally or non-orphaned (Table 3). Children who were non-orphaned had the lowest rates of malnutrition at every visit, except for children orphaned paternally at the 18-month visit (Figure 3).
Table 2.
Anthropometrics Across Orphan Groups.
| Maternal orphans | Paternal orphans | Total orphans | Non-orphans | Mixed model random effect P-value | |
|---|---|---|---|---|---|
| WAZ | –1.097 ± 0.024a | –1.060 ± 0.016a,d | –1.138 ± 0.029a,c | –0.841 ± 0.008b,c,d | .000 |
| HAZ | –1.917 ± 0.036a,c | –1.713 ± 0.024a,b | –1.817 ± 0.045a | –1.552 ± 0.012b,c,d | .000 |
| WHZ | 0.066 ±0.037c,d | –0.061 ± 0.025a,b | –0.095 ± 0.046a,b | 0.145 ±0.013c,d | .000 |
Data displayed as mean ± standard error—displayed means are estimated marginal means within the model, accounting for repeated measures.
P < .05, post-hoc pairwise test with Sidak adjustment, compared to non-orphans group.
P < .05, post-hoc pairwise test with Sidak adjustment, compared to maternal orphans group.
P < .05, post-hoc pairwise test with Sidak adjustment, compared to paternal orphans group.
P < .05, post-hoc pairwise test with Sidak adjustment, compared to total orphans group.
Table 3.
Proportion of Malnourished Children at First and Last Clinic Visits, and Ages of Enrollment (in years).
| Maternal orphans | Paternal orphans | Total orphans | Non-orphans | Chi square P-value | ANOVA P-value | |
|---|---|---|---|---|---|---|
| First visit* | ||||||
| n (%) | 122 (64.2%) | 232 (50.9%) | 37 (60.7%) | 6019 (42.0%) | .000 | - |
| Mean age ± SD | 1.53 ± 1.30a,c | 0.90 ± 1.06a,b,d | 1.55 ± 1.31a,c | 0.37 ± 0.71b,c,d | - | .000 |
| Median age | 1.25 | 0.47 | 1.24 | 0.10 | ||
| Last visit** | 241 (46.3%) | 521 (42.6%) | 155 (46.1%) | 5061 (39.1%) | .000 | - |
| Mean age ± SD | 2.21 ± 1.17a,d | 2.18 ± 1.07a,d | 2.66 ± 1.07a,b,c | 1.64 ± 1.01b,c,d | - | .000 |
| Median age | 1.97 | 1.95 | 2.66 | 1.54 | ||
| Proportion of children who first attended clinic <1 year of age (n = 13 129) | ||||||
| HIV-infected | 14 (15.6%) | 30 (9.6%) | 3 (11.1%) | 836 (6.6%) | .001 | |
| Malnourished | 59 (65.6%) | 138 (44.4%) | 16 (59.3%) | 5036 (39.7%) | .000 | |
| Proportion of children who first attended clinic ≥1 year of age (n = 1898) | ||||||
| HIV-infected | 91 (91%) | 107 (73.8%) | 26 (76.5%) | 1073 (66.3%) | .000 | |
| Malnourished | 63 (63.0%) | 94 (64.8%) | 21 (61.8%) | 983 (60.7%) | .776 | |
First visit indicates that the first visit for each child was set as primary and the remaining visits were not included in the data report.
Last visit indicates that the last visit for each child was set as primary and remaining visits were not included in the data report.
P < .05, post-hoc pairwise test with Sidak adjustment, compared to non-orphans group.
P < .05, post-hoc pairwise test with Sidak adjustment, compared to maternal orphans group.
P < .05, post-hoc pairwise test with Sidak adjustment, compared to paternal orphans group.
P < .05, post-hoc pairwise test with Sidak adjustment, compared to total orphans group.
Figure 3.

Percentage of malnourished children, by orphan status and age of child.
Age of Enrollment to Clinic
Among those first presenting to clinic before the age of 1 year, malnutrition rates were higher in children who were orphaned compared to children who were non-orphaned (P < .0001). Of these children, less than 16% across all orphan groups were living with HIV. Children who first presented to the clinic after 1 year of age showed no significant differences in rates of malnutrition (P = .776); however, there were statistically significant differences in the proportion of children who were living with HIV across the orphan groups (P < .0001), ranging from 66% to 91%. The mean age of enrollment among children who were malnourished was 1.53 ± 1.30 years for children orphaned maternally, 0.90 ± 1.06 years for children orphaned paternally, 1.55 ± 1.31 years for children orphaned totally, and 0.37 ± 0.71 years for children who were non-orphaned.
Factors Associated with Malnutrition
Children who were paternally orphaned or non-orphaned had higher odds of malnutrition when living in a rural setting compared to those living in an urban setting. Whereas most orphan groups (except those who were maternally orphaned) had lower odds of stunting when attending the county or rural health clinics, non-orphans experienced higher odds of being underweight or wasting when attending a county or rural health clinic compared to the referral clinics. Across all orphan groups, females were more likely to be underweight. Children living with HIV were less likely to be underweight across all orphan groups when compared to those uninfected with HIV (Table 4).
Table 4.
Factors Associated with Stunted, Wasted, and Underweight Status Across Orphan Groups.
| Adjusted odds ratios (95% CI) | ||||||||||||
|---|---|---|---|---|---|---|---|---|---|---|---|---|
| Underweight status (WAZ ≤ −2) | Wasted (WHZ ≤ −2) | Stunted (HAZ ≤ −2) | ||||||||||
| Variable | Maternal orphans | Paternal orphans | Total orphans | Non-orphans | Maternal orphans | Paternal orphans | Total orphans | Non-orphans | Maternal orphans | Paternal orphans | Total orphans | Non-orphans |
| Home setting | ||||||||||||
| Urban | Reference | Reference | Reference | Reference | Reference | Reference | Reference | Reference | Reference | Reference | Reference | Reference |
| Rural | 1.741 (0.793, 3.823) | 0.939 (0.599, 1.473) | 0.444 (0.181, 1.090) | 0.727 (0.625, 0.846) | 0.500 (0.153, 1.639) | 0.682 (0.334, 1.393) | 1.637 (0.295, 9.089) | 0.436 (0.338, 0.563) | 1.218 (0.640, 2.315) | 1.952 (1.239, 3.076) | 1.765 (0.725, 4.294) | 1.490 (1.303, 1.703) |
| Clinic location | ||||||||||||
| Referral hospital | Reference | Reference | Reference | Reference | Reference | Reference | Reference | Reference | Reference | Reference | Reference | Reference |
| County/sub-county hospital | 1.011 (0.471, 2.170) | 0.864 (0.550, 1.355) | 0.913 (0.303, 2.750) | 1.302 (1.122, 1.512) | 2.090 (0.639, 6.838) | 1.603 (0.847, 3.031) | 0.871 (0.191, 3.974) | 2.587 (2.062, 3.246) | 0.647 (0.337, 1.241) | 0.458 (0.306, 0.686) | 0.219 (0.085, 0.563) | 0.432 (0.382, 0.488) |
| Rural health clinic | 0.395 (0.137, 1.141) | 0.853 (0.466, 1.560) | 1.003 (0.274, 3.670) | 1.261 (1.027, 1.550) | 1.784 (0.386, 8.254) | 1.756 (0.732, 4.213) | 0.301 (0.035, 2.577) | 2.751 (2.006, 3.773) | 0.740 (0.305, 1.796) | 0.318 (0.179, 0.564) | 0.174 (0.051, 0.586) | 0.383 (0.320, 0.459) |
| Gender | ||||||||||||
| Male | Reference | Reference | Reference | Reference | Reference | Reference | Reference | Reference | Reference | Reference | Reference | Reference |
| Female | 1.587 (1.027, 2.454) | 1.341 (1.008, 1.783) | 1.627 (0.969, 2.734) | 1.380 (1.253, 1.519) | 1.700 (0.863, 3.350) | 1.115 (0.742, 1.676) | 1.009 (0.443, 2.299) | 1.228 (1.059, 1.425) | 1.260 (0.842, 1.886) | 1.452 (1.112, 1.898) | 1.475 (0.869, 2.504) | 1.393 (1.282, 1.513) |
| Child’s HIV status | ||||||||||||
| HIV-exposed but uninfected | Reference | Reference | Reference | Reference | Reference | Reference | Reference | Reference | Reference | Reference | Reference | Reference |
| HIV-infected | 0.578 (0.370, 0.902) | 0.505 (0.366, 0.696) | 0.571 (0.338, 0.967) | 0.325 (0.288, 0.366) | 0.997 (0.494, 2.014) | 0.708 (0.444, 1.130) | 0.485 (0.209, 1.124) | 0.302 (0.254, 0.358) | 0.999 (0.658, 1.517) | 0.577 (0.419, 0.795) | 1.042 (0.609, 1.783) | 0.651 (0.576, 0.736) |
The values that are bolded are statistically significant, p > .05.
Discussion
This study aimed to evaluate the impact of orphan status on malnutrition, differentiating children orphaned maternally, paternally, totally, and non-orphaned. We found that anthropometric z-scores were significantly lower in children who were orphaned compared to children who were non-orphaned, supporting our hypothesis that orphan status impacts malnutrition. Generally, children who were orphaned maternally and totally had lower anthropometric z-scores and larger proportions of malnutrition compared to children who were orphaned paternally and non-orphaned. These children were also enrolled at clinic significantly later and were more likely to live with HIV. Stunting was the most significantly impacted marker of malnutrition. In our cohort, being female increased the risk of malnutrition across both orphaned and non-orphaned groups.
Compounding risk factors of malnutrition, including HIV exposure and orphan status, may further compromise health outcomes in children. All children within this study were born to WLHIV, which is associated with lower growth anthropometrics.30 Children born to WLHIV, including those who are not HIV-infected, are more likely to die before their fifth birthday due to illness and malnutrition.31 While the primary analysis of these data examined the effect of HIV status on children’s growth,11 we also evaluated the compounded effect of orphan status by incorporating children who were non-orphaned as our control group.
Our data suggests that children orphaned maternally and totally experience higher rates of malnutrition in infancy and early childhood compared to children orphaned paternally or non-orphaned. This is consistent with findings of other studies,32 and is attributed partly to the maternal role of providing nutrition during this critical growth period.15 Additionally, children orphaned maternally and totally presented later to clinic, a finding consistent with other data from sub-Saharan Africa.33 We speculate that this resulted from social disruptions within the household when a child became orphaned and required care from other family members. This delay of preventative care services (eg, vaccinations, weight-monitoring) hinders potential early intervention and risks further health outcomes. Furthermore, children orphaned maternally and totally were more likely to live with HIV, especially if presenting after 1 year of age, compared to children orphaned paternally or non-orphaned. Mothers struggling with viral suppression and access to medications during pregnancy are more likely to die from HIV complications and transmit the virus to their infants, while the caregivers of children who are newly orphaned may delay in bringing them to clinic due to the stigma surrounding an HIV diagnosis.33,34 Thus, the results of our study suggest that children who are maternally or totally orphaned are particularly vulnerable to poor outcomes and should be prioritized for additional support and resources by HIV programs.
Across all orphan groups, the mean z-score for stunting (HAZ) was the most notable negative anthropometric marker. Prior studies in Zimbabwe and Kenya also found that children orphaned maternally and paternally had demonstrated higher rates of stunting.18,35 Factors contributing to stunting include chronic inadequate nutritional intake, recurrent and/or chronic illness, maternal malnutrition leading to intrauterine growth restriction, and epigenetic changes.2,30 Aside from the development of childhood infections, developmental delays, and noncommunicable diseases, stunting is also associated with poorer school performance and lower adulthood earnings.36 Notably, the prevalence of stunting increases as wealth decreases worldwide.36,37 This measure of chronic malnutrition highlights global disparities in the social determinants of health. While international organizations, such as the World Health Assembly, have made ambitious goals to drastically reduce rates of stunting,36 these goals require collaboration and advocacy among community partners and governmental organizations. Fortunately, with these efforts, the prevalence of stunting has significantly declined over the years,36,37 partly due to an improvement in income inequality, sanitation facilities, and women’s rights.36 Supporting efforts to reduce stunting will have life-long benefits to children across the globe.
This study found that females were more likely to be underweight across all orphan groups, and children living with HIV were less likely to be underweight across all orphan groups. These results differed from existing literature reporting that males and children living with HIV have worse malnutrition outcomes.11,19,32,38 Globally, other factors associated with malnutrition in children who are orphaned include households with many dependents or low socioeconomic status,32 female-headed households,32 attending an urban clinic,11 the level of maternal education,39 and heightened poverty.40 We hypothesize a multifactorial explanation for the mixed results between our study and other literature—for example, additional nutritional supplementation and resources may have been available for families impacted by HIV within the clinical care system, but not documented within the electronic medical record system, and thus not accounted for within this analysis. Future studies should account for nutritional and support programs that are provided for study participants.
The findings presented here should be considered in light of some potential limitations. Only children of WLHIV were included in our current dataset, and HIV-exposure is a significant factor relating to malnutrition. Also, the number of children attending clinic decreased as they aged, likely leading to a selection bias for those who continued in clinic after HIV confirmatory testing was performed for specific medical concerns. Due to the reliance on retrospective data, some potentially confounding variables were not located, such as nutritional supplementation, socioeconomic status, and living environments. Home environments, such as living in relative homes, family homes, child-headed homes, or institutional homes, were not captured in this study due to its retrospective nature.21
Conclusions
Children who are orphaned maternally and totally experienced worse nutritional outcomes compared to children orphaned paternally and non-orphaned. Children orphaned maternally and totally also presented to clinic later, which may contribute to their malnutrition risks by delaying the appropriate referrals to nutritional services. These findings support intervention programs for improving the rate of child malnutrition worldwide, especially among those who are orphaned maternally and totally. Identifying additional risk factors will allow for more specific interventional strategies aimed at supporting their nutrition and development.
Acknowledgments
We would like to acknowledge Melissa Thomas for her careful review and feedback on the manuscript.
Footnotes
Author Contributions: The authors confirm contribution to the paper as follows: study conception and design: S. Jansen, M. McHenry, E. Apondi, S. Ayaya; data collection: M. McHenry, E. Apondi, S. Ayaya; analysis and interpretation of results: S. Jansen, M. McHenry, J. Kim; draft manuscript preparation: S. Jansen, M. McHenry. All authors reviewed the results and approved the final version of the manuscript.
The author(s) declared no potential conflicts of interest with respect to the research, authorship, and/or publication of this article.
Funding: The author(s) received no financial support for the research, authorship, and/or publication of this article.
ORCID iDs: Shae Jansen  https://orcid.org/0000-0003-2741-0416
Megan S. McHenry
https://orcid.org/0000-0001-6753-0928
References
- 1. UNICEF. Malnutrition — UNICEF Data. June 20, 2020. Updated March 2020. Accessed June 20, 2020. https://data.unicef.org/topic/nutrition/malnutrition/
- 2. Perez-Escamilla R, Bermudez O, Buccini GS, et al. Nutrition disparities and the global burden of malnutrition. BMJ. 2018;361:k2252. doi: 10.1136/bmj.k2252 [DOI] [PMC free article] [PubMed] [Google Scholar]
- 3. de Onis M, Blössner M. The World Health Organization Global Database on child growth and malnutrition: methodology and applications. Int Epidemiol Assoc. 2003;32(4):518-526. doi: 10.1093/ije/dyg099 [DOI] [PubMed] [Google Scholar]
- 4. Yirga AA, Mwambi HG, Ayele DG, Melesse SF. Factors affecting child malnutrition in Ethiopia. Afr Health Sci. 2019;19(2):1897-1909. doi: 10.4314/ahs.v19i2.13 [DOI] [PMC free article] [PubMed] [Google Scholar]
- 5. Xie W, Jensen SKG, Wade M, et al. Growth faltering is associated with altered brain functional connectivity and cognitive outcomes in urban Bangladeshi children exposed to early adversity. BMC Med. 2019;17(1):199. doi: 10.1186/s12916-019-1431-5 [DOI] [PMC free article] [PubMed] [Google Scholar]
- 6. World Health Organization. Underweight among children under 5 years of age (number in millions) (JME). 2021. Accessed 12 November, 2021. https://www.who.int/data/gho/data/indicators/indicator-details/GHO/gho-jme-underweight-numbers-(in-millions)
- 7. Harding KL, Aguayo VM, Webb P. Factors associated with wasting among children under five years old in South Asia: implications for action. PLoS One. 2018;13(7):e0198749. [DOI] [PMC free article] [PubMed] [Google Scholar]
- 8. World Health Organization. Nutrition Landscape Information System: Country Profile Indicators, Interpretation Guide. World Health Organization; 2010. [Google Scholar]
- 9. Kamath SM, Venkatappa KG, Sparshadeep EM. Impact of nutritional status on cognition in institutionalized orphans: a pilot study. J Clin Diagn Res. 2017;11(3):CC01-CC04. doi: 10.7860/JCDR/2017/22181.9383 [DOI] [PMC free article] [PubMed] [Google Scholar]
- 10. United Nations Children’s Fund (UNICEF), World Health Organization, International Bank for Reconstruction and Development/The World Bank. Levels and Trends in Child Malnutrition: Key Findings of the 2019 Edition of the Joint Child Malnutrition Estimates. World Health Organization; 2019. [Google Scholar]
- 11. McHenry MS, Apondi E, Ayaya SO, et al. Growth of young HIV-infected and HIV-exposed children in western Kenya: a retrospective chart review. PLoS One. 2019;14(12):e0224295. doi: 10.1371/journal.pone.0224295 [DOI] [PMC free article] [PubMed] [Google Scholar]
- 12. Rajan R, Seth A, Mukherjee SB, Chandra J. Development assessment of HIV exposed children aged 6-18 months: a cohort study from North India. AIDS Care. 2017;29(11):1404-1409. doi: 10.1080/09540121.2017.1300629 [DOI] [PubMed] [Google Scholar]
- 13. Muenchhoff M, Healy M, Singh R, et al. Malnutrition in HIV-Infected children is an indicator of severe disease with an impaired response to antiretroviral therapy. AIDS Res Hum Retroviruses. 2018;34(1):46-55. doi: 10.1089/AID.2016.0261 [DOI] [PMC free article] [PubMed] [Google Scholar]
- 14. Shangani S, Operario D, Genberg B, et al. Unconditional government cash transfers in support of orphaned and vulnerable adolescents in western Kenya: is there an association with psychological wellbeing? PLoS One. 2017;12(5):e0178076. doi: 10.1371/journal.pone.0178076 [DOI] [PMC free article] [PubMed] [Google Scholar]
- 15. Lindblade KA, Odhiambo F, Rosen DH, DeCock KM. Health and nutritional status of orphans <6 years old cared for by relatives in western Kenya. Trop Med Int Health. 2003;8(1):67-72. [DOI] [PubMed] [Google Scholar]
- 16. USAID. Orphans and vulnerable children affected by HIV and AIDS. 2021. Accessed May 25, 2021. https://www.usaid.gov/global-health/health-areas/hiv-and-aids/technical-areas/orphans-and-vulnerable-children
- 17. Bryant M, Beard J. Orphans and vulnerable children affected by human immunodeficiency virus in Sub-Saharan Africa. Pediatr Clin North Am. 2016;63(1):131-147. [DOI] [PubMed] [Google Scholar]
- 18. Watts H, Gregson S, Saito S, Lopman B, Beasley M, Monasch R. Poorer health and nutritional outcomes in orphans and vulnerable young children not explained by greater exposure to extreme poverty in Zimbabwe. Trop Med Int Health. 2007;12(5):584-593. doi: 10.1111/j.1365-3156.2007.01832.x [DOI] [PubMed] [Google Scholar]
- 19. Panpanich R, Brabin B, Gonani A, Graham S. Are orphans at increased risk of malnutrition in Malawi? Ann Trop Paediatr. 1999;19(3):279-285. [DOI] [PubMed] [Google Scholar]
- 20. Whetten K, Ostermann J, Pence BW, et al. Three-year change in the wellbeing of orphaned and separated children in institutional and family-based care settings in five low- and middle-income countries. PLoS One. 2014;9(8):e104872. doi: 10.1371/journal.pone.0104872 [DOI] [PMC free article] [PubMed] [Google Scholar]
- 21. Braitstein P, Ayaya S, Nyandiko WM, et al. Nutritional status of orphaned and separated children and adolescents living in community and institutional environments in uasin gishu county, kenya. PLoS One. 2013;8(7):e70054. doi: 10.1371/journal.pone.0070054 [DOI] [PMC free article] [PubMed] [Google Scholar]
- 22. Hearst MO, Himes JH, Johnson DE, et al. Growth, nutritional, and developmental status of young children living in orphanages in Kazakhstan. Infant Ment Health J. 2014;35(2):94-101. doi: 10.1002/imhj.21430 [DOI] [PubMed] [Google Scholar]
- 23. Siika AM, Rotich JK, Simiyu CJ, et al. An electronic medical record system for ambulatory care of HIV-infected patients in Kenya. Int J Med Inform. 2005;74(5):345-355. doi: 10.1016/j.ijmedinf.2005.03.002 [DOI] [PubMed] [Google Scholar]
- 24. Einterz RM, Kelley CR, Mamlin JJ, Van Reken DE. Partnerships in international health. The Indiana University-moi University experience. Infect Dis Clin North Am. 1995;9(2):453-455. [PubMed] [Google Scholar]
- 25. Kenya Ministry of Health. Guidelines for Prevention of Mother to Child Transmission (PMTCT) of HIV/AIDS in Kenya. 4th ed. National AIDS & STI Control Programme; 2009. [Google Scholar]
- 26. World Health Organization. Consolidated Guidelines on the Use of Antiretroviral Drugs and Treating and Preventing HIV Infection: Recommendations for a Public Health Approach. World Health Organization; 2013. [PubMed] [Google Scholar]
- 27. Apondi E. AMPATH Standard Operating Procedures: Maternal-Child Health Clinic Follow Up for HIV-Exposed Infant. McHenry M; 2019. [Google Scholar]
- 28. World Health Organization. Training Course on Child Growth Assessment, Geneva, Switzerland. World Health Organization; 2008. Accessed February 7, 2023. https://apps.who.int/iris/bitstream/handle/10665/43601/9789241595070_C_eng.pdf?sequence=3&isAllowed=y [Google Scholar]
- 29. Mei Z, Grummer-Strawn LM. Standard deviation of anthropometric Z-scores as a data quality assessment tool using the 2006 WHO growth standards: a cross country analysis. Bull World Health Organ. 2007;85(6):441-448. [DOI] [PMC free article] [PubMed] [Google Scholar]
- 30. Muhangi L, Lule SA, Mpairwe H, et al. Maternal HIV infection and other factors associated with growth outcomes of HIV-uninfected infants in Entebbe, Uganda. Public Health Nutr. 2013;16(9):1548-1557. doi: 10.1017/S1368980013000499 [DOI] [PMC free article] [PubMed] [Google Scholar]
- 31. Nakiyingi JS, Bracher M, Whitworth JA, et al. Child survival in relation to mother’s HIV infection and survival: evidence from a Ugandan cohort study. AIDS. 2003;17(12):1827-1834. doi: 10.1097/00002030-200308150-00012 [DOI] [PubMed] [Google Scholar]
- 32. Kimani-Murage EW, Holding PA, Fotso JC, et al. Food security and nutritional outcomes among urban poor orphans in Nairobi, Kenya. J Urban Health. 2011;88(S2):282-297. doi: 10.1007/s11524-010-9491-z [DOI] [PMC free article] [PubMed] [Google Scholar]
- 33. Mokgatle MM, Madiba S. The burden of disease on HIV-infected orphaned and non-orphaned children accessing primary health facilities in a rural district with poor resources in South Africa: a cross-sectional survey of primary caregivers of HIV-infected children aged 5–18 years. Infect Dis Poverty. 2015;4:18. doi: 10.1186/s40249-015-0049-x [DOI] [PMC free article] [PubMed] [Google Scholar]
- 34. Thompson RT, Meslin EM, Braitstein PK, Nyandiko WM, Ayaya SO, Vreeman RC. The vulnerabilities of orphaned children participating in research: a critical review and factors for consideration for participation in biomedical and behavioral research. J Empir Res Hum Res Ethics. 2012;7(4):56-66. doi: 10.1525/jer.2012.7.4.56 [DOI] [PMC free article] [PubMed] [Google Scholar]
- 35. Berger MR, Fields-Gardner C, Wagle A, Hollenbeck CB. Prevalence of malnutrition in human immunodeficiency virus/acquired immunodeficiency syndrome orphans in the Nyanza province of Kenya: a comparison of conventional indexes with a composite index of anthropometric failure. J Am Diet Assoc. 2008;108(6):1014-1017. doi: 10.1016/j.jada.2008.03.008 [DOI] [PubMed] [Google Scholar]
- 36. Argaw A, Hanley-Cook G, De Cock N, Kolsteren P, Huybregts L, Lachat C. Drivers of under-five stunting trend in 14 low- and middle-income countries since the turn of the Millennium: a multilevel pooled analysis of 50 demographic and health surveys. Nutrients. 2019;11(10):2485. doi: 10.3390/nu11102485 [DOI] [PMC free article] [PubMed] [Google Scholar]
- 37. Mannar MGV, Micha R. Inequalities in the global burden of malnutrition. 2020 Global Nutrition Report. 2020. Accessed February 7, 2023. https://globalnutritionreport.org/reports/2020-global-nutrition-report/
- 38. Khan S, Zaheer S, Safdar NF. Determinants of stunting, underweight and wasting among children < 5 years of age: evidence from 2012-2013 Pakistan demographic and health survey. BMC Public Health. 2019;19(1):358. doi: 10.1186/s12889-019-6688-2 [DOI] [PMC free article] [PubMed] [Google Scholar]
- 39. Moses LYA. Orphans and vulnerable children (OVC) in Uganda; are orphans more malnourished than non-orphans. Soc Sci. 2013;2(2):58-65. doi: 10.11648/j.ss.20130202.16 [DOI] [Google Scholar]
- 40. Owen (nee Watts) H, Nyamukapa C, Beasley M, et al. Contrasting causal pathways contribute to poorer health and nutrition outcomes in orphans in Zimbabwe. Vulnerable Child Youth Stud. 2009;4(4):312-323. doi: 10.1080/17450120903039977 [DOI] [PMC free article] [PubMed] [Google Scholar]