

Abstract
Saturn’s moon, Titan, has a hydrocarbon-based hydrologic cycle with methane and ethane rainfall. Because of Titan’s low gravity, “floating liquid droplets” (coherent droplets of liquid hydrocarbons that float upon a liquid surface) may form on the surface of Titan’s hydrocarbon lakes and seas during rainfall. Floating liquid droplets, however, have not been investigated in the laboratory under conditions appropriate for the surface of Titan (cryogenic, hydrocarbon, liquids). We conducted a set of experiments to simulate methane and ethane rainfall under Titan surface conditions (89–94 K, 1.5 bar nitrogen atmosphere) and find that floating ethane droplets form in a wide range of bulk liquid compositions, yet floating methane droplets only form in a narrow compositional range and impact velocity. We find droplet formation is independent of the liquid density and hypothesize that dissolved atmospheric nitrogen in the bulk liquid may repel liquid ethane droplets at the surface. We propose that liquid droplets will form in Titan’s methane-rich lakes and seas during ethane rainfall with a droplet radius of ≤3 mm and an impact velocity of ≤0.7 m/s. The presence of these droplets on Titan’s lakes may result in a liquid surface layer that is dominated in rainfall composition.
Keywords: noncoalescing droplets, delayed coalescence, liquid hydrocarbons, Titan, Titan rain, laboratory experiments
1. Introduction
“Floating liquid droplets”, or noncoalescing droplets, are liquid droplets that, when released from above, do not immediately coalesce with the liquid below, rather they remain floating as a coherent droplet on the liquid surface for some amount of time before mixing. Scientists have studied this phenomenon in water since the late 1800s.1,2 Over the years, studies have investigated various liquids under Earth ambient temperature and pressure to improve industrial processes, such as ink-jet printing, liquid separation, and the use of emulsifiers3,4 (review provided by ref (4)). Droplet formation hypotheses, however, differ between liquid species and while various processes have been proposed3−15 (see Section 4 for additional details), the exact mechanism behind droplet formation is currently unresolved. Additionally, no studies have investigated this phenomenon at cryogenic temperatures relevant to Titan.
Saturn’s moon, Titan, has a surface temperature of 89–94 K,16,17 a 1.5 bar predominantly nitrogen (N2) atmosphere,18,19 and evidence of an active hydrocarbon-based hydrologic cycle, likely including methane (CH4) and ethane (C2H6) rain.20−30 This hydrocarbon rain collects in polar lakes and seas,31,32 which have a composition of predominantly methane, ethane, and dissolved atmospheric nitrogen.33−38 Because of Titan’s low gravity (1.35 m/s2), Titan’s rain has a lower impact velocity21 (∼1 m/s) compared to Earth (∼10 m/s) and has a hypothesized size of droplet upon impact of tenths of a millimeter to a few millimeters in radius.21 The low impact velocity and small droplet size of Titan’s rain may result in favorable conditions for the formation of floating liquid droplets on the surface of Titan’s hydrocarbon lakes and seas during hydrocarbon rainfall. This experimental study aims to explore the liquid interface of a methane or ethane raindrop and a methane–ethane–nitrogen liquid body under Titan surface conditions, and to investigate the bulk liquid compositional range required for floating liquid droplet formation at an impact velocity and droplet size appropriate for Titan rain.
2. Experimental Methods
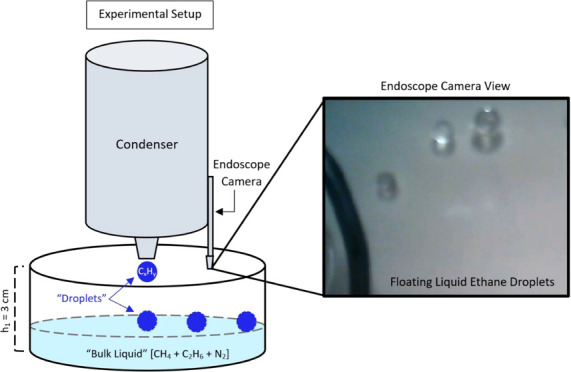
2.1. Environmental Chamber
Experiments were conducted at the University of Arkansas’ Titan Surface Simulation Chamber (i.e., Andromeda chamber39) where liquid methane and ethane samples (10–200 g; CP grade) are studied under Titan-relevant surface temperatures (89–104 K) and a constant atmospheric pressure (1.5 bar nitrogen; N2; purity >99.9%). The environmental chamber consists of an outer sealed and pressurized 2 m tall steel cylinder, that houses the Titan module, and an electronic balance (Figure 1). The balance is positioned above the Titan module, outfitted with a heater and insulation to maintain a warmer working temeprature (>−10 °C). The Titan module houses the condenser (which converts gaseous hydrocarbons to liquid phase), the sample dish (where samples are analyzed), and an endoscope camera. The sample dish is hung from the balance by three nylon cords to a position ∼3 cm below the opening of the condenser. The Titan module and condenser are cooled separately via liquid nitrogen flowing through copper coils circling each component, leading to moderately different temperatures between the two components. Type-K thermocouples are positioned inside the condenser and in the sample dish to measure the temperatures of the liquid that forms the droplet and bulk liquid, respectively. LabView software records the temperature and mass measurements once per second. An endoscope camera is positioned above the sample to obtain real-time, plan-view, optical observations of the sample. The sample mass is recorded before and after liquid is introduced to the sample dish (i.e., sample “pour”). Each sample mass is then converted to moles before calculating the methane–alkane composition (eq 1) of the bulk liquid. Methane–alkane ratio is computed as
| 1 |
where fratio is the methane–alkane ratio and X is in moles.
Figure 1.
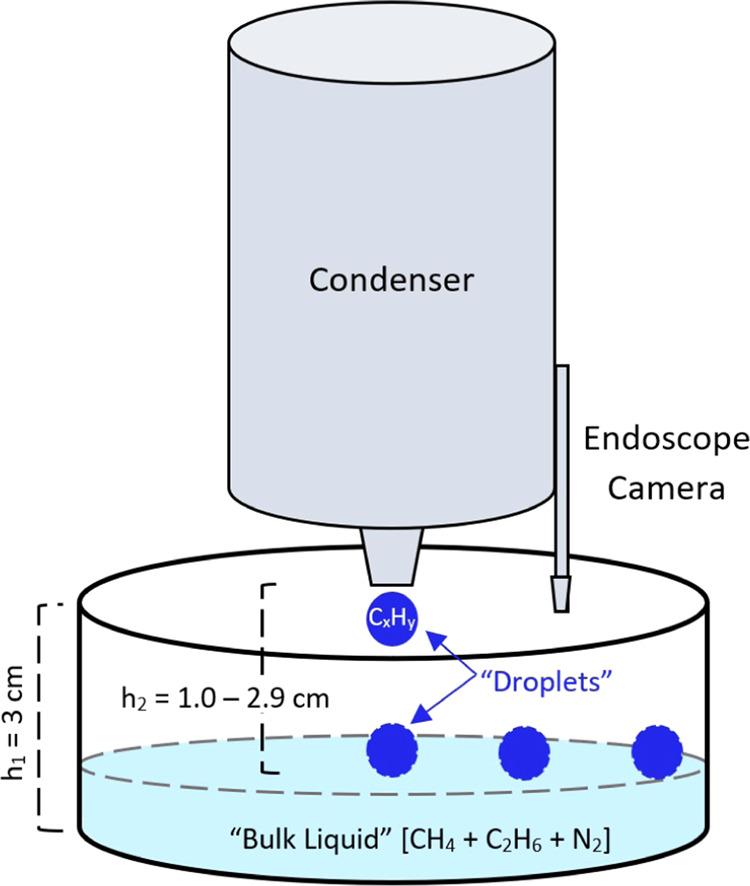
Illustration of the Titan Module, not to scale. A 2 m tall steal cylinder houses the Titan module and maintains a 1.5 bar atmospheric pressure of nitrogen (N2). In our experiments, the hydrocarbon “raindrop” is dripped from the condenser into the liquid below (i.e., “bulk liquid”). The experimental setup is stationary, and the droplet height (h2) decreases as the experiment progresses. An endoscope camera allows real-time viewing of the sample from above. The bulk liquid and droplet temperature are measured by a thermocouple submerged in the bulk liquid sample and inside the condenser, respectively.
2.2. Liquid Droplet Experiments
Two liquid species were tested in our experiments: ethane and methane. These sample liquids were systematically tested over 17 experiments (eight ethane and nine methane droplet experiments; Table S1, S2). Each ethane droplet experiment began by adding methane to the sample dish (i.e., “bulk liquid”). Then, ethane was dripped from the condenser, positioned ∼3 cm above the sample dish, resulting in a gradual decrease of the methane–alkane ratio from 100 to 27.0 mol %, in 0.8–16.0 mol % intervals. For methane droplets, most experiments began by adding ethane to the sample dish and then dripping methane from above, evolving the bulk liquid composition from 0 to 96 mol % methane–alkane ratio in 0.6–69.2 mol % intervals. Because of limited coolant volume (which determines the length of an experiment), we tested methane-rich compositions (>80 mol % methane–alkane ratio) during methane droplet experiments by beginning with a methane–ethane mixture in the bulk liquid before testing for methane droplets (experiment M-1, Table S2).
Between each compositional range tested, the temperature of the bulk liquid and the condenser from which droplets are generated was recorded, along with the composition of the bulk liquid and the presence of floating liquid droplets (or lack thereof). This provides the bulk liquid compositional range and temperature where floating liquid droplets did or did not form. The duration of each experiment (2.5–5.5 h) was limited by the liquid nitrogen supply and/or the occurrence of a nitrogen exsolution event (described in ref (40)). Additionally, since the experiments were performed under realistic Titan conditions, atmospheric nitrogen is free to dissolve into the bulk liquid over the course of the experiment. Nitrogen saturation is assumed to be reached in the bulk liquid because it is exposed to the nitrogen atmosphere for the duration of the experiment. Droplets, on the other hand, are nitrogen-free because the droplets are generated from the condenser, which is not exposed to the nitrogen atmosphere. Further information on nitrogen dissolution, uncertainty discussion, and additional methods are provided in the Supporting Information. Additionally, no unexpected or unusually high safety hazards were encountered during our experiments.
3. Experimental Results
3.1. Ethane Floating Liquid Droplet Observations
Table 1 compiles the ethane droplet results and lists the experiments where floating ethane liquid droplets were observed. Across all experiments, ethane droplets formed at nearly all compositional ranges tested (27–100 mol %, Movie S1, Figure 2a). However, where some experiments are void of droplets, other experiments produced droplets in the same compositional range. Larger gaps in droplet formation during a single experiment (5–15 mol %) occur either at the beginning of the experiment or coincide with a nitrogen bubble exsolution event. Droplets were sometimes seen alongside bubbles; however, droplets are generally more difficult to detect during these episodes and may explain the compositional gaps (see Section 4 for other hypotheses). Bulk liquid compositions <27 mol % methane–alkane ratio were not tested because the experiments ended due either to an exhausted liquid nitrogen supply or a nitrogen exsolution event occurred,40 and floating droplets were not observed when ethane was dripped into pure ethane (0 mol % methane–alkane ratio).
Table 1. Experimental Overview: Ethane Droplets Observed.
| observation number | mass (g)a |
temperature (K)a |
composition (mol % methane–alkane ratio) |
drop
height (cm)b |
impact
velocity (m/s)b |
droplets observed | |||||||
|---|---|---|---|---|---|---|---|---|---|---|---|---|---|
| original methane mass | start pour ethane | end pour ethane | droplet | bulk liquid | dropleta | bulk liquid pour rangeb | start pour | end pour | start pour | end pour | |||
| ±0.20 | ±0.20 | ±0.20 | ±0.4 | ±0.4 | start pour | end pour | ±0.5 | ±0.5 | |||||
| 1 | 61.35 | 0 | 5.87 | 101.0 | 96.8 | C2H6 | 100 ± 0 | 95.1 ± 0.2 | 2.2 | 2.1 | 0.65 ± 0.08 | 0.65 ± 0.08 | yes |
| 2 | 46.13 | 0 | 16.51 | 91.2 | 89.9 | C2H6 | 100 ± 0 | 84.0 ±1.5 | 1.4 | 1.2 | 0.52 ± 0.1 | 0.49 ± 0.11 | yes |
| 3 | 41.73 | 0.30 | 0.92 | 104.0 | 99.4 | C2H6 | 99.6 ± 0.2 | 98.8 ± 0.4 | 2.4 | 2.4 | 0.69 ± 0.07 | 0.69 ± 0.07 | yes |
| 4 | 33.51 | 2.95 | 7.96 | 97.6 | 91.7 | C2H6 | 95.5 ± 0.3 | 88.8 ± 0.4 | 2.5 | 2.5 | 0.70 ± 0.07 | 0.70 ± 0.07 | yes |
| 5 | 35.00 | 3.24 | 5.55 | 99.9 | 92.2 | C2H6 | 95.3 ± 1.1 | 92.2 ± 1.5 | 2.5 | 2.5 | 0.70 ± 0.07 | 0.70 ± 0.07 | yes |
| 6 | 35.00 | 5.55 | 9.06 | 99.6 | 92.0 | C2H6 | 92.2 ± 1.5 | 87.9 ± 2.0 | 2.5 | 2.5 | 0.70 ± 0.07 | 0.69 ± 0.07 | yes |
| 7 | 33.51 | 7.96 | 11.68 | 95.7 | 91.6 | C2H6 | 88.8 ± 0.4 | 84.3 ± 0.5 | 2.5 | 2.4 | 0.70 ± 0.07 | 0.69 ± 0.08 | yes |
| 8 | 35.00 | 9.06 | 10.26 | 100.3 | 93.4 | C2H6 | 87.9 ± 2.0 | 86.5 ± 2.1 | 2.5 | 2.4 | 0.69 ± 0.07 | 0.69 ± 0.08 | yes |
| 9 | 34.55 | 9.83 | 12.57 | 94.8 | 91.5 | C2H6 | 86.8 ± 0.8 | 83.8 ± 1.0 | 2.5 | 2.4 | 0.69 ± 0.07 | 0.69 ± 0.08 | yes |
| 10 | 23.55 | 6.82 | 8.92 | 95.9 | 94.3 | C2H6 | 86.6 ± 0.8 | 83.2 ± 0.9 | 2.6 | 2.6 | 0.72 ± 0.07 | 0.71 ± 0.07 | yes |
| 11 | 45.47 | 13.36 | 16.72 | 101.8 | 91.8 | C2H6 | 86.5 ± 0.7 | 83.6 ± 0.7 | 2.3 | 2.2 | 0.67 ± 0.08 | 0.66 ± 0.08 | yes |
| 12 | 33.51 | 11.68 | 17.01 | 95.4 | 91.7 | C2H6 | 84.3 ± 0.5 | 78.7 ± 0.5 | 2.4 | 2.4 | 0.69 ± 0.07 | 0.69 ± 0.08 | yes |
| 13 | 34.55 | 12.57 | 17.00 | 95.1 | 91.4 | C2H6 | 83.8 ± 1.0 | 79.2 ± 1.0 | 2.4 | 2.4 | 0.69 ± 0.08 | 0.68 ± 0.08 | yes |
| 14 | 45.47 | 16.72 | 22.09 | 99.1 | 91.2 | C2H6 | 83.6 ± 0.7 | 79.4 ± 0.8 | 2.2 | 2.2 | 0.66 ± 0.08 | 0.66 ± 0.08 | yes |
| 15 | 23.55 | 8.92 | 12.40 | 96.4 | 94.5 | C2H6 | 83.2 ± 0.9 | 78.1 ± 1.0 | 2.6 | 2.6 | 0.71 ± 0.07 | 0.71 ± 0.07 | yes |
| 16 | 45.47 | 22.09 | 28.06 | 99.7 | 91.0 | C2H6 | 79.4 ± 0.8 | 75.2 ± 0.8 | 2.2 | 2.1 | 0.66 ± 0.08 | 0.65 ± 0.08 | yes |
| 17 | 33.51 | 17.01 | 22.69 | 95.2 | 92.6 | C2H6 | 78.7 ± 0.5 | 73.5 ± 0.5 | 2.4 | 2.3 | 0.69 ± 0.08 | 0.68 ± 0.08 | yes |
| 18 | 23.55 | 12.40 | 16.72 | 96.5 | 94.9 | C2H6 | 78.1 ± 1.0 | 72.5 ± 0.9 | 2.6 | 2.5 | 0.71 ± 0.07 | 0.71 ± 0.07 | yes |
| 19 | 45.47 | 28.06 | 33.61 | 100.0 | 91.1 | C2H6 | 75.2 ± 0.8 | 71.7 ± 0.8 | 2.1 | 2.1 | 0.65 ± 0.08 | 0.64 ± 0.08 | yes |
| 20 | 34.55 | 21.67 | 27.45 | 95.8 | 91.4 | C2H6 | 74.9 ± 1.1 | 70.2 ± 1.1 | 2.3 | 2.3 | 0.68 ± 0.08 | 0.67 ± 0.08 | yes |
| 21 | 45.47 | 33.61 | 39.84 | 100.0 | 90.7 | C2H6 | 71.7 ± 0.8 | 68.2 ± 0.9 | 2.1 | 2.0 | 0.64 ± 0.08 | 0.63 ± 0.08 | yes |
| 22 | 34.55 | 27.45 | 36.79 | 95.9 | 91.4 | C2H6 | 70.2 ± 1.1 | 63.8 ± 1.2 | 2.3 | 2.2 | 0.67 ± 0.08 | 0.66 ± 0.08 | yes |
| 23 | 33.51 | 29.87 | 48.30 | 96.2 | 93.3 | C2H6 | 67.8 ± 0.5 | 56.5 ± 0.5 | 2.3 | 2.1 | 0.67 ± 0.08 | 0.64 ± 0.08 | yes |
| 24 | 23.55 | 21.18 | 27.24 | 97.2 | 95.2 | C2H6 | 67.6 ± 1.0 | 61.8 ± 0.9 | 2.5 | 2.4 | 0.70 ± 0.07 | 0.69 ± 0.07 | yes |
| 25 | 34.55 | 36.79 | 45.18 | 96.0 | 91.5 | C2H6 | 63.8 ± 1.2 | 58.9 ±1.1 | 2.2 | 2.1 | 0.66 ± 0.08 | 0.65 ± 0.08 | yes |
| 26 | 23.55 | 27.24 | 35.48 | 97.6 | 95.7 | C2H6 | 61.8 ± 0.9 | 55.4 ± 0.9 | 2.4 | 2.4 | 0.69 ± 0.07 | 0.68 ± 0.08 | yes |
| 27 | 34.55 | 45.18 | 56.36 | 96.4 | 92.4 | C2H6 | 58.9 ± 1.1 | 53.5 ± 1.1 | 2.1 | 2.0 | 0.65 ± 0.08 | 0.63 ± 0.08 | yes |
| 28 | 23.55 | 35.48 | 45.23 | 98.2 | 96.4 | C2H6 | 55.4 ± 0.9 | 49.4 ± 0.8 | 2.4 | 2.3 | 0.68 ± 0.08 | 0.67 ± 0.08 | yes |
| 29 | 34.55 | 56.36 | 68.03 | 96.8 | 92.2 | C2H6 | 53.5 ± 1.1 | 48.8 ±1.1 | 2.0 | 1.9 | 0.63 ± 0.08 | 0.61 ± 0.09 | yes |
| 30 | 45.47 | 76.33 | 86.46 | 97.5 | 91.5 | C2H6 | 52.8 ± 0.9 | 49.7 ± 0.9 | 1.7 | 1.6 | 0.58 ± 0.09 | 0.56 ± 0.1 | yes |
| 31 | 34.55 | 68.03 | 78.87 | 99.2 | 95.2 | C2H6 | 48.8 ± 1.1 | 45.1 ± 1.1 | 1.9 | 1.8 | 0.61 ± 0.09 | 0.60 ± 0.09 | yes |
| 32 | 45.47 | 86.46 | 101.83 | 97.0 | 91.3 | C2H6 | 49.7 ± 0.9 | 45.6 ± 0.9 | 1.6 | 1.5 | 0.56 ± 0.1 | 0.54 ± 0.1 | yes |
| 33 | 45.47 | 101.83 | 114.40 | 96.4 | 91.3 | C2H6 | 45.6 ± 0.9 | 42.7 ± 0.8 | 1.5 | 1.4 | 0.54 ± 0.1 | 0.52 ± 0.11 | yes |
| 34 | 23.55 | 55.21 | 67.05 | 98.8 | 98.0 | C2H6 | 44.4 ± 0.7 | 39.7 ± 0.7 | 2.2 | 2.1 | 0.65 ± 0.08 | 0.64 ± 0.08 | yes |
| 35 | 45.47 | 114.40 | 129.09 | 98.9 | 91.9 | C2H6 | 42.7 ± 0.8 | 39.8 ± 0.8 | 1.4 | 1.2 | 0.52 ± 0.11 | 0.49 ± 0.11 | yes |
| 36 | 33.51 | 126.06 | 170.10 | 97.6 | 97.3 | C2H6 | 33.4 ± 0.3 | 27.0 ± 0.3 | 1.4 | 1.0 | 0.52 ± 0.1 | 0.44 ± 0.13 | yes |
Measured experimentally.
Calculated.
Figure 2.
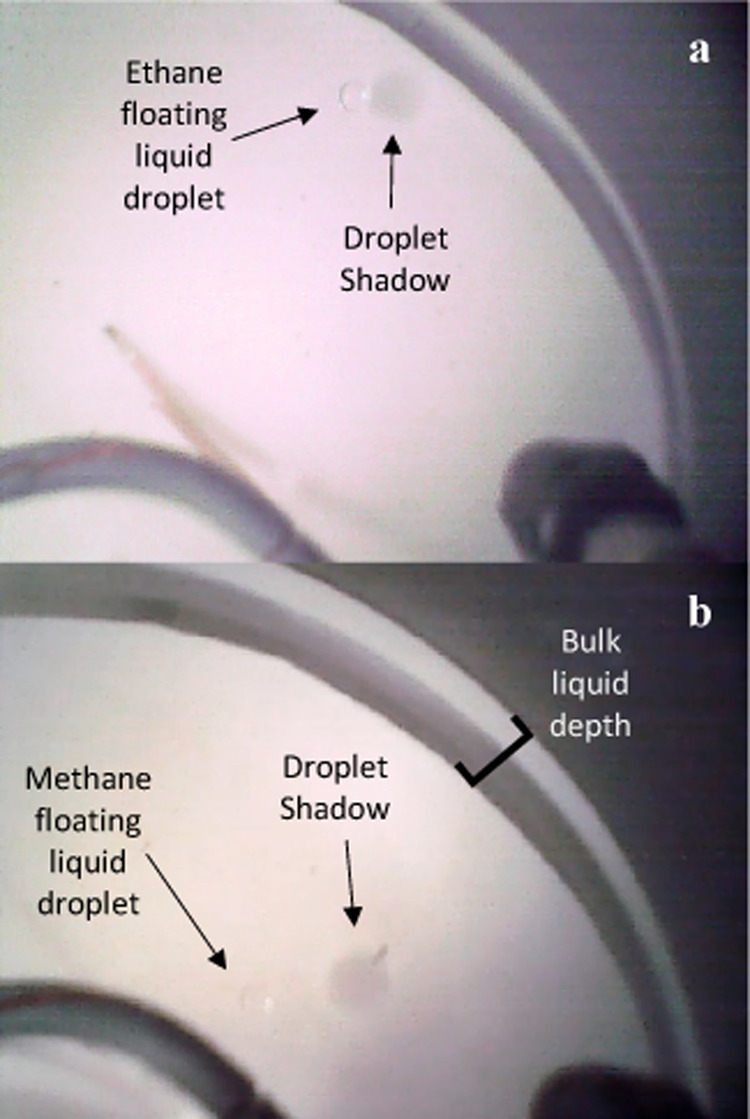
Plan view images of floating liquid droplets. (a) A floating liquid droplet of ethane on a bulk liquid with a composition of 79–84 mol % methane–alkane ratio. (b) A floating liquid droplet of methane with a bulk liquid composition of ∼95 mol % methane–alkane ratio.
Initial floating liquid droplets of ethane appeared on the surface with a diameter of 6 ± 0.5 mm. Ethane droplets often merged, with one to two droplets forming larger droplets with diameters of ∼7 and ∼9 mm, respectively (Figure 3). The diameters are consistent with the merging of droplets that have nearly constant volumes (∼110 mm3). At a bulk liquid composition of >85 mol % methane–alkane ratio, ethane droplets merged immediately after encountering another droplet, while droplets observed between 68 and 79 mol % methane–alkane ratio conglomerated before slowly merging over nearly a minute (Figure 4). In all scenarios, merged droplets coalesced with the bulk liquid when they reached a diameter >9 mm. We find that at a bulk liquid composition of ∼95 mol % methane–alkane ratio (the only composition where both ethane and methane droplets formed; Table 1 #2; Table 2 #30, respectively), ethane droplets had an average residence time of 25.7 s, with the majority of droplets lasting <10 s, and multiple droplets persisting longer than 1–3 min.
Figure 3.

Plan view images of pure ethane liquid droplets floating in a bulk liquid with a composition of ∼95 mol % methane–alkane ratio. Here, two floating liquid ethane droplets coalesce to form a larger daughter droplet. (a) t = 0 s, two ethane droplets are floating on the surface of the bulk liquid. (b) t = 0.13 s, the two droplets are beginning to coalesce. (c) t = 0.23 s, the two ethane droplets have coalesced to form a larger daughter droplet. Notice the ripple in the bulk liquid caused by the droplets merging. The dark object on the left (part of the condenser) and the line at the bottom of the image (atmosphere thermocouple) are located above the liquid surface. The liquid sample thermocouple is out of view. The white color is the bottom of the sample dish.
Figure 4.

Plan view images of pure ethane liquid droplets floating in a bulk liquid with a composition of 68–72 mol % methane–alkane ratio. Here, multiple floating liquid ethane droplets conglomerate before coalescing to form a larger daughter droplet. (a) t = 0 s, multiple ethane droplets are stuck together and floating on the surface of the bulk liquid. (b) t = 40 s, the floating liquid droplets have transferred liquid to form one larger droplet and multiple smaller droplets. (c) t = 41 s, the ethane droplets have coalesced to form a single larger daughter droplet. The blue object on the bottom left corner (part of the condenser) and the black object in the left corner (FTIR probe) are located above the liquid surface, while the yellow line near the bottom is a thermocouple submerged in the bulk liquid sample. The white partial circle is the bottom of the sample dish. Notice the shadow from the floating liquid droplet on the bottom of the sample dish.
Table 2. Experimental Overview: Methane Droplets Observed and Not Observeda.
| observation number | mass (g)b | temperature (K)b | composition (mol% methane–alkane ratio) | drop height (cm)c | impact velocity (m/s)c | droplets observed | |||||||
|---|---|---|---|---|---|---|---|---|---|---|---|---|---|
| original ethane mass | start pour methane | end pour methane | droplet | bulk liquid | dropletb | bulk liquid pour rangec | start pour | end pour | start pour | end pour | |||
| ±0.20 | ±0.20 | ±0.20 | ±0.4 | ±0.4 | start pour | end pour | ±0.5 | ±0.5 | |||||
| 1 | 83.87 | 0.00 | 1.87 | 98.6 | 94.4 | CH4 | 0 ± 0 | 4.0 ± 0.4 | 2.2 | 2.2 | 0.66 ± 0.08 | 0.66 ± 0.08 | no |
| 2 | 36.99 | 0.00 | 1.67 | 100.1 | 95.5 | CH4 | 0 ± 0 | 7.8 ± 1 | 2.7 | 2.6 | 0.72 ± 0.07 | 0.72 ± 0.07 | no |
| 3 | 21.47 | 0.00 | 1.79 | 104.4 | 92.5 | CH4 | 0 ± 0 | 13.5 ± 1.5 | 2.8 | 2.8 | 0.74 ± 0.07 | 0.74 ± 0.07 | no |
| 4 | 30.24 | 0.00 | 4.02 | 103.7 | 93.5 | CH4 | 0 ± 0 | 20.0 ± 0.9 | 2.7 | 2.7 | 0.73 ± 0.07 | 0.72 ± 0.07 | no |
| 5 | 28.41 | 0.00 | 6.40 | 100.9 | 94.1 | CH4 | 0 ± 0 | 29.7 ± 0.8 | 2.7 | 2.7 | 0.73 ± 0.07 | 0.72 ± 0.07 | no |
| 6 | 38.44 | 0.00 | 14.89 | 94.8 | 93.2 | CH4 | 0 ± 0 | 42.1 ± 0.5 | 2.7 | 2.5 | 0.72 ± 0.07 | 0.70 ± 0.07 | no |
| 7 | 34.93 | 0.00 | 14.50 | 100.3 | 95.0 | CH4 | 0 ± 0 | 43.8 ± 0.6 | 2.7 | 2.5 | 0.73 ± 0.07 | 0.70 ± 0.07 | no |
| 8 | 10.52 | 0.00 | 10.52 | 102.4 | 91.6 | CH4 | 0 ± 0 | 69.2 ± 0.8 | 2.9 | 2.8 | 0.76 ± 0.07 | 0.74 ± 0.07 | no |
| 9 | 83.87 | 1.87 | 2.22 | 97.6 | 94.6 | CH4 | 4.0 ± 0.4 | 4.7 ± 0.6 | 2.2 | 2.2 | 0.66 ± 0.08 | 0.66 ± 0.08 | no |
| 10 | 83.87 | 2.22 | 4.00 | 97.7 | 94.4 | CH4 | 4.7 ± 0.6 | 8.2 ± 0.6 | 2.2 | 2.2 | 0.66 ± 0.08 | 0.65 ± 0.08 | no |
| 11 | 36.99 | 1.67 | 11.83 | 100.1 | 95.5 | CH4 | 7.8 ± 1.0 | 37.5 ± 0.6 | 2.6 | 2.5 | 0.72 ± 0.07 | 0.70 ± 0.07 | no |
| 12 | 21.47 | 1.79 | 3.60 | 104.4 | 92.5 | CH4 | 13.5 ± 1.5 | 23.9 ± 1.7 | 2.8 | 2.8 | 0.74 ± 0.07 | 0.74 ± 0.07 | no |
| 13 | 30.24 | 4.02 | 5.73 | 103.7 | 93.5 | CH4 | 20.0 ± 0.9 | 26.2 ± 1.1 | 2.7 | 2.7 | 0.72 ± 0.07 | 0.72 ± 0.07 | no |
| 14 | 21.47 | 3.60 | 5.41 | 104.4 | 92.5 | CH4 | 23.9 ± 1.7 | 32.1 ± 1.7 | 2.8 | 2.7 | 0.74 ± 0.07 | 0.73 ± 0.07 | no |
| 15 | 30.24 | 5.73 | 6.97 | 98.0 | 92.3 | CH4 | 26.2 ± 1.1 | 30.2 ± 1.1 | 2.7 | 2.6 | 0.72 ± 0.07 | 0.72 ± 0.07 | no |
| 16 | 28.41 | 6.40 | 8.35 | 100.9 | 94.1 | CH4 | 29.7 ± 0.8 | 35.5 ± 0.9 | 2.7 | 2.6 | 0.72 ± 0.07 | 0.72 ± 0.07 | no |
| 17 | 21.47 | 5.41 | 5.78 | 104.4 | 92.5 | CH4 | 32.1 ± 1.7 | 33.5 ± 1.8 | 2.7 | 2.7 | 0.73 ± 0.07 | 0.73 ± 0.07 | no |
| 18 | 21.47 | 5.78 | 6.07 | 104.4 | 92.5 | CH4 | 33.5 ± 1.8 | 34.6 ± 1.8 | 2.7 | 2.7 | 0.73 ± 0.07 | 0.73 ± 0.07 | no |
| 19 | 28.41 | 8.35 | 10.05 | 98.4 | 93.6 | CH4 | 35.5 ± 0.9 | 39.9 ± 1.0 | 2.6 | 2.6 | 0.72 ± 0.07 | 0.72 ± 0.07 | no |
| 20 | 36.99 | 11.83 | 12.42 | 100.1 | 95.5 | CH4 | 37.5 ± 0.6 | 38.6 ± 0.9 | 2.5 | 2.5 | 0.70 ± 0.07 | 0.70 ± 0.07 | no |
| 21 | 36.99 | 12.42 | 14.24 | 93.9 | 93.9 | CH4 | 38.6 ± 0.9 | 41.9 ± 0.8 | 2.5 | 2.5 | 0.70 ± 0.07 | 0.70 ± 0.07 | no |
| 22 | 38.44 | 14.89 | 15.78 | 94.8 | 93.2 | CH4 | 42.1 ± 0.5 | 43.5 ± 0.6 | 2.5 | 2.4 | 0.69 ± 0.07 | 0.69 ± 0.07 | no |
| 23 | 38.44 | 15.78 | 16.45 | 94.8 | 93.2 | CH4 | 43.5 ± 0.6 | 44.5 ± 0.7 | 2.4 | 2.4 | 0.69 ± 0.07 | 0.69 ± 0.08 | no |
| 24 | 34.93 | 14.50 | 15.64 | 94.3 | 93.2 | CH4 | 43.8 ± 0.6 | 45.6 ± 0.8 | 2.5 | 2.5 | 0.70 ± 0.07 | 0.70 ± 0.07 | no |
| 25 | 38.44 | 16.45 | 20.04 | 92.3 | 92.6 | CH4 | 44.5 ± 0.7 | 49.4 ± 0.6 | 2.4 | 2.4 | 0.69 ±0.07 | 0.68 ± 0.08 | no |
| 26 | 10.52 | 10.52 | 21.34 | 99.8 | 92.1 | CH4 | 69.2 ± 0.8 | 79.2 ± 0.5 | 2.8 | 2.6 | 0.74 ± 0.07 | 0.72 ± 0.07 | no |
| 27 | 10.99 | 30.60 | 57.45 | 97.0 | 91.6 | CH4 | 83.9 ± 1.4 | 90.7 ± 0.2 | 2.5 | 2.1 | 0.70 ± 0.07 | 0.65 ± 0.08 | no |
| 28 | 10.99 | 57.45 | 81.30 | 95.8 | 91.6 | CH4 | 90.7 ± 0.2 | 93.3 ± 0.1 | 2.1 | 1.8 | 0.65 ± 0.08 | 0.59 ± 0.09 | no |
| 29 | 10.99 | 81.30 | 107.05 | 97.7 | 92.0 | CH4 | 93.3 ± 0.1 | 94.8 ± 0.1 | 1.8 | 1.5 | 0.59 ± 0.09 | 0.54 ± 0.10 | no |
| 30 | 10.99 | 107.05 | 122.46 | 101.0 | 90.2 | CH4 | 94.8 ± 0.1 | 95.4 ± 0.1 | 1.5 | 1.3 | 0.54 ± 0.10 | 0.50 ± 0.11 | yes |
Bold text: floating liquid droplets were observed. Regular text: floating liquid droplets were not observed.
Measured experimentally.
Calculated.
3.2. Methane Floating Liquid Droplet Observations
Methane droplets were observed in one bulk liquid compositional range: 94–96 mol % methane–alkane ratio (Figure 2b; Table 2; Movie S2, S3). Below a bulk liquid methane–alkane ratio of 94 mol %, floating liquid methane droplets were not observed, and compositions above were not tested due to the large volume of liquid necessary to increase the bulk liquid composition by 1 mol % (>15 g of methane) and limitations in sample dish size. Methane liquid droplets were not observed in bulk liquids with a composition of 100 mol % methane–alkane ratio and did not form during every sample drop when they were present.
Initial droplets of methane observed on the surface had approximately the same diameter as ethane droplets (6 ± 0.5 mm). Methane droplets were observed ricocheting off each other and off the side of the sample dish. We find that at ∼95 mol % methane–alkane ratio (the only composition where methane droplets formed; Table 2 #30), methane droplets had an average residence time of 1.9 s, with the longest droplet lasting 5.5 s.
3.3. Floating Liquid Droplets and Nitrogen Bubbles
Nitrogen exsolution events resulting in bubbles occur during ethane experiments when the bulk liquid has a methane–alkane ratio of 40–95 mol % (Figure 5). This titration-induced exsolution phenomenon is observed and described thoroughly in Farnsworth et al.40 Even though nitrogen bubbles and floating liquid droplets are similar in size, they alter the refraction of light through the liquid column differently. Thus, we observe a shadow and collimated reflection on the bottom of the sample dish with floating liquid droplets that we do not observe with nitrogen bubbles (Figure 5). Moreover, floating liquid droplets act as a “liquid lens” on the surface.15 Because we observe the repulsion of gaseous bubbles at the liquid surface by the liquid droplets (Figure 5), it is likely that floating liquid droplets are non-wetting and create a concave deformation, similar to oil droplets on water.15
Figure 5.

Plan view images of ethane floating liquid droplets and nitrogen bubbles. (a) Image obtained during a nitrogen exsolution event (described in ref (40)) illustrating the visual difference between floating liquid droplets and nitrogen bubbles. (b) Same image as (a), with labels for reference. (c) Image of ethane floating liquid daughter droplet (merged larger droplet). (d) Same droplet as (c) with the interior chamber light off. The endoscope light (blue) reflects off the floating liquid droplet (inner ring) and illustrates how the droplet alters the liquid surface (outer ring).
Bubble exsolution events are not observed in methane experiments; however, a few nitrogen bubbles did persist periodically on the bulk liquid surface. In one instance, a methane liquid droplet ricocheted off a nitrogen bubble (Movie S3). While the bubble popped a moment later, the liquid droplet did not immediately coalesce.
3.4. Drop Height and Impact Velocity
Our experimental setup is stationary, and therefore, the drop height decreases gradually as the liquid sample increases. We estimate the progression of the drop height over the course of the experiment by calculating the height of the bulk liquid at each compositional range tested based on the liquid volume. We assume an ideal mixture and use the recorded mass of the sample, density of methane (439 kg/m3) and ethane (652 kg/m3), and the sample surface area (0.0169 m2), to calculate the liquid sample depth for each experiment and subtract it from the original drop height (3 cm). We find that the initial liquid depth begins between 0.1 and 1.0 cm and increases to 0.3–2.0 cm as the experiment progresses, leading to a drop height of 1.0–2.9 cm over all experiments (see the Supporting Information for uncertainty discussion). Table 1 reports the drop height for each sample addition.
Next, we calculate the velocity on impact (Vimpact) as
| 2 |
where g is Earth’s gravity and h is the drop height. Table 1 reports the impact velocity for each sample addition. Figure 6 illustrates the velocity on impact as a function of bulk liquid composition for ethane (Figure 6a) and methane (Figure 6b) experiments. Figure 6 shows a cluster of compositional ranges (i.e., horizontal bars) representing sample pours when droplets were observed (black) and were not observed (red). Data points illustrate the beginning and end of each sample pour. Ethane and methane droplet experiments have a similar impact velocity range: 0.44–0.72 and 0.50–0.74 m/s, respectively. We find that ethane droplets form at nearly all bulk liquid compositions and impact velocities tested in this study. Methane, on the other hand, forms floating liquid droplets when the impact velocity is at its lowest (<0.55 m/s), and the liquid is most methane-rich. Therefore, it is unclear if the impact velocity or bulk liquid composition is the driving factor behind methane droplet formation.
Figure 6.

Illustrates the impact velocity of the droplet as a function of the bulk liquid composition. Solid points representthe calculated composition at the start and end of each sample pour, while horizontal lines represent the evolution of the bulk liquid over the duration of the sample pour. (a) Ethane floating liquid droplet experiment overview. This plot illustrates the bulk liquid compositional range where floating liquid droplets of ethane were observed. Ethane droplet experiments began with 100 mol % methane in the bulk liquid (100 mol % methane–alkane ratio) and then increased in ethane concentration as the experiment progressed (proceeding from the right to left of the plot). We find that ethane droplets are observed in nearly all bulk liquid compositional ranges tested. (b) Methane floating liquid droplet experiment overview. Floating liquid droplets were observed in the bulk liquid compositional range/impact velocities associated with black data points, and samples that immediately coalesced are red in color. Methane droplet experiments began with 100 mol % ethane in the bulk liquid (0 mol % methane–alkane ratio) and then increased in methane concentration as the experiment progressed (proceeding from the left to right of the plot). We find that floating liquid droplets of methane did not easily form, with an occurrence between 94.8 and 95.4 mol % methane–alkane ratio, and an impact velocity <0.55 m/s. The y-axis has a systematic error from the uncertainty in the original distance from the condenser opening to the bottom of the sample dish, while the x-axis is a random error. The uncertainty discussion can be found in the Supporting Information.
4. Discussion
4.1. Hypotheses for Droplet Formation
Previous studies have investigated the formation of floating liquid droplets in various liquids under Earth ambient temperature and pressure. Many of these studies focus on the physical properties and mechanisms behind partial coalescence vs total coalescence;4,11,12 in this study however, we are only interested in the conditions that produce primary floating liquid droplets that result in full coalescence (seen here) and the conditions that never form floating liquid droplets. Therefore, herein, we only discuss these relevant studies on gas–liquid interfaces.
Various studies have hypothesized that droplet formation is influenced by the physical properties of the liquids, such as surface tension, density, and viscosity.3−7 Interestingly, liquid ethane is denser than both methane and nitrogen-saturated methane–ethane liquid mixtures above 84 K.41 Therefore, the occurrence of a denser ethane droplet floating on a pool of less-dense methane–ethane–nitrogen is counterintuitive. Likewise, one would expect less-dense methane to float, but almost invariably it does not. Therefore, floating liquid droplet formation is independent of the liquid density in our experiments.
Alternative hypotheses suggest that floating liquid droplets form if the bulk liquid has a higher surface tension than the droplet (as in liquid carbon tetrachloride/chloroform6). Additionally, Seth et al.5 and Jeffreys and Davis7 suggest that a bulk liquid that is more viscous than the droplet increases the stability and residence time of the droplet (in fats, oils, and boy’s soap solution). We use TITANPOOL (see ref (41)) to compute the liquid properties of methane and ethane under Titan surface conditions and observe an opposite behavior in our experiments. Liquid ethane has a surface tension value twice that of liquid methane (∼33 and ∼16 mN/m, respectively; at 95 and 92 K;42−44 TITANPOOL41) and a dynamic viscosity value an order of magnitude higher than that of liquid methane (1 × 10⁻³ Pa·s and 2 × 10⁻⁴ Pa·s, respectively, at 92 K; TITANPOOL41). Moreover, the addition of dissolved nitrogen at Titan temperatures does not significantly affect the surface tension (<2 mN/m) or viscosity (<15% difference in value) of the liquids (at 92 K; TITANPOOL41). Thus, the conclusions proposed by Hazlehurst and Neville,6 Seth et al.,5 and Jeffreys and Davis,7 regarding surface tension and viscosity, do not appear to apply to liquid methane and ethane.
Hazlehurst and Neville6 additionally conclude that above a specific impact velocity (reported as a “critical height” of the experiment, with values ranging from 0.4 to 2 cm), droplets immediately coalesced with the bulk liquid and floating liquid droplets ceased (Vimpact = 0.3–0.6 m/s). The critical height varried depending on the liquid species tested. When the impact velocity is too high, it is likely that the molecular cohesion forces cannot support liquid droplet formation and could be directly related to the physical properties of the liquid (discussed previously). Over the course of our experiments, droplets should become increasingly easier to produce because of the lowering impact velocity. Ethane droplets tend to form at all compositions and impact velocities tested in this study. The occurrence of methane droplets, on the other hand, might be directly related to the lower impact velocity. Thus, it is possible that methane droplets may form more easily at lower drop heights.
Hazlehurst and Neville6 also proposed that the molecular structure may play a role in liquid droplet formation and suggest that the lateral adhesion of the molecules is a resistance that prevents two adjacent molecules from being pulled apart. For hydrocarbons, this force is proportional to the length of the chain, and thus longer-chain hydrocarbons are more likely to form floating liquid droplets. This may explain why ethane forms droplets more easily than methane in our experiments.
Geri et al.14 found that droplets made with various types of silicone oil had longer residence times as the temperature difference between the droplet and bulk liquid increased. Geri et al.14 focused on temperature deltas of 0.2–20 K, while our experiments had a temperature delta of ≤12 K. Since the temperature delta is nearly identical between liquid methane and ethane in our experiments, we do not attribute floating liquid droplet formation or lack thereof between the two species, to a delta in temperature. It is possible, however, that methane and ethane droplets may persist on the bulk liquid surface for longer timescales, if the delta in temperature is greater.
Alternatively, we propose that dissolved atmospheric nitrogen may play a role in ethane droplet formation. A unique characteristic of our sample is that atmospheric nitrogen easily dissolves into liquid methane, but has an aversion for liquid ethane.33,45,46 Experimental studies conducted under Titan surface conditions suggest that the difference of dissolved nitrogen between these two species at 91 K is ∼15 mol %.45,46 This difference in nitrogen solubility may repel liquid ethane from the nitrogen-rich methane-dominated bulk liquid, hindering ethane droplets from immediately coalescing. As the bulk liquid becomes more ethane-rich, the solubility of nitrogen decreases rapidly, until droplets cease. This also may explain why droplets do not appear at the beginning of some experiments, as the bulk liquid may not be completely saturated in nitrogen until later in the experiment, or the bulk liquid depth may not be sufficient to prevent the droplets from hitting the bottom of the sample dish (Figure 6). Likewise, droplets tend to cease during nitrogen exsolution events, potentially due to the turbulent liquid surface (layer of bubbles present) or to the lack of dissolved nitrogen to successfully repel the ethane droplet. Thus, we suggest that nitrogen solubility is likely the main factor for ethane droplet formation. Meanwhile, methane droplets require more specific circumstances (including lower impact velocities) for formation because methane is easily miscible with both ethane and nitrogen.
4.2. Implications for Titan
4.2.1. Impact Velocity on Titan and Nitrogen Dissolution During Rainfall
To understand the relationship between Titan raindrop radii and their velocity on impact, we calculate the terminal velocity of an ethane and methane raindrop on Titan. The terminal velocity (Vt) can be calculated as
| 3 |
where m is the mass of the droplet, g is Titan's gravity (1.352 m/s2), ρ is the density of nitrogen at 94 K (5.6 kg/m3; temperature measured by the Huygens probe18), A is the cross-sectional area of the droplet, and Cd is the drag coefficient of an oblate spheroid (0.5). The density of methane and ethane with and without dissolved atmospheric nitrogen is acquired from Steckloff et al.41 under Titan conditions at 92 K. We assume the droplet falls from a height that reaches terminal velocity (8 km21), and the droplet is pure methane or ethane on impact.
Figure 7 illustrates the terminal velocity of a rain droplet on Titan as a function of droplet radius. We know, from our experiments, that floating liquid droplets occur when the droplet has a radius of 3 mm and an impact velocity of 0.5–0.7 and 0.5 m/s for ethane and methane droplets, respectively. A 3 mm droplet on Titan, without dissolved nitrogen, correlates to a terminal velocity of ∼1.6 and ∼1.3 m/s for ethane and methane, respectively. Additionally, ethane droplets with a terminal velocity of 0.5–0.7 m/s have a radius of 0.3–0.6 mm and methane droplets with a terminal velocity of 0.5 m/s have a radius of 0.4 mm. Because a 3 mm radius droplet on Titan has a higher impact velocity than in our experiments, the impact velocity is the limiting factor when comparing our experiments to raindrops on Titan. Therefore, for a droplet to form on Titan’s methane-rich lakes and seas, an ethane droplet must reach Titan’s surface with a radius of ≤0.6 mm, while methane droplets must be smaller, at ≤0.4 mm. The size and velocity on impact calculated here fall into the predicted range for raindrops on Titan (0.2–3.3 mm radius, 0.24–1.5 m/s).21
Figure 7.

Terminal velocity as a function of raindrop radius on Titan for an ethane droplet (with and without dissolved nitrogen, orange), a pure methane droplet (green), and a methane droplet saturated in atmospheric nitrogen (blue). The impact velocity in our experiments is highlighted by the dashed orange (0.7 m/s for ethane) and blue/green (0.5 m/s for methane) lines.
We acknowledge that atmospheric nitrogen will likely dissolve into the liquid raindrop during rainfall.33,45,46 Moreover, nitrogen saturation is likely reached due to the long decent time of 77 and 361 min for a methane droplet with a radius of 3.3 and 0.2 mm, respectively.21 This decent time is longer than the nitrogen saturation time frame for liquid methane and ethane measured in Titan-relevant experimental studies.45,46 If Titan’s raindrops are indeed saturated in nitrogen, the droplet’s density and impact velocity may be affected. For ethane rain, nitrogen dissolution does not significantly affect the impact velocity (<1% of value) because atmospheric nitrogen does not have an affinity for liquid ethane (<3 mol % dissolved at 90 K45). Methane, on the other hand, could dissolve up to 20 mol % nitrogen, or more depending on the raindrop temperature during decent.41,45 The terminal velocity for a methane droplet with dissolved nitrogen is also included in Figure 7. The impact velocity increases by ∼7% for a methane droplet with dissolved nitrogen compared to the same size droplet without nitrogen. Nonetheless, the addition of dissolved nitrogen into a methane droplet with an impact velocity of 0.5 m/s does not significantly affect the predicted impact droplet size (<0.1 mm change in radius). The difference in radius becomes more pronounced (>0.1 mm) when the droplet is >4 mm in radius.
4.2.2. Titan’s Lakes and Seas
Studies utilizing Cassini RADAR have estimated the compositions of six liquid bodies on Titan: five in the north polar region (Punga Mare, Baffin Sinus, Ligeia Mare, Moray Sinus, and Winnipeg Lacus), and one in the south polar region (Ontario Lacus).35−38,47 Their most likely compositions with error are: 100 (100–92), 100 (100–92), 89 (98–77), 86 (96–77), 85 (100–66), and 70 (100–37) mol % methane–alkane ratio, respectively.35−38 Given these compositions, floating liquid droplets will form in all four of Titan’s liquid bodies during ethane rainfall under present-day Titan conditions. Methane rainfall, alternatively, is most likely to produce floating liquid droplets in Punga Mare and Baffin Sinus depending on the exact composition of the liquid bodies and if the droplets have an impact velocity of ≤0.5 m/s.
The presence of floating ethane liquid droplets should alter lake mixing. If rain first collects on the surface as noncoalescing liquid droplets, the lake will be much more likely to form a stratified layer with a higher concentration of the rainfall liquid at the surface. If methane droplets form on the surface, the lake may remain unaffected, as nitrogen will dissolve into methane and diffuse into the bulk liquid. On the other hand, the presence of liquid ethane droplets may result in an unstable ethane-rich surface layer. Previous studies speculate methane evaporation and/or cooler temperatures (<83 K) will create such a stratified ethane-rich surface layer,40,41 ultimately causing lake overturn and bubble formation.40,48−52 Floating liquid ethane droplets after an ethane rain event may exacerbate these processes.
Additionally, Titan aerosols and frozen ethane are hypothesized to act as nucleation sites for Titan rainfall.21,53,54 While solid ethane may melt and mix with the droplet during decent,21 aerosols should sink to the bottom of the lakes along with denser ethane raindrops.54 If the aerosol seed stays within the floating liquid droplet, however, there would be a greater number of aerosols near the lake surface after rainfall. An abundance of aerosols on the lake surface may increase the turbidity of the lakes and intensify light scattering from the surface. It may also aid in wave dampening, as previous work55 suggests that an aerosol film layer may dampen waves, possibly explaining the smoothness of Titan’s liquid bodies.
5. Conclusions
We conducted a set of experiments that simulated methane and ethane rainfall onto methane–ethane–nitrogen liquids at and above Titan-relevant surface conditions (89–105 K; 1.5 bar pressure). This is the first experimental study aimed at understanding the behavior of the methane–ethane–nitrogen ternary system at the interface of a raindrop and surface liquids on Titan, and is the first study to investigate floating liquid droplets in cryogenic, hydrocarbon, liquids. We observe floating liquid droplets of ethane and methane at bulk liquid compositions between 27–100 and 94–96 mol % methane–alkane ratio, respectively. We hypothesize that dissolved atmospheric nitrogen in the bulk liquid repels ethane droplets at the surface, thus favoring floating ethane droplets over floating methane droplets.
Ethane droplets will likely persist on the surface of Titan’s methane-rich liquid bodies with an impact velocity less than or equal to our experiments, (0.5–0.7 m/s), which correlates to a Titan raindrop radius on impact of ≤0.6 mm. Methane droplets, on the other hand, are much less likely to form on Titan. If floating ethane droplets indeed occur in Titan’s methane-rich lakes and seas and the droplets do not puncture the liquid surface, this would lead to a denser, more ethane-rich, surface layer and the raindrop nucleation seed (i.e., aerosol) may remain suspended on the liquid surface for longer timescales.
Acknowledgments
The majority of the work, including experiments conducted at the University of Arkansas, was funded by the NASA Cassini Data Analysis Program (CDAP) grant #NNX15AL48G. Writing and editing performed by K.K.F. was supported by an appointment to the NASA Postdoctoral Program at NASA Goddard Space Flight Center, administered by Oak Ridge Associated Universities under contract with NASA. Coauthor A.S. was funded by CDAP grant #80NSSC18K0967. The authors thank Walter Graupner Jr., Dr. Ellen Czaplinski, Dr. Katherine Dzurilla, and Dr. Kevin Lyon for their help and support with the Titan Surface Simulation Chamber.
Data Availability Statement
The data underlying this study are available in the published article and the Supporting Information.
Supporting Information Available
The Supporting Information is available free of charge at https://pubs.acs.org/doi/10.1021/acsearthspacechem.2c00311.
Additional methods, instrument calibration, uncertainty discussion, tables, figures, and movie captions (PDF)
Movie S1: floating liquid ethane droplets in real time (MP4)
Movie S2: floating liquid methane droplets in real time (MP4)
Movie S3: floating liquid methane droplets in real time. A droplet is observed ricocheting off of a nitrogen bubble (MP4)
The authors declare no competing financial interest.
Supplementary Material
References
- Rayleigh L. On the Stability, or Instability, of certain Fluid Motions. Proc. London Math. Soc. 1879, s1–11, 57–72. 10.1112/plms/s1-11.1.57. [DOI] [Google Scholar]
- Reynolds O.On the floating of drops on the surface of water depending only on the purity of the surface’ Manchester Literary and Philosophical Society, Proceedings 1881; Vol. 21.
- Khan & Garnier . Mechanism of Non-Coalescence for Liquid Droplets at the Air-Liquid Interface. InConference: Chemeca 2007, Melbourne, Australia, 2007.
- Kavehpour H. P. Coalescence of Drops. Annu. Rev. Fluid Mech. 2015, 47, 245–268. 10.1146/annurev-fluid-010814-014720. [DOI] [Google Scholar]
- Seth J. B.; Anand C.; Das Mahajan L. XXVII Liquid drops on the same liquid surface. London, Edinburgh, Dublin Philos. Mag., J. Sci. 1929, 7 (42), 247–253. 10.1080/14786440208564736. [DOI] [Google Scholar]
- Hazlehurst T. H.; Neville H. A. Liquid drops on liquid surfaces. J. Phys. Chem. A 1937, 41, 1205–1214. 10.1021/j150387a006. [DOI] [Google Scholar]
- Jeffreys G. V.; Davis G. A.. Coalescence of Liquid Droplets and Liquid Dispersion. In Recent Advances in Liquid-liquid Extraction; Pergamon Press: New York, NY: Oxford, New York, 1971; Chapter 14, pp 495–584. [Google Scholar]
- Amarouchene Y.; Cristobal G.; Kellay H. Noncoalescing Drops. Phys. Rev. Lett. 2001, 87, 206104 10.1103/PhysRevLett.87.206104. [DOI] [PubMed] [Google Scholar]
- Neitzel G. P.; Dell’Aversana P. Noncoalescence and nonwetting behavior of liquids. Annu. Rev. Fluid Mech. 2002, 34, 267–289. 10.1146/annurev.fluid.34.082701.154240. [DOI] [Google Scholar]
- Couder Y.; Fort E.; Gautier C. H.; et al. From bouncing to floating: noncoalescence of drops on a fluid bath. Phys. Rev. Lett. 2005, 94, 177801 10.1103/PhysRevLett.94.177801. [DOI] [PubMed] [Google Scholar]
- Blanchette F.; Bigioni T. P. Partial coalescence of drops at liquid interfaces. Nat. Phys. 2006, 2, 254–257. 10.1038/nphys268. [DOI] [Google Scholar]
- Klyuzhin I. S.; Ienna F.; Roeder B.; et al. Persisting Water Droplets on Water Surfaces. J. Phys. Chem. B 2010, 114, 14020–14027. 10.1021/jp106899k. [DOI] [PMC free article] [PubMed] [Google Scholar]
- Tran T.; Staat H. J. J.; Susarrey-Arce A.; et al. Droplet impact on superheated micro-structured surfaces. Soft Matter 2013, 9, 3272–3282. 10.1039/C3SM27643K. [DOI] [Google Scholar]
- Geri M.; Keshavarz B.; McKinley G. H.; et al. Thermal delay of drop coalescence. J. Fluid Mech. 2017, 833, R3 10.1017/jfm.2017.686. [DOI] [Google Scholar]
- Vinay T. V.; Varanakkottu S. N. Separation of floating oil drops based on drop-liquid substrate interfacial tension. Langmuir 2019, 35, 10596–10600. 10.1021/acs.langmuir.9b01829. [DOI] [PubMed] [Google Scholar]
- Cottini V.; Nixon C.; Jennings D.; et al. Spatial and temporal variations in Titan’s surface temperatures from Cassini CIRS observations. Planet. Space Sci. 2012, 60, 62–71. 10.1016/j.pss.2011.03.015. [DOI] [Google Scholar]
- Jennings D. E.; Flasar F. M.; Kunde V. G.; et al. Titan’s Surface Brightness Temperatures. Astrophys. J., Lett. 2009, 691, L103–L105. 10.1088/0004-637X/691/2/L103. [DOI] [Google Scholar]
- Fulchignoni M.; Ferri F.; Angrilli F.; et al. In situ measurements of the physical characteristics of Titan’s environment. Nature 2005, 438, 785–791. 10.1038/nature04314. [DOI] [PubMed] [Google Scholar]
- Niemann H. B.; Atreya S. K.; Bauer S. J.; et al. The abundances of constituents of Titan’s atmosphere from the GCMS instrument on the Huygens probe. Nature 2005, 438, 779–784. 10.1038/nature04122. [DOI] [PubMed] [Google Scholar]
- Lorenz R. D. The life, death and afterlife of a raindrop on Titan. Planet. Space Sci. 1993, 41, 647–655. 10.1016/0032-0633(93)90048-7. [DOI] [Google Scholar]
- Graves S. D. B.; McKay C.; Griffith C.; et al. Rain and hail can reach the surface of Titan. Planet. Space Sci. 2008, 56, 346–357. 10.1016/j.pss.2007.11.001. [DOI] [Google Scholar]
- Karkoschka E.; Tomasko M. G. Rain and dewdrops on titan based on in situ imaging. Icarus 2009, 199, 442–448. 10.1016/j.icarus.2008.09.020. [DOI] [Google Scholar]
- Turtle E. P.; Perry J. E.; McEwen A. S.; et al. Cassini imaging of Titan’s high-latitude lakes, clouds, and south-polar surface changes. Geophys. Res. Lett. 2009, 36, L02204 10.1029/2008GL036186. [DOI] [Google Scholar]
- Turtle E. P.; Perry J. E.; Hayes A. G.; et al. Rapid and Extensive Surface Changes Near Titan’s Equator: Evidence of April Showers. Science 2011, 331, 1414–1417. 10.1126/science.1201063. [DOI] [PubMed] [Google Scholar]
- Turtle E. P.; et al. Seasonal changes in Titan’s meteorology. Geophys. Res. Lett. 2011b, 2011, L03203 10.1029/2010GL046266. [DOI] [Google Scholar]
- Schneider T.; Graves S. D. B.; Schaller E. L.; et al. Polar methane accumulation and rainstorms on Titan from simulations of the methane cycle. Nature 2012, 481, 58–61. 10.1038/nature10666. [DOI] [PubMed] [Google Scholar]
- Barnes J. W.; Buratti B. J.; Turtle E. P.; et al. Precipitation-induced surface brightenings seen on Titan by Cassini VIMS and ISS. Planet. Sci. 2013, 2, 1 10.1186/2191-2521-2-1. [DOI] [Google Scholar]
- Dhingra R. D.; Barnes J. W.; Heslar M. F.; Brown R. H.; Buratti B. J.; Sotin C.; Jaumann R.; et al. Spatio-temporal Variation of Bright Ephemeral Features on Titan’s North Pole. Planet. Sci. J. 2020, 1, 31 10.3847/PSJ/ab9c2b. [DOI] [Google Scholar]
- Dhingra R. D.; Jennings D. E.; Barnes J. W.; Cottini V. Lower Surface Temperature at Bright Ephemeral Feature Site on Titan’s North Pole. Geophys. Res. Lett. 2021, 48, e2020GL091708 10.1029/2020GL091708. [DOI] [Google Scholar]
- Loftus K.; Wordsworth R. D. The Physics of Falling Raindrops in Diverse Planetary Atmospheres. J. Geophys. Res.: Planets 2021, 126, e2020JE006653 10.1029/2020JE006653. [DOI] [Google Scholar]
- Stofan E. R.; Elachi C.; Lunine J. I.; et al. The lakes of Titan. Nature 2007, 445, 61–64. 10.1038/nature05438. [DOI] [PubMed] [Google Scholar]
- Aharonson O.; Hayes A. G.; Lunine J. I.; Lorenz R. D.; Allison M. D.; Elachi C. An asymmetric distribution of lakes on Titan as a possible consequence of orbital forcing. Nat. Geosci. 2009, 2, 851–854. 10.1038/NGEO698. [DOI] [Google Scholar]
- Battino R.; Rettich T. R.; Tominaga T. The solubility of nitrogen and air in liquids. J. Phys. Chem. Ref. Data 1984, 13, 563 10.1063/1.555713. [DOI] [Google Scholar]
- Brown R. H.; Soderblom L. A.; Soderblom J. M.; et al. The identification of liquid ethane in Titan’s Ontario Lacus. Nature 2008, 454, 607–610. 10.1038/nature07100. [DOI] [PubMed] [Google Scholar]
- Mastrogiuseppe M.; Hayes A.; Poggiali V.; et al. Radar Sounding Using the Cassini Altimeter: Waveform Modeling and Monte Carlo Approach for Data Inversion of Observations of Titan’s Seas. IEEE Trans. Geosci. Electron. 2016, 54, 5646–5656. 10.1109/TGRS.2016.2563426. [DOI] [Google Scholar]
- Mastrogiuseppe M.; Hayes A.; Poggiali V.; et al. Bathymetry and composition of Titan’s Ontario Lacus derived from Monte Carlo-based waveform inversion of Cassini RADAR altimetry data. Icarus 2018a, 300, 203–209. 10.1016/j.icarus.2017.09.009. [DOI] [Google Scholar]
- Mastrogiuseppe M.; Poggiali V.; Hayes A.; et al. Cassini radar observation of Punga Mare and environs: Bathymetry and composition. Earth Planet. Sci. Lett. 2018b, 496, 89–95. 10.1016/j.epsl.2018.05.033. [DOI] [Google Scholar]
- Poggiali V.; Hayes A. G.; Mastrogiuseppe M.; et al. The bathymetry of moray sinus at Titan’s Kraken Mare. J. Geophys. Res.: Planets 2020, 125, e2020JE006558 10.1029/2020JE006558. [DOI] [Google Scholar]
- Wasiak F. C.; Luspay-Kuti A.; Welivitiya W.; et al. A facility for simulating Titan’s environment. Adv. Space Res. 2013, 51, 1213–1220. 10.1016/j.asr.2012.10.020. [DOI] [Google Scholar]
- Farnsworth K. K.; Chevrier V. F.; Steckloff J. K.; et al. Nitrogen Exsolution and Bubble Formation in Titan’s Lakes. Geophys. Res. Lett. 2019, 46, 13658–13667. 10.1029/2019GL084792. [DOI] [Google Scholar]
- Steckloff J. K.; et al. The Evaporation-Induced Stratification of Titan’s Lakes. Planet. Sci. J. 2020, 1, 26. 10.3847/PSJ/ab974e. [DOI] [PMC free article] [PubMed] [Google Scholar]
- Leadbetter A. J.; Taylor D. J.; Vincent B.; et al. The Densities and Surface Tensions of Liquid Ethane and Nitrous Oxide. Can. J. Chem. 1964, 42, 2930. 10.1139/v64-439. [DOI] [Google Scholar]
- Baidakov V. G.; Khotienkova M.; Andbaeva V.; et al. Capillary constant and surface tension of methane–nitrogen solutions: 1. Experiment. Fluid Phase Equilib. 2011, 301, 67–72. 10.1016/j.fluid.2010.11.013. [DOI] [Google Scholar]
- Baidakov V. G.; Kaverin A. M.; Khotienkova M. N.; et al. Surface tension of an ethane–nitrogen solution. 1: Experiment and thermodynamic analysis of the results. Fluid Phase Equilib. 2012, 328, 13–20. 10.1016/j.fluid.2012.05.005. [DOI] [Google Scholar]
- Malaska M. J.; Hodyss R.; Lunine J. I.; et al. Laboratory measurements of nitrogen dissolution in Titan lake fluids. Icarus 2017, 289, 94–105. 10.1016/j.icarus.2017.01.033. [DOI] [Google Scholar]
- Farnsworth K. K.; et al. Experimental Investigation of Liquid Hydrocarbons on the Surface of Titan: Nitrogen Dissolution, Exsolution, and Kinetics. Lunar and Planetary Sciences Conference XLIX 2018, 2709. [Google Scholar]
- Mastrogiuseppe M.; Poggiali V.; Hayes A.; et al. The bathymetry of a Titan sea. Geophys. Res. Lett. 2014, 41, 1432–1437. 10.1002/2013GL058618. [DOI] [Google Scholar]
- Hofgartner J. D.; Hayes A. G.; Lunine J. I.; et al. Transient features in a Titan sea. Nat. Geosci. 2014, 7, 493–496. 10.1038/ngeo2190. [DOI] [Google Scholar]
- Hofgartner J. D.; Hayes A. G.; Lunine J. I.; et al. Titan’s “Magic Islands”: Transient features in a hydrocarbon sea. Icarus 2016, 271, 338–349. 10.1016/j.icarus.2016.02.022. [DOI] [Google Scholar]
- Cordier D.; García-Sánchez F.; Justo-García D. N.; et al. Bubble streams in Titan’s seas as a product of liquid N2 + CH4 + C2H6 cryogenic mixture. Nat. Astron. 2017, 1, 0102 10.1038/s41550-017-0102. [DOI] [Google Scholar]
- Cordier D.; Liger-Belair G. Bubbles in Titan’s seas: nucleation, growth and RADAR signature. Astron. J. 2018, 859, 26 10.3847/1538-4357/aabc10. [DOI] [Google Scholar]
- Richardson I. A.; Hartwig J.; Leachman J.; et al. Experimental effervescence and freezing point depression measurements of nitrogen in liquid methane-ethane mixtures. Int. J. Therm. Sci. 2019, 137, 534–538. 10.1016/j.ijthermalsci.2018.12.024. [DOI] [PMC free article] [PubMed] [Google Scholar]
- Lavvas P.; Griffith C.; Yelle R.; et al. Condensation in Titan’s atmosphere at the Huygens landing site. Icarus 2011, 215, 732–750. 10.1016/j.icarus.2011.06.040. [DOI] [Google Scholar]
- Yu X.; Hörst S. M.; He C.; et al. Surface energy of the Titan aerosol analog “tholin”. Astrophys. J. 2020, 905, 88 10.3847/1538-4357/abc55d. [DOI] [Google Scholar]
- Cordier D.; Carrasco N. The floatability of aerosols and wave damping on Titan’s seas. Nat. Geosci. 2019, 12, 315–320. 10.1038/s41561-019-0344-4. [DOI] [Google Scholar]
Associated Data
This section collects any data citations, data availability statements, or supplementary materials included in this article.
Supplementary Materials
Data Availability Statement
The data underlying this study are available in the published article and the Supporting Information.