

Abstract
Background:
Contrast agents (CA) are administered in magnetic resonance imaging (MRI) clinical exams to measure tissue perfusion, enhance image contrast between adjacent tissues, or provide additional biochemical information in molecular MRI. The efficacy of a CA is determined by the tissue distribution of the agent and its concentration in the extracellular space of all tissues.
Methods:
In this work, micro-synchrotron radiation x-ray fluorescence (μ-SRXRF) was used to examine and characterize a gadolinium-based zinc-sensitive agent (GdL2) currently under development for detection of prostate cancer (PCa) by MRI. Prostate tissue samples were collected from control mice and mice with known PCa after an MRI exam that included injection of GdL2. The samples were raster scanned to investigate trends in Zn, Gd, Cu, Fe, S, P, and Ca.
Results:
Significant Zn and Gd co-localization was observed in both healthy and malignant tissues. In addition, a marked decrease in Zn was found in the lateral lobe of the prostate obtained from mice with PCa.
Conclusion:
We demonstrate here that μ-SRXRF is a useful tool for monitoring the distribution of several elements including Zn and Gd in animal models of cancer. The optimized procedures for tissue preparation, processing, data collection, and analysis are described.
Keywords: Contrast agent, Prostate cancer, Synchrotron radiation, X-ray fluorescence, Zinc, Gadolinium
1. Introduction
Prostate cancer is the second most diagnosed cancer in males globally [1]. With the absence of effective chemotherapy to treat prostate cancer [2], it remains the second leading cause of cancer deaths in males [1]. With such high incidence and mortality, imaging technology advances must detect, diagnose, and identify therapeutic targets for prostate cancer.
Zinc has a structural role in DNA recognition as well as a messenger role within and between cells [3]. It has been established that dysregulated zinc levels may be an indicator for pathologically significant diagnoses of cancer, including prostate cancer [4–6]. However, little is known regarding the metal distribution, in particular zinc, in the more aggressive castration-resistant prostate cancer (CRPC). Magnetic resonance imaging (MRI) contrast agents, often gadolinium-based, have been reported that are activated in the presence of zinc ions [7–10]. However, few have been proven to work in vivo [11] and further development of these contrast agents is required to ensure the detection of contrast agents corresponds to clinically significant observations of prostatic zinc.
In addition to zinc, other trace metals in the body also play important physiological roles in various cellular processes and pathways. Iron and copper are essential in the homeostasis of reactive oxygen species [12]. Iron plays a role in the electron transport chain in the mitochondria [13] and copper-containing enzymes regulate various physiological processes such as cellular respiration, free-radical detoxification, and cross-linking of collagen and elastin [12]. Calcium regulates many cellular processes including gene transcription, cell proliferation, and apoptosis, and up-regulation of Ca2+ ions channels may indicate prostate cancer [14]. Non-metals such as phosphorus, a major component of cell membranes, and sulphur, which is also involved in the electron transport chain, and found in the cysteine-rich proteins in the prostate, may also be of biological interest.
Micro-synchrotron radiation x-ray fluorescence (μ-SRXRF) is a non-destructive investigative technique that reveals the elemental composition of different materials. In this technique, a high intensity synchrotron radiation beam is incident on a material, exciting the atom’s electron structure and causing the emission of an x-ray characteristic of that atom. The energy of the emitted x-ray is determined by the energy difference between the orbital shells the electron transitions to and from. As such, these characteristic x-rays can be used to identify the presence of and, with proper calibration, the concentrations of different elements, with detection limits as low as a few parts per million. μ-SRXRF can be used to observe the concentrations and distributions of elements in biological tissue and administered contrast agents to determine the efficacy of these substances in vivo.
This paper will outline sample preparation, experimental, and analysis techniques optimized to examine the P, S, Ca, Fe, Cu, Zn, and Gd composition of malignant and benign prostate tissue in mice. These acquired maps allow for the determination of the efficacy of MRI contrast agents in detecting prostate cancer.
2. Materials and methods
2.1. Tissue preparation
Forty-two male C57BL/6 mice, the most widely used healthy mouse strain, and forty male C57BL/6-Tg(TRAMP)8247Ng/J mice, where TRAMP is transgenic adenocarcinoma of the mouse prostate (TRAMP), an established prostate cancer model [15], were purchased from Jackson Laboratories and used as the healthy and prostate cancer model. Two TRAMP mice died prior to end of experiment and were not included in analysis. In addition, four of the TRAMP animals were castrated at 11–12 weeks of age to model CRPC. All animals followed specific Zn diets and were administered glucose treatments and MRI imaging using a gadolinium-based, zinc-targeting contrast agent (GdL2) [11,16] for 16–24 weeks. The prostates, urethra, bladder, and seminal vesicles were then collected to be prepared for measurement. Samples were stored at −80 °C until they were ready to be sectioned.
2.1.1. Sample frames
There are two significant considerations for the frames onto which the samples will be mounted: elemental contamination and surface texture. Standard sample mounts, such as glass slides, are incompatible with μ-SRXRF as the substrates often contain contaminants, notably Fe. These contaminants may produce a great enough x-ray signal to make characteristic x-rays of interest unresolvable in applications involving biological tissue. X-ray transparent materials alone, such as Ultralene® XRF Film, are not rigid enough to hold their shape, causing irregularities or wrinkles on the surface. If a sample is mounted on an irregular surface, the slight changes in distance from the sample to the detector during measurement may cause artifacts in the final image. It also makes collecting reference optical microscope images more difficult. As such, custom sample holders had to be developed.
Customizable and affordable acrylic sample frames were 3D printed with an interior window for the sample to be mounted on. The frames are then glued onto Ultralene® XRF Film (4 μm thick) in a manner that ensures the film window is clean and wrinkle free. These sample frames ensure an x-ray transparent holder that is robust enough for handling and transport, and is contaminant free.
2.1.2. Sample mounting and histology
Samples are trimmed to remove the seminal vesicles to make the samples smaller. The trimmed samples are then frozen in the microtome chuck, oriented using TissueTek® Optimal Cutting Temperature (OCT) embedding medium as an aid, such that the cutting occurs in the transverse plane. By orienting the bladder away from the cutting surface, and the urethra and prostate towards the cutting surface, it is possible to obtain slices that contain the urethra, ventral, lateral, and dorsal lobes of the prostate. This enables measurement of, and comparison between lobes. This orientation is indicated in Fig. 1. Although the ideal slice contains all lobes of the prostate, lack of visual acuity could result in improper placement and the inability to cut in the desired orientation. With proper practice and training, this was minimized. Two adjacent slices of 7 μm thickness are cut for hematoxylin and eosin (H&E) staining and immunohistochemistry (IHC), followed by five slices of 50 μm thickness for μ-SRXRF measurement. H&E and IHC slices are mounted onto glass slides, and measurement slices are mounted onto the custom sample frames, self-adhered, and kept frozen until freeze-drying.
Fig. 1.
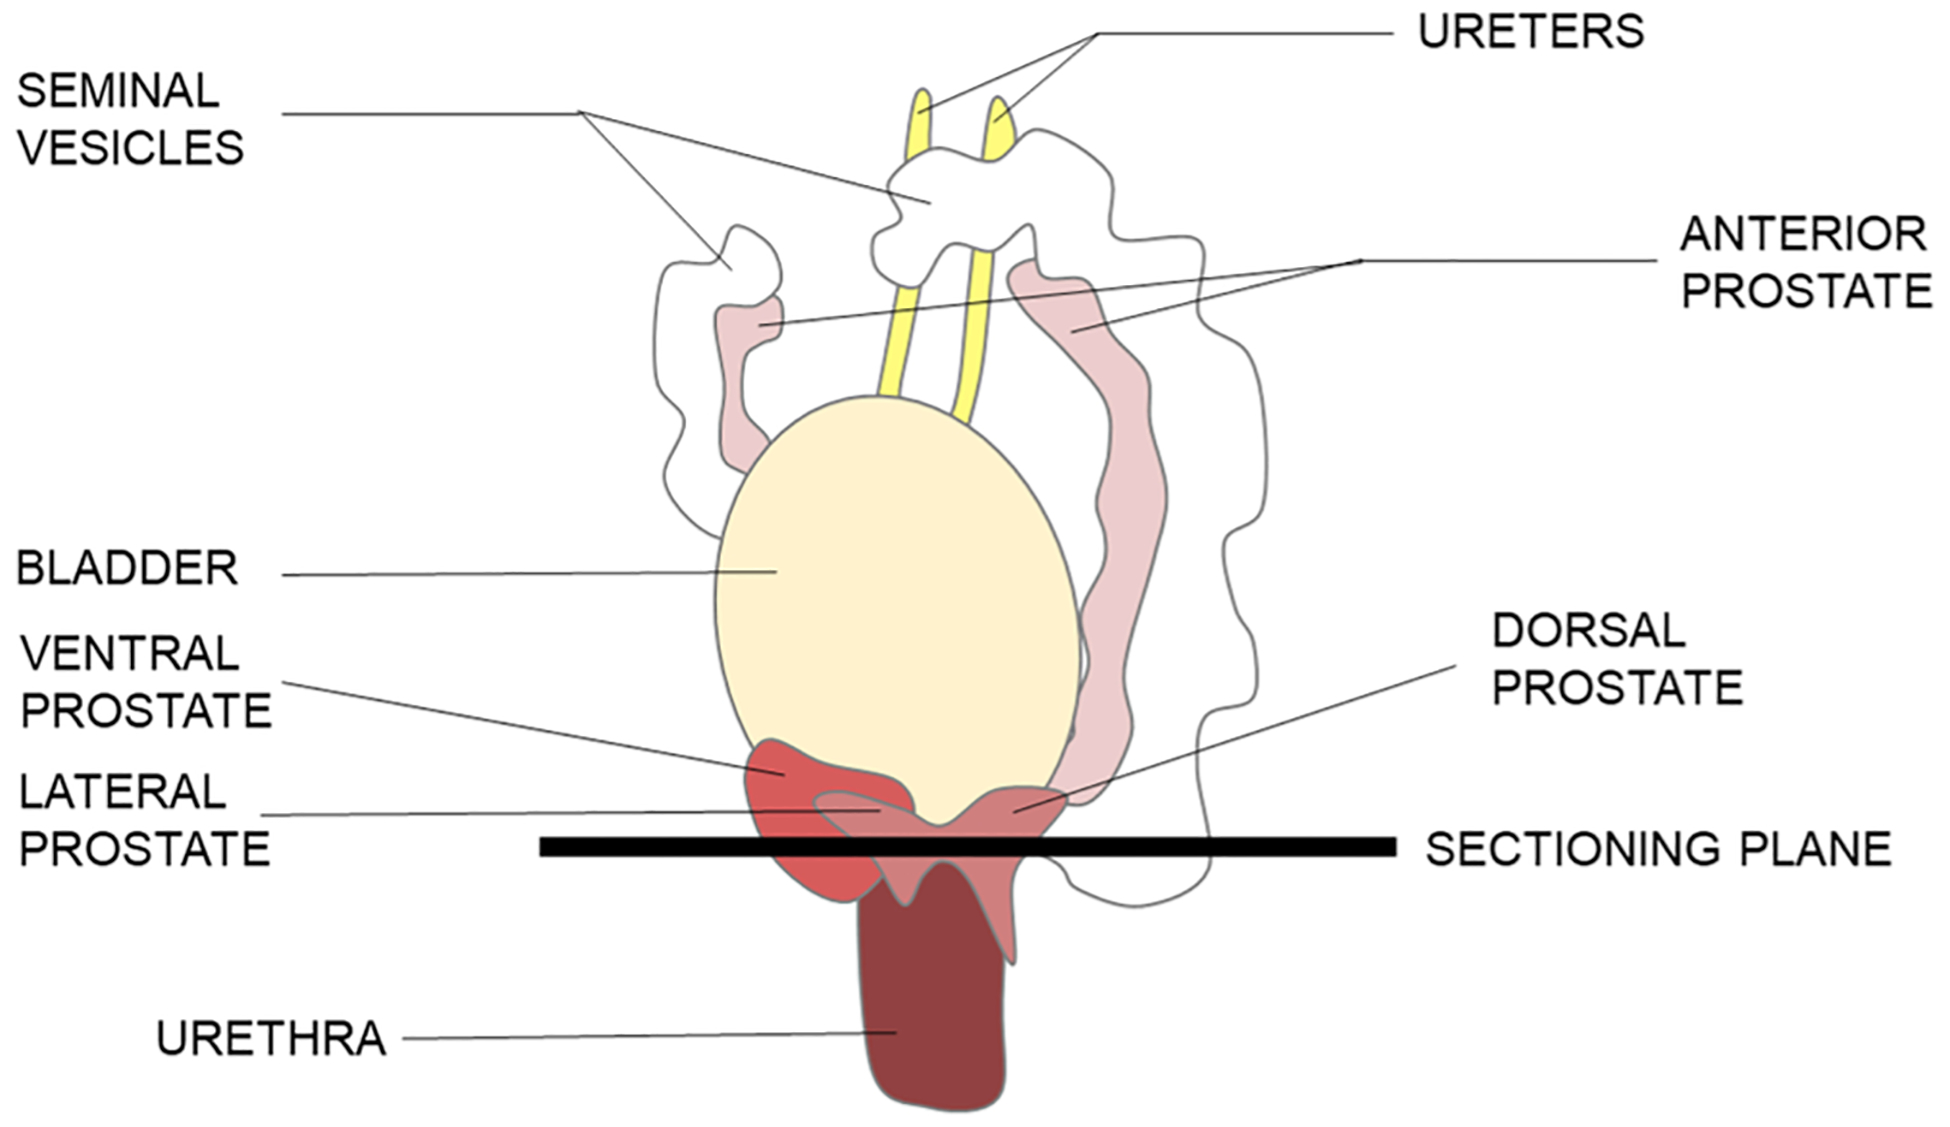
Anterolateral view of the male mouse urogenital organs. Samples are cut in the transverse plane to ensure the ventral, lateral, and dorsal lobes are obtained in one section.
2.1.3. Sample freeze-drying
To preserve the samples so that they can be kept at room temperature during storage and measurement, the samples are freeze dried to remove the water content. As discussed by Al-Ebraheem et al. (2015), freeze-drying can be a better preservation technique than conventional formalin-fixation and paraffin embedding as it can result in minimal morphological changes [17]. The mounted samples are placed in a freeze dryer at a temperature of −50 °C and under a pressure of approximately 1 Torr for 45 min. Extra care is required to minimize temperature fluctuations as the samples are being loaded into the freeze-dryer and that the freeze-drying does not exceed approximately 50 min as this could result in the samples cracking or flaking off the sample frames. The fully prepared samples are shown in a microscope image in Fig. 2, with the ventral, lateral, and dorsal lobes indicated.
Fig. 2.

Microscope image of a sectioned (50 μm thick) and freeze-dried mouse prostate embedded in OCT. Ventral, lateral, and dorsal lobes of the prostate are indicated.
2.2. Experimental setup
2.2.1. Magnetic resonance imaging
It has been observed that a rapid increase in blood sugar stimulates zinc secretion from prostate epithelial cells, a process referred to as glucose-stimulated zinc secretion (GSZS) [18–20]. As such, 12-hour fasted animals were injected with either a bolus of glucose (2.2 mmol/kg) or saline plus the zinc-sensitive MRI agent (0.07 mmol/kg) immediately before dynamic MR imaging. The prostates of each animal was imaged for approximately 10 min using a Varian 9.4 T small animal MRI scanner with 3D T1-weighted gradient-echo sequence (FA/TE/TR = 20°/1.69/3.34 ms, NEX 4, Matrix 128×128×128) in the transverse plane to match the sectioning and μ-SRXRF measurement orientation.
2.2.2. Micro-synchrotron radiation X-ray fluorescence
Samples were measured in air at the I18 Beamline at the Diamond Light Source, Harwell, United Kingdom. As shown in Fig. 3, the synchrotron beam and the silicon drift detector are oriented at a 90° geometry such that samples placed on a translation stage are angled 45° to both the incident beam and the 4-element Vortex silicon drift detector (120 mm2 active area). This geometry allows for the use of the strong polarization of the synchrotron beam to minimize noise from scattered photons [21]. An 11 keV energy beam was utilized to optimize the photoelectric absorption edges of the elements of interest to maximize the XRF signal, stated in Table 1.
Fig. 3.
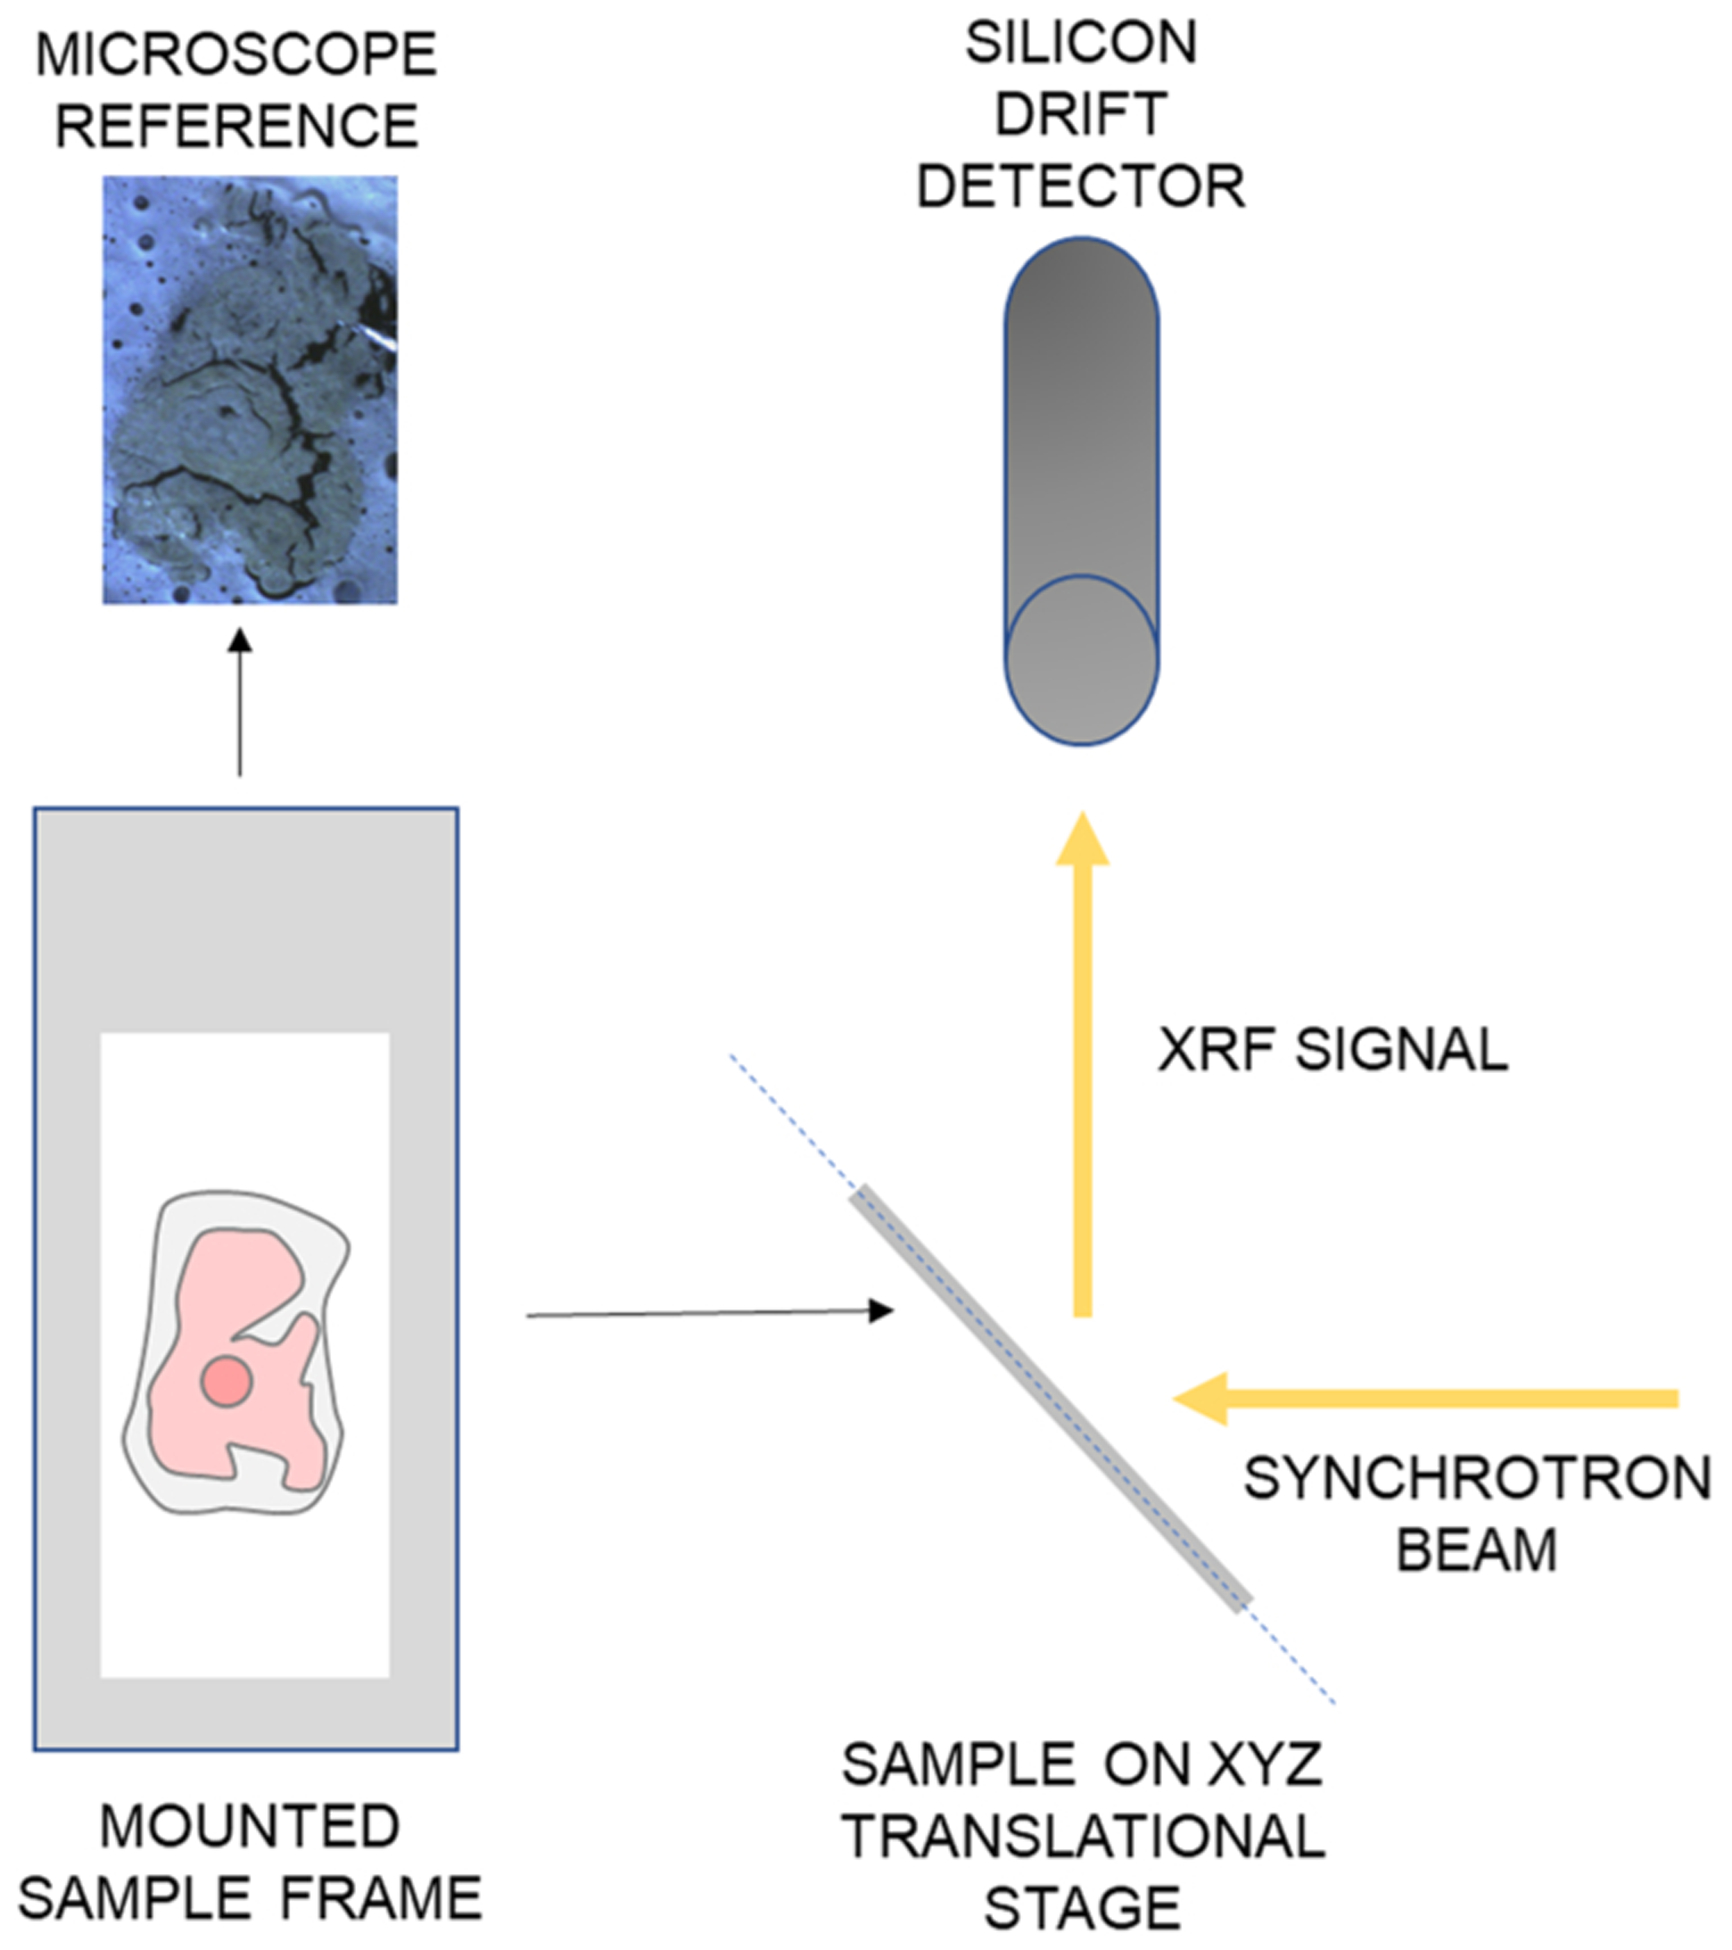
μ-SRXRF measurement geometry. Samples are mounted on a sample frame which is positioned on an xyz translational stage to move the sample for raster scans. The sample is arranged at 45° so that the synchrotron beam and silicon drift detector are oriented 90° to one another.
Table 1.
K and L photoelectric absorption edges for elements of interest [22].
| Element | K Absorption Edge (keV) | L Absorption Edge (keV) |
|---|---|---|
| P | 2.145 | |
| S | 2.472 | |
| Ca | 4.039 | |
| Fe | 7.112 | |
| Cu | 8.8979 | |
| Zn | 9.659 | |
| Gd | 8.376 (LI), 7.930 (LII), 7.243 (LIII) |
Initial scans, which vary depending on specimen size but are usually approximately 2 mm × 2 mm, are collected providing Zn or P maps showing enough anatomical detail to set a fine scan for a smaller region of interest. The use of KB focusing mirrors allows reproducible changes of beam size so a beam size of 50 μm × 50 μm is used for coarse scans and 5 μm × 5 μm is used for fine scans. The photon flux is approximately 8 × 10¹¹ photons/sec for the 50 μm × 50 μm beam and 5 × 10¹¹ photons/sec for the 5 μm × 5 μm beam. The translational stage moves the sample in a raster scan pattern with a step size of 50 μm for coarse scans and 5 μm for fine scans. The energy spectrum is collected for 0.75–1 s at each spot.
A thin film standard reference material (AXO, Dresden) was also measured using the same geometry and settings to quantify P, S, Ca, Fe, Cu, Zn, and Gd. Accurate quantification of the lower Z elements, P and S, is extremely difficult to achieve so for those the reported concentrations are more suited for qualitative comparison.
3. Analysis
The spectra collected from raster scans are input into PyMCA X-Ray Fluorescence data analysis software (v5.6.3) for fitting and quantification. During fitting, a configuration file is created for the software to identify our material/matrix composition, subtract the background, identify elemental peaks of interest, separate overlapping peaks, and finally fit each peak to generate its intensity value [21]. For quantification, PyMCA’s internal libraries and code reference these intensity values with the measurements of the reference material and calculated photon fluxes to generate a concentration value in parts per million (ppm). This quantification is accurate so long as the sample and reference material are measured in the same experimental setup and conditions. The configuration is then used to batch fit each raster scan, generating the elemental composition for each pixel [21].
Custom MATLAB® code converts the concentration outputs from PyMCA into a.ims file which arranges the data such that each element has its own raster-scanned image. The.ims file is then input into IDL software (v8.8), generating element-specific maps [21]. Regions of interest, for example specific prostate lobes or anatomical features, are identified by comparing the raster scans with the H&E-stained samples. The average concentration and standard error of the means for each region of interest are obtained and these statistics are compared to values obtained from other samples.
4. Results and discussion
The summed measured spectra from all pixels in a raster scan, as well as the background and fit in PyMCA from the AXO standard and an animal from the healthy group are shown in Fig. 4 and Fig. 5, respectively. The largest peak in both spectra is the Ar Kα which is present in air. In biological tissue, the Ar may be an issue if K is an element of interest as the Ar Kβ overlaps with the K Kα. Otherwise, all peaks of interest are resolvable and fit well.
Fig. 4.

Summed XRF spectrum (black) from the AXO standard with characteristic x-rays labelled. The fit and background from PyMCA fitting is indicated in red and green, respectively.
Fig. 5.

Summed XRF spectrum (black) from a healthy mouse prostate with characteristic x-rays of interest labelled. Inset shows the approximately 6–10 keV energy range highlighting Gd, Fe, Cu, and Zn. The fit and background from PyMCA fitting is indicated in red and green, respectively.
Administration of a glucose bolus and GdL2 resulted in greater MRI contrast than administration of GdL2 alone. However, it is difficult to determine the contributions of each element to the contrast observed. Investigation of the elemental distributions of Zn and Gd particularly revealed patterns.
Elemental maps are created for each sample measured using μ-SRXRF. Fig. 6 shows sample maps of the concentrations and distributions of Zn, Gd, Cu, Fe, S, P, and Ca in the mouse prostate of animal 54 in the TRAMP group. The average elemental concentrations measured in the prostates (as identified by comparison to H&E-stained slides and including the ventral, lateral, and dorsal lobes) of all animals measured are shown in Table 2. The elemental composition was compared using a one-tailed student t-test. The results are summarized in Table 3. Statistically significant differences in Zn, Cu, and P were found between the healthy, TRAMP, and castrate-resistant prostate cancer groups, which is in agreement with previous work [11].
Fig. 6.

Zn, Gd, Cu, Fe, S, P, and Ca elemental concentration and distribution maps from a coarse scan (3.6 mm × 3.3 mm, 50 μm step size) of mouse 54 in the TRAMP group. Ventral, lateral, and dorsal lobes are indicated.
Table 2.
Average Concentrations and Standard Deviations in Ventral, Lateral, and Dorsal Lobes of the Mouse Prostate.
| Element | Healthy (B6) (ppm) | TRAMP (ppm) | Castrate-Resistant Prostate Cancer (ppm) |
|---|---|---|---|
| Zn | 24 ± 6 | 20 ± 6 | 11 ± 3 |
| Gd | 42 ± 13 | 53 ± 16 | 67 ± 25 |
| Cu | 2.8 ± 0.4 | 2.5 ± 0.4 | 2.2 ± 0.4 |
| Fe | 16 ± 6 | 20 ± 9 | 20 ± 9 |
| S | 560 ± 170 | 490 ± 140 | 570 ± 240 |
| P | 270 ± 90 | 310 ± 100 | 210 ± 80 |
| Ca | 70 ± 19 | 51 ± 16 | 44 ± 17 |
Table 3.
Statistical Summary of Student t-test p-values Comparing Elemental Composition of Healthy (H), TRAMP (T), and Castrate-Resistant Prostate Cancer (CRPC) Prostates.
| p-value | |||
|---|---|---|---|
| Element | H vs. T | H vs. CRPC | T vs. CRPC |
| Zn | 0.003* | < 0.001* | < 0.001* |
| Gd | 0.07 | 0.005* | 0.06 |
| Gu | 0.02* | < 0.001* | 0.004* |
| Fe | 0.04* | 0.05* | 0.42 |
| S | 0.001* | 0.45 | 0.18 |
| P | 0.03* | < 0.001* | < 0.001* |
| Ca | < 0001* | 0.001* | 0.15 |
Significant difference at p ≤ 0.05
In both healthy and malignant samples, trends in the concentrations of Gd throughout the prostate lobes corresponded to trends in Zn concentration in the same lobes. However, the concentration differences between lobes were larger in the Zn maps. Table 4 summarizes the average concentration of Zn within the ventral, lateral, and dorsal lobes of the prostate as well as p-values from comparisons between Zn concentrations within those lobes from one-tailed student t-tests. In healthy animals, the lateral lobe had typically higher Zn than the ventral and dorsal lobes. Decreased Zn can be seen in the lateral lobe with the development of prostate cancer in TRAMP mice, and Zn is further reduced in mice with CRPC. Previous studies have connected these hypo-intense regions to the presence of malignant tissue using immunohistochemistry [19].
Table 4.
Average Zn Concentration (ppm) and Student t-test p-values Comparing Ventral, Lateral, and Dorsal Lobes of Healthy (H), TRAMP (T), and Castrate-Resistant Prostate Cancer (CRPC) Mice.
| Healthy | TRAMP | CRPC | ||
|---|---|---|---|---|
| Average Concentration (ppm) | Ventral Lobe | 18 ± 5 | 18 ± 4 | 11 ± 2 |
| Lateral Lobe | 27 ± 10 | 19 ± 5 | 11 ± 1 | |
| Dorsal Lobe | 18 ± 7 | 20 ± 6 | 9 ± 3 | |
| p-value | Ventral vs. Lateral | 0.05* | 0.14 | 0.45 |
| Ventral vs. Dorsal | 0.47 | 0.15 | 0.22 | |
| Lateral vs. Dorsal | 0.03* | 0.3 | 0.13 |
Significant difference at p ≤ 0.05
With the lateral lobe displaying the most significant difference in Zn between healthy and malignant samples, a fine scan was then collected to investigate the distributions within a lobe. Examples of fine scans of the lateral lobe of animal 54 are shown in Fig. 7. The region of the fine scan is indicated in red on the Zn map of the whole sample.
Fig. 7.

Zn, Gd, Cu, Fe, S, P, and Ca elemental concentration and distribution maps from a fine scan (465 μm × 485 μm, 5 μm step size) of the lateral lobe of mouse 54 in the TRAMP group. The region of the lateral lobe scanned is outlined in red on the coarse scan.
In animals that received a glucose bolus, zinc transport was stimulated from the glandular lumen of the lateral lobe to smooth muscle or stromal compartments. The loss of Zn is particularly noticeable in TRAMP mice. While co-localization of Zn and Gd in the glandular lumen is observed, the correlation is less intense within stromal compartments. As such, contrast observed in the lateral lobe during MRI can be attributed to the trafficking of Zn. These findings confirm previous observations reported by our group [18].
5. Conclusion
μ-SRXRF was able to confirm co-localization of Zn and Gd in prostate tissues, consistent with the mechanism of enhanced MR contrast provided by GdL2 in the presence of Zn in vivo. As previously reported [18], we found that within the lateral lobe, administration of a glucose bolus prior to imaging allowed for the observation of Zn trafficking between the glandular lumen and smooth muscle/stroma, with marked decreases in Zn in malignant tissue.
The sample preparation and processing procedure outlined in this work provide a feasible and effective method of assessing the efficacy of MRI contrast agents in vivo. This optimized technique also lends itself to the investigation of other elements and contrast agents. This method can be incorporated into the ongoing development of other element-based MRI contrast agents such as manganese and lanthanum [10,23] for prostate imaging. With the manganese K absorption edge at 6.539 keV and the lanthanum L absorption edge at 6.266 keV, minimal to no changes to the outlined procedure would be required. More broadly, μ-SRXRF could also be used to explore the use of MRI contrast agents in other biological tissues and diseases.
Funding
Financial support from the National Institutes of Health, USA (DK095416), the Cancer Prevention and Research Institute of Texas, USA (RP180178), and the Robert A. Welch Foundation, USA (AT-584) are gratefully acknowledged. We also acknowledge Diamond Light Source, UK for beamtime on I18 under proposal sp23705-3.
Footnotes
CRediT authorship contribution statement
E. Dao: Methodology, Software, Validation, Formal analysis, Investigation, Resources, Writing – original draft, Writing – review & editing, Visualization, Project administration, Funding acquisition. M.V. Clavijo Jordan: Conceptualization, Methodology, Software, Validation, Formal analysis, Investigation, Writing – original draft, Writing – review & editing, Project administration, Funding acquisition K. Geraki: Methodology, Software, Validation, Investigation, Resources, Writing – original draft, Writing – review & editing A.F. Martins: Investigation, Resources, Writing – original draft, Writing – review & editing. S. Chirayil: Investigation, Resources. A.D. Sherry: Conceptualization, Methodology, Resources, Writing – original draft, Writing – review & editing, Supervision, Funding acquisition. M.J. Farquharson: Conceptualization, Methodology, Validation, Investigation, Writing – original draft, Supervision, Project administration, Funding acquisition.
Conflict of interest
The authors state there is no conflict of interest.
References
- [1].Ferlay BF, Ervik JM, Lam F, Colombet M, Mery L, Piñeros M, Znaor A, Soerjomataram I, International Agency for Research on Cancer 2020., Glob. Cancer Obs. Cancer Today, 419, 2020, pp. 1–2. [Google Scholar]
- [2].Franklin RB, Zou J, Zheng Y, Naslund MJ, Costello LC, Zinc ionophore (Clioquinol) inhibition of human ZIP1-deficient prostate tumor growth in the mouse ectopic xenograft model: a zinc approach for the efficacious treatment of prostate cancer, Int. J. Cancer Clin. Res 3 (2016) 1–4. [DOI] [PMC free article] [PubMed] [Google Scholar]
- [3].Maret W, Zinc in cellular regulation: the nature and significance of “zinc signals”, Int. J. Mol. Sci 18 (2017) 10.3390/ijms18112285. [DOI] [PMC free article] [PubMed] [Google Scholar]
- [4].Johnston EM, Dao E, Farquharson MJ, Advances in the histopathological characterization of breast tissue using combined X-ray fluorescence and X-ray diffraction data in a multivariate analysis approach, X-Ray Spectrom 48 (2019) 432–437, 10.1002/xrs.3018. [DOI] [Google Scholar]
- [5].Costello LC, Franklin RB, Novel role of zinc in the regulation of prostate citrate metabolism and its implications in prostate cancer, Prostate 35 (1998) 285–296, . [DOI] [PubMed] [Google Scholar]
- [6].Costello LC, Franklin RB, A review of the current status and concept of the emerging implications of zinc and zinc transporters in the development of pancreatic cancer, Pancreat. Disord. Ther 01 (2013), 10.4172/2165-7092.s4-002. [DOI] [PMC free article] [PubMed] [Google Scholar]
- [7].De León-Rodríguez LM, Lubag AJM, López JA, Andreu-De-Riquer G, Alvarado-Monzón JC, Sherry AD, A second generation MRI contrast agent for imaging zinc ions in vivo, Medchemcomm 3 (2012) 480–483, 10.1039/c2md00301e. [DOI] [PMC free article] [PubMed] [Google Scholar]
- [8].Wahsner J, Gale EM, Rodríguez-Rodríguez A, Caravan P, Chemistry of MRI contrast agents: Current challenges and new frontiers, Chem. Rev 119 (2019) 957–1057, 10.1021/acs.chemrev.8b00363. [DOI] [PMC free article] [PubMed] [Google Scholar]
- [9].Zhang X, Lovejoy KS, Jasanoff A, Lippard SJ, Water-soluble porphyrins as a dual-function molecular imaging platform for MRI and fluorescence zinc sensing, Proc. Natl. Acad. Sci. U.S.A 104 (2007) 10780–10785. [DOI] [PMC free article] [PubMed] [Google Scholar]
- [10].Isaac M, Pallier A, Szeremeta F, Bayle PA, Barantin L, Bonnet CS, Śenèque O, MRI and luminescence detection of Zn2+ with a lanthanide complex-zinc finger peptide conjugate, Chem. Commun 54 (2018) 7350–7353, 10.1039/c8cc04366c. [DOI] [PubMed] [Google Scholar]
- [11].Clavijo Jordan V, Al-Ebraheem A, Geraki K, Dao E, Martins AF, Chirayil S, Farquharson M, Sherry AD, Synchrotron radiation x-ray fluorescence elemental mapping in healthy versus malignant prostate tissues provides new insights into the glucose-stimulated zinc trafficking in the prostate as discovered by MRI, Inorg. Chem 58 (2019) 13654–13660, 10.1021/acs.inorgchem.9b01132. [DOI] [PMC free article] [PubMed] [Google Scholar]
- [12].Polishchuk R, Lutsenko S, Golgi in copper homeostasis: a view from the membrane trafficking field, Histochem. Cell Biol 140 (2013) 285–295, 10.1007/s00418-013-1123-8. [DOI] [PMC free article] [PubMed] [Google Scholar]
- [13].Paul BT, Manz DH, Torti FM, Torti SV, Mitochondria and iron: current questions HHS public access, Expert Rev. Hematol 10 (2017) 65–79, 10.1080/17474086.2016.1268047.Mitochondria. [DOI] [PMC free article] [PubMed] [Google Scholar]
- [14].Monteith GR, McAndrew D, Faddy HM, Roberts-Thomson SJ, Calcium and cancer: targeting Ca2+ transport, Nat. Rev. Cancer 7 (2007) 519–530, 10.1038/nrc2171. [DOI] [PubMed] [Google Scholar]
- [15].Hurwitz AA, Foster BA, Allison JP, Greenberg NM, Kwon ED, The TRAMP mouse as a model for prostate cancer (Chapter), Curr. Protoc. Immunol 20 (2001) 1–23, 10.1002/0471142735.im2005s45. [DOI] [PubMed] [Google Scholar]
- [16].Martins AF, Clavijo Jordan V, Bochner F, Chirayil S, Paranawithana N, Zhang S, Lo S, Wen X, Zhao P, Neeman M, Sherry AD, Imaging insulin secretion from mouse pancreas by MRI is improved by use of a zinc-responsive MRI sensor with lower affinity for Zn2+ ions, J. Am. Chem. Soc 140 (2018), 10.1021/jacs.8b07607. [DOI] [PMC free article] [PubMed] [Google Scholar]
- [17].Al-Ebraheem A, Dao E, Desouza E, Li C, Wainman BC, McNeill FE, Farquharson MJ, Effect of sample preparation techniques on the concentrations and distributions of elements in biological tissues using μSRXRF: a comparative study, Physiol. Meas 36 (2015) N51–N60, 10.1088/0967-3334/36/3/N51. [DOI] [PubMed] [Google Scholar]
- [18].Clavijo Jordan V, Al-Ebraheem A, Geraki K, Dao E, Martins AF, Chirayil S, Farquharson M, Sherry AD, Synchrotron radiation X-ray fluorescence elemental mapping in healthy versus malignant prostate tissues provides new insights into the glucose-stimulated zinc traffi cking in the prostate as discovered by MRI, Inorg. Chem (2019), 10.1021/acs.inorgchem.9b01132. [DOI] [PMC free article] [PubMed] [Google Scholar]
- [19].Clavijo Jordan MV, Lo ST, Chen S, Preihs C, Chirayil S, Zhang S, Kapur P, Li WH, De Leon-Rodriguez LM, Lubag AJM, Rofsky NM, Sherry AD, Zincsensitive MRI contrast agent detects differential release of Zn(II) ions from the healthy vs. malignant mouse prostate, Proc. Natl. Acad. Sci. U.S.A 113 (2016) E5464–E5471, 10.1073/pnas.1609450113. [DOI] [PMC free article] [PubMed] [Google Scholar]
- [20].Lo ST, Parrott D, Jordan MVC, Joseph DB, Strand D, Lo UG, Lin H, Darehshouri A, Sherry AD, The roles of ZnT1 and ZnT4 in glucose-stimulated zinc secretion in prostate epithelial cells, Mol. Imaging Biol 23 (2021) 230–240, 10.1007/s11307-020-01557-x. [DOI] [PMC free article] [PubMed] [Google Scholar]
- [21].Al-Ebraheem A, Dao E, Geraki K, Farquharson MJ, Emerging patterns in the distribution of trace elements in ovarian, invasive and in-situ breast cancer, J. Phys. Conf. Ser 499 (2014), 10.1088/1742-6596/499/1/012014. [DOI] [Google Scholar]
- [22].Thompson H, Lindau A, Attwood I, Pianetta D, Gullikson P, Robinson E, Howells A, Scofield M, Kim J, Underwood KJ, Kirz J, Vaughan J, Kortright D, Williams J, Winick G, X-Ray Data Booklet, Lawrence Berkeley National Lab., Berkeley: 2009. [Google Scholar]
- [23].Chirayil S, Jordan VC, Martins AF, Paranawithana N, Ratnakar SJ, Sherry AD, Manganese(II)-based responsive contrast agent detects glucosestimulated zinc secretion from the mouse pancreas and prostate by MRI, Inorg. Chem 60 (2021) 2168–2177, 10.1021/acs.inorgchem.0c02688. [DOI] [PMC free article] [PubMed] [Google Scholar]