

Summary
Microbial adaptation to changing environmental conditions is frequently mediated by hypermutable sequences. Here we demonstrate that such a hypermutable hotspot within a gene encoding a flagellar unit of Paenibacillus glucanolyticus generated spontaneous non-swarming mutants with increased stress resistance. These mutants, which survived conditions that eliminated wild-type cultures, could be carried by their swarming siblings when the colony spread, consequently increasing their numbers at the spreading edge. Of interest, the hypermutable nature of the aforementioned sequence enabled the non-swarming mutants to serve as “seeds” for a new generation of wild-type cells through reversion of the mutation.
Using a mathematical model, we examined the survival dynamics of P. glucanolyticus colonies under fluctuating environments. Our experimental and theoretical results suggest that the non-swarming, stress-resistant mutants can save the colony from extinction. Notably, we identified this hypermutable sequence in flagellar genes of additional Paenibacillus species, suggesting that this phenomenon could be wide-spread and ecologically important.
Subject areas: Biological sciences, Genetics, Microbiology, Mathematical biosciences
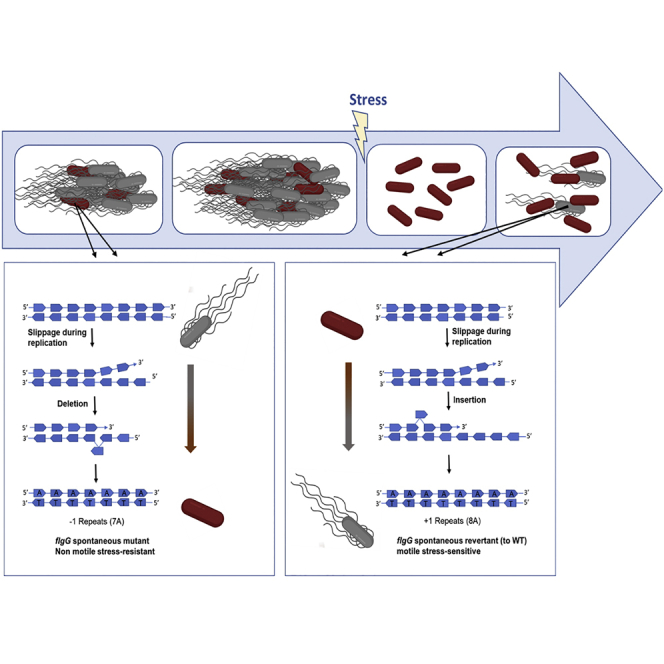
Graphical abstract
Highlights
-
•
Paenibacillus glucanolyticus harbor a hypermutable hotspot within a flagellar gene
-
•
The hotspot generates non-swarming mutants with increased stress resistance
-
•
Non-swarming mutants are carried by their swarming siblings when the colony spreads
-
•
Non-swarming mutants can revert back to the wild-type genotype
Biological sciences; Genetics; Microbiology; Mathematical biosciences
Introduction
The ability to adapt to diverse environmental conditions is fundamental to the survival of many microbial populations. Adaptation can range from rapid phenotypic acclimation through regulatory gene transcription, to genetic modifications and bet-hedging, sustained by natural selection. In the latter mechanism, natural selection favors the most adapted genotype. However, a beneficial trait in one condition can be disadvantageous in another. Therefore, an adaptive mechanism that provides an on–off switch between different states could be profitable. One such mechanism is phase variation, which generates frequent and reversible modifications in protein expression within individual cells of a clonal population.1 The molecular mechanisms governing phase variations range from epigenetic modifications via DNA methylation, to genetic alterations involving slipped strand mispairing or site-specific recombination within hypermutable loci.2,3,4,5,6 In this regard, simple sequence repeats (SSRs) in specific loci can serve as mediators of hypermutations through slipped strand mispairing that can occur in these regions during DNA replication.7,8,9,10 Accordingly, several studies have demonstrated enhanced adaptation to unstable environmental conditions through insertion or deletion (indels) of nucleotides generated by SSRs.11,12,13,14,15 Here we examined the effect of a hypermutable SSR region within a flagellum-related gene on the population dynamics and swarming motility of P. glucanolyticus colonies.
Swarming is an important cooperative bacterial trait exhibited by various bacterial species, including many Paenibacillus strains.16,17,18 This type of motility is often vital for survival as it allows bacteria to escape local stresses, translocate to a better nutritional environment and efficiently invade host tissue.19,20,21 Thus, when grown on solid surfaces, non-swarming cells, which are stuck at the point of inoculation, could be at a disadvantage.22,23,24 Consequently, even when exhibiting increased overall fitness in liquid culture, the contribution of non-swarming variants to the survival of bacterial colonies living on solid surfaces can be undermined by their inability to spread. Indeed, flagellar mutants of Pseudomonas aeruginosa that exhibited a growth advantage under planktonic conditions were shown to be at a disadvantage on solid media because they could not co-migrate with their wild-type (WT) siblings.23
Here we present data suggesting that P. glucanolyticus colonies can circumvent this problem by carrying non-swarming mutants with increased stress resistance during colony dispersal. Such mutants spontaneously appeared in P. glucanolyticus cultures because of a deletion event within an SSR region in the flgG gene, encoding a flagellar basal-body rod protein. This SSR region supported an on–off switch in the functional flagella allowing reversible transitions between swarming and non-swarming genotypes. We suggest that hitchhiking of these flagellar mutants on their WT siblings can increase the number of stress-resistant non-swarming cells at the spreading edge and consequently improve the overall fitness of the colony under fluctuating environmental conditions.
Results and discussion
Appearance of non-swarming morphotypes under stress conditions
P. glucanolyticus bacteria are proficient swarmers, able to spread on solid surfaces of >1% agar by generating moving modules. Each of these modules consists of many bacteria, which use intricate sensing and signaling pathways to support collective movement of the colony on solid surfaces. While working with these swarming colonies we noticed that after prolonged incubation at 4°C (14–21 days), non-swarming, stable morphotypes occasionally appeared among the swarming modules (Figure 1A). The appearance of non-swarming morphotypes due to exposure to cold occurred at three different occasions in three different cell lines. One non-swarming colony was sequenced from each cell line. Comparative sequence analyses of the WT swarmer and non-swarmer colonies revealed, in two of the three sequenced colonies, a nonsynonymous mutation in a flagellum-related gene, annotated as flgG, in the genome of P. glucanolyticus 5162. A nucleotide deletion in a homopolymeric tract of eight adenine nucleotides resulted in a frameshift close to the start codon sequence of the flgG gene (Figure 1B), leading to a premature stop codon (Figure S1).
Figure 1.

Non-swarming P. glucanolyticus morphotypes appear because of deletion of an adenine nucleotide within the flgG gene
(A) TSA plate containing WT colonies and a non-swarming colony (NS) grown for 24 h at 32°C; plate diameter is 9 cm.
(B) flgG gene sequence, indicating the position of a nucleotide deletion within a homopolymeric stretch of eight adenines (gray-shaded letters).
The mutation in the third non-swarming colony was identified as a single nucleotide replacement of guanine to adenine in a gene annotated as motB in the genome of P. glucanolyticus 5162, resulting in the substitution of a glycine amino acid to serine. This mutant was not further characterized in the presented study.
Reversion of flgG mutants restores the swarming ability of the population
The lack of surface motility of the non-swarming mutants (hereafter flgG mutants), in addition to the genomic analyses demonstrating mutation in a flagellum-related gene, suggested that these mutants do not possess functional flagella. Consequently, the flgG mutants were expected to not be able to swim in soft agar. Inoculation of the flgG mutants on 0.3% agar TSA plates demonstrated that indeed, these mutants cannot swim. However, to our surprise, this result was not consistent and in some cases, the flgG mutant cells produced swimming colonies (Figure 2A). In addition, TEM analysis of the swimming cells indicated that they produce flagellum-like structures (Figure 2B). Sequencing of the flgG gene of cells collected from the spreading regions of the flgG swimming colonies indicated that these cells harbored the WT flgG gene sequence, whereas cells collected from the core colony (at the point of inoculation) harbored the mutated flgG gene with seven adenine nucleotides instead of eight.
Figure 2.

Reversion of the flgG mutants restores swimming ability
(A) Swimming assay examining colony expansion of P. glucanolyticus WT, flgG mutants and flgG revertants: swimming assay was carried out by inoculating 5 μL of bacterial culture (OD600 = 1.8) on a 0.3% TSA plate at 32°C.
(B) TEM imaging of P. glucanolyticus WT, flgG mutant and flgG revertant cells: cells were collected from the plates in (a) at 24 h after inoculation.
Because SSRs usually represent hypermutable loci that are subject to reversible changes in their length,9,25,26,27 the appearance of a swimming morphotype in the flgG mutant colony could have occurred because of reversion of the flgG mutant back to the WT genotype. These reverted WT cells are less likely to be seen in swarming plates because swarming is a social trait that requires a critical cell density for production of wetting agents and formation of swarming rafts.21,28,29 Although genome analyses indicated that the flgG mutants are not defective in normal surfactant production, the lack of flagella likely hampers their ability to produce the rafts typically associated with swarming cells. Hence, a small number of WT cells in the flgG mutant colony will probably not reach the necessary threshold and consequently, will not successfully emerge from the flgG mutant colony. Swimming, on the other hand, is an individual trait and even one cell could emerge from a colony by swimming and replicating.
To promote visualization of swarming revertants on solid agar, we transferred flgG mutant colonies by streaking on 20 cm × 20 cm TSA plates every three days. This inoculation method supported the appearance of swarming revertants three times: once after six transfers, a second time after 20 transfers, and a third time after 10 transfers (Figure S2). Sequencing of the revertants’ flgG gene indicated that, as identified in the swimming cells, reversion to a swarming morphotype occurred because of reinsertion of an adenine nucleotide, restoring the sequence of eight adenine nucleotides instead of seven.
Non-swarming flgG mutants survive better than the WT cells under stress conditions
Because the flgG mutant cells were isolated after prolonged incubation at 4°C, we posited that they might have an advantage over the WT under stress conditions. Because many stress conditions induce the accumulation of reactive oxygen species,30,31 we focused our analysis comparing growth and survival of flgG mutants and WT cells on exposure to hydrogen peroxide.
Calculations of the area below the growth curves ploted in Figure 3A indicated significance differences between WT and flgG mutant cultures, with a higher area for the flgG mutant cultures compared to the WT cultures with increasing H2O2 concentrations (Table S3).
Figure 3.

flgG mutants exhibit increased stress resistance
(A) Growth curves of WT and flgG mutant cells at 32°C in a 24-well plate with TSB supplemented with 0, 4 mM or 8 mM H2O2; values are means ± SD (n = 6).
(B) Growth curves of WT and flgG mutant cells after transient exposure to 8 mM H2O2 in PBS for 3 h. Growth in LB of 48 WT cultures (left side) and 48flgG mutant cultures (right side) was recorded for 50 h. Top four rows: overnight cultures diluted 1:100 before exposure to H2O2 in PBS, bottom four rows: same but with 1:1000 dilution. Pink squares indicate wells in which no growth was detected. Of all WT cultures examined, only 58% survived, compared to 100% survival of flgG mutant cultures.
(C) ATP:ADP ratio of WT and flgG mutant cultures means ± SD (n = 5).
To measure survival on transient exposure to stress, we exposed WT and flgG mutant cultures to 8 mM H2O2 in PBS medium that does not support growth, then transferred them to TSB medium and examined recovery and growth. Results showed that, when at low numbers (as will occur during the decline of a population under stress), many of the WT cultures did not survive (Figure 3B). For example, when diluted 1:100 before exposure to H2O2, 7 out of 24 overnight WT cultures could not recover after stress exposure and did not grow. The extent of survival decreased even more in cultures diluted 1:1000, where 13 out of 24 cultures did not recover after exposure to the stress. In contrast, even when diluted, all examined flgG mutant cultures exhibited 100% recovery (Figure 3B).
The contribution of the flgG mutant cells to survival was also demonstrated in mixed WT/flgG mutant populations, which consisted of 70% WT cells and 30% flgG mutant cells. Results indicated a clear advantage for the mixed population compared to the WT population under transient exposure to H2O2. In the mixed population, only 1 out of 24 cultures did not survive exposure to H2O2 (95% survival), whereas in the WT population, 12 out of 24 cultures did not survive the stress exposure (50% survival) (Figure S3).
Improved tolerance to oxidative stress has also been reported in flagellum-less mutants of Pseudomonas putida.32 That study showed that the flagellum-lacking mutants exhibit a higher energy level than the WT cells. Similarly, we found that when grown under optimal conditions in TSB, the P. glucanolyticus flgG mutant cells contained a higher ratio of ATP to ADP molecules compared to that measured in P. glucanolyticus WT cells (Figure 3C).
Appearance of spontaneous non-motile mutants because of indel events within a homopolymeric stretch of adenines has also been reported in Bacillus subtilis cultures,33 as well as in Leptospira interrogans cultures.34 In the former, this occurred because of insertion of adenine in a homopolymeric stretch of seven adenines at the 5` end of the swrA gene, whereas in the latter it was because of insertion of an adenine into a homopolymeric stretch of eight adenines at the 5′ end of the fliM gene. To the best of our knowledge, stress resistance of the swrA and fliM mutants was not examined, hence their contribution to the colony’s fitness under stress is not known.
It should be noted that the improved ability of the flgG mutant cells to withstand stress was not limited to tolerance to hydrogen peroxide, because these cells grew better than the WT culture also when exposed to salt and antibiotic stress (Figure S4) suggesting that the hypermutable region in the flgG gene could be beneficial under a range of various stress conditions.
Non-swarming flgG mutant cells are conserved in the population and are carried by their swarming siblings during colony dispersal
The fact that the flgG mutants are more resistant to stress, combined with their ability to revert back to the WT genotype, suggests that there could be a strong advantage to keeping them in the population. Hence, maintenance of a hypermutable SSR stretch within the flgG gene could serve as a bet-hedging strategy to ensure the survival of the population as a whole. To examine this hypothesis, we used an Illumina MiSeq NGS system to measure the proportions of 7-adenine and 8-adenine flgG gene variants within the WT population. These proportions were found to be 0.9 and 99.1%, respectively, in the WT cultures, showing that the WT population constantly maintained a small fraction of mutant cells, and that the selection against them was not strong enough to remove them from the population under non stressful growth conditions (Figure 4A).
Figure 4.

P. glucanolyticus cultures constantly maintain flgG mutant cells within the population
(A) NGS analyses of the flgG gene in WT and flgG mutant cultures in TSB or TSB + H2O2, depicting the proportion of 7 adenines to 8 adenines in the homopolymeric adenine stretch in the gene. DNA was extracted from three cultures at the log phase of growth in TSB or TSB with 8 mM H2O2; three cultures under each condition were pooled together for analysis, number of reads per sample >100,000.
(B) Microscope image of a P. glucanolyticus colony containing 30% stained flgG mutant cells and 70% WT cells. flgG mutants were stained with red dye (ATTO 663) before inoculation, and 5 μL of mixed WT and mutant cells were inoculated at the center of a 1.5% agar pad (0.75 mm thick). Image of the swarming front was taken 8 h after inoculation. Brightfield and fluorescent overlay microscope image was taken at ×40 magnification. Fluorescent image was obtained with a Texas red filter 560 nm/630 nm.
(C) flgG mutant (5 μL of a 30% solution) was mixed with 70% WT cells, inoculated in the center of a 1.5% TSA plate, and incubated at 32°C. The colony center was separated from the edges by a 35 mm corer and the proportion of 7 adenines to 8 adenines in the flgG gene was determined by Illumina NGS for each area.
Of interest, when grown under exposure to 8 mM H2O2, the fraction of 7-adenine variants measured in the WT cultures increased from 0.9% to 8% (Figure 4A), further validating the enhanced ability of the flgG mutants to cope with stress. We posited that if the number of the flgG cells within a population is sufficiently high, these cells could save the colony from extinction under stressful conditions. However, for a colony growing on solid surfaces, the lack of movement of the flgG mutants could hamper such a contingency plan, mainly because swarming could be vital for the survival of these surface-dwelling cells.22,35,36 Thus, a non-swarming morphotype, although more resistant to stress, could be at a disadvantage if stuck at the point of inoculation. If, alternatively, the non-swarming cells could use their swarming siblings for dispersal, they could obtain the benefits of surface motility while still maintaining improved stress resistance. Moreover, co-swarming of mutant and WT cells could increase the abundance of flgG mutants within the spreading colonies and thus improve the odds of survival. To examine whether such a scenario is feasible, we mixed fluorescently stained flgGmutant cells (30%) with non-stained WT cells (70%) and followed the dispersal of both cell types on TSA. As seen in Figure 4B, despite lacking the intrinsic ability to move on solid surfaces, stained flgG mutant cells were observed at a distance from the inoculation point, reaching the edges of the colony together with their swarming neighbors. Relative quantification of the flgG mutant cells in these colonies, using NGS analysis, indicated that the proportion of flgG mutant cells at the edges of the mixed colonies was higher than the proportion measured in liquid culture (i.e., 16% compared to 0.9%, respectively). This suggested that the appearance of the non-swarming cells at the edges of the spreading colony was not just a result of “new” mutations in the hypermutable homopolymeric stretch of adenines, but was also because of their ability to “hitch a ride” with the swarming WT cells.
The ability of flgG mutant cells to rescue the population from extinction depends on the frequency of environmental changes (theoretical analysis)
A stress-sensitive population exposed to a “negative” environmental change will decline and probably reach extinction if it cannot adapt. Under such circumstances, resistant morphotypes that are present in the population in high enough numbers could proliferate and be a source for the population’s rescue.
To examine how the flgG mutants might change the dynamics of the population, we constructed a mathematical model in which we considered a population of bacteria with two types of individuals: flgG mutants and WT (see star methods). Our results showed that the population that mutates between WT and flgG mutants can survive better than the WT population that does not mutate. In particular, when the environment repeatedly switches between good and bad, the population that forms flgG mutants can survive even under circumstances when the WT population alone does not survive (Figure 5). Furthermore, the population that forms flgG mutants has a higher growth rate than the WT-only population in a wide range of parameters (Figure 6), even in cases in which the mutation rate is higher than the reversion rate (Figure S5). In particular, the relative growth rates in each environment determine the selection strengths between the WT and the flgG mutants. If the growth rate of WT in a bad environment, , is below a certain threshold, having rapid mutations is advantageous (results in higher population growth rate); however, if is above that threshold, having no mutations is advantageous (Figure 6). One can consider the rapidly mutating strategy to be evolutionarily advantageous if (1) the growth rate of a rapidly-mutating population is higher than that of a non-mutating population, and (2) the growth rate of the rapidly mutating population is positive
Figure 5.

Mutations can facilitate population survival if the transitions between the “good” and the “bad” environments are sufficiently slow/infrequent
(A and B) Without mutations (), the WT population declines in the long run in both the periodic (A) and stochastic (B) cases.
(C and D) With mutations , and with the same transition rate between the good and the bad environments ( in a and c and in B and D), the population increases in the long run in both the periodic (C) and the stochastic (D) environments.
(E andF) With mutations (), but with rapid transition between the two types of environments (), the population declines. Note that the transition rate from a good to a bad environment in A and B is the same as its rate in C and D, but the transition rate does not change the average slope when there are no mutations. All other parameter values are the same in all panels for the periodic model simulations (a, c, e): , , , , , ; and the stochastic model simulations (B, D, F: , , and the other parameter values are the same as in Aa,C, E.
Figure 6.

Mutations between WT and flgGmutants are beneficial for a wide range of parameters
Demonstrated are the average, long-term growth rates of the population in a changing environment, as a function of the WT growth rate in a bad environment, , for various values of the mutation rates, . In particular, a population that does not mutate () is compared to populations that mutate relatively rapidly (, and ). When is very low, higher mutation rates result in higher population growth rates, whereas if is closer to the growth rate of flgG mutants, , lower mutation rates are advantageous. The other parameter values are the same as those in Figure 5A.
We posit that when grown on solid surfaces, the flgG mutants are dependent on their WT siblings for movement to reach nutrients. Specifically, a necessary condition for the population with mutants to survive is that the proportion of WT cells does not decrease below a specific threshold while in good environments. This is because of the fact that as the proportion of flgG mutants increases, the area to which the colony spreads decreases (Figure S6). Such a decrease will hamper their ability to find food and thus will negatively affect their growth rate.
Apparently, the survival of the population seems to critically depend on how frequently the environmental state switches, specifically assuming that the proportion of time in each type of environment is kept constant. If the environment switches rapidly ( is below a certain threshold), the population size might still decline; however, if the environment switches slowly ( is above that threshold), the population size increases (Figure 5). Notably, after a “bad” period (particularly in panels 5c and 5days), the population of mutants can become dominant (mostly mutants survive some of the bad periods). Moreover, when the environment becomes “good”, the flgG mutant population still declines for some time before it starts increasing (Figure 5C). This is because of the co-dependency of WT and mutant cells, taking into account that, on solid surfaces, the flgG population can increase only if the proportion of WT cells is sufficiently large to carry them and promote their dispersal in “good” environments.
The homopolymeric region of adenines in the flgG gene appears in several Paenibacillus species
The deletion of adenine in the flgG gene of P. glucanolyticus falls within a stretch of nine nucleotides encoding three lysine (K) residues. Analyses of the FlgG amino acid sequence of 500 Paenibacillus species identified 41 genomes harboring FlgG sequences that contain this KKK stretch of amino acids. Of interest, in contrast to the amino acid-alignment results, alignment of the DNA sequences of these 41flgG genes revealed sequence variations (Figure 7A). This is because both AAA and AAG nucleotide sequences code for the amino acid lysine. Thus, in addition to the native P. glucanolyticus flgG sequence encoding KKK (i.e., AAAAAAAAG; hereafter termed 3A6A), the flgG sequence can also encode the KKK region with one of the following three sequences: (1) AAAAAGAAG (3A6G); (2) AAGAAAAAG (3G6A), and (3) AAGAAGAAG (3G6G) (Figure 7A). We note that additional options encoding KKK could also occur with a G to A replacement of the last nucleotide at the ninth position. However, because in both WT and flgG mutant the nucleotide in this position is guanine, we have not included this option in the following phylogenetic analysis.
Figure 7.

Codon alignment and phylogenetic reconstruction of Paenibacillus species harboring the KKK sequence of the FlgG protein
(A) Sequence alignment of the SSR-spanning region coding for three lysine residues within the flgG gene of 41 Paenibacillus spp.
(B) Maximum Likelihood phylogenetic subtree with ancestral sequence reconstruction in codons 42 and 43. Red clades: AAAAAAAAG (3A6A); green clades AAGAAAAAG (3G6A); blue clades AAGAAGAAG (3G6G). Red circle denoting A to G substitution in the third position of codon 42; green circle denoting A to G substitution in the third position of codon 43. Marginal posterior probabilities of ancestral sequences in the internal nodes are provided in Table S5.
To reconstruct the phylogeny of Paenibacillus species harboring the various codons in the KKK sequence of the FlgG protein (codons 42,43 and 44), we used the concatenation alignment of the 92 core genes reported in Na et al.37 We found two different clades containing the stretch of eight adenines (3A6A; Figure S7). To identify the most probable transitions between AAA and AAG in codons 42 and 43, we performed ancestral sequence reconstruction using FastML.38 Probabilistic ancestral sequences values for codon 43 before node 27 were lower than 95% (Table S5), thus we cannot conclude if G→A substitution in codon 43 occurred more than once. However, the analyses strongly suggested that G→A substitution at positions 3 in codon 42 occurred in two independent events on a short evolutionary timescale (Figure 7B-nodes 28 to 29 and nodes 42 to node 43, Table S5). This is consistent with our hypothesis that the shift from the 3G6A to the 3A6A codon of the KKK in the flgG gene holds an adaptive advantage.
The strategic role played by genomic SSRs in the adaptation of microbial populations to environmental challenges can be demonstrated by the vast range of microorganisms found to exhibit such a strategy.9,39 These range from cyanobacteria coping with temporal variations in UV stress in the ocean14 to the adaptation of bacterial pathogens to a novel host.40 Recently, it was even shown that this strategy is exploited by bacteriophages to create phenotypic diversity to overcome bacterial resistance.41 Here we suggest that there is an advantage in maintaining a homopolymeric tract of eight adenines in the 5′ region of a gene coding for a flagellar component. We further suggest that the “value” of the hypermutable spot in the flgG gene of P. glucanolyticus is strengthened by the co-dependency of WT and mutant cells. Specifically, the tradeoff between loss of motility and gained stress resistance in these mutants is minimized because of their ability to “hitch a ride” with their swarming siblings. Importantly, because of the reversible trait of the specific indel mutation, these mutants can serve as seeds for a new generation of WT cells, thus serving as insurance for survival while safekeeping the population’s genetic arsenal. Ways in which rapid adaptations to environmental challenges can occur with minimized compromise to the fitness of the population in a stable environment still remain to be discovered. Overall, our results reveal an important role for a specific hypermutable region in stress adaptation, while highlighting the value of cooperation between mutants and their WT siblings.
Limitations of the study
In the presented study we suggest that the maintenance of the SSR sequence within the flgG gene could serve as a bet-hedging strategy that saves P. glucanolyticus colonies from extinction on exposure to stress. The best way to prove an evolutionary advantage of such a strategy is to show the outcomes of competition assays between populations that can and cannot ‘bet-hedge’, over a range of environments. Theoretically this can be achieved by swapping out the AAA codons for AAG codons in this SSR sequence within the flgG gene, to produce an otherwise isogenic non-bet-hedging strain. Unfortunately, this cannot be done with the studied bacterial species as these cells are not prone to genetic modifications. Keeping this in mind, we have performed numerous assays comparing the growth abilities of the WT and stress-resistant flgG mutant cells, focusing on “extinction events” (i.e., no recuperation) occurring in each strain in response to stress. Our results clearly indicate that the flgG mutant population can withstand stress much better than the WT population. Moreover, because in bet-hedging models what matters is the long-term growth rate, and the best strategy is considered the one that maximizes the growth rate, we think that also our model strongly supports a bet-hedging strategy.
STAR★Methods
Key resources table
| REAGENT or RESOURCE | SOURCE | IDENTIFIER |
|---|---|---|
| Bacterial and virus strains | ||
| Paenibacillus glucanolyticus | DSMZ | DSM-5162 |
| Chemicals, peptides, and recombinant proteins | ||
| Trypsin soy broth (TSB) | Difco Laboratories | Cat#211825 |
| H2O2 30% (w/w) | Sigma-Aldridge | Cat#7722-84-1 |
| Erythromycin | Sigma | Cat#E5389 |
| NaCl | Merck | Cat#1.06404 |
| ATTO-TEC-633 | GmbH | AD-633 |
| PBS | Sartorius | Cat#02-023-1A |
| DMSO | Sigma | Cat#67-68-5 |
| UltraPure™ Agarose | Invitrogen | Cat#16500100 |
| Green Hot Start High-Fidelity 2X Master Mix | Invitrogen | Cat#13001012 |
| Critical commercial assays | ||
| Microbiome DNA Purification kit | Invitrogen™ | Cat#A29790 |
| 300 MESH copper grid | Electron Microscopy Sciences | Cat#CF300CUUL |
| ATP/ADP ratio assay kit | Sigma | Cat#MAK135 |
| QIAquick PCR Purification Kit | Qiagen | Cat#28104 |
| MiSeq Reagent Kit v2 | Illumina | Cat#MS-102-2002 |
| Oligonucleotides | ||
| GGACAATATGGCAAACGTCA | Flg6-F | N/A |
| CGTCCGGTCAAAATCCTTAT | Flg6-R | N/A |
| TCGTCGGCAGCGTCAGATGTGTATAAG AGACAGGGACAATATGGCAAACGTCA |
Flg6-F+Adaptor | N/A |
| GTCTCGTGGGCTCGGAGATGTGTATAA GAGACAGCGTCCGGTCAAAATCCTTAT |
Flg6-R+Adaptor | N/A |
| Software and algorithms | ||
| SPAdes genome assembler v3.11 | http://bioinf.spbau.ru/spades/ | RRID:SCR_000131 |
| QUAST- Version; 5.0.1 | http://bioinf.spbau.ru/quast | RRID: |
| Prokka 1.13.3 | http://www.vicbioinformatics.com/software.prokka.shtml | RRID:SCR_014732 |
| Snippy 4.3.5 | Github | https://github.com/tseemann/snippy |
| Jalview | Jalview | https://www.jalview.org/ |
| Geneious | Geneious by Dotmatics | https://www.geneious.com |
| MAFFT V3.705 | Katoh et al. (2009)42 | https://mafft.cbrc.jp/alignment/server/ |
| RAxML version 8.2.11 | Stamatakis, A. (2014)43 | https://raxml-ng.vital-it.ch/#/ |
| FASTML | Ashkenazy et al., (2012)38 | http://fastml.tau.ac.il/ |
| GraphPad Prism | GraphPad | https://www.graphpad.com/ |
| Python 3.7 | Python Software Foundation | https://www.python.org/downloads/ |
| SeqIO, biopython 1.78 | Anaconda Inc | https://anaconda.org/anaconda/biopython |
| Other | ||
| NCBI web site | https://www.ncbi.nlm.nih.gov/nuccore/CP015286.1?report=fasta | GenBank: CP015286.1 |
Resource availability
Lead contact
Further information and requests for resources and reagents should be directed to and will be fulfilled by Y.H. (yael.helman@mail.huji.ac.il)
Materials availability
This study did not generate new unique reagents.
Experimental model and subject details
Bacterial strains Paenibacillus glucanolyticus DSM 5162 and its mutant (flgGmutant) were grown in liquid tryptic soy broth (TSB) (Difco Laboratories) with 220 rpm shaking, or TSB 1.5% agar (TSA) plates at 32°C.
Methods details
Genome sequencing and annotation
DNA extraction for genome sequencing analysis was carried out using the PureLink™ Microbiome DNA Purification kit (Invitrogen™ Cat. A29790), according to the manufacture’s protocol. Sequencing the genomes of WT and non-swarming P. glucanolyticus colonies was carried out by the next generation sequencing (NGS) Illumina platform at the RRC-Genome Research Division Illinois Chicago University. Sequence assembly, annotation and comparison were performed by the bioinformatics unit of the Hebrew University of Jerusalem as follows: Sequenced reads were quality trimmed with TrimGalore. Clean reads were assembled using SPAdes genome assembler v3.11. Assemblies were inspected by QUAST-Quality Assessment Tool for Genome Assemblies Version; 5.0.1 and annotated using Prokka 1.13.3. Variant identification in non-swarming compared to WT cells was performed by aligning the reads from the non-swarming cells against the assembled WT genome (described above) using snippy 4.3.5 - fast bacterial variant calling from NGS reads (Minimum mapping quality 60, Minimum coverage of variant site 10 and minimum proportion for variant evidence of 0.9).
Growth under stress and survival assays
For growth experiment under exposure to hydrogen peroxide (H2O2), overnight wild-type and flgGmutant cultures (ca.108 CFU/ml) were diluted to optical density value (O.D.600nm) of 0.05 in TSB media with different concentrations of hydrogen peroxide 2-8 mM (H2O2 30% (w/w), Sigma-Aldridge). Growth was measured in 24-well plates with 1 ml TSB medium at 32°C incubation. Optical density (O.D.600nm) was recorded every hour using an automatic microplate reader (Molecular Devices, SpectraMax iD3 Multi-mode Microplate Reader), plate was shaken for 10s before each reading. For growth experiments under exposure to erythromycin or NaCl cells were prepared as above. In experiments examining growth under antibiotic stress the following final concentrations of erythromycin were used (2.5μg/ml; 1.25 μg/ml or 0.63 μg/ml; Sigma Cat. E5389). In experiments examining growth under salinity stress a final concentarion of 3% NaCl was used (Merck Cat. 1.06404). Growth was measured in 96-well plates with 150μl TSB medium at 32°C incubation for 24 hours. Optical density (O.D.600nm) was recorded every hour using an automatic microplate reader (Molecular Devices, SpectraMax iD3 Multi-mode Microplate Reader), plate was shaken for 10s before each reading.
To examine the survival experiments after transient exposure to 8 mM H2O2, 1 ml of overnight wild-type and flgGmutant cultures were washed in phosphate buffer saline (PBS, Sartorius) by centrifugation (6,500g, 5 min) followed by incubation for three hours incubation at 32°C in 1 ml PBS with or without 8mM H2O2. After that, 15 μL of the culture were transferred into 96 well plate containing 135 μL of TSB, and OD was recorded every hour for 50 hat 32°C by an automatic microplate reader (Molecular Devices, SpectraMax iD3 Multi-mode Microplate Reader). In experiments examining survival of mixed wildtype and flgGmutant cultures, both cultures were first grown overnight and washed separately as described above, and then mixed in a ratio of 30% mutant and 70% wildtype.
Swimming plate assay
Swimming of P. glucanolyticus cells was examined using soft tryptic soy agar plates containing 0.3% agar (0.3% TSA). Five microliters of overnight cultures were inoculated at the center of the 0.3% TSA plate, which was incubated at 32°C. The colony’s diameter was measured after 20 hours.
Negative staining transmission electron microscope (TEM)
Paenibacillus glucanolyticus)107CFU/ml(cells from 0.3% agar plates, were suspended in PBS followed by centrifugation at 2500g for 2 min. The bacterial pellet was then fixed in 2.5% Paraformaldehyde by incubation at room temperature for 30 min, followed by additional 30 min incubation at 37°C. Drop-on-the-grid method (DEG) was used as follows: A drop (10μL) of fixed bacterial sample was diluted (1:10). The suspension containing ca 106 CFU/ml bacteria cells was placed directly onto a glow-discharged EM sample support, 300 MESH copper grid, covered with carbon film (Electron Microscopy Sciences, PA, USA). After adsorption for 10 minat room temperature, the grid was washed three times in double-distilled water and negatively stained with 1% phosphotungstic acid, pH 4.5. The grids were examined using a TECNAI T12 FEI (Thermo Fisher, OR, USA) transmission electron microscope operated at 200 kV. Micrographs were recorded using an Erlangsheng 782 ES 500W camera (Gatan, CA, USA). The presence of flagellated cells was examined in 8 different fields for each sample.
Light and fluorescent microscopy imaging
To differentiate between P. glucanolyticus wildtype and flgGmutant cells in microscope analyses, the flgGmutant cells were stained with fluorescent dye as follows: Overnight culture was washed twice with PBS by centrifugation (1 min 6,500g). Mutant cells were stained with a red fluorescent dye (ATTO-TEC GmbH, AD-633) suspended by dissolve dye 1mg in 500μl of dry DMSO according to the manufacturer’s protocol. Briefly, cells were incubated with the dye (1:100) for one-hour at 32°C with 220 rpm shaking, followed by two cycles of washing with PBS. Stained mutants (30%) were mixed with wild-type culture (70%) and 7μl of the cell mixture (107 CFU/ml(was placed in the center of a 1.5% agarose (dissolved in double distilled water) pad slice (1x1cm; 0.75 mm thick) which was laid on top of 1.5% TSA at 32°C. The ratio 30% stained non-swarming cells and 70% swarming WT cells allowed easy visualization of fluorescence cells at the colony’s edge. After six hours agarose pads were removed from the TSA plate and visualized in a Nikon fluorescent microscope magnification x40, with bright field and Texas red 560–630 nm filter.
ATP/ADP measurements
ATP/ADP ratio was determined using the ATP/ADP ratio assay kit (Sigma cat. MAK135). Briefly, overnight cultures were washed three times by centrifugation (4000 rpm) with cold PBS. Pellets were kept on ice and homogenized by three cycles of 25 KP high pressure cell disruption (Constant Systems, CF1 Range Continuous Flow Cell Disrupter, UK). Cell lysates were analyzed according to the manufacturer’s protocol by measuring luminescence using Molecular Devices, SpectraMax iD3 Multi-mode Microplate Reader.
flgG amplicon library preparation and high throughput sequencing (HTS)
Library preparation for HTS was based on the 16S Metagenomic Sequencing Library Preparation protocol (Illumina), optimized by us. The process involved primers with 5′ universal overhang adapter sequences and a locus-specific region (primers Flg6-F+adaptor and Flg6-R+adaptor, Table S1). The amplification included two rounds of PCR; In the first round, DNA templates were amplified using specific primers for the region of interest (Flg6-F and Flg6-R, Table S1), target amplicons length was 106 bp. The PCR parameters were as follows: initial denaturation at 98°C for 1 min, 35 cycles of denaturation at 98°C for 10 sec, annealing at 68°C for 30 sec, and extension at 72°C for 1 minute followed by final extension at 72°C for 5 min. The final single 50 μL PCR reaction contained 1 μL of DNA, 25 μL of Green Hot Start High-Fidelity 2X Master Mix (Invitrogen), 5 μL of a primer mix, 19 μL of molecular grade H2O. The primer mix contained 100 nM of each primer. PCR, products were cleaned using QIAquick PCR Purification Kit (Qiagen) with elution in 25 μL elution buffer. The second-round of PCR targeted the overhang adapters for amplification thereby enriching the specific amplicon libraries for downstream sequencing. Paired-end sequencing of the amplicons libraries was performed using Illumina MiSeq.MiSeq Reagent Kit v2 (300 cycles) in the presence of a 5% PhiX library which was used for QC sequencing control.
Amplicon alignment and analysis
Each sample yielded two Fastq files, the files were analyzed, using a custom python script (Please see supplementary polyA.py file). The trimmed reads were mapped against amplicon-specific reference sequences developed from P. glucanolyticus strain 5162 genomes (GeneBank: CP015286 ). The reads were filtered according to the following criteria: 1) The read must begin with the exact sequence of the forward primer. 2) Illumina quality scores for polyA regions and 5 bases upstream and downstream, must be 30 or greater. Referring to the poly-A segment which consists of 5 bases upstream and downstream of the polyA sequence, the abundance of every existing sequence and the abundance of every existing length of adenine sequence were summed.
Theoretical analysis
To examine how the flgG mutants change the dynamics of the population, we constructed a mathematical model, comprising a population of bacteria with two types of individuals: flgG mutants and WT. We assumed that all individuals reside together at the same site and the state of the environment, , can switch between “good” () and “bad” (). In turn, the growth rate of both WT and flgG mutants depends on the state of the environment, and the WT and mutant differ in their growth rate in each environment. For the WT population, we consider a positive growth rate in a good environment and negative in a bad environment: , , respectively. In turn, the population of flgG mutants is less sensitive to bad conditions – it still declines if the environment is bad, but slower compared to the wildtype population, at a rate . In a good environment, the mutants depend on the population of wildtype that carries them to survive: without the WT, the population of mutants declines even if the environment is good (its growth rate is ). However, since WT can carry the mutants, the presence of WT increases the growth rate of the mutants by times the proportion of the WT in the population. (The growth rate of mutants in the good environment increases linearly from to as the proportion of WT increases.) Finally, we assume that mutations from WT to flgG mutants and vice versa occur at a rate when the environment is good.
Specifically, the dynamics of the wildtype population, , and the flgGmutant population, , are given by
| (Equation 1a) |
| (Equation 1b) |
It remains to specify how the environment switches from good to bad and vice versa. We consider two versions of the model: periodic and stochastic environment. In the periodic environment model, the environment is good for a period of hours, then switches to a good one for hours, then switches back to a bad environment for hours, and so on. We denote as the time of a single period (). In the stochastic model, we consider a Poison process in which the environment may switch from good to bad with probability, , and from bad to good at any moment with probability, , where and are such that the expected duration of each good period is and the expected duration of each bad period is .
We consider parameter ranges that are consistent with the empirical observations. For the wildtype, we consider a positive growth rate in a good environment and negative in a bad environment: , . We consider the range of possible mutation rates to be between 0.00001 and 0.1. This range was chosen based on our NGS results using the Jones median estimator computed by rSalvador package (please see further details in the subsection below). In turn, mutants can survive only due to being carried by the wildtype, and therefore, and . In a bad environment, the population of mutants decline (), but at a rate that is slower than that of the wildtype in that environment ().
Estimation of the mutationrates in the homopolymeric stretch of adenines within the flgGgene
In order to estimate the mutation and reversion rates occurring at the homopolymeric stretch of adenines in the flgG gene, DNA was extracted from five wildtype cultures at the log phase of growth in TSB at 32°C. We measured the proportions of the 8A and 7A in each culture (Table S4), and we used these proportions for obtaining mutation rates by using the Jones median estimator computed by the rSalvador package.44 We note that due to the fact that reverse mutations in the homopolymeric tract of adenines in the flgG gene are not negligible and that there is a selective advantage for the mutants, estimates of mutation/reversion rates cannot be accurate.45 We therefore incorporated in our model a wide range of possible mutation rates (μ = 0.1–0.00001 generation−1) which are relevant to the values obtained in our NGS analyses, as well as in line with values reported in the literature for SSR.46,47,48,49,50
flgG sequence alignment
Protein sequences of 1784 Paenibacillus spp. flagellar hook-basal body proteins were downloaded from NCBI proteins database. Protein sequences were aligned by MAFFT (with default parameters) using the web application https://mafft.cbrc.jp/alignment/server/. Triple K motif was found in 41 sequences. Coding Sequences of those 41 proteins were downloaded from NCBI and aligned to each other by MAFFT. The 3 codons coding for the triple K motif were isolated, ordered by similarity and colored by nucleotide type using Jalview. A consensus CDS sequence of FlgG was generated from that MSA and was further used for FlgG CDS and protein sequences extraction from other bacterial genomes.
Acquisition of FlgG CDS and protein sequences for phylogeny reconstruction
Genome assemblies of the 41 Paenibacillus species which code an FlgG protein containing a triple K motif (from previous section) were downloaded from NCBI, along with other 39 genomes of various Paenibacillus species that were found in the database at the time (species and assembly ids in Table S2).
The consensus sequence of flgG CDS was used for searching the FlgG CDS in each of the 80 genome assemblies using the commercial bioinformatics software Geneious (https://www.geneious.com/). CDS and translated protein of FlgG were extracted from all the 80 genomes and were further used for phylogenetic analysis.
Phylogeny and ancestral sequence reconstruction
UBCG, which is a tool for inferring phylogenetic relationships using a bacterial core gene set was used for extraction and concatenation of sequences of 92 pre-defined genes from each one of the 80 genomes as reported in Na et al.,.37 Concatenated genes from 80 bacteria were aligned using MAFFT V3.70542 with default parameters. The best maximum likelihood (ML) tree was reconstructed by RAxML version 8.2.1143 under the GTR replacement matrix,51 with among-site-rate-variation accounted for by assuming a discrete gamma distribution52 and with rapid bootstraps. The tree was rooted with three Brevibacillus bacteria.
Ancestral tree reconstruction
The FlgG mRNA from the same 80 bacteria was aligned by codon alignment. The phylogenetic tree was used together with codon MSA to estimate branch length and reconstruct marginal ancestral codon sequences using FASTML38 with the empirical codon model.53 Only marginal posterior probabilities above 0.95 were used to indicate where substitutions occurred in the designated region.
Quantification and statistical analysis
Data of biological replicates were reported for all experiments, Prism 8.4.3(GrphPad) was used to conduct Student’s t-test and area under the curve (AUC) calculations. A P-value of <0.05 was considered statistically significant.
Acknowledgments
This work was supported by the Israel Science Foundation Grant #795/17. We thank R. Nechooshtan and A. Monash for their help with the microscope images.
Author contributions
I.H. performed experiments and contributed to data analysis. O.I., G.B., I.P., E.H-C., and Z.H. contributed to data analysis and developed analysis methods. I.H., A.L., and Y.H. conceived the study and research questions, contributed to data analysis, developed analysis methods and wrote the paper.
Decleration of interests
The authors declare no competing interests.
Inclusion and diversity
We support inclusive, diverse, and equitable conduct of research.
Published: January 25, 2023
Footnotes
Supplemental information can be found online at https://doi.org/10.1016/j.isci.2023.106043.
Contributor Information
Adam Lampert, Email: adam.lampert@mail.huji.ac.il.
Yael Helman, Email: yael.helman@mail.huji.ac.il.
Supplemental information
Data and code availability
-
•
This paper analyzes published, publicly available data. The accession numbers for the datasets are listed in the key resources table.
-
•
All original code is available in this paper’s supplemental information.
-
•
Any additional information required to reanalyze the data reported in this paper is available from the lead contact upon request.
References
- 1.Henderson I.R., Owen P., Nataro J.P. Molecular switches--the ON and OFF of bacterial phase variation. Mol. Microbiol. 1999;33:919–932. doi: 10.1046/j.1365-2958.1999.01555.x. [DOI] [PubMed] [Google Scholar]
- 2.Swings T., Van den Bergh B., Wuyts S., Oeyen E., Voordeckers K., Verstrepen K.J., Fauvart M., Verstraeten N., Michiels J. Adaptive tuning of mutation rates allows fast response to lethal stress in. Elife. 2017;6:e22939. doi: 10.7554/eLife.22939. [DOI] [PMC free article] [PubMed] [Google Scholar]
- 3.Mehta H.H., Prater A.G., Beabout K., Elworth R.A.L., Karavis M., Gibbons H.S., et al. The essential role of hypermutation in rapid adaptation to antibiotic stress. Antimicrob. Agents Chemother. 2019;63 doi: 10.1128/AAC.00744-19. e00744–19. [DOI] [PMC free article] [PubMed] [Google Scholar]
- 4.Moxon R., Bayliss C., Hood D. Bacterial contingency loci: the role of simple sequence DNA repeats in bacterial adaptation. Annu. Rev. Genet. 2006;40:307–333. doi: 10.1146/annurev.genet.40.110405.090442. [DOI] [PubMed] [Google Scholar]
- 5.Jiang X., Hall A.B., Arthur T.D., Plichta D.R., Covington C.T., Poyet M., Crothers J., Moses P.L., Tolonen A.C., Vlamakis H., et al. Invertible promoters mediate bacterial phase variation, antibiotic resistance, and host adaptation in the gut. Science. 2019;363:181–187. doi: 10.1126/science.aau5238. [DOI] [PMC free article] [PubMed] [Google Scholar]
- 6.van der Woude M.W. Phase variation: how to create and coordinate population diversity. Curr. Opin. Microbiol. 2011;14:205–211. doi: 10.1016/j.mib.2011.01.002. [DOI] [PubMed] [Google Scholar]
- 7.Coenye T., Vandamme P. Characterization of mononucleotide repeats in sequenced prokaryotic genomes. DNA Res. 2005;12:221–233. doi: 10.1093/dnares/dsi009. [DOI] [PubMed] [Google Scholar]
- 8.Levinson G., Gutman G.A. Slipped-strand mispairing: a major mechanism for DNA sequence evolution. Mol. Biol. Evol. 1987;4:203–221. doi: 10.1093/oxfordjournals.molbev.a040442. [DOI] [PubMed] [Google Scholar]
- 9.Lin W.H., Kussell E. Evolutionary pressures on simple sequence repeats in prokaryotic coding regions. Nucleic Acids Res. 2012;40:2399–2413. doi: 10.1093/nar/gkr1078. [DOI] [PMC free article] [PubMed] [Google Scholar]
- 10.Foster P.L., Niccum B.A., Popodi E., Townes J.P., Lee H., MohammedIsmail W., Tang H. Determinants of base-Pair substitution patterns revealed by whole-genome sequencing of DNA mismatch epair defective. Genetics. 2018;209:1029–1042. doi: 10.1534/genetics.118.301237. [DOI] [PMC free article] [PubMed] [Google Scholar]
- 11.Kashi Y., King D.G. Simple sequence repeats as advantageous mutators in evolution. Trends Genet. 2006;22:253–259. doi: 10.1016/j.tig.2006.03.005. [DOI] [PubMed] [Google Scholar]
- 12.van den Broek D., Bloemberg G.V., Lugtenberg B. The role of phenotypic variation in rhizosphere Pseudomonas bacteria. Environ. Microbiol. 2005;7:1686–1697. doi: 10.1111/j.1462-2920.2005.00912.x. [DOI] [PubMed] [Google Scholar]
- 13.Bayliss C.D., Palmer M.E. Evolution of simple sequence repeat-mediated phase variation in bacterial genomes. Ann. N. Y. Acad. Sci. 2012;1267:39–44. doi: 10.1111/j.1749-6632.2012.06584.x. [DOI] [PubMed] [Google Scholar]
- 14.Osburne M.S., Holmbeck B.M., Frias-Lopez J., Steen R., Huang K., Kelly L., Coe A., Waraska K., Gagne A., Chisholm S.W. UV hyper-resistance in Prochlorococcus MED4 results from a single base pair deletion just upstream of an operon encoding nudix hydrolase and photolyase. Environ. Microbiol. 2010;12:1978–1988. doi: 10.1111/j.1462-2920.2010.02203.x. [DOI] [PMC free article] [PubMed] [Google Scholar]
- 15.Midorikawa T., Narikawa R., Ikeuchi M. A deletion mutation in the spacing within the psaA core promoter enhances transcription in a cyanobacterium Synechocystis sp. PCC 6803. Plant Cell Physiol. 2012;53:164–172. doi: 10.1093/pcp/pcr159. [DOI] [PubMed] [Google Scholar]
- 16.Ben-Jacob E., Cohen I., Gutnick D.L. Cooperative organization of bacterial colonies: from genotype to morphotype. Annu. Rev. Microbiol. 1998;52:779–806. doi: 10.1146/annurev.micro.52.1.779. [DOI] [PubMed] [Google Scholar]
- 17.Vallotton P. Size matters: filamentous bacteria drive interstitial vortex formation and colony expansion in Paenibacillus vortex. Cytometry A. 2013;83:1105–1112. doi: 10.1002/cyto.a.22354. [DOI] [PubMed] [Google Scholar]
- 18.Kobayashi K., Kanesaki Y., Yoshikawa H. Genetic analysis of collective motility of Paenibacillus sp. NAIST15-1. PLoS Genet. 2016;12:e1006387. doi: 10.1371/journal.pgen.1006387. [DOI] [PMC free article] [PubMed] [Google Scholar]
- 19.Fraser G.M., Hughes C. Swarming motility. Curr. Opin. Microbiol. 1999;2:630–635. doi: 10.1016/s1369-5274(99)00033-8. [DOI] [PubMed] [Google Scholar]
- 20.Harshey R.M. Bacterial motility on a surface: many ways to a common goal. Annu. Rev. Microbiol. 2003;57:249–273. doi: 10.1146/annurev.micro.57.030502.091014. [DOI] [PubMed] [Google Scholar]
- 21.Kearns D.B. A field guide to bacterial swarming motility. Nat. Rev. Microbiol. 2010;8:634–644. doi: 10.1038/Nrmicro2405. [DOI] [PMC free article] [PubMed] [Google Scholar]
- 22.Butler M.T., Wang Q., Harshey R.M. Cell density and mobility protect swarming bacteria against antibiotics. Proc. Natl. Acad. Sci. USA. 2010;107:3776–3781. doi: 10.1073/pnas.0910934107. [DOI] [PMC free article] [PubMed] [Google Scholar]
- 23.Yan J., Monaco H., Xavier J.B. The ultimate guide to bacterial swarming: an experimental model to study the evolution of cooperative behavior. Annu. Rev. Microbiol. 2019;73:293–312. doi: 10.1146/annurev-micro-020518-120033. [DOI] [PMC free article] [PubMed] [Google Scholar]
- 24.Ottemann K.M., Miller J.F. Roles for motility in bacterial-host interactions. Mol. Microbiol. 1997;24:1109–1117. doi: 10.1046/j.1365-2958.1997.4281787.x. [DOI] [PubMed] [Google Scholar]
- 25.Mrázek J., Guo X., Shah A. Simple sequence repeats in prokaryotic genomes. Proc. Natl. Acad. Sci. USA. 2007;104:8472–8477. doi: 10.1073/pnas.0702412104. [DOI] [PMC free article] [PubMed] [Google Scholar]
- 26.Orsi R.H., Bowen B.M., Wiedmann M. Homopolymeric tracts represent a general regulatory mechanism in prokaryotes. BMC Genom. 2010;11:102. doi: 10.1186/1471-2164-11-102. [DOI] [PMC free article] [PubMed] [Google Scholar]
- 27.Kearns D.B., Chu F., Rudner R., Losick R. Genes governing swarming in Bacillus subtilis and evidence for a phase variation mechanism controlling surface motility. Mol. Microbiol. 2004;52:357–369. doi: 10.1111/j.1365-2958.2004.03996.x. [DOI] [PubMed] [Google Scholar]
- 28.Atkinson S., Chang C.Y., Sockett R.E., Cámara M., Williams P. Quorum sensing in Yersinia enterocolitica controls swimming and swarming motility. J. Bacteriol. 2006;188:1451–1461. doi: 10.1128/Jb.188.4.1451-1641.2006. [DOI] [PMC free article] [PubMed] [Google Scholar]
- 29.Daniels R., Vanderleyden J., Michiels J. Quorum sensing and swarming migration in bacteria. FEMS Microbiol. Rev. 2004;28:261–289. doi: 10.1016/j.femsre.2003.09.004. [DOI] [PubMed] [Google Scholar]
- 30.Hong Y., Zeng J., Wang X., Drlica K., Zhao X. Post-stress bacterial cell death mediated by reactive oxygen species. Proc. Natl. Acad. Sci. USA. 2019;116:10064–10071. doi: 10.1073/pnas.1901730116. [DOI] [PMC free article] [PubMed] [Google Scholar]
- 31.Zhao X., Drlica K. Reactive oxygen species and the bacterial response to lethal stress. Curr. Opin. Microbiol. 2014;21:1–6. doi: 10.1016/j.mib.2014.06.008. [DOI] [PMC free article] [PubMed] [Google Scholar]
- 32.Martínez-García E., Nikel P.I., Chavarría M., de Lorenzo V. The metabolic cost of flagellar motion in Pseudomonas putida KT2440. Environ. Microbiol. 2014;16:291–303. doi: 10.1111/1462-2920.12309. [DOI] [PubMed] [Google Scholar]
- 33.Kearns D.B., Losick R. Swarming motility in undomesticated Bacillus subtilis. Mol. Microbiol. 2003;49:581–590. doi: 10.1046/j.1365-2958.2003.03584.x. [DOI] [PubMed] [Google Scholar]
- 34.Fontana C., Lambert A., Benaroudj N., Gasparini D., Gorgette O., Cachet N., Bomchil N., Picardeau M. Analysis of a spontaneous non-motile and avirulent mutant shows that FliM is required for full endoflagella assembly in Leptospira interrogans. PLoS One. 2016;11:e0152916. doi: 10.1371/journal.pone.0152916. [DOI] [PMC free article] [PubMed] [Google Scholar]
- 35.Ren D., Sims J.J., Wood T.K. Inhibition of biofilm formation and swarming of Bacillus subtilis by (5Z)-4-bromo-5-(bromomethylene)-3-butyl-2(5H)-furanone. Lett. Appl. Microbiol. 2002;34:293–299. doi: 10.1046/j.1472-765x.2002.01087.x. [DOI] [PubMed] [Google Scholar]
- 36.Zuo W., Wu Y. Dynamic motility selection drives population segregation in a bacterial swarm. Proc. Natl. Acad. Sci. USA. 2020;117:4693–4700. doi: 10.1073/pnas.1917789117. [DOI] [PMC free article] [PubMed] [Google Scholar]
- 37.Na S.I., Kim Y.O., Yoon S.H., Ha S.M., Baek I., Chun J. UBCG: up-to-date bacterial core gene set and pipeline for phylogenomic tree reconstruction. J. Microbiol. 2018;56:280–285. doi: 10.1007/s12275-018-8014-6. [DOI] [PubMed] [Google Scholar]
- 38.Ashkenazy H., Penn O., Doron-Faigenboim A., Cohen O., Cannarozzi G., Zomer O., Pupko T. FastML: a web server for probabilistic reconstruction of ancestral sequences. Nucleic Acids Res. 2012;40:W580–W584. doi: 10.1093/nar/gks498. [DOI] [PMC free article] [PubMed] [Google Scholar]
- 39.Norman T.M., Lord N.D., Paulsson J., Losick R. Stochastic switching of cell fate in microbes. Annu. Rev. Microbiol. 2015;69:381–403. doi: 10.1146/annurev-micro-091213-112852. [DOI] [PubMed] [Google Scholar]
- 40.Jerome J.P., Bell J.A., Plovanich-Jones A.E., Barrick J.E., Brown C.T., Mansfield L.S. Standing genetic variation in contingency loci drives the rapid adaptation of Campylobacter jejuni to a novel host. PLoS One. 2011;6:e16399. doi: 10.1371/journal.pone.0016399. [DOI] [PMC free article] [PubMed] [Google Scholar]
- 41.Sørensen M.C.H., Vitt A., Neve H., Soverini M., Ahern S.J., Klumpp J., Brøndsted L. Campylobacter phages use hypermutable polyG tracts to create phenotypic diversity and evade bacterial resistance. Cell Rep. 2021;35:109214. doi: 10.1016/j.celrep.2021.109214. [DOI] [PubMed] [Google Scholar]
- 42.Katoh K., Asimenos G., Toh H. Multiple alignment of DNA sequences with MAFFT. Methods Mol. Biol. 2009;537:39–64. doi: 10.1007/978-1-59745-251-9_3. [DOI] [PubMed] [Google Scholar]
- 43.Stamatakis A. RAxML version 8: a tool for phylogenetic analysis and post-analysis of large phylogenies. Bioinformatics. 2014;30:1312–1313. doi: 10.1093/bioinformatics/btu033. [DOI] [PMC free article] [PubMed] [Google Scholar]
- 44.Zheng Q. rSalvador: an R package for the fluctuation experiment. G3 (Bethesda) 2017;7:3849–3856. doi: 10.1534/g3.117.300120. [DOI] [PMC free article] [PubMed] [Google Scholar]
- 45.Foster P.L. Methods for determining spontaneous mutation rates. Methods Enzymol. 2006;409:195–213. doi: 10.1016/S0076-6879(05)09012-9. [DOI] [PMC free article] [PubMed] [Google Scholar]
- 46.Lynch M. Evolution of the mutation rate. Trends Genet. 2010;26:345–352. doi: 10.1016/j.tig.2010.05.003. [DOI] [PMC free article] [PubMed] [Google Scholar]
- 47.Long H., Miller S.F., Williams E., Lynch M. Specificity of the DNA mismatch repair system (MMR) and mutagenesis bias in bacteria. Mol. Biol. Evol. 2018;35:2414–2421. doi: 10.1093/molbev/msy134. [DOI] [PMC free article] [PubMed] [Google Scholar]
- 48.Lynch M., Sung W., Morris K., Coffey N., Landry C.R., Dopman E.B., Dickinson W.J., Okamoto K., Kulkarni S., Hartl D.L., Thomas W.K. A genome-wide view of the spectrum of spontaneous mutations in yeast. Proc. Natl. Acad. Sci. USA. 2008;105:9272–9277. doi: 10.1073/pnas.0803466105. [DOI] [PMC free article] [PubMed] [Google Scholar]
- 49.Vinces M.D., Legendre M., Caldara M., Hagihara M., Verstrepen K.J. Unstable tandem repeats in promoters confer transcriptional evolvability. Science. 2009;324:1213–1216. doi: 10.1126/science.1170097. [DOI] [PMC free article] [PubMed] [Google Scholar]
- 50.van Belkum A., Scherer S., van Alphen L., Verbrugh H. Short-sequence DNA repeats in prokaryotic genomes. Microbiol. Mol. Biol. Rev. 1998;62:275–293. doi: 10.1128/MMBR.62.2.275-293.1998. [DOI] [PMC free article] [PubMed] [Google Scholar]
- 51.Guindon S., Gascuel O. A simple, fast, and accurate algorithm to estimate large phylogenies by maximum likelihood. Syst. Biol. 2003;52:696–704. doi: 10.1080/10635150390235520. [DOI] [PubMed] [Google Scholar]
- 52.Yang Z. Maximum likelihood phylogenetic estimation from DNA sequences with variable rates over sites: approximate methods. J. Mol. Evol. 1994;39:306–314. doi: 10.1007/BF00160154. [DOI] [PubMed] [Google Scholar]
- 53.Schneider A., Cannarozzi G.M., Gonnet G.H. Empirical codon substitution matrix. BMC Bioinf. 2005;6:134. doi: 10.1186/1471-2105-6-134. [DOI] [PMC free article] [PubMed] [Google Scholar]
Associated Data
This section collects any data citations, data availability statements, or supplementary materials included in this article.
Supplementary Materials
Data Availability Statement
-
•
This paper analyzes published, publicly available data. The accession numbers for the datasets are listed in the key resources table.
-
•
All original code is available in this paper’s supplemental information.
-
•
Any additional information required to reanalyze the data reported in this paper is available from the lead contact upon request.