

Abstract
Background
Cetuximab, a monoclonal antibody targeting epidermal growth factor receptor (EGFR), is effective for RAS wild-type metastatic colorectal cancer (mCRC) patients. However, cetuximab resistance often occur and the mechanism has not been fully elucidated. The purpose of this study was to investigate the role of asparaginyl endopeptidase (AEP) in cetuximab resistance.
Methods
Differentially expressed genes between cetuximab responders and non-responders were identified by analyzing the gene expression profile GSE5851, retrieved from Gene Expression Omnibus (GEO). The potential genes were further validated in cetuximab-resistant CRC cell lines. The expression of AEP in the peripheral blood and tumor tissues of mCRC patients in our hospital were detected by enzyme-linked immunosorbent assay (ELISA) and immunohistochemistry, respectively. The survival analysis was carried out by Kaplan–Meier method. The function and associated pathways of AEP were further investigated by lentivirus transfection, CCK8 assay, colony formation assay, real-time polymerase chain reaction (qPCR) and western blot.
Results
Through bioinformatics analysis, we found that the expression of AEP gene was related to progress free survival (PFS) of mCRC patients treated with cetuximab alone (P = 0.00133). The expression of AEP was significantly higher in the cetuximab-resistant CRC cell lines, as well as in mCRC patients with shorter PFS treated with cetuximab-containing therapy. Furthermore, AEP could decrease the sensitivity of CRC cells to cetuximab in vitro. And the phosphorylation level of MEK and ERK1/2 was increased in AEP overexpression cells. The downregulation of AEP using specific inhibitors could partially restore the sensitivity of CRC cells to cetuximab.
Conclusion
The higher expression of AEP could contribute to the shorter PFS of cetuximab treatment in mCRC. The reason might be that AEP could promote the phosphorylation of MEK/ERK protein in the downstream signal pathway of EGFR.
Supplementary Information
The online version contains supplementary material available at 10.1007/s12094-022-02986-6.
Keywords: Metastatic colorectal cancer, Cetuximab, Resistance, Asparaginase endopeptidase
Introduction
Colorectal cancer (CRC) is one of the most common malignant tumors worldwide [1]. Among them, 40–50% patients had metastasis at the time of initial diagnosis, so the treatment of metastatic CRC (mCRC) is particularly crucial. Over the past decade, monoclonal antibodies targeting epidermal growth factor receptor (EGFR), such as cetuximab and panitumumab, have obviously improved overall survival and disease control in mCRC [2–4]. The combinations of cetuximab and chemotherapeutic regimens, such as FOLFIRI, FOLFOX or FOLFOXIRI, have been the most important strategies for the treatment of RAS wild-type mCRC [2, 5, 6]. However, resistance often occur in less than nine months after cetuximab treatment. A number of genetic mutations were found to contribute to the resistance [7–9], including mutation of RAS [10–13], BRAF [12, 14], PIK3CA [12, 15] and amplification of HER2 [16] and MET [17]. Despite these biomarkers, additional mechanisms of resistance to EGFR blockade are thought to exist in mCRC.
Asparaginyl endopeptidase (AEP), also known as legumain (LGMN), is a member of the C13 cysteine protease family [18]. The inactive precursor of AEP can be self-activated in acidic environment to become an active mature enzyme, which mainly exists in the introsome or lysosome. In recent years, it is reported that AEP is also expressed in cytoplasm and nucleus [19, 20]. Many studies have shown that the expression of AEP increased in various tumors [21], such as breast cancer [22], ovarian cancer [23], colorectal cancer [20], gastric cancer [24, 25] and glioblastoma [26]. Furthermore, the higher level of AEP indicated poorer prognosis and shorter survival in these patients. However, the mechanism has not been elucidated.
Through the Gene Expression Omnibus (GEO) database, using the baseline gene expression profile (GSE5851) of KRAS wild-type mCRC patients before cetuximab treatment, we found that the level of AEP was closely related to the progression free survival (PFS) (P = 0.00133). Patients with higher AEP had shorter PFS. The purpose of current study was to further validate the role of AEP in cetuximab resistance in mCRC.
Methods
Microarray profile analysis from gene expression omnibus (GEO) database
The gene expression profile GSE5851 was downloaded from the GEO database. GSE5851 contained 80 KRAS wide-type mCRC patients who were enrolled for treatment with cetuximab monotherapy [27]. The microarrays were conducted by Affymetrix GeneChip Scanner 3000 with GPL571 using pre-treatment tumor tissue samples. Statistical analyses were performed using quantile normalized signal intensity values. Univariate analysis to compare gene expression profiles according to clinical response was performed using a two-sided unequal variance t test. P value < 0.05 was considered significant.
Patients
Forty-four mCRC patients treated in our department from August 2016 to April 2017 and provided informed consent for their biological samples to be use in future research. The patients were all histologically diagnosed with advanced or metastatic RAS wide-type colorectal adenocarcinoma with no previous palliative therapy. All of them received first-line treatment with chemotherapy plus cetuximab. Tumor tissue samples were collected before treatment. The study was approved by Ethics Committee of Zhongshan Hospital Affiliated to Fudan University.
Cell culture
Caco2 and NCI-H508 cell line was obtained from Cell Bank of the Chinese Academy of Sciences (Shanghai, China). Caco2 cells were cultured in Dulbecco’s Modified Eagle’s Medium (Gibco, USA) containing 10% FBS (Gibco, USA) and 1% penicillin/streptomycin (Invitrogen, USA). NCI-H508 cells were maintained in RMPI-1640 medium (Gibco, USA) supplemented with 10% FBS and 1% penicillin/streptomycin in a 5% CO2 humidified atmosphere at 37 °C. In order to verify the role of AEP or MEK/ERK pathways, AEP inhibitors (AEPI, obtained from Lin [26]) or MEK inhibitors U0126 (Cell Signaling Technology, 9903) were used for cell intervention.
Cetuximab-resistant CRC cells establishment
NCI-H508 cells, known as cetuximab-sensitive CRC cells, were continuously exposed to increasing concentrations of cetuximab for 6 months. The IC50 value for cetuximab of NCI-H508 cells was about 1 μg/mL. The drug dose was progressively increased to 10 μg/mL in approximately 2 months, to 50 μg/mL after other 2 months, and finally, to 100 μg/mL after additional 2 months. The established cetuximab-resistant NCI-H508 cell line (NCI-H508-CR) was then maintained in continuous culture with this maximally achieved dose of cetuximab that allowed cellular proliferation.
Cell proliferation assay
For cell proliferation assay, the viability of CRC cell lines was determined by Cell Counting Kit 8 (CCK8) (Dojindo, Japan) and measured at OD450 nm with the BioTek Gen5 system (BioTeck, USA). For clonogenic assay, cells were plated in 6-well plates with 2 ml media. Media was changed every 3 to 4 days. After 7–10 days, colonies were fixed in 80% methanol and stained with 0.1% crystal violet.
Real-time polymerase chain reaction (qPCR)
RNA isolation was performed using the TRIZOL reagent (Invitrogen, USA). The cDNA was prepared using an oligo (dT) primer (Supplement Table 1) and reverse transcriptase (Takara, Shiga, Japan) following standard protocols. Quantitative real-time polymerase chain reaction (qRT-PCR) was performed using SYBR Green on the ABI 7500 real-time PCR System (Applied Biosystems, Foster City, CA). Relative expression was presented using the 2−ΔCt method [ΔCt = Ct (chemokine) − Ct (beta-actin)].
Western blot
Cell samples were collected and lysed in RIPA buffer with protease inhibitor cocktails. Total cell protein extracts (20 µg/lane) were subjected to SDS-PAGE analysis. The membrane was blocked with 5% milk in TBST before incubation in the following antibody overnight at 4 °C, AEP antibody (R&D Systems, AF2199) or EGFR antibody (Cell Signaling Technology, 2085), phosphor-EGFR antibody (Cell Signaling Technology, 3777), MEK1/2 (Cell Signaling Technology, 4694), phosphor-MEK1/2 (Cell Signaling Technology, 9154), ERK1/2 (Cell Signaling Technology, 4695), phosphor-ERK1/2 (Cell Signaling Technology, 4370), beta-actin (Cell Signaling Technology, 3700). The membranes were washed with TBST and incubated with the secondary antibodies (Santa Cruz Biotechnology). The immunoreactive proteins were visualized by chemiluminescence reagents (ECL; Amersham Biosciences).
ELISA
Levels of AEP protein in the cell supernatant were determined using ELISA kit (R&D Systems, DY4769) in accordance with the protocol provided by the manufacturer. Briefly, samples and standards were added in a 96-well polystyrene microplate coated with diluted AEP capture antibody and incubated for 2 h. The plates were washed, added with AEP detection antibody, and incubated for 2 h. The working dilution was added after washing twice. Cover the plate and incubate for 20 min at room temperature. Substrate solution was added to each well and incubate for 20 min at room temperature. The reaction was terminated with stop solution. Then, determine the optical density of each well immediately, using a microplate reader set to 450 nm.
Immunohistochemistry
Slides were routinely de-paraffinizated and rehydrated, and then heated at 98 °C in a citrate buffer for 20 min and cooled naturally to room temperature. Sections were incubated in 0.3% hydrogen peroxide for 20 min and blocked with 5% normal horse serum in PBS for 30 min. AEP antibody (R&D Systems, AF2199) was added for incubating overnight at 4 °C, then stained using a highly sensitive streptavidin–biotin–peroxidase detection system and counterstained with hematoxylin.
Lentiviral vector transfection
The target sequences for AEP shRNAs were 5′-gatccGATGGTGTTCTACATTG-AATTCAAGAGATTCAATGTAGAACACCATCTTTTTTg-3′ (AEP-KD1) and 5′-gatccAAACTGATGAACACCAATGATTTCAAGAGAATCATTGGTGTTCATCAGTTTTTTTTTg-3′ (AEP-KD2). After 48 h, the efficiency of AEP knockdown was confirmed via western blot and ELISA. Lentiviral vectors for human AEP-shRNA carrying a green fluorescent protein (GFP) sequence were constructed by Hanyin Co. (Shanghai, China). To obtain the stable AEP knockdown cell line, cells were seeded in six-well dishes at a density of 2 × 10⁵ cells per well. The cells were then infected with the same titer virus with 8 μg/ml polybrene on the following day. Approximately 72 h after viral infection, GFP expression was confirmed under a fluorescence microscope, and the culture medium was replaced with selection medium containing 4 μg/ml puromycin. The cells were then cultured for at least 14 days. The puromycin-resistant cell clones were isolated, amplified in medium containing 2 μg/ml puromycin for seven to nine days, and transferred to a medium without puromycin. The clones were designated as AEP-KD or NC cells.
Colony formation experiment
Cells were seeded in six-well dishes at a density of 1000 cells per well and cultured at 37 °C, 5% CO2. When clones were visible, the culture was stopped. The supernatant was removed by vacuum pump. 80% methanol was added at room temperature for 20 min. Crystal violet staining solution was added dropwise, and the colonies were counted by software image J.
Immunofluorescence assay
Cells fixed on coverslips were treated with the AEP antibody (R&D Systems, AF2199) and secondary antibodies conjugated with Alexa Fluor-488 (Abcam). Then, coverslips were washed with PBS, stained with 4′, 6-diamidino-2-phenylindole (DAPI, Yeasen, China), and evaluated using laser confocal microscopy (Leica TCS SP5 II, Wetzlar, Germany).
Statistical analysis
The median PFS was calculated by Kaplan–Meier survival analysis, and its significance was evaluated by log rank test. The data results of continuous variables were expressed by mean ± standard deviation, and the difference between the two groups was analyzed by t test. P value of < 0.05 was considered statistically significant. SPSS 24 software was used for statistical analysis.
Results
Identification of differentially expressed genes (DEGs)
A total of 1002 DEGs were identified from GSE5851 data set. Among them, 343 genes were upregulated in non-responders of cetuximab in mCRC. The top 100 upregulated genes are shown in Supplement Table 2. By searching previous literature, eight candidate genes (Fig. 1) were identified which were closely related to tumor development. Among them, the expression of asparaginyl endopeptidase gene (LGMN) was significantly related to the progression free survival (PFS) (P = 0.00133) (Fig. 1). Patients with higher LGMN expression had shorter PFS of cetuximab.
Fig. 1.

Identification of differentially expressed genes. Eight candidate genes upregulated in cetuximab non-responders. The expression of asparaginyl endopeptidase gene (LGMN) was significantly related to the progression free survival (PFS) (P = 0.00133)
AEP increased in cetuximab-resistant cells
CCK8 assay and colony formation assay were used to verify the function of cetuximab-resistant cells. We found that the proliferation and colony formation of NCI-H508-CR cells after treatment with cetuximab did not decrease, compared with its parallel NCI-H508 cells (Fig. 2A–C). Eight candidate genes were identified by qPCR in these cells. The results showed that the expression of AEP gene in NCI-H508-CR cells was significantly higher than that in NCI-H508 cells (P < 0.01), while there was no significant difference in the expression levels of other seven genes (Fig. 2D). Also, the expression of AEP protein in NCI-H508-CR cells was significantly elevated as shown in the results of western blot and ELISA (P < 0.01) (Fig. 2E, F). Data of immunofluorescence staining and confocal microscopy indicated that cytoplasmic localization of AEP was increased in NCI-H508-CR cells (Fig. 2G).
Fig. 2.

AEP increased in cetuximab-resistant cells and patients. A CCK8 assay showed that the proliferation of NCI-H508-CR cells after cetuximab intervention did not decrease. B, C Number of colonies did not decrease in NCI-H508-CR cells after cetuximab intervention. D Eight candidate genes were identified by qPCR in NCI-H508-CR cells (**P < 0.01). E, F AEP expression results of western blot and ELISA (**P < 0.01). G Subcellular localization of AEP was assessed by immunofluorescence staining (100×). H Expression level of AEP in tumor tissue detected by immunohistochemistry (10× , 40×). I, J The median PFS of patients with high expression of AEP was shorter than that of patients with low expression of AEP in tissue (Figure I: 6 months vs 10 months, P = 0.0023) and in serum (Figure J: 6.35 months vs 9.7 months, P = 0.0055)
AEP increased in cetuximab-resistant patients
From August 2016 to April 2017, tissue and serum samples from 44 patients with mCRC treated with cetuximab-containing therapy in our department were collected and detected by immunohistochemistry and ELISA, respectively. The baseline characteristics are shown in Table 1. The immunohistochemical scoring was defined as follows: according to the staining intensity, it could be divided into 0 (no staining), 1 (light staining), 2 (moderate staining) and 3 (strong staining); according to the staining area, it could be divided into 1 point (≤ 25%), 2 points (> 25%, ≤ 50%), 3 points (> 50%, ≤ 75%), 4 points (> 75%). Multiply the scores of staining intensity and staining area, and the product was between 0 and 12 points. 0–6 was defined as low expression, and 7–12 was defined as high expression (Fig. 2H). The median level of serum AEP expression was 218.35 pg/ml, ranging from 101.67 to 423.33 pg/ml. Taking the median level as the cut-off, the expression level of AEP was divided into high expression (> 218.35 pg/ml) and low expression (≤ 218.35 pg/ml). The results showed that the expression of AEP in tumor tissues or serum was closely related to PFS (Fig. 2I, J). The median PFS of patients with high expression of AEP was shorter than that of patients with low expression of AEP (tissue: 6 months vs 10 months, P = 0.0023; serum: 6.35 months vs 9.7 months, P = 0.0055).
Table 1.
Baseline characteristics of patients
| Baseline characteristics | N (%) (N = 44) |
|---|---|
| Age, n (%) | |
| ≤ 60 | 22 (50) |
| > 60 | 22 (50) |
| Gender, n (%) | |
| Male | 30 (68.2) |
| Female | 14 (31.8) |
| ECOG PS, n (%) | |
| 0 | 11 (25) |
| 1 | 33 (75) |
| Number of metastatic organs | |
| Single | 14 (31.8) |
| Multiple | 30 (68.2) |
| Treatment | |
| E + FOLFIRI | 26 (59.1) |
| E + FOLFOX | 18 (40.9) |
Knockdown of AEP restore the sensitivity of cetuximab
Results of western blot and ELISA in Caco2 and NCI-H508 cells showed that the expression of AEP in AEP-KD group was significantly decreased (Fig. 3A, B). Cells was treated with a series of concentration of cetuximab for 48 h (0–250 μg/ml in Caco2 cells and 0–50 μg/ml in NCI-H508 cells). CCK8 assay showed that the proliferation of AEP-KD cells was significantly decreased than that of the control group (AEP-NC cells) after cetuximab intervention (P < 0.001) (Fig. 3C), the same as the results of colony formation assay (P < 0.001) (Fig. 3D). However, the proliferation and colony formation of AEP-OE cells did not change obviously. The AEP-OE cells were treated with AEP inhibitor (20 μM or 40 μM) for different hours, and the proliferation was significantly decreased after cetuximab intervention (Fig. 3E). The results showed that AEP inhibitor could partially restore the sensitivity to cetuximab in AEP-OE cells.
Fig. 3.
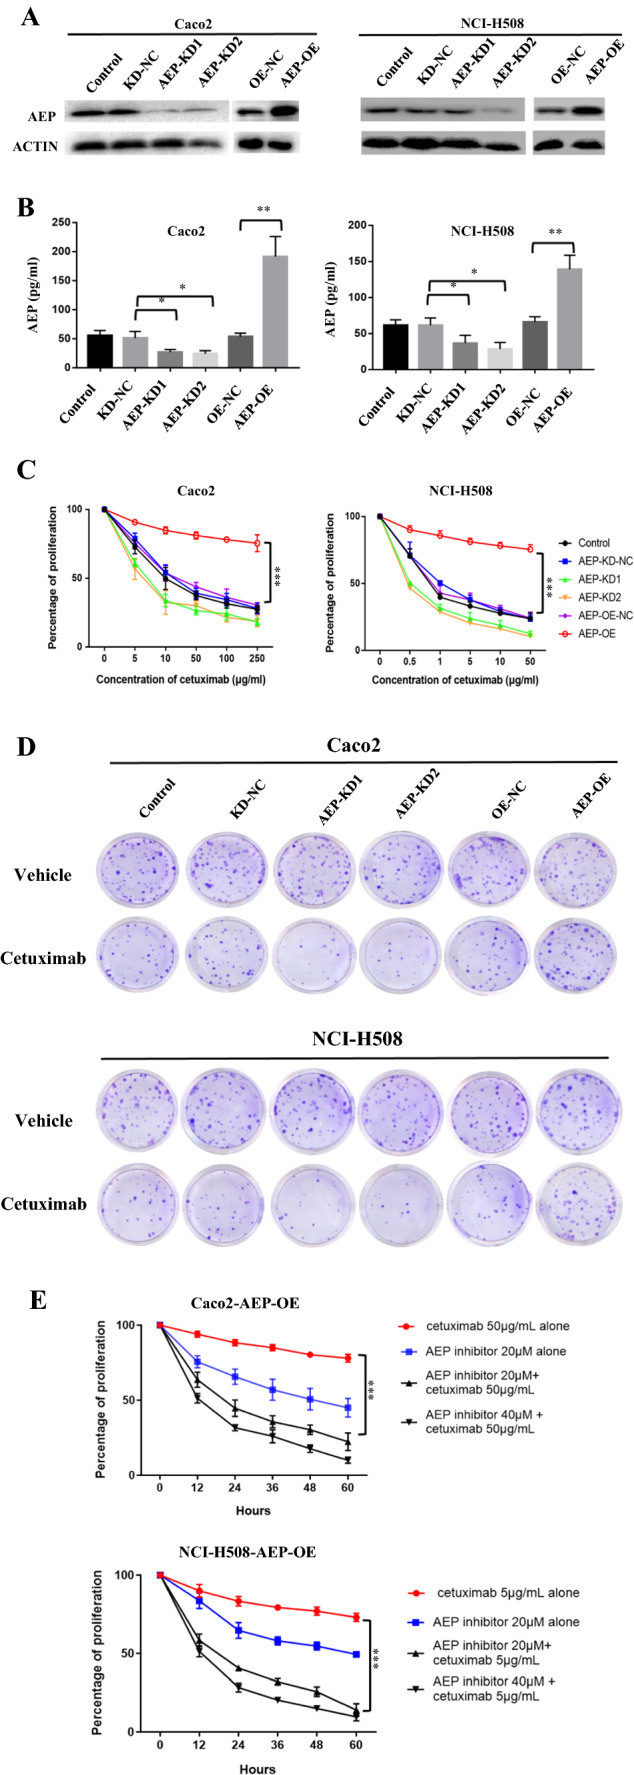
Knockdown of AEP restore the sensitivity of cetuximab. A Western blot and B ELISA in Caco2 and NCI-H508 cells showed that the expression of AEP in AEP-KD group was significantly decreased (*P < 0.05, **P < 0.01). C CCK8 assay showed that the proliferation of AEP-KD cells was significantly decreased than that of the control group (AEP-NC cells) after cetuximab intervention for 48 h (0–250 μg/ml in Caco2 cells and 0–50 μg/ml in NCI-H508 cells) (***P < 0.001). D The colony formation of AEP-KD cells was also significantly decreased after cetuximab intervention (Caco2 cell with 50 μg/mL cetuximab intervention for 48 h and NCI-H508 cell with 5 μg/mL cetuximab intervention for 48 h. E The proliferation of AEP-OE cells was significantly decreased after AEP inhibitor and cetuximab intervention (***P < 0.001)
Phosphorylation of MEK/ERK in AEP-OE cells
The results of Western blot showed that the phosphorylation level of MEK and ERK 1/2 increased in AEP-OE cells (Fig. 4A). As shown in Fig. 4B, ERK specific inhibitor, U0126, significantly inhibited the phosphorylation of ERK. The AEP-OE cells were treated with U0126 (10 μM or 20 μM) for different hours, and the proliferation was significantly decreased after cetuximab intervention (Fig. 4C). The results showed that ERK inhibitors could also restore the sensitivity to cetuximab in AEP-OE cells. The colony formation of AEP-OE cells was also significantly decreased after cetuximab and U0126 intervention (Fig. 4D).
Fig. 4.
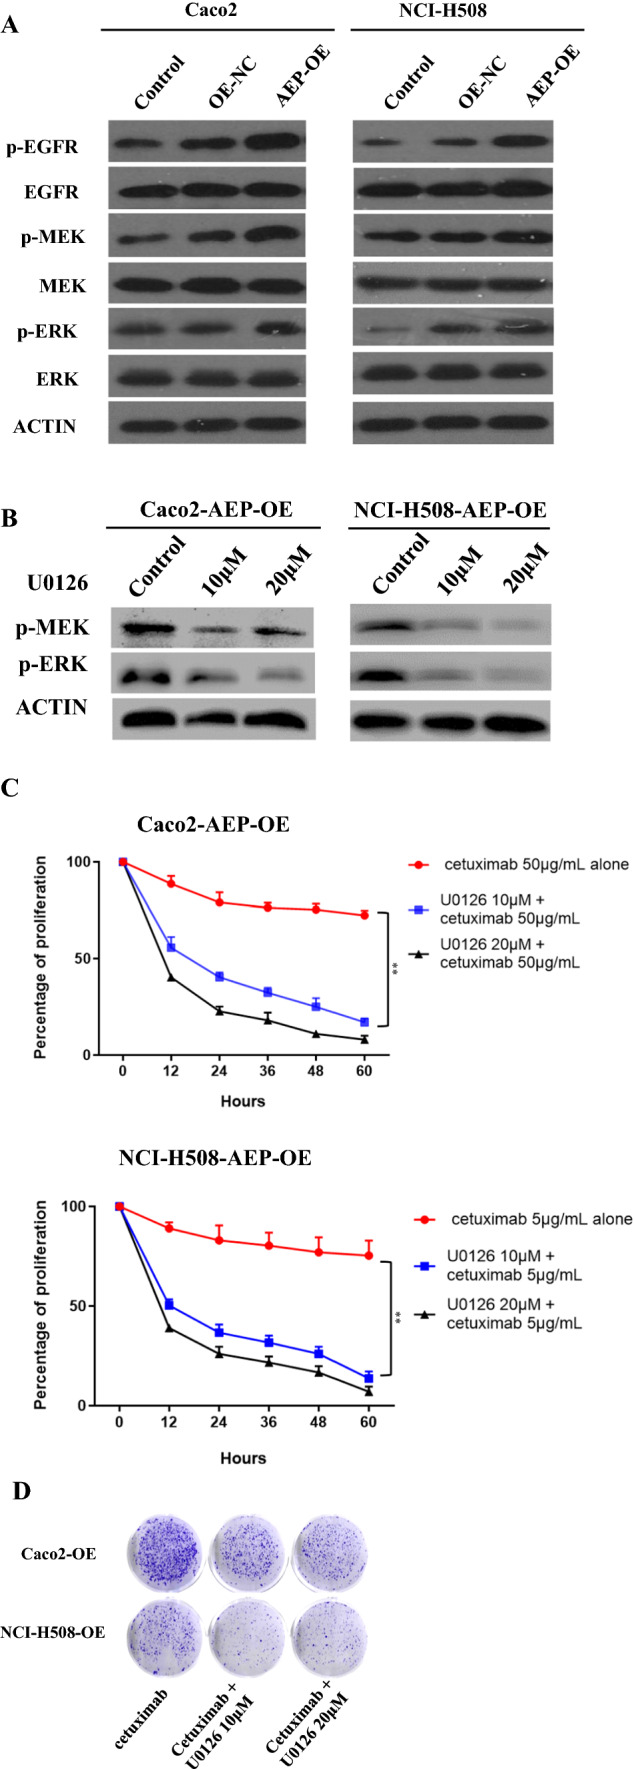
Phosphorylation of MEK/ERK in AEP-OE cells. A Western blot showed that the phosphorylation level of MEK and ERK 1/2 increased in AEP-OE cells. B ERK inhibitor inhibited the phosphorylation of ERK. C The proliferation of AEP-OE cells treated with U0126 was significantly decreased after cetuximab intervention (**P < 0.01). D The colony formation of AEP-OE cells was also significantly decreased after cetuximab and U0126 intervention
Discussion
In this study, we identified differentially expressed genes between cetuximab responders and non-responders by analyzing the gene expression profile GSE5851, retrieved from Gene Expression Omnibus (GEO). We found that the expression level of AEP was closely related to the PFS of cetuximab treatment.
The GSE5851 profile was reported in 2007 [27], containing 80 KRAS wide-type mCRC patients who were enrolled for cetuximab monotherapy. Therefore, it is a very suitable database for analysis of biomarkers for cetuximab. Over the past decade, the combinations of cetuximab and chemotherapeutic regimens have been the standard treatment of RAS wild-type mCRC [2, 5, 6], and few patients are treated with cetuximab monotherapy in clinic practice. As a result, cetuximab resistance research have been interfered by the addition with chemotherapeutic drugs. Based on the cetuximab-sensitive cell line NCI-H508, we established its parallel cetuximab-resistant cell line NCI-H508-CR by continuous exposure of cetuximab as described in previous report [28], to further explore the resistant mechanism in vitro.
Since 2003, it has been well established that AEP is widely expressed in various cancers, such as glioblastoma [26], esophageal cancer [29], breast cancer [22], ovarian cancer [23]. High AEP expression was associated with progression and poor prognosis and considered as a potential therapeutic target. Down-regulation of AEP significantly reduced the migration and invasion ability of cancer cells [30]. In colorectal cancer, a study [20] showed that AEP was highly expressed in tumor and stromal cells and could be detected in nucleus in 30% of tumors. Higher AEP expression was associated with shorter overall survival and metastasis free survival. In glioblastoma patients [26], overexpression of AEP promoted tumorigenesis and shortened the survival time. Knock down or pharmacological inhibition of AEP reduced tumorigenesis and prolonged survival in murine models. Our previous study also found that metastatic gastric cancer patients with low expression of AEP achieved more complete response or partial response after chemotherapy [31]. Therefore, AEP may not only be an independent indicator of poor prognosis, but also be involved in the occurrence of drug resistance. The current study focused on the relationship between AEP and cetuximab resistance in colorectal cancer. First, we verified the higher cytoplasmic expression of AEP in cetuximab-resistant cells compared with sensitive cells in vitro. Then, we found that the higher expression of AEP indicated the shorter PFS in the mCRC patients treated with cetuximab-containing therapy.
We further studied the possible mechanisms for AEP-mediated cetuximab resistance. In our previous report, AEP could activate the MAPK/MEK/ERK signaling pathway and promote resistance to microtubule inhibitors in gastric cancers cells, including paclitaxel, docetaxel, and T-DM1 [31]. Cetuximab is an anti-EGFR immunoglobulin G1 (IgG1) mAb. Gene mutations in the EGFR downstream, including RAS [10–13], BRAF [12, 14], PIK3CA [12, 15], contribute to cetuximab resistance. Thus, we assumed that, as the downstream signal pathway of EGFR, the alteration of MAPK pathway might also play a role in cetuximab resistance. In this study, we found that the phosphorylation of MEK/ERK proteins increased after AEP overexpression, and MEK inhibitors U0126 could partially block the resistance induced by AEP. U0126, as an inhibitor of the MAPK signaling pathway, is closely related to various biological processes, such as differentiation, cell growth, autophagy, apoptosis, and stress responses. It makes U0126 play an essential role in various cancers [32].
It has been well reported that AEP may promote cancer progression through diverse pathways, but little is known about the mechanism of AEP-mediated drug resistance. AEP could promote tumor progression by blocking the tumor-suppressive function of P53 [26], activating the PI3K/AKT pathway [33], remodeling of the extracellular matrix (ECM) [34], increasing endothelial permeability [35], or modulating epithelial-to-mesenchymal transition (EMT) [36]. AEP may also be involved in the immune regulation process. In experimental colitis and graft versus host disease (GVHD) mice, the researchers found that programmed cell death ligand 1 (PD-L1) maintains the intrinsic function of Foxp3 by specifically lowering the AEP in lysozyme [37]. AEP is an upstream activator of the cathepsin L-C3-IFN-gamma axis in human CD4(+) T cells and hence an important supporter of human Th1 induction [38]. All these mechanisms may also contribute to drug resistance and further research is needed.
In this study, AEP inhibitors (AEPIs) were used to restore the sensitivity of AEP-overexpressed cells to cetuximab. Another study [39] has shown that AEP-specific small molecule inhibitor can effectively inhibit tumor progression and improved survival in breast cancer transgenic mice. Therefore, AEP may be an effective target for tumor treatment or reversal of drug resistance in the future. Referring to the reported strategy, the following therapeutic methods are proposed for consideration: a combination of medications consisting of signaling pathway inhibitors and AEPI or immunotherapy plus AEPI. Moreover, what triggers the up-regulation of AEP in cancers has not been well known. The concrete signaling pathway regulation of the AEP protein and the activation of AEP are worth exploring and will be helpful for blocking the carcinoma-promoting effect of AEP.
In conclusion, this study suggested that the higher expression of AEP could contribute to the shorter PFS of cetuximab treatment in mCRC. The sensitivity of AEP overexpression colon cancer cells to cetuximab decreased, which can be partially restored by AEP inhibitor. AEP may mediate cetuximab resistance by activating the phosphorylation of EGFR/MEK/ERK signaling pathway.
Supplementary Information
Below is the link to the electronic supplementary material.
Acknowledgements
Not applicable.
Author contributions
XX: conceptualization, methodology, investigation, writing—original Draft; ML: methodology, software, investigation, writing—original Draft; KP: methodology, formal analysis, investigation; YY: conceptualization, software, validation; TL: conceptualization, resources, supervision, writing—review and editing.
Funding
The work was supported by the National Nature Science Foundation of China (81502003, 81772511 and 81602038).
Declarations
Conflict of interest
The authors declare that they have no conflict of interest.
Ethical approval
All procedures performed in this study involving human participants were in accordance with the ethical standards of the institutional research committee and with the 1964 Helsinki declaration and its later amendments or comparable ethical standards.
Informed consent
Informed consent was obtained from all individual participants included in the study.
Footnotes
Publisher's Note
Springer Nature remains neutral with regard to jurisdictional claims in published maps and institutional affiliations.
Xiaojing Xu, Mengling Liu and Ke Peng contributed equally.
Contributor Information
Xiaojing Xu, Email: xxjqd@126.com.
Mengling Liu, Email: liuml13@fudan.edu.cn.
Ke Peng, Email: pengke92@126.com.
Yiyi Yu, Email: yu.yiyi@zs-hosptal.sh.cn.
Tianshu Liu, Email: liutianshu1969@126.com.
References
- 1.Siegel RL, Miller KD, Jemal A. Cancer statistics, 2020. CA Cancer J Clin. 2020;70(1):7–30. doi: 10.3322/caac.21590. [DOI] [PubMed] [Google Scholar]
- 2.Douillard JY, Siena S, Cassidy J, Tabernero J, Burkes R, Barugel M, et al. Final results from PRIME: randomized phase III study of panitumumab with FOLFOX4 for first-line treatment of metastatic colorectal cancer. Ann Oncol. 2014;25(7):1346–1355. doi: 10.1093/annonc/mdu141. [DOI] [PubMed] [Google Scholar]
- 3.Heinemann V, von Weikersthal LF, Decker T, Kiani A, Vehling-Kaiser U, Al-Batran S, et al. FOLFIRI plus cetuximab versus FOLFIRI plus bevacizumab as first-line treatment for patients with metastatic colorectal cancer (FIRE-3): a randomised, open-label, phase 3 trial. Lancet Oncol. 2014;15(10):1065–1075. doi: 10.1016/S1470-2045(14)70330-4. [DOI] [PubMed] [Google Scholar]
- 4.Ye LC, Liu TS, Ren L, Ye W, Zhu DX, Zai SY, et al. Randomized controlled trial of cetuximab plus chemotherapy for patients with KRAS wild-type unresectable colorectal liver-limited metastases. J Clin Oncol. 2013;31(16):1931–1938. doi: 10.1200/JCO.2012.44.8308. [DOI] [PubMed] [Google Scholar]
- 5.Qin S, Li J, Wang L, Xu J, Cheng Y, Bai Y, et al. Efficacy and tolerability of first-line cetuximab plus leucovorin, fluorouracil, and oxaliplatin (FOLFOX-4) versus FOLFOX-4 in patients with RAS wild-type metastatic colorectal cancer: the open-label, randomized, phase III TAILOR trial. J Clin Oncol. 2018;36(30):3031–3039. doi: 10.1200/JCO.2018.78.3183. [DOI] [PMC free article] [PubMed] [Google Scholar]
- 6.Bokemeyer C, Bondarenko I, Hartmann JT, Braud F, Schuch G, Zubel A, et al. Efficacy according to biomarker status of cetuximab plus FOLFOX-4 as first-line treatment for metastatic colorectal cancer: the OPUS study. Ann Oncol. 2011;22(7):1535–1546. doi: 10.1093/annonc/mdq632. [DOI] [PubMed] [Google Scholar]
- 7.Diaz LJ, Williams RT, Wu J, Kinde I, Hecht JR, Berlin J, et al. The molecular evolution of acquired resistance to targeted EGFR blockade in colorectal cancers. Nature. 2012;486(7404):537–540. doi: 10.1038/nature11219. [DOI] [PMC free article] [PubMed] [Google Scholar]
- 8.Misale S, Di Nicolantonio F, Sartore-Bianchi A, Siena S, Bardelli A. Resistance to anti-EGFR therapy in colorectal cancer: from heterogeneity to convergent evolution. Cancer Discov. 2014;4(11):1269–1280. doi: 10.1158/2159-8290.CD-14-0462. [DOI] [PubMed] [Google Scholar]
- 9.Van Emburgh BO, Sartore-Bianchi A, Di Nicolantonio F, Siena S, Bardelli A. Acquired resistance to EGFR-targeted therapies in colorectal cancer. Mol Oncol. 2014;8(6):1084–1094. doi: 10.1016/j.molonc.2014.05.003. [DOI] [PMC free article] [PubMed] [Google Scholar]
- 10.Misale S, Yaeger R, Hobor S, Scala E, Janakiraman M, Liska D, et al. Emergence of KRAS mutations and acquired resistance to anti-EGFR therapy in colorectal cancer. Nature. 2012;486(7404):532–536. doi: 10.1038/nature11156. [DOI] [PMC free article] [PubMed] [Google Scholar]
- 11.Peeters M, Kafatos G, Taylor A, Gastanaga VM, Oliner KS, Hechmati G, et al. Prevalence of RAS mutations and individual variation patterns among patients with metastatic colorectal cancer: a pooled analysis of randomised controlled trials. Eur J Cancer. 2015;51(13):1704–1713. doi: 10.1016/j.ejca.2015.05.017. [DOI] [PubMed] [Google Scholar]
- 12.De Roock W, Claes B, Bernasconi D, Schutter JD, Biesmans B, Fountzilas G, et al. Effects of KRAS, BRAF, NRAS, and PIK3CA mutations on the efficacy of cetuximab plus chemotherapy in chemotherapy-refractory metastatic colorectal cancer: a retrospective consortium analysis. Lancet Oncol. 2010;11(8):753–762. doi: 10.1016/S1470-2045(10)70130-3. [DOI] [PubMed] [Google Scholar]
- 13.Sorich MJ, Wiese MD, Rowland A, Kichenadasse G, McKinnon RA, Karapetis CS, et al. Extended RAS mutations and anti-EGFR monoclonal antibody survival benefit in metastatic colorectal cancer: a meta-analysis of randomized, controlled trials. Ann Oncol. 2015;26(1):13–21. doi: 10.1093/annonc/mdu378. [DOI] [PubMed] [Google Scholar]
- 14.Van Cutsem E, Kohne CH, Lang I, Folprecht G, Nowacki MP, Cascinu S, et al. Cetuximab plus irinotecan, fluorouracil, and leucovorin as first-line treatment for metastatic colorectal cancer: updated analysis of overall survival according to tumor KRAS and BRAF mutation status. J Clin Oncol. 2011;29(15):2011–2019. doi: 10.1200/JCO.2010.33.5091. [DOI] [PubMed] [Google Scholar]
- 15.Xu JM, Wang Y, Wang YL, Wang Y, Liu T, Ni M, et al. PIK3CA mutations contribute to acquired cetuximab resistance in patients with metastatic colorectal cancer. Clin Cancer Res. 2017;23(16):4602–4616. doi: 10.1158/1078-0432.CCR-16-2738. [DOI] [PMC free article] [PubMed] [Google Scholar]
- 16.Bregni G, Sciallero S, Sobrero A. HER2 amplification and anti-egfr sensitivity in advanced colorectal cancer. JAMA Oncol. 2019;5(5):605–606. doi: 10.1001/jamaoncol.2018.7229. [DOI] [PubMed] [Google Scholar]
- 17.Bardelli A, Corso S, Bertotti A, Hobor S, Valtorta E, Siravegna G, et al. Amplification of the MET receptor drives resistance to anti-EGFR therapies in colorectal cancer. Cancer Discov. 2013;3(6):658–673. doi: 10.1158/2159-8290.CD-12-0558. [DOI] [PMC free article] [PubMed] [Google Scholar]
- 18.Ishii S. Legumain: asparaginyl endopeptidase. Methods Enzymol. 1994;244:604–615. doi: 10.1016/0076-6879(94)44044-1. [DOI] [PubMed] [Google Scholar]
- 19.Haugen MH, Johansen HT, Pettersen SJ, Solberg R, Brix K, Flatmark K, et al. Nuclear legumain activity in colorectal cancer. PLoS one. 2013;8(1):e52980. doi: 10.1371/journal.pone.0052980. [DOI] [PMC free article] [PubMed] [Google Scholar]
- 20.Haugen MH, Boye K, Nesland JM, Pettersen SJ, Egeland EV, Tamhane T, et al. High expression of the cysteine proteinase legumain in colorectal cancer - implications for therapeutic targeting. Eur J Cancer. 2015;51(1):9–17. doi: 10.1016/j.ejca.2014.10.020. [DOI] [PubMed] [Google Scholar]
- 21.Zhang W, Lin Y. The mechanism of asparagine endopeptidase in the progression of malignant tumors: a review. Cells. 2021 doi: 10.3390/cells10051153. [DOI] [PMC free article] [PubMed] [Google Scholar]
- 22.Wu M, Shao GR, Zhang FX, Wu WX, Xu P, Ruan ZM, et al. Legumain protein as a potential predictive biomarker for Asian patients with breast carcinoma. Asian Pac J Cancer Prev. 2014;15(24):10773–10777. doi: 10.7314/apjcp.2014.15.24.10773. [DOI] [PubMed] [Google Scholar]
- 23.Wang L, Chen S, Zhang M, Li N, Chen Y, Su W, et al. Legumain: a biomarker for diagnosis and prognosis of human ovarian cancer. J Cell Biochem. 2012;113(8):2679–2686. doi: 10.1002/jcb.24143. [DOI] [PubMed] [Google Scholar]
- 24.Guo P, Zhu Z, Sun Z, Wang Z, Zheng X, Xu H. Expression of legumain correlates with prognosis and metastasis in gastric carcinoma. PLoS One. 2013;8(9):e73090. doi: 10.1371/journal.pone.0073090. [DOI] [PMC free article] [PubMed] [Google Scholar]
- 25.Li N, Liu Q, Su Q, Wei C, Lan B, Wang J, et al. Effects of legumain as a potential prognostic factor on gastric cancers. Med Oncol. 2013;30(3):621. doi: 10.1007/s12032-013-0621-9. [DOI] [PubMed] [Google Scholar]
- 26.Lin Y, Liao K, Miao Y, Qian Z, Fang Z, Yang X, et al. Role of asparagine endopeptidase in mediating wild-type p53 inactivation of glioblastoma. J Natl Cancer Inst. 2020;112(4):343–355. doi: 10.1093/jnci/djz155. [DOI] [PMC free article] [PubMed] [Google Scholar]
- 27.Khambata-Ford S, Garrett CR, Meropol NJ, Basik M, Harbison CT, Wu S, et al. Expression of epiregulin and amphiregulin and K-ras mutation status predict disease control in metastatic colorectal cancer patients treated with cetuximab. J Clin Oncol. 2007;25(22):3230–3237. doi: 10.1200/JCO.2006.10.5437. [DOI] [PubMed] [Google Scholar]
- 28.Yu Y, Guo M, Wei Y, Yu S, Li H, Wang Y, et al. FoxO3a confers cetuximab resistance in RAS wild-type metastatic colorectal cancer through c-Myc. Oncotarget. 2016;7(49):80888–80900. doi: 10.18632/oncotarget.13105. [DOI] [PMC free article] [PubMed] [Google Scholar]
- 29.Liu X, Wang Z, Zhang G, Zhu Q, Zeng H, Wang T, et al. Overexpression of asparaginyl endopeptidase is significant for esophageal carcinoma metastasis and predicts poor patient prognosis. Oncol Lett. 2018;15(1):1229–1235. doi: 10.3892/ol.2017.7433. [DOI] [PMC free article] [PubMed] [Google Scholar]
- 30.Liu C, Sun C, Huang H, Janda K, Edgington T. Overexpression of legumain in tumors is significant for invasion/metastasis and a candidate enzymatic target for prodrug therapy. Cancer Res. 2003;63(11):2957–2964. [PubMed] [Google Scholar]
- 31.Cui Y, Li Q, Li H, Wang Y, Wang H, Chen W, et al. Asparaginyl endopeptidase improves the resistance of microtubule-targeting drugs in gastric cancer through IQGAP1 modulating the EGFR/JNK/ERK signaling pathway. Onco Targets Ther. 2017;10:627–643. doi: 10.2147/OTT.S125579. [DOI] [PMC free article] [PubMed] [Google Scholar]
- 32.You Y, Niu Y, Zhang J, Huang S, Ding P, Sun F, et al. U0126: not only a MAPK kinase inhibitor. Front Pharmacol. 2022;13:927083. doi: 10.3389/fphar.2022.927083. [DOI] [PMC free article] [PubMed] [Google Scholar]
- 33.Zhu W, Shao Y, Yang M, Jia M, Peng Y. Asparaginyl endopeptidase promotes proliferation and invasiveness of prostate cancer cells via PI3K/AKT signaling pathway. Gene. 2016;594(2):176–182. doi: 10.1016/j.gene.2016.08.049. [DOI] [PubMed] [Google Scholar]
- 34.Chen JM, Fortunato M, Stevens RA, Barrett AJ. Activation of progelatinase A by mammalian legumain, a recently discovered cysteine proteinase. Biol Chem. 2001;382(5):777–783. doi: 10.1515/BC.2001.093. [DOI] [PubMed] [Google Scholar]
- 35.Kang L, Shen L, Lu L, Wang D, Zhao Y, Chen C, et al. Asparaginyl endopeptidase induces endothelial permeability and tumor metastasis via downregulating zonula occludens protein ZO-1. Biochim Biophys Acta Mol Basis Dis. 2019;1865(9):2267–2275. doi: 10.1016/j.bbadis.2019.05.003. [DOI] [PubMed] [Google Scholar]
- 36.Cui Y, Wang Y, Li H, Li Q, Yu Y, Xu X, et al. Asparaginyl endopeptidase promotes the invasion and metastasis of gastric cancer through modulating epithelial-to-mesenchymal transition and analysis of their phosphorylation signaling pathways. Oncotarget. 2016;7(23):34356–34370. doi: 10.18632/oncotarget.8879. [DOI] [PMC free article] [PubMed] [Google Scholar]
- 37.Stathopoulou C, Gangaplara A, Mallett G, Flomerfelt FA, Liniany LP, Knight D, et al. PD-1 Inhibitory receptor downregulates asparaginyl endopeptidase and maintains Foxp3 transcription factor stability in induced regulatory T cells. Immunity. 2018;49(2):247–263. doi: 10.1016/j.immuni.2018.05.006. [DOI] [PMC free article] [PubMed] [Google Scholar]
- 38.Freeley S, Cardone J, Gunther SC, West EE, Reinheckel T, Watts C, et al. Asparaginyl endopeptidase (Legumain) supports human Th1 induction via cathepsin L-mediated intracellular C3 activation. Front Immunol. 2018;9:2449. doi: 10.3389/fimmu.2018.02449. [DOI] [PMC free article] [PubMed] [Google Scholar]
- 39.Xu C, Cao L, Liu J, Qian Z, Peng Y, Zhu W, et al. Suppression of asparaginyl endopeptidase inhibits polyomavirus middle T antigen-induced tumor formation and metastasis. Oncol Res. 2017;25(3):407–415. doi: 10.3727/096504016X14743350548249. [DOI] [PMC free article] [PubMed] [Google Scholar]
Associated Data
This section collects any data citations, data availability statements, or supplementary materials included in this article.