

Abstract
Background:
Immunotherapeutic response failure of adrenocortical carcinomas highlights a need for novel strategies targeting immune cell populations in the tumor microenvironment to overcome tumor resistance and enhance therapeutic response. A recent study explored a new link between tumor mast cell infiltration and improved outcomes in patients with adrenocortical carcinomas. We further dissect the role of mast cells in the tumor microenvironment of adrenocortical carcinomas by examining the tumor mast cell expression signatures and mast cell activity within the tumor microenvironment to provide additional insight into potential novel immunotherapeutic targets.
Methods:
Using the CIBERSORTx computational immunogenomic deconvolution algorithm to analyze adrenocortical carcinoma tumor gene messenger RNA expression data (The Cancer Genome Atlas, N = 79), we estimated the abundance of tumor immune infiltrating mast cells and assessed prognostic potential of mast cell signaling genes as pro or antitumor signatures, as well as examined the impact on overall and disease-free survival.
Results:
We stratified mast cell signaling genes with survival prognostic values (overall survival, disease-free survival, P < .05) into antitumor (ALOX5, CCL2, CCL5, CXCL10, HDC, IL16, TNF, TPSAB1, VEGFD) and protumor (CXCL1, CXCL3, CXCL8, IL4, IL13, PTGS3, TNSF4, VEGFD) groups. Antitumor mast cell signature, as the predominant phenotype, was associated with improved overall and disease-free survival.
Conclusion:
The deconvolution analysis of The Cancer Genome Atlas data identified mast cell infiltration in the adrenocortical carcinoma microenvironment as predominantly associated with antitumor activity. Future studies stemming from our findings may help define the role of mast cells in the tumor microenvironment and the impact on patient survival in patients with adrenocortical carcinomas. Modulation of tumor mast cell infiltration may serve as a potential target for novel synergistic immunotherapies for the treatment and improved survival of patients with adrenocortical carcinomas.
Introduction
Adrenocortical carcinoma (ACC) is among the rarest and most aggressive cancers. Surgical resection remains the mainstay for patients with ACC, but nearly 30% of patients present with unresectable metastasis and resort to medical management.1 Mitotane therapy, a cytotoxic agent developed in the late 1950s, remains the only approved ACC treatment by the US Food and Drug Administration,2 and overall survival remains dismal with combination chemotherapy in advanced ACC.3 Although in recent years immunotherapy has made great strides in many cancer types, the impact of immunotherapy in ACCs has been less encouraging,4,5 as demonstrated in the phase II clinical trial of pembrolizumab efficacy and safety in advanced ACC4 and phase IB JAVELIN solid tumor trial (avelumab) in patients with previously treated metastatic ACC.5 Response to immunotherapy is dependent on the interaction between tumor cells and tumor microenvironment (TME). The diminished efficacy of immunotherapy directed at key regulators of T cells in ACC was further substantiated by the Landwehr et al study that revealed that the glucocorticoid excess is associated with tumor T cell depletion and unfavorable prognosis.6 The molecular drivers of immunotherapeutic resistance of ACC are also thought to be at play and include overactivation of the Wnt/ß-catenin pathway or loss of p53 that alter the ability of ACC cells to recruit Baft3, dendritic cells, and reduced T-cell infiltration.7
Tumor mast cell infiltration (TMCI) has recently emerged as a potential prognostic marker of improved outcomes in patients with ACC. Tian et al demonstrated that TMCI is associated with improved outcomes in ACC patients by employing CIBERSORTx (Stanford University, Stanford, CA) computational immunogenomic tumor-infiltrating immune cell (TIIC) estimation of The Cancer Genome Atlas Program (TCGA) database and validating the positive prognostic value of TMCI in an independent, single-center cohort of ACC patients.8 This study provided critical initial insight into the clinical relevance of mast cells (MC) infiltration in the TME of ACC, thus necessitating further studies and a deeper understanding of the role of MCs in ACC (Fig 1). In our study, we examined the MC activity within the ACC microenvironment by analyzing the expression of the MC signaling genes using a next-generation CIBERSORTx immunogenomic deconvolution analytic platform and explored the MC pro and antitumor effects in the ACC microenvironment. Our preliminary analysis of the ACC large-scale genomic dataset offers a new prism of understanding of how MC antitumor signaling may potentially be modulated, beyond conventional immunotherapy directed at key regulators of T cells, to optimize immunotherapeutic susceptibility in the ACC microenvironment and improve patient survival in patients with ACC.
Fig 1.
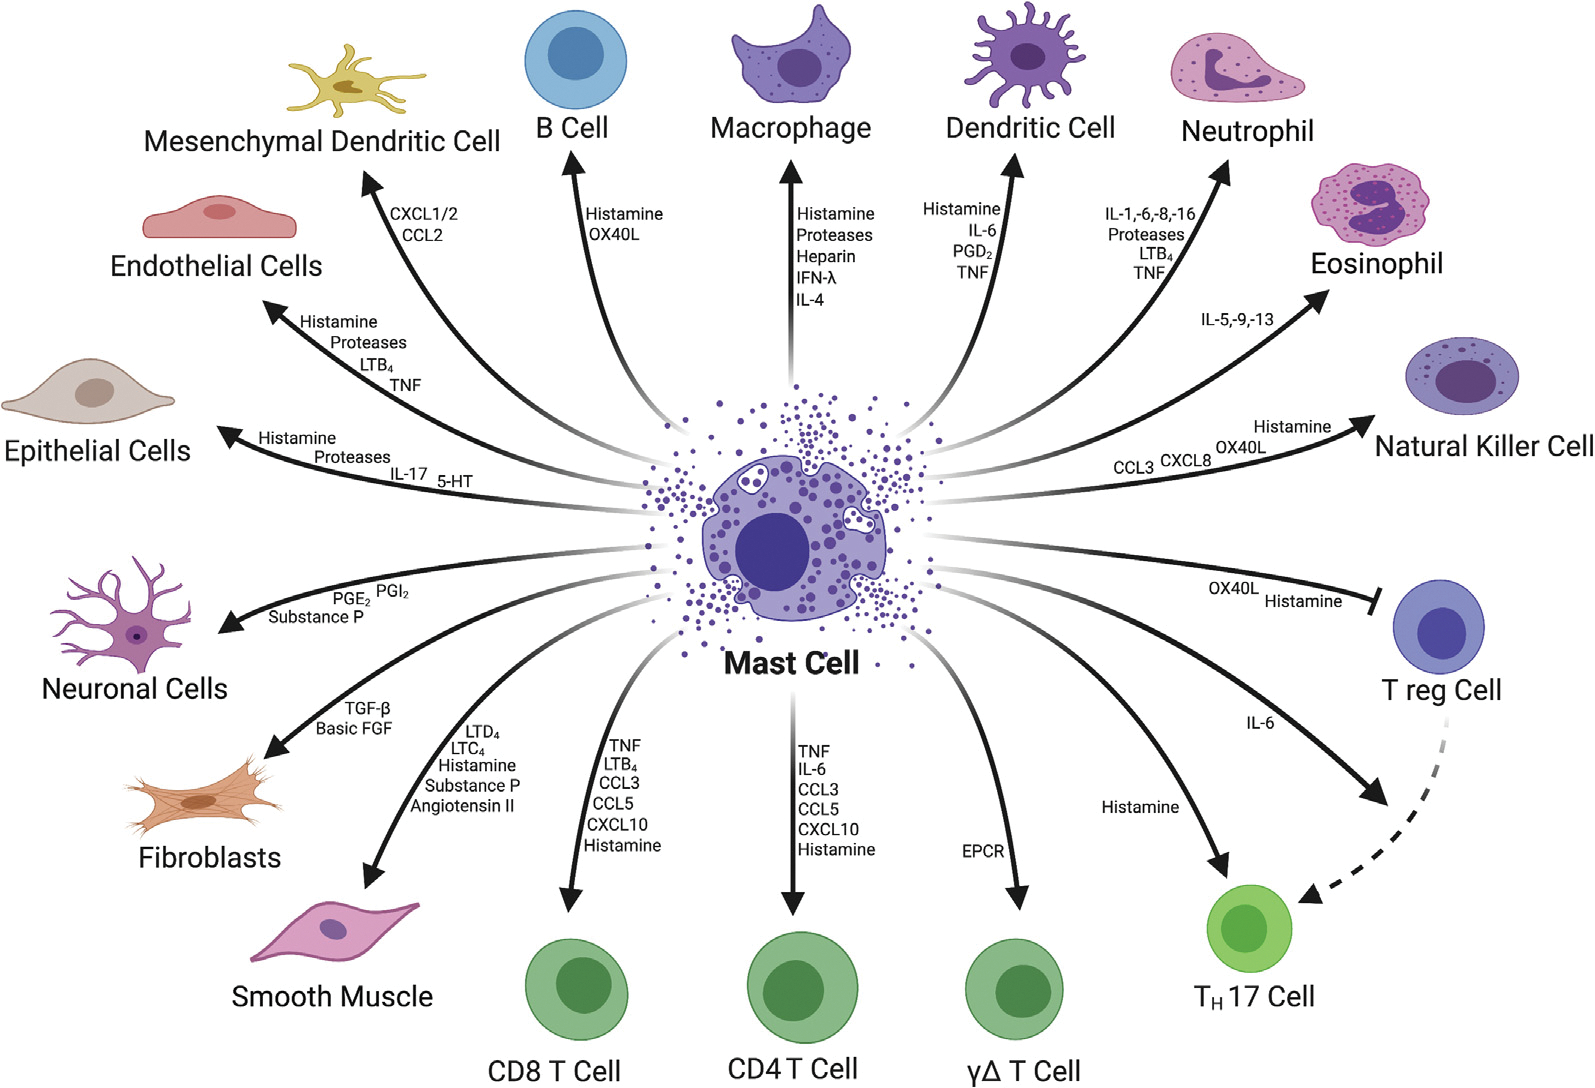
Mast cell signaling and target cell types. (Color version of figure is available online.)
Methods
Data acquisition
We used a publicly available, deidentified database with RNA sequencing count table data of adrenal cortical carcinomas (N = 92) from TCGA Firehose Legacy Cohort9,10 through the cBioPortal (https://www.cbioportal.org/) (https://www.cbioportal.org/study?id=60513bc6e4b015b63e9e0b74).10 Within the TCGA dataset, only 79 (86%) ACC patients had reported mRNA expression values and were included in the study cohort. This study was exempt from the institutional review board approval and did not require patient consent.
CIBERSORTx computational assessment of prognostic value of tumor mast cell infiltration
CIBERSORTx immunogenomic deconvolution analytic platform is the next generation of the CIBERSORT platform used in the analysis of ACC data by Tian et al.8 We employed CIBERSORTx to estimate tumor-infiltrating immune subsets in TCGA ACC tumor cohorts. CIBERSORTx is a publicly available web-based immunogenomic deconvolution analytic program that uses bulk sample gene messenger RNA (mRNA) expression data to estimate immune cell abundance and proportional makeup of immune cell subtypes (including B cells, CD4+T cells, CD8+T cells, dendritic cells, macrophages, natural killer cells, neutrophils, etc) within TME (https://cibersortx.stanford.edu).11
TMCI was analyzed using univariate and multivariate Cox regression analysis for its relation to patient overall survival (OS) and disease-free survival (DFS). The predictive prognostic value of TMCI in OS and DFS was determined by a maximally selected log-rank statistic test.12 All survival and optimal cutoff analyses were performed using the 1.1.383 R statistics software (R Core Team, Vienna, Austria).
Patient demographics, tumor pathology, and treatment parameters by low and high TMCI
The American Joint Commission on Cancer Staging Manual, eighth edition, was used to determine TNM classification. OS was defined as the time from the date of index operation to the date of death. DFS was defined as the time from index operation to the date of documented disease recurrence or death. Categorical variables were presented as frequency and percentages and compared using χ2 or Fisher exact test, as appropriate. Continuous variables were reported as median values with interquartile range and compared using the Kruskal-Wallis test. OS and DFS were calculated using the Kaplan-Meier method and compared using the log-rank test. Individual gene expression profiles were analyzed using univariant Cox regression. Significance was set at a P value less than .05.
Immunogenomic deconvolution of mast cell signaling gene mRNA expressions and TIIC correlations
All intercorrelations between MC signaling gene (MCSG) mRNA expressions and TIIC were constructed in heatmap format to represent all potential associations using a CIBERSORTx platform. Correlations were calculated using Spearman rank correlation coefficient and evaluated using the Pearson correlation formula. Correlational significance was set at a P value less than .01, and correlations with significant correlations are represented by heatmap shading. Statistically insignificant heat map correlations (P > .01) were devoid of shading.
MCSG mRNA expression signature calculation and proportional predominance
Cumulative anti and protumor signatures were normalized to positive values (0e5) and weighted against their sum to quantify the proportion of anti- and pro-mRNA expression signatures in each patient. Expression predominance was determined by proportional expression greater than 50%. OS and DFS were compared according to signature predominance using Kaplan-Meier and log-rank tests.
Results
TMCI in ACC
TMCI was associated with prolonged DFS (hazard ratio [HR] 0.02, 95% confidence interval [95% CI] 0.00–0.64; P = .026). TMCI was not associated with improved OS (HR 0.27, 95% CI 0.02–4.99; P = .378). Maximally selected log-rank statistic test identified MC infiltration >0.15 arbitrary units to be increasingly associated with prolonged DFS and a TMCI value of 0.21 to carry the maximum DFS prognostic value (Fig 2, A and B). Patients with TMCI >0.21 were deemed the “high TMCI” group, and patients with TMCI <0.21 were considered the “low TMCI” group. Low TMCI was associated with shortened DFS (HR 5.51, 95% CI 1.32–22.97; P = .019). No dichotomous threshold of mast cell inflammation was found to be a predictor of OS and OS log-rank comparison using optimal DFS threshold (P = .17) (Fig 2, C). DFS was shortened for ACC patients with suboptimal TMCI (5-year DFS, 85.7 vs 37.1%; P = .005, Fig 2, D).
Fig 2.
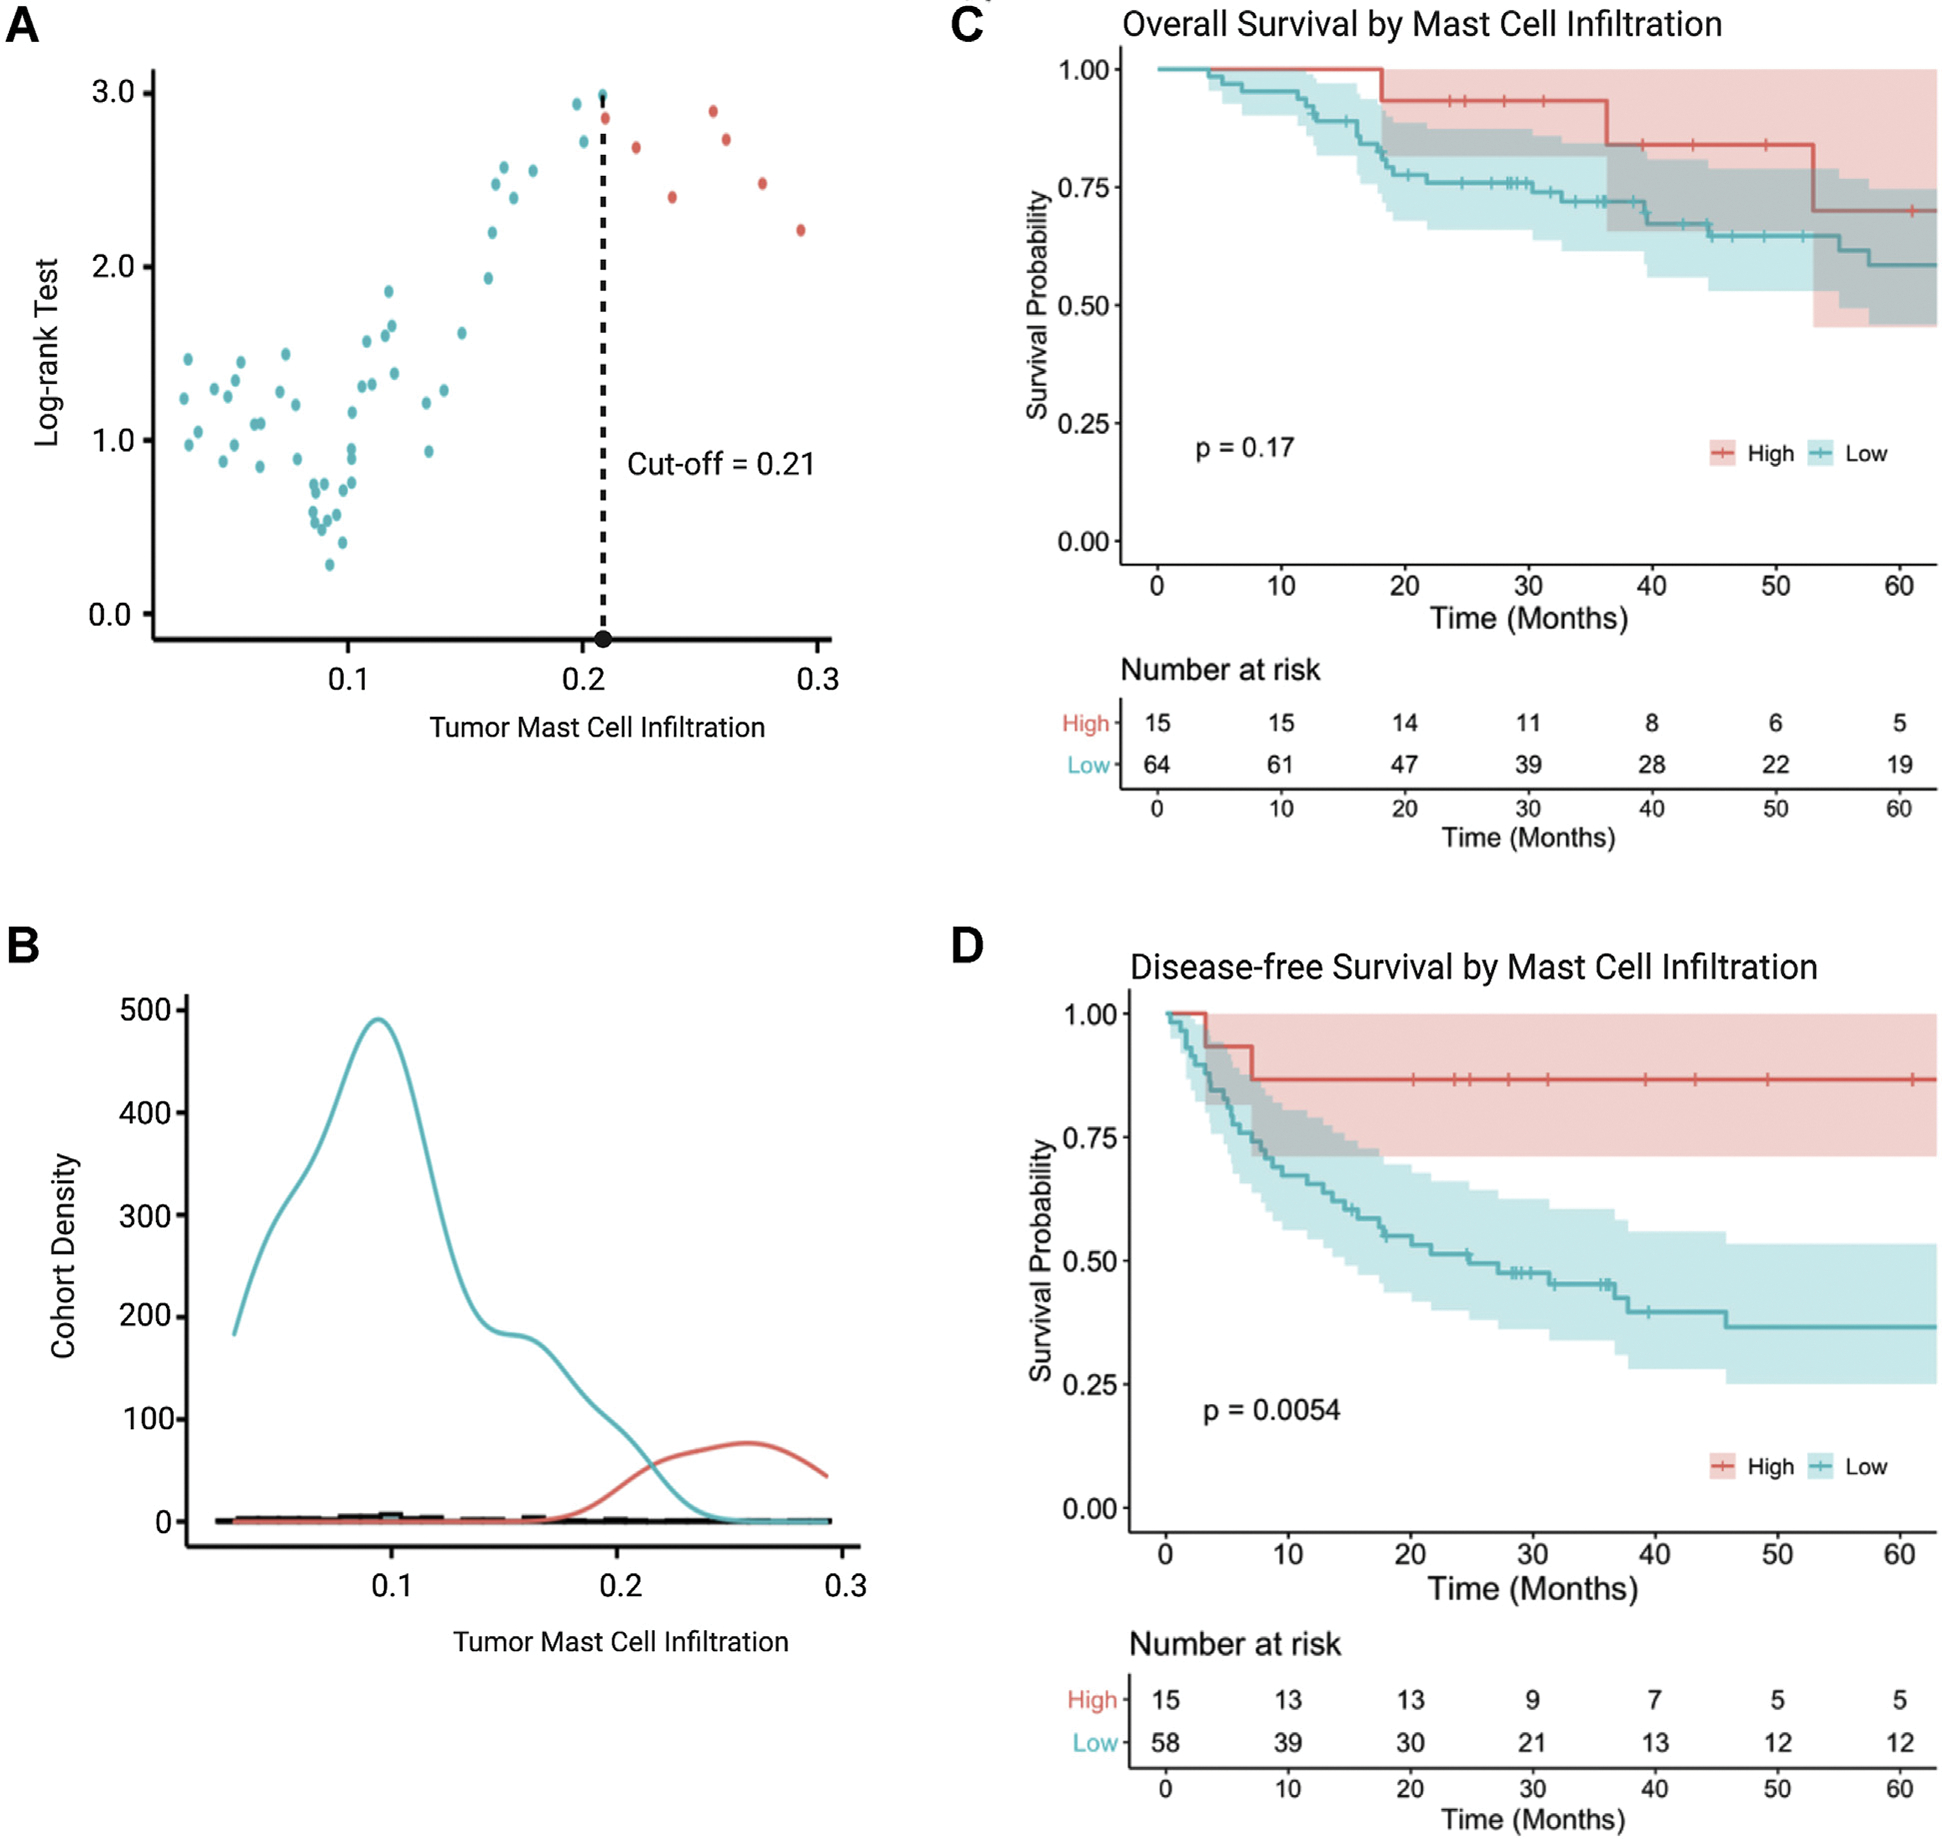
Prognostic value of tumor mast cell infiltration in adrenocortical carcinoma. (A) Optimal value of tumor-infiltrating mast cell prognostic for DFS determined by a maximally selected log-rank statistic test. (B) Distribution of suboptimal (low) and optimal (high) tumor mast cell infiltration within the study cohort. (C) OS stratified by optimal and suboptimal mast cell infiltration. (D) DFS stratified by optimal and suboptimal mast cell infiltration. (Color version of figure is available online.) DFS, disease-free survival; OS, overall survival.
Antitumor MCSG and TIIC profile correlations
A comprehensive list of MCSG and their survival impact were analyzed using a univariate Cox regression survival analysis and were summarized in Supplemental Table S1. MCSG with significant positive prognostic value (HR <1.00; P < .05) in OS or DFS were deemed antitumor MCSG. The antitumor MCSG included ALOX5, CCL2, CCL5, CXCL10, HDC, IL16, TNF, and VEGFD (Fig 3, A and B). Cumulative antitumor MCSG signature expression was associated with prolonged DFS (HR 0.893, 95% CI 0.84–0.95; P < .001) only. The role of antitumor MCSG is summarized in Fig 3, C. There were several significant mRNA expression intercorrelations between all antitumor MCSGs (r > 0.3) with the exception of VEGFD. VEGFD expression was positively correlated with histidine decarboxylase (HDC) expression (r = 0.32) (Fig 3, D). Expression and TIIC correlations of protumor MCSG revealed antitumor MCSG expression to be positively correlated with the infiltration of CD8+ T cells (r = 0.54), T(reg) cells (r = 0.53), M1 (r = 0.54) and M2 (r = 0.63) macrophage, and total macrophage and monocyte (r = 0.64) (P values < .01) (Fig 3, E).
Fig 3.
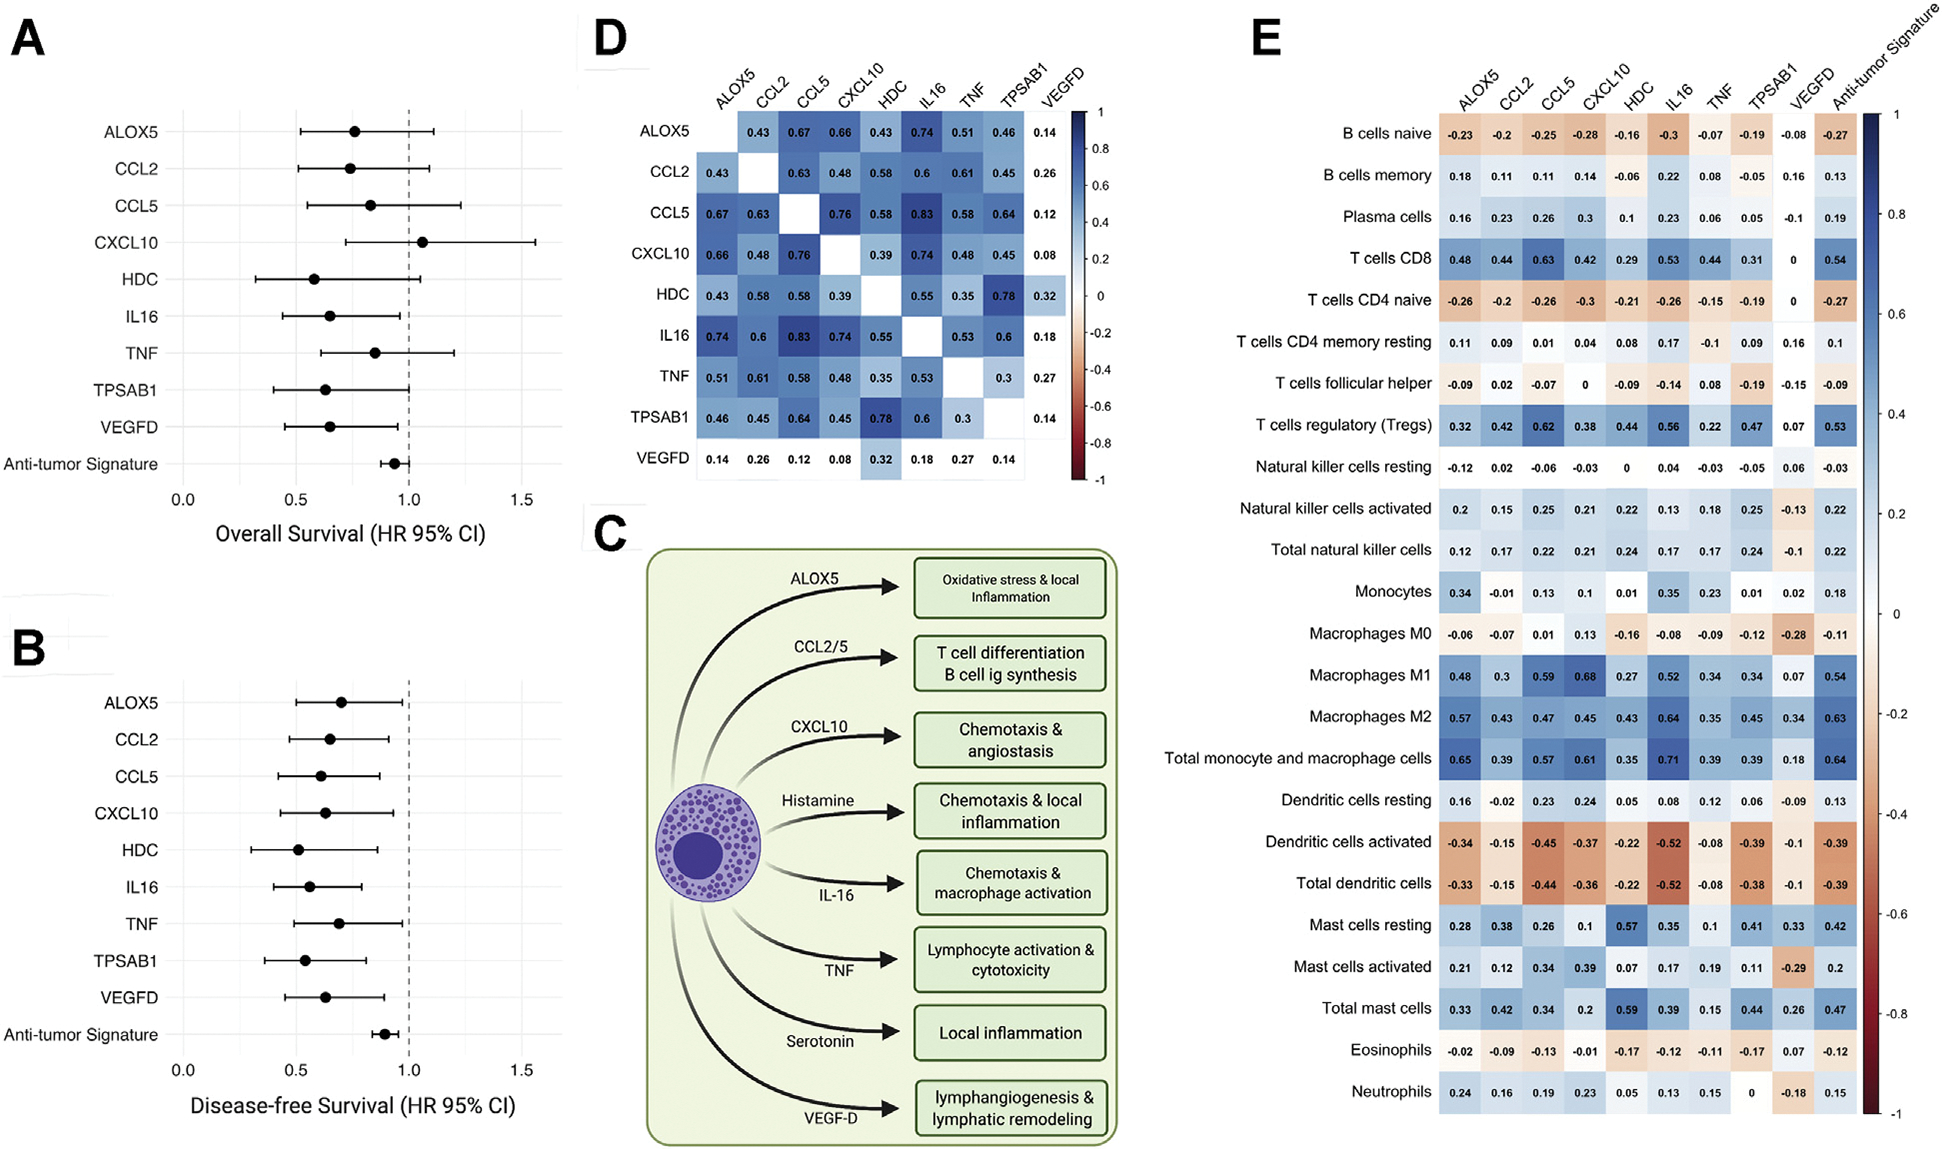
Antitumor MCSG in adrenocortical carcinoma. (A and B) Significant prognostic indicators of MCSG with significant associations for OS or DFS (OS or DFS, HR <1.00; P < .05). (C) Heatmap of antitumor MCSG expression showing Spearman rank correlation coefficients with significant correlations (P < .01) shaded. (D) Diagram of antitumor mast cell activity and antitumor mast cell gene signaling roles. (E) Heatmap of individual gene expression contributing to antitumor mast cell signaling signature with TIIC subtypes. Significant correlations (P < .01) shaded. (Color version of figure is available online.) DFS, disease-free survival; HR, hazard ratio; MCSG, mast cell signaling genes; OS, overall survival; TIIC, tumor-infiltrating immune cell.
Protumor MCSG and TIIC profile correlations
MCSG with significant negative prognostic value (HR >1.00; P < .05) in OS or DFS were deemed protumor MCSGs. These genes included CXCLl, CXCL8, IL4, IL13, PTGS2, TNFSF4, and VEGFC. Cumulative protumor MCSG signature expression was significantly associated with shortened OS and DFS (OS HR 1.18, 95% CI 1.09–1.29; P < .001; DFS HR 1.14, 95% CI 1.05–1.23; P < .001) (Fig 4, A and B). The role of protumor MCSGs are summarized in Fig 4, C. Strong intercorrelations were found between CXCL1, CXCL3, CXCL8, and PTGS2 mRNA expression (r > 0.55) (Fig 4, D). Protumor MCSG expression was positively correlated with the infiltration of M1 macrophage (r = 0.53), activated mast cells (r = 0.52), and neutrophil (r = 0.53) infiltration (Fig 4, E) (P values < .01).
Fig 4.
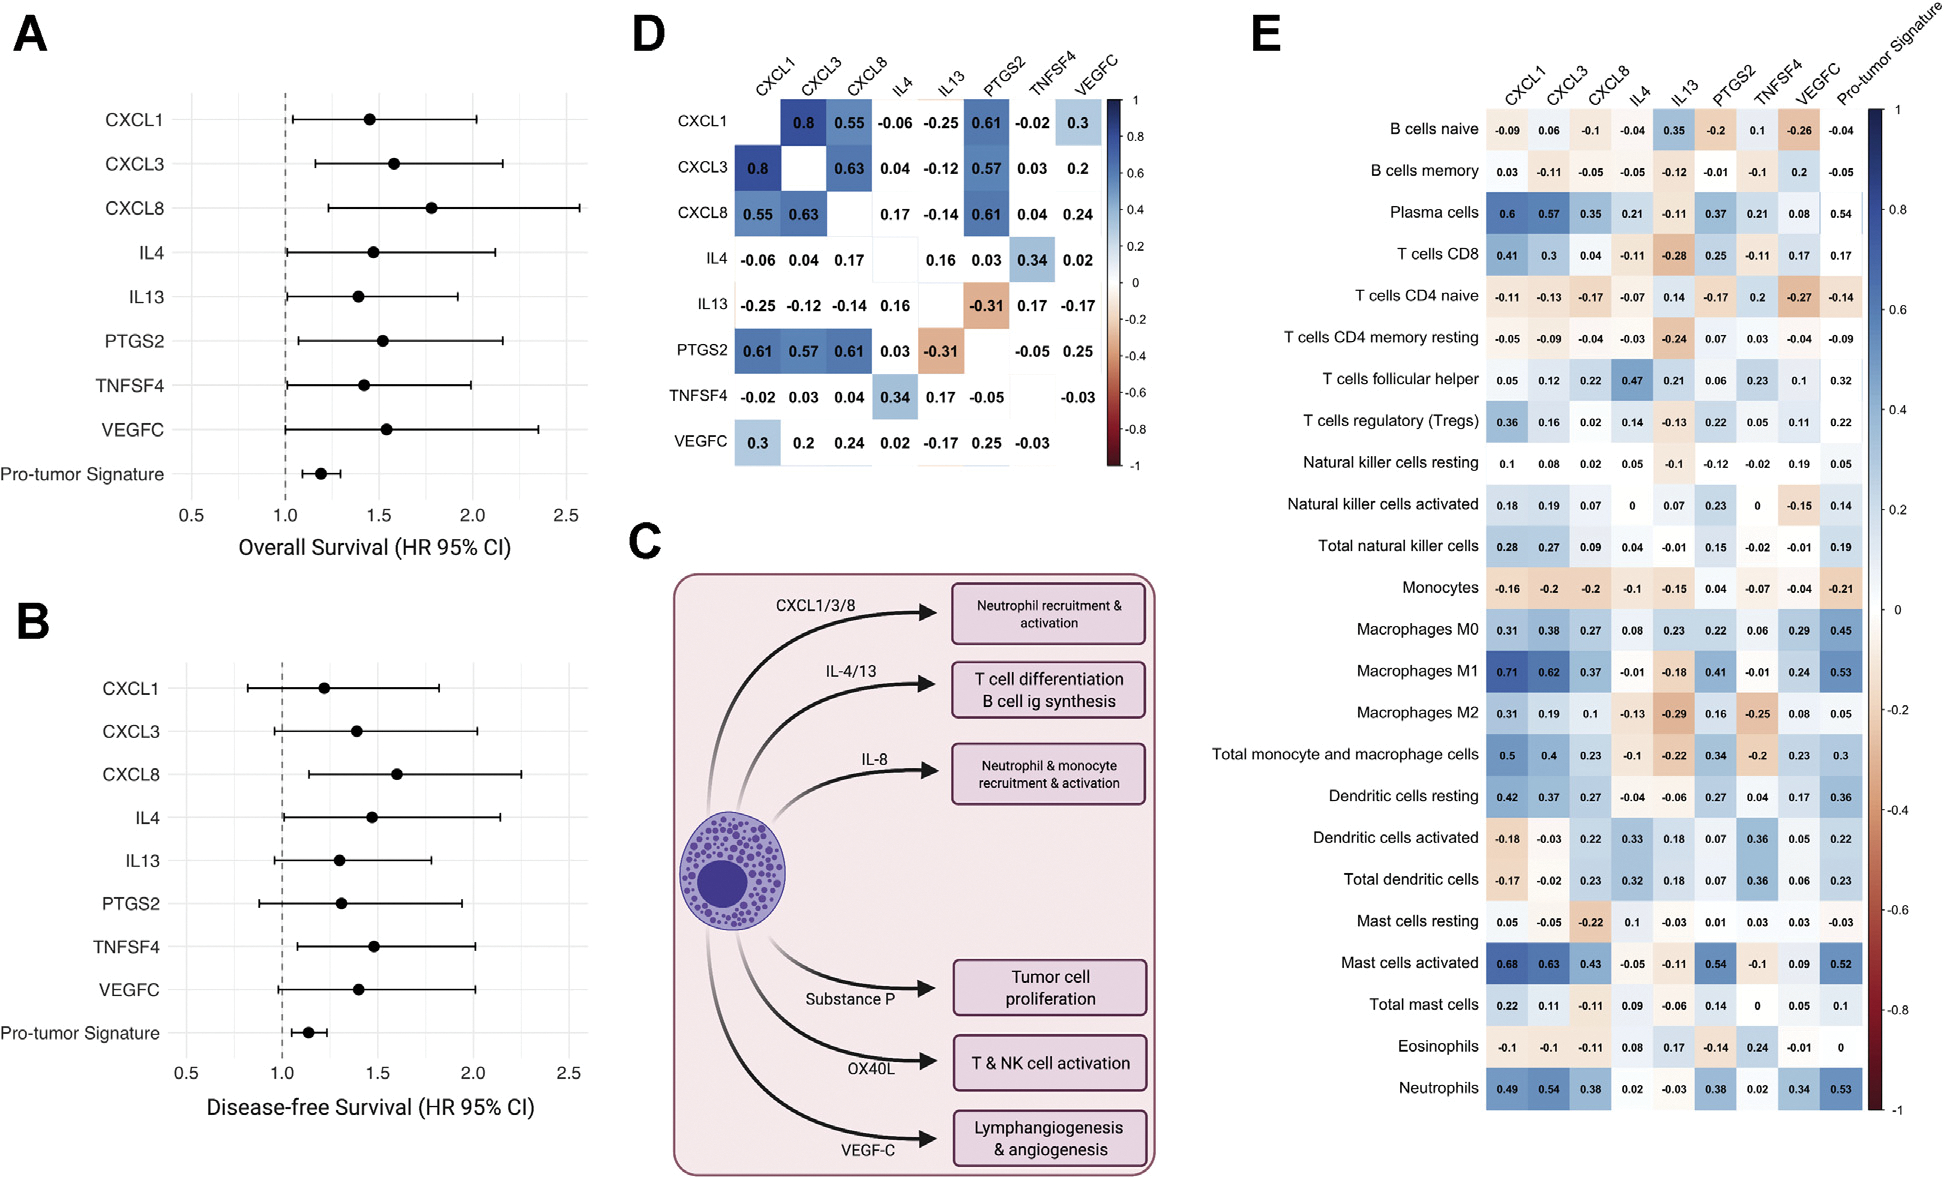
Protumor MCSG in adrenocortical carcinoma. (A and B) Significant prognostic indicators of MCSG with significant associations for OS and DFS (OS or DFS, HR >1.00; P < .05). (C) Heatmap of protumor MCSG expression showing Spearman rank correlation coefficients with significant correlations (P < .01) shaded. (D) Diagram of protumor mast cell activity and protumor MCSG roles. (Color version of figure is available online.) DFS, disease-free survival; MCSG, mast cell signaling genes; OS, overall survival. (E) Heatmap of individual gene expression contributing to protumor mast cell signaling signature with TIIC subtypes. Significant correlations (P < .01) shaded. (Color version of figure is available online.) DFS, disease-free survival; HR, hazard ratio; MCSG, mast cell signaling genes; OS, overall survival; TIIC, tumor-infiltrating immune cell.
Antitumor MCSG expression signature predicts survival outcomes
Of the entire cohort, 72% (n = 57) were identified to predominantly express an antitumor gene signature, and 28% (n = 22) were protumor signature predominant (Fig 5, A). Antitumor mast cell signaling predominance among the cohort further suggests that although mast cells may play a heterogenous role in ACC TME, they may be considered a favorable prognostic indicator with a beneficial overall impact on the TME. Antitumor and protumor signature predominant groups were made up of similar portions of CS- and non-CS ACC patients (54.5% vs 36.8%; P = .24). Antitumor predominant MCSG expression was associated with prolonged 5-year OS (73.0% vs 28.3%; P < .001) and DFS (53.9% vs 9.7%, P < .001) survival compared to ACC patients with protumor predominant MCSG expression (Fig 5, A, B, and C).
Fig 5.
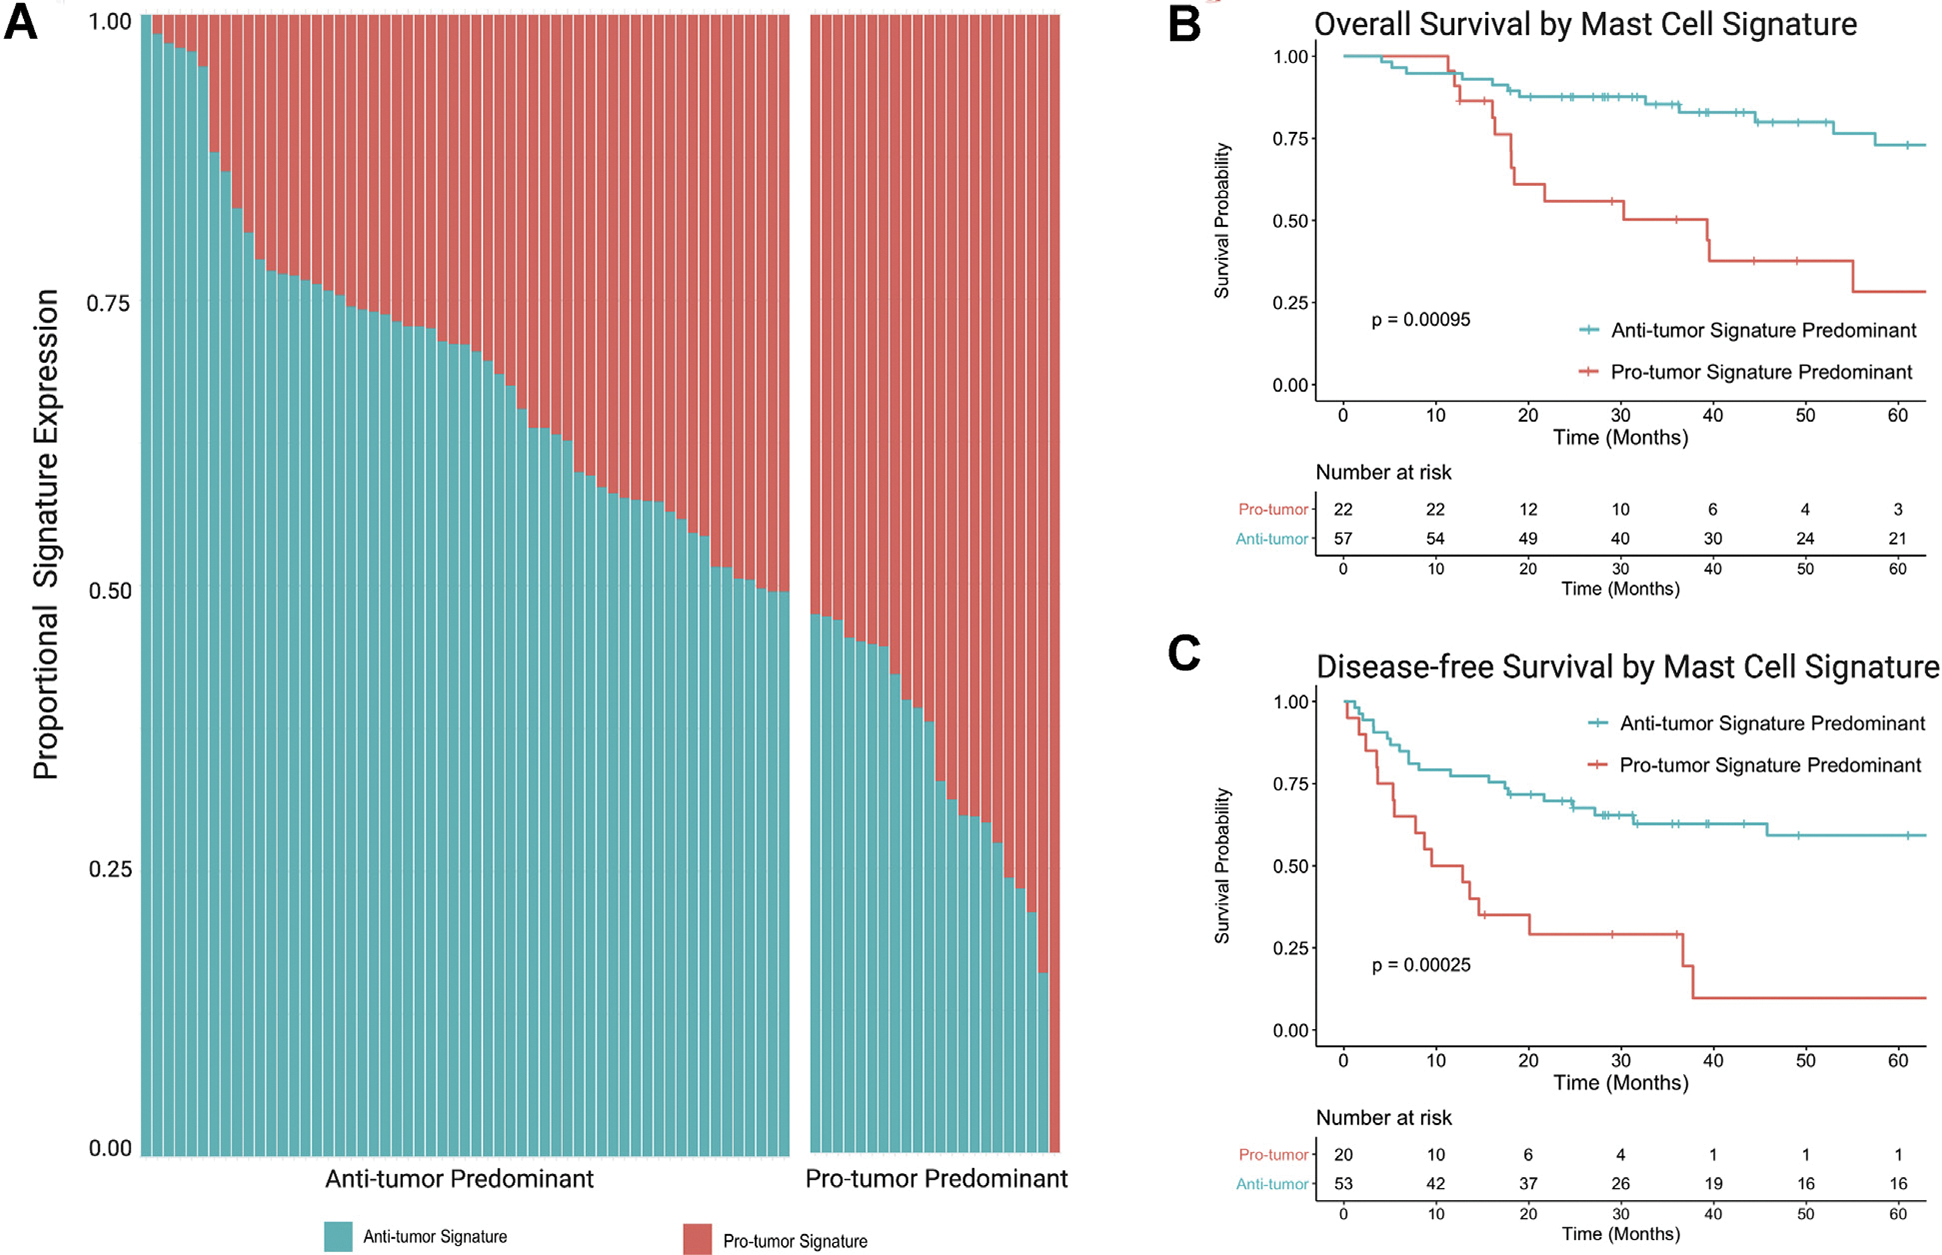
MCSG mRNA expression signature predominance. (A) Proportional mRNA expression of anti and protumor MCSG signatures in each patient. (B) OS comparing anti and protumor MCSG signature expression predominance. (C) DFS comparing anti and protumor MCSG signature expression predominance. DFS, disease-free survival; MCSG, mast cell signaling genes; OS, overall survival.
MCSG expression profile of excess cortisol secreting ACC
Among the antitumor MCSGs associated with favorable prognosis, the mRNA expression of CCL5 (P = .008), HDC (P < .001), IL16 (P = .002), and TPSAB1 (P < .001) were downregulated in CS ACCs compared to non-CS ACCs (Supplemental Figure S1A). Furthermore, the antitumor expression signature was decreased in CS ACC relative to non-CS ACC patients (P = .006). CS- and non-CS ACCs demonstrated similar expression of the protumor MCSGs and the protumor cumulative signature (Supplemental Figure S1B).
Patient demographic, tumor pathology, and treatment parameters of ACC: Low versus high TMCI
Clinical and treatment parameters were stratified according to the low versus high TMCI distribution in ACC tumors that may confound DFS and/or OS associations (Supplemental Table S2). Among the 79 patients included in the cohort, 64 (81%) had low TMCI, and 15 (19%) had high TMCI. The groups were similar in age at diagnosis (P = .871), sex (P = .718), tumor stage T (P = .622), nodal status N (P = .791), metastasis M (P = 1), and clinical stage (P = .622). The high TMCI group had a greater portion of patients with an unreported race (33.0% vs 9.4%; P = .014). Low and high TMCI groups demonstrated similar fractions of genome alteration (P = .276), mutation count (P = .222), mitotic rate (P = .556), tumor necrosis (P = 1), Weiss Score13 (P = .545), and rates of vascular invasion (P = .849). Both groups reported similar resection margins (P = .866) and underwent similar rates of unspecified neoadjuvant (P = 1) and adjuvant (P = .662) therapy, as well as radiation (P = .866) and mitotane therapy (P = .231) throughout their clinical course.
Significant differences between the low and high TMCI groups were observed with the type of excess adrenal steroid oversecretion (P = .047), with higher rates of isolated cortisol-secreting ACC (CS-ACC) among the low TMCI group (25.4% vs 0.0%; P < .001), higher rates of ACC recurrence after initial treatment (55.9% vs 14.3%; P = .012). On multivariable Cox regression analysis controlling for cortisol secretion, low TMCI was associated with shortened DFS (HR 4.37, 95% CI 1.03e18.60; P = .046). Thus, the poor DFS prognosis related to low TMCI, after controlling for cortisol secretion and despite similar patient demographics, tumor pathology, and treatment protocols commonly associated with survival (patient age, cancer stage, Weiss Score, neoadjuvant/adjuvant therapy), is suggestive of a possible influential role of mast cell activity in ACC TME that may underlie disease biology and patient prognosis.
Discussion
In this study, we used multiplatform computational immunogenomic deconvolution and bulk mRNA expression analysis of TCGA ACC data from cBioPortal to gain a deeper understanding of the role of MC tumor infiltration and signaling activity within ACC TME. Our findings are multifaceted in that they support previous research characterizing tumor-infiltrating MC abundance as a favorable prognostic factor in ACC.8 Our analyses dived deeper to investigate potential confounders underlying the previously identified favorable prognostic value of MC in ACC TME, and we outlined prognostic pro and antitumorigenic MC signaling genes to lay a foundation for future mechanistic studies to investigate and exploit potential MC antitumor activity in ACC tumors.
In the demographic, clinical, pathologic, and treatment parameter comparisons between ACC patients harboring low and high TMCI, excess cortical steroid secretion emerged as the only factor identified to be significantly different between groups, with isolated excess cortisol secretion significantly associated with low TMCI. This finding implied an influential role of glucocorticoid-induced MC immunomodulation; therefore, we performed additional analysis to compare the anti and protumorigenic MC gene expression levels by cortisol secretion and found several antitumor genes (CCL5, HDC, IL16, TPSAB1) to be downregulated in CS-ACCs compared to non-CS ACCs, as was the cumulative antitumor MCSG signature. Excess cortisol secretion is known for both immunosuppression in ACC TME6 and as an independent risk factor for poor prognosis in ACC patients.14 The DFS prognostic value of TMCI, however, maintained statistical significance after controlling for excess cortisol secretion on multivariant analysis, while excess cortisol secretion did not. Together, these correlations indicate the potential for cortisol-induced suppression of antitumor MC signaling (among other interactions), which may, in part, contribute to diminished MC antitumor activity in ACC TME and the poor prognosis in patients with CS-ACC.
Previous studies have demonstrated a wide range of variability in the prognostic value of MC infiltration and activity according to the type, grade, or stage of the tumor, and the prognostic role MC has across cancer types.15–18,19,20 MC appears to play a protumorigenic role and an antitumorigenic role in various cancers and, to some extent, can be noncontributory in certain tumors. This collage of evidence suggests a heterogeneous role of MC in the immune landscape of tumors that may vary on a spectrum across different tissue and cancer types. The variation may also be influenced by differential MC signaling activity and gene expression, as well as the susceptibility of specific tumor types to inflammation.
Our study assessed the prognostic value of the mRNA expression of genes attributable to MC signaling to characterize the dichotomous pro and antitumorigenic MC activity. The antitumor MCSGs associated with improved prognosis were found to be predominantly involved in promoting local inflammation (ALOX5/leukotriene B4, HDC/histamine, TPSAB1/serotonin), as well as lymphocyte (CCL2, CCL5, CXCL10, TNF) and phagocyte (IL16) chemotaxis and activation. VEGF is well known for its angio and lymphogenic properties in TME; however, the role of differentially expressed VEGF subunits (-A, -B, -C, and -D) remains less understood. In this study, VEGFD expression was associated with improved prognosis and VEGFC with poor prognosis. A similar phenomenon has been observed in nonsmall cell lung cancer and attributed to the increased lymphogenic properties of VEGFC over VEGFD.21 Although the VEGFC expression is considered a risk factor for the lymphatic spread in several cancers, VEGFD remains less characterized clinically but has demonstrated decreased levels to be associated with metastatic disease, including thyroid tumors,22 suggesting that VEGFD may serve as a competitive agonist at the VEGF receptor. Reduced levels of VEGFD may allow the increased activity of VEGFA and VEGFC.
The protumor MCSG associated with poor prognosis was found to be mostly involved in the promotion of neutrophil recruitment and activation (CXCL1, CXCL3, CXCL8, IL8), and the expression of the protumor signature was strongly correlated with neutrophil tumor infiltration. Substance P (PTGS2) mRNA expression was also associated with shorter OS. Substance P is released upon mast cell degranulation, can induce tumor cell mitogenicity (proliferation, invasion, metastasis) through activation of the neurokinin-1 receptor system, while neurokinin-1 antagonists negate such effects.23,24
The anti and protumor MCSG signatures appeared to inversely impact prognosis (OS and DFS) to a similar degree; however, the study cohort was shown to predominantly express the antitumor signature over the protumor MCSG signature, and antitumor predominance was significantly associated with improved prognosis. These findings support the favorable prognostic value of MC infiltration in ACC patients recently identified by Tian et al at Fudan University in Shanghai, despite the heterogenous role of MC in TME.8 Furthermore, our study provides insight into potential contributory factors that may underly the dichotomous role of MC observed across various cancer types. Of the pro and antitumor ACC MCSGs identified in this study, promotion of local inflammation and immune cell recruitment through ALOX5/leukotriene B4, HDC/histamine, and TPSAB1/serotonin may be a potential avenue for supplementing MC signaling in ACC TME.
This study is not without limitations. Primarily, this is a retrospective study design examining large-scale sequenced genetic data of ACC tumors using a computational deconvolution approach to ascertain tumor immune cell infiltration within TME and inherently is limited from determining causal relationships. Although, we feel that the study’s use of the TCGA database strengthened this study by providing a sufficiently robust database of clinical and genetic parameters to derive meaningful associations regarding the TME of these ultra-rare tumors, the collaborative is limited to large, academic referral centers which may lead to selection bias toward more advanced stage disease with over-representation of metastatic disease. This may skew our findings and impact conclusions in such a way that it can limit the generalizability of our conclusions to more advanced, treatment-resistant ACCs. Furthermore, the collaborative nature of the TCGA database also limits the granularity of clinical data available for certain parameters relevant to clinicians. For example, the TCGA database only reports on ACC hormone hypersecretion (nonfunctional, cortisol, aldosterone, androgen, etc) and does not include the diagnostic test use or lab values. Similarly, the site of metastasis is unreported in this database. Furthermore, the treatment of patients with ACC is very heterogeneous with variations in surgical technique, radiation therapy (adjuvant/neoadjuvant), and mitotane regimen (including dose, frequency, therapeutic level). Our survival analysis was also limited to time from index operation and may not fully grasp the prognosis from date of diagnosis for patients receiving preoperative treatment or otherwise delayed surgical resection. Altogether, such limitations, inherent to large databases of rare tumors, hindered our ability to further characterize and investigate these and other clinical treatment factors that may impact OS and DFS and influence MC infiltration and activity.
Moreover, it is challenging to clearly define the role of individual immune cell types due to overlap in function, gene expression, and immune interplay, and this study is no exception. This study does not include single-cell analysis or special profiling transcriptomics, and the expression of genes analyzed in this study are likely not exclusive to MCs. Instead, this study aims to identify the potential activity of (but not limited to) MCs that may underly their prognostic value in ACC TME consistent across multiple methods of immunogenomic and immunohistochemistry quantification.15 Collectively, our findings pave a way for future studies focusing on uncovering the underlying mechanisms that may influence the MC infiltration and expression and immunomodulatory activity of MCSG in the ACC TME.
In conclusion, our study provides interesting new insight into the nuanced role of MC infiltration in ACC TME and identifies potential areas worthy of further investigation in independent cohorts. The augmentation or supplementation of antitumor MC signaling may be an efficient means of optimizing TME immune response and enhancing immunotherapeutic response in patients with ACC.
Supplementary Material
Funding/Support
This project received no allocated funding or grant.
Footnotes
Conflicts of interest/Disclosure
The authors have declared no conflict of interest.
Supplementary materials
Supplementary material associated with this article can be found, in the online version, at https://doi.org/10.1016/j.surg.2021.04.045.
These data were presented at the American Association of Endocrine Surgeons (AAES) 2021 Virtual Annual Meeting as a podium presentation.
References
- 1.Sharma E, Dahal S, Sharma P, et al. The characteristics and trends in adrenocortical carcinoma: A United States population based study. J Clin Med Res. 2018;10:636–640. [DOI] [PMC free article] [PubMed] [Google Scholar]
- 2.Kerkhofs TM, Ettaieb MH, Hermsen IG, Haak HR. Developing treatment for adrenocortical carcinoma. Endocr Relat Cancer. 2015;22:R325–R338. [DOI] [PubMed] [Google Scholar]
- 3.Fassnacht M, Terzolo M, Allolio B, et al. Combination chemotherapy in advanced adrenocortical carcinoma. N Engl J Med. 2012;366(23):2189e2197. 10.1056/NEJMoa1200966. [DOI] [PubMed] [Google Scholar]
- 4.Habra MA, Stephen B, Campbell M, et al. Phase II clinical trial of pembrolizumab efficacy and safety in advanced adrenocortical carcinoma. J Immunother Cancer. 2019;7:253. [DOI] [PMC free article] [PubMed] [Google Scholar]
- 5.Le Tourneau C, Hoimes C, Zarwan C, et al. Avelumab in patients with previously treated metastatic adrenocortical carcinoma: phase 1b results from the JAVELIN solid tumor trial. J Immunother Cancer. 2018;6:111. [DOI] [PMC free article] [PubMed] [Google Scholar]
- 6.Landwehr LS, Altieri B, Schreiner J, et al. Interplay between glucocorticoids and tumor-infiltrating lymphocytes on the prognosis of adrenocortical carcinoma. J Immunother Cancer. 2020;8:e000469. [DOI] [PMC free article] [PubMed] [Google Scholar]
- 7.Liu S, Ding G, Zhou Z, Feng C. β-Catenin-driven adrenocortical carcinoma is characterized with immune exclusion. Onco Targets Ther. 2018;11:2029–2036. [DOI] [PMC free article] [PubMed] [Google Scholar]
- 8.Tian X, Xu W, Wang Y, et al. Identification of tumor-infiltrating immune cells and prognostic validation of tumor-infiltrating mast cells in adrenocortical carcinoma: results from bioinformatics and real-world data. Oncoimmunology. 2020;9:1784529. [DOI] [PMC free article] [PubMed] [Google Scholar]
- 9.Zheng S, Cherniack AD, Dewal N, et al. Comprehensive pan-genomic characterization of adrenocortical carcinoma. Cancer Cell. 2016;29:723–736. [DOI] [PMC free article] [PubMed] [Google Scholar]
- 10.Cerami E, Gao J, Dogrusoz U, et al. The cBio cancer genomics portal: an open platform for exploring multidimensional cancer genomics data. Cancer Discov. 2012;2:401–404. [DOI] [PMC free article] [PubMed] [Google Scholar]
- 11.Steen CB, Liu CL, Alizadeh AA, Newman AM. Profiling cell type abundance and expression in bulk tissues with CIBERSORTx. Methods Mol Biol. 2020;2117:135–157. [DOI] [PMC free article] [PubMed] [Google Scholar]
- 12.Hothorn T, Lausen B. On the exact distribution of maximally selected rank statistics. Comput Stat Data Anal. 2003;43:121–137. [Google Scholar]
- 13.Weiss LM. Comparative histologic study of 43 metastasizing and nonmetastasizing adrenocortical tumors. Am J Surg Pathol. 1984;8:163–169. [DOI] [PubMed] [Google Scholar]
- 14.Vanbrabant T, Fassnacht M, Assie G, Dekkers OM. Influence of hormonal functional status on survival in adrenocortical carcinoma: systematic review and meta-analysis. Eur J Endocrinol. 2018;179:429–436. [DOI] [PubMed] [Google Scholar]
- 15.Liu J, Zhang Y, Zhao J, et al. Mast cell: insight into remodeling a tumor microenvironment. Cancer Metastasis Rev. 2011;30(2):177e184. 10.1007/s10555-011-9276-1. [DOI] [PubMed] [Google Scholar]
- 16.Derakhshani A, Vahidian F, Alihasanzadeh M, Mokhtarzadeh A, Lotfi Nezhad P, Baradaran B. Mast cells: A double-edged sword in cancer. Immunol Lett. 2019;209:28–35. 10.1016/j.imlet.2019.03.011. [DOI] [PubMed] [Google Scholar]
- 17.Rigoni A, Colombo MP, Pucillo C. The Role of Mast Cells in Molding the Tumor Microenvironment. Cancer Microenviron. 2015;8(3):167e176. 10.1007/s12307-014-0152-8. [DOI] [PMC free article] [PubMed] [Google Scholar]
- 18.Varricchi G, Galdiero MR, Loffredo S, et al. Are Mast Cells MASTers in Cancer? Front Immunol. 2017;8:424. Published 2017 Apr 12. 10.3389/fimmu.2017.00424. [DOI] [PMC free article] [PubMed] [Google Scholar]
- 19.Melillo RM, Guarino V, Avilla E, et al. Mast cells have a protumorigenic role in human thyroid cancer. Oncogene. 2010;29:6203–6215. [DOI] [PubMed] [Google Scholar]
- 20.Yano H, Kinuta M, Tateishi H, et al. Mast cell infiltration around gastric cancer cells correlates with tumor angiogenesis and metastasis. Gastric Cancer. 1999;2:26–32. [DOI] [PubMed] [Google Scholar]
- 21.Carrillo de Santa Pau E, Arias FC, Caso Peláez E, et al. Prognostic significance of the expression of vascular endothelial growth factors A, B, C, and D and their receptors R1, R2, and R3 in patients with nonsmall cell lung cancer. Cancer. 2009;115:1701–1712. [DOI] [PubMed] [Google Scholar]
- 22.Nersita R, Matrone A, Klain M, et al. Decreased serum vascular endothelial growth factor-D levels in metastatic patients with differentiated thyroid carcinoma. Clin Endocrinol (Oxf). 2012;76:142–146. [DOI] [PubMed] [Google Scholar]
- 23.Gonzalez-Aparicio M, Alfaro C. Influence of interleukin-8 and neutrophil extracellular trap (NET) formation in the tumor microenvironment: Is there a pathogenic role? J Immunol Res. 2019;2019:6252138. [DOI] [PMC free article] [PubMed] [Google Scholar]
- 24.Javid H, Mohammadi F, Zahiri E, Hashemy SI. The emerging role of substance P/neurokinin-1 receptor signaling pathways in growth and development of tumor cells. J Physiol Biochem. 2019;75:415–421. [DOI] [PubMed] [Google Scholar]
Associated Data
This section collects any data citations, data availability statements, or supplementary materials included in this article.