

Abstract
Background
Insulin‐like growth factor 1 (IGF‐1) seems to be involved in the neural circuits associated with social cognition and brain structure.
Objectives
To investigate the association of IGF‐1 levels with social cognition and brain structure in Huntington's disease (HD).
Methods
We evaluated social cognition using the Ekman test in 22 HD patients and 19 matched controls. Brain structure was assessed using standard volume‐based voxel‐based morphometry and surface‐based cortical thickness pipeline. We analyzed the association of IGF‐1 levels with social cognition and brain structure using adjusted regression analysis.
Results
Social cognition was worse in HD patients (P < 0.001), on antidopaminergic drugs (P = 0.02), and with lower IGF‐1 levels (P = 0.04). In neuroimaging analyses, lower IGF‐1 levels were associated with social cognition impairment and atrophy mainly in frontotemporal regions (P < 0.05 corrected).
Conclusions
In HD, abnormal IGF‐1 function seems to be associated with brain atrophy leading to clinical deficits in social cognition.
Keywords: Huntington's disease, chorea, hypothalamus, IGF‐1, neuroimaging, social cognition
Previous literature has proposed a relationship between hypothalamic dysfunction and the limbic system with the development of non‐motor symptoms (NMS) in Huntington's disease (HD). 1 In this regard, several studies have found a range of neuroendocrine disturbances in HD, including higher vasopressin concentration levels and a trend for disturbed regulation of the oxytocin, corticotropic, thyrotropic, and lactotropic axes. 2 , 3 , 4 Among these neuroendocrine disturbances, there is a growing interest in the protective role of insulin‐like growth factor 1 (IGF‐1) on metabolic and mitochondrial function in HD. 5 Moreover, IGF‐I receptors have been discovered in the amygdala and prefrontal cortex, which contributes to the neural circuits known as the “social brain.” 6
Based on the data mentioned above, we hypothesized that IGF‐1 dysfunction would be associated with social cognition impairment and brain structural changes. Therefore, we aimed to investigate the IGF‐I function and its association with social cognition and brain structure in patients with HD versus controls. A secondary objective was to understand the role of the global hypothalamic function in social cognition, motor, and other NMS in HD.
Methods
Design
This was a multicenter, cross‐sectional, observational, case–control study. The research procedure was conducted using the RECORD guidelines. 7
Sample characteristics and ethics
This study was approved by the Institutional Review Board of the Complejo Universitario Burgos and Soria (Spain) (Ceim 1973). Data were collected for ambulatory participants who signed the informed consent after a full explanation of the procedure, following the International Conference on Harmonization‐Good Clinical Practice (ICH‐GCP) guidelines, stored on file, and available on request. 8 We included a consecutive sample of symptomatic HD patients with the larger allele ≥36 CAG repeats within the huntingtin gene, with a Unified Huntington's Disease Rating Scale (UHDRS) total motor (TMS) score >4, 9 and age, gender‐matched controls. We excluded participants with prosopagnosia, defined as Benton Facial Recognition Test score <40, 10 relevant psychiatric illness with a short Problem Behaviors Assessment for HD (PBA) score ≥2, 11 visual or auditory interference, moderate–severe cognitive impairment (Mini‐Mental State Examination score <25), 12 a pre‐existent endocrine disease, central nervous system disorder disturbances other than HD, history of alcohol or drug abuse, treatment with corticosteroids, pregnant and breastfeeding women, delivery within the last 6 months, treatment with contraceptives, night shift working and weight change in the preceding 6 months. Controls were recruited principally from the HD group's partners, spouses, or caregivers with no clinical evidence or family history of HD, and the same exclusion criteria was applied.
Assessments
We collected information on demographics, education, smoking history, and use of antidopaminergic drugs, antidepressants (selective serotonin and serotonin/norepinephrine, tricyclic, bupropion, and trazodone), and benzodiazepines. The disease burden score, an indicator of the severity of neuropathology of HD, was calculated for each HD gene carrier using the formula (CAG repeat length – 35.5) × age. 13 Motor symptoms severity was assessed using the UHDRS‐TMS, 9 with higher scores indicating worse motor impairment. Disease stage was obtained from the Total Functional Capacity (TFC) scores, with higher scores indicating lower severity status. 14 Social cognition and theory of mind (TOM) were evaluated using the Ekman 60 faces test, 15 and the Reading the Mind in the Eyes test (eyes test), respectively, 16 with higher scores indicating better social cognition performance. Other NMS disturbances were assessed, including apathy and social behavior, using the Apathy Evaluation Scale‐Clinician (AES), with higher scores indicating greater apathy. 17 In addition, in HD participants, cognition was assessed using the cognitive UHDRS composite subscore (UHDRS‐Cog), by adding the total correct scores for symbol digit modality test and Stroop subscore for word reading, with lower scores indicating worse performance. 18
Hypothalamic–pituitary function
The following early morning, fasting hormones were assayed: IGF‐1, vasopressin, oxytocin, corticotropic‐axis hormones (adrenocorticotropic hormone [ACTH], and cortisol), somatotropic‐axis hormones (growth hormone [GH]), gonadotropic axis hormones (luteinizing hormone [LH]; follicle‐stimulating hormone [FSH]; progesterone; 17ß estradiol and testosterone), thyrotropic axis hormones (thyroid‐stimulating hormone [TSH], and free thyroxine [fT4]), and lactotropic axis hormone (prolactin). Measuring range and hormone assays and general biochemistry determinations are described in Supplemental File S1.
Neuroimaging acquisition and processing
In a subset of 19 participants (9 HD and 10 age and sex‐matched controls) for whom a 3 T magnetic resonance imaging (MRI) study was available, an additional exploratory analysis was performed to address the possible relationship between the IGF‐1 levels and brain structure. Neuroimaging procedures, including volume‐based voxel‐based morphometry (VBM), gray matter volume (GMV), and surface‐based cortical thickness (Cth) are described in Supplemental File S2.
Outcome measures
We included the Ekman 60 faces total score, the eyes test (social cognition outcome measures), and IGF‐1 concentration levels as the first outcome measures. Secondary outcome measures included CAG repeats length, TFC, UHDRS‐TMS, UHDRS‐Cog, and AES scores, and other hypothalamic hormone concentration levels.
Sample size calculation
Based on previous literature using the Ekman test mean differences as the first outcome, 19 assuming a pooled standard deviation of 20 units and 20% dropout rate, the study would require a sample size of 20 subjects for each group to achieve a power of 80% and a level of significance of 5% (two‐sided), for detecting a true difference in means between the test and the reference group of 20 units. 20
Statistical analysis
Analyses were done using the software IBM‐SPSS 28. We conducted group comparisons between HD and control participants, and all tests were two‐tailed with a significance level set at P < 0.05. We conducted exploratory analyses, and there was no formal adjustment for multiple testing because all hypotheses tested are interesting in their own right. 21 Post hoc bivariate correlations were performed between hypothalamic–pituitary hormone levels with clinical rating scales in untreated HD subjects. In addition, we conducted a multivariate linear regression analysis, Ekman 60 faces test as the dependent variable, the IGF‐1 levels as the independent variable, and age, gender, group of participants (HD vs. controls), and intake of antidopaminergic and antidepressant drugs as the covariates.
To confirm whether the structural brain correlates of IGF‐1 levels in HD, where related to the inherent neurodegeneration occurring in this population, we performed a group comparison of VBM‐GMV and Cth data between HD and controls. Voxel‐wise VBM‐GMV and vertex‐wise Cth metrics were introduced into a general linear model (GLM) to explore the structural brain relationship with IGF‐1 levels, with age and CAG repeat length as nuisance covariates given their impact on brain structure. We considered significant clusters surviving P < 0.05 and family‐wise error (FWE) correction for multiple comparisons using random field theory for VBM and a Monte‐Carlo simulation with 10,000 repeats for Cth. In addition, we analyzed the possible relationship between IGF‐1 levels with Ekman test scores, GMV, and Cth in the various brain‐level clusters using a correlation model in the HD group.
Results
We identified 30 HD candidates of those 22 met inclusion and exclusion criteria: 9 males (41%), 13 females (59%), with a mean age of 58.09 ± 9.72 years, 19 controls (9 [47%] males and 10 [53%] females), with a mean age of 52.00 ± 9.69 years (Table 1). Demographics and treatments were not significantly different between both groups, except for higher frequency of postmenopausal women (P = 0.02) and higher intake of antidopaminergic and antidepressant drugs in the HD group compared to controls (P = 0.002, P = 0.01, respectively) (Table 1). Higher concentrations of vasopressin with higher plasma and urine osmolality, lower 17ß estradiol, a trend for higher prolactin, LH, cortisol, GH and IGF‐1, and lower oxytocin levels were found in the HD group compared to controls (Table 1, Supplemental tables S1, and S2).
TABLE 1.
Clinical characteristics comparison between HD patients and controls
| Controls (n) | HD patients (n) | P value | |
|---|---|---|---|
| Males/females (%) | 9/10 (19) | 9/13 (22) | 0.68 |
| Age (yr) | 52.00 ± 9.69 (19) | 58.09 ± 9.73 (22) | 0.052 |
| Postmenopausal women (%) | 6 (60) (10) | 13 (100) (13) | 0.02 |
| Education (>high school) (%) | 17 (89.5) (19) | 18 (81.8) (22) | 0.67 |
| Current smoking (%) | 6 (31.58) (19) | 6 (27.27) (22) | 0.763 |
| Antidopaminergics, yes (%) | 0 (19) | 9 (40.91) (22) | 0.002 |
| Antidepressants, yes (%) | 2 (10.53) (19) | 10 (45.45) (22) | 0.014 |
| Benzodiazepines, yes (%) | 1 (5.26) (19) | 6 (27.27) (22) | 0.09 |
| Ekman total score | 52.79 ± 4.23 (19) | 37.68 ± 7.59 (22) | <0.0001 |
| Untreated subjects | 53.41 ± 2.47 (17) | 40 ± 8.60 (9) | NA |
| Eyes test | 35.00 (35.00; 36.00) (19) | 34.50 (32.75; 35.00) (22) | 0.008 |
| Untreated subjects | 35.00 (34.50; 36.00) (17) | 34.00 (31.50; 35.00) (9) | NA |
| Apathy evaluation scale | 20.00 (18.00; 25.00) (19) | 33.50 (28.00; 41.25) (22) | 0.0001 |
| Untreated subjects | 20.00 (18.00; 24.00) (17) | 35.00 (29.50; 36.50) (9) | NA |
| IGF‐1 (ng/mL) | 90.10 (67.90; 108.00) (17) | 96.65 (88.57; 116.25) (9) | 0.11 |
| Male | 68.00 (60.40; 116.55) (9) | 106.00 (74.70; 136.50) (9) | NA |
| Female | 94.80 (78.30; 118.75) (10) | 96.00 (91.80; 111.00) (13) | NA |
| Untreated subjects | 92.20 (67.95; 125.50) (17) | 95.90 (81.30; 133.50) (9) | NA |
Note: Data are expressed in means ± standard deviation or median (interquartile range). Few variables were stratified based on taking antidopaminergic or antidepressants drugs (untreated subjects).
Abbreviations: HD, Huntington's disease; NA, not applied; IGF‐1, insulin‐like growth factor‐1.
Higher AES scores were found in the HD group compared to controls (P < 0.001) and in participants on antidepressants (P = 0.002) and antidopaminergic drugs (P < 0.001) compared to untreated subjects (Table 1). Similar findings were found with higher IGF‐1 levels (Table 1) and lower Ekman scores in the HD group compared to controls (Figs. S1). Moreover, in untreated HD subjects, Ekman scores were highly correlated with IGF‐1 levels (r s = 0.81) and moderately with oxytocin levels (r s = 0.45); AES scores were negatively correlated with oxytocin levels (r s = −0.44); and higher UHDRS‐TMS scores with lower IGF‐1 levels (r s = −0.78) (Supplemental File S3). In multivariate regression analysis, lower Ekman scores were more likely in HD patients (β = −12.25, 95% CI = 16.51; −7.98, P < 0.001), and on antidopaminergic drugs (β = −5.91, 95% CI = −11.11; −0.11, P = 0.02). In contrast, higher Ekman total scores were associated with higher IGF‐1 levels (β = 0.06, 95% CI = 0.001; 0.12, P = 0.04) (Supplemental Table S3). According to this model, with 1‐unit IGF‐1 increase, the Ekman total scores increased 0.06 (95% CI = 0.003–0.13, P = 0.04). This model explained 69% of the variability of the Ekman total scores.
As expected, HD patients showed widespread cortical and subcortical atrophy with respect to controls, including the set of regions showing a significant association with IGF‐1 levels in the HD group (Fig. 1A) and reduced VBM and GMV (top) and cortical thickness (bottom) when compared to controls (P < 0.05 corrected) (Fig. 1B). Lower IGF‐1 levels correlated with lower GMV and cortical thinning in the HD group (Supplemental Tables S4 and S5). No significant neuroimaging correlates were obtained when testing for a negative correlation between IGF‐1 levels and brain atrophy in the HD group, nor increased GMV/Cth in the HD group compared to controls.
FIG. 1.
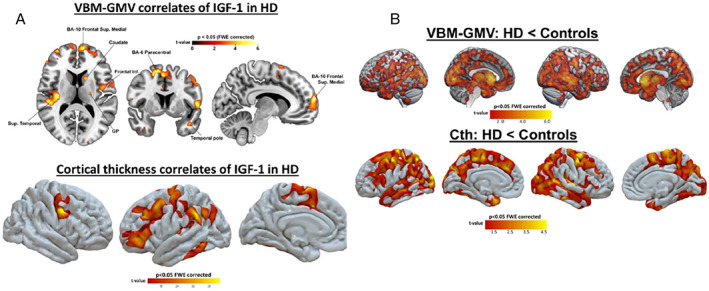
(A) voxel‐based morphometry (VBM)‐gray matter volume (GMV) (top) and cortical thickness (bottom) correlates of insulin‐like growth factor 1 (IGF‐1) in the Huntington's disease (HD) group. Lower levels of this hormone were associated with both reduced GMV and cortical thinning, mainly in frontotemporal regions (P < 0.05 corrected). No regions showed a negative correlation between this hormone and brain structure; (B) Regions where HD patients showed reduced volume‐based VBM and GMV (top) and cortical thickness (bottom) when compared to controls (P < 0.05 corrected). No regions showed increased gray matter in the HD group compared to controls.
Discussion
Based on these preliminary findings obtained from a small sample, otherwise well clinically characterized HD cohort, our study suggests a hormonal‐clinical‐brain structure framework, where abnormal IGF‐1 function is associated with brain atrophy leading to impaired social cognition in HD. According to our results, IGF‐1 seems to be the most robust peptide associated with social cognition impairment in HD. 22 In post hoc analysis, higher IGF‐1 and oxytocin levels were positively correlated with better social cognition function, and lower oxytocin and IGF‐1 levels with higher apathy and motor impairment, respectively. Similarly, other authors have found an association between lower oxytocin plasmatic and cerebrospinal fluid levels with impaired social cognition in HD. 23 , 24
The association between IGF‐1 and social cognition might be explained by its hypothetical neuroprotective role. According to previous literaure, IGF‐1 activates the enzyme serine/threonine kinase Akt, which phosphorylates the mutant huntingtin protein at serine 421, 22 promoting neuronal survival and reducing tau phosphorylation in animal models. 22 , 25 , 26 However, it is intriguing why the IGF‐1 was associated with social cognition impairment in HD, when in both groups of participants, the IGF‐1 concentration levels were within the age/gender normal range, with a trend for higher concentrations in the HD group. A hypothetical explanation could be the lack of IGF‐1 function, and the elevation of IGF‐1 level might reflect a resistant state, 27 theoretically secondary to a loss of sensitivity to GH in HD.
Of note, we found a relationship between IGF‐1 levels and the structural integrity in a set of brain regions involved in social cognition, 28 and particularly vulnerable to HD neuropathology. One possibility to explore in future studies would be that IGF‐1 abnormalities present at birth contribute to brain structure during neurodevelopment in HD. 29 A second possibility would be that IGF‐1 abnormalities occur at the receptor level or later in life, promoting damaging effects and consequently aggravating brain atrophy in certain areas of GMV. 30 A third possibility would be that peripheral IGF‐1 concentration levels might not be correlated with central IGF‐1 concentration levels.
We are aware of the main limitations of this study, and it is not possible to develop any causal model around this relationship with the present data. The exclusion of HD patients on medication in some analyses may result in selection bias, excluding more severely affected HD patients. In addition, we collected samples at a one‐time point in the morning, excluding the possibility of analyzing the circadian rhythmicity in our sample. In contrast, we have reported preliminary novel results by integrating the HD clinical phenotype, endocrine function, and neuroimaging findings, which deserve more profound analysis.
In conclusion, our results suggest the clinical implication of IGF‐1 in social cognition and brain structure. These data may serve other authors to generate new hypotheses for understanding the pathophysiology and conduct larger sample size studies to confirm these preliminary findings.
Author Roles
(1) Research project: A. Conception; B. Organization; C. Execution. (2) Analysis: A. Design; B. Execution; C. Review and Critique. (3) Manuscript Preparation: A. Writing of the First Draft; B. Review and Critique.
C.G.P.: 1A, 1B, 1C, 2A, 2B, 2C, 3A, 3B.
S.I.M.H.: 1C, 2C, 3B.
F.S.S.: 1C, 2C, 3B.
M.M.P.: 1C, 3B.
S.G.M.: 1C, 3B.
P.A.B.: 1C, 3B.
L.M.P.: 1C, 3B.
S.C.: 1C, 2B, 3B.
C.C.: 1C, 3B.
E.A.G.: 1C, 3B.
E.R.M.: 1C, 3B.
A.A.A.: 1C, 3B.
J.N.R.: 1C, 3B.
M.S.R.: 1C, 3B.
N.M.: 1C, 3B.
L.A.: 1C, 3B.
I.M.S.: 1C, 3B.
D.P.: 1C, 3B.
J.R.: 1C, 3B.
M.D.F.: 1C, 2B, 3B.
I.M.P.: 1C, 3B.
E.C.: 1A, 1B, 1C, 2A, 2B, 2C, 3A, 3B.
Disclosures
Ethical Compliance Statement
We confirm that we have read the Journal's position on issues involved in ethical publication and affirm that this work is consistent with those guidelines. This study was approved by the Institutional Review Board of the Complejo Universitario Burgos and Soria (Spain) (Ceim 1973), and all subjects signed the informed consent form before participating.
Funding Sources and Conflicts of Interest
Study funded by Gerencia Regional de Salud de Castilla y León (Sacyl GRS 1768/A/18).
Financial Disclosures for the Previous 12 Months
C.G.P. and E.C. have consulting fees for UCB, Allergan, and AbbVie. S.I.M.H., F.S.S., M.M.P., S.G.M., P.A.B., L.M.P.; S.C.; E.A.G., E.R., A.A.A., and J.N.R report no disclosures.
Data Sharing Statement
We will provide data sharing information on reasonable request.
Supporting information
Supplemental S1. Supplemental file.
Figure S1. Ekman‐60 face scores in relation to insulin‐like growth factor‐1 levels in patients with Huntington's disease.
Figure S2. Ekman‐60 face scores in relation to insulin‐like growth factor‐1 levels in the control group.
Acknowledgments
We are grateful to all participants for their time and efforts.
Relevant disclosures and conflict of interest are listed at the end of this article.
References
- 1. Bora E, Velakoulis D, Walterfang M. Social cognition in Huntington's disease: a meta‐analysis. Behav Brain Res 2016;297:131–140. [DOI] [PubMed] [Google Scholar]
- 2. Aziz NA, Pijl H, Frolich M, Roelfsema F, Roos RA. Altered thyrotropic and lactotropic axes regulation in Huntington's disease. Clin Endocrinol 2010;73:540–545. [DOI] [PubMed] [Google Scholar]
- 3. Shirbin CA, Chua P, Churchyard A, et al. Cortisol and depression in pre‐diagnosed and early stage Huntington's disease. Psychoneuroendocrinology 2013;38:2439–2447. [DOI] [PubMed] [Google Scholar]
- 4. Aziz NA, Pijl H, Frolich M, van der Graaf AW, Roelfsema F, Roos RA. Increased hypothalamic‐pituitary‐adrenal axis activity in Huntington's disease. J Clin Endocrinol Metab 2009;94:1223–1228. [DOI] [PubMed] [Google Scholar]
- 5. Naia L, Ferreira IL, Cunha‐Oliveira T, et al. Activation of IGF‐1 and insulin signaling pathways ameliorate mitochondrial function and energy metabolism in Huntington's disease human lymphoblasts. Mol Neurobiol 2015;51:331–348. [DOI] [PubMed] [Google Scholar]
- 6. Skuse D, Lawrence K, Tang J. Measuring social‐cognitive functions in children with somatotropic axis dysfunction. Horm Res 2005;64(Suppl 3):73–82. [DOI] [PubMed] [Google Scholar]
- 7. Benchimol EI, Smeeth L, Guttmann A, et al. The reporting of studies conducted using observational routinely‐collected health data (RECORD) statement. PLoS Med 2015;12:e1001885. [DOI] [PMC free article] [PubMed] [Google Scholar]
- 8. http://www.ich.org (acccessed on December/2021).
- 9. Unified Huntington's Disease Rating Scale . Reliability and consistency. Huntington Study Group. Mov Disord 1996;11:136–142. [DOI] [PubMed] [Google Scholar]
- 10. Benton AL, Sivan AB, Hamsher K, Varney NR, Spreen O. Contributions to Neuropsychological Assessment. New York, NY: Oxford University Press; 1994. [Google Scholar]
- 11. Kingma EM, van Duijn E, Timman R, van der Mast RC, Roos RA. Behavioural problems in Huntington's disease using the problem behaviours assessment. Gen Hosp Psychiatry 2008;30:155–161. [DOI] [PubMed] [Google Scholar]
- 12. Folstein MF, Folstein SE, McHugh PR. “Mini‐mental state”. A practical method for grading the cognitive state of patients for the clinician. J Psychiatr Res 1975;12:189–198. [DOI] [PubMed] [Google Scholar]
- 13. Penney JB Jr, Vonsattel JP, MacDonald ME, Gusella JF, Myers RH. CAG repeat number governs the development rate of pathology in Huntington's disease. Ann Neurol 1997;41:689–692. [DOI] [PubMed] [Google Scholar]
- 14. Shoulson I. Huntington disease: Functional capacities in patients treated with neuroleptic and antidepressant drugs. Neurology 1981;31:1333–1335. [DOI] [PubMed] [Google Scholar]
- 15. Philip RC, Whalley HC, Stanfield AC, et al. Deficits in facial, body movement and vocal emotional processing in autism spectrum disorders. Psychol Med 2010;40:1919–1929. [DOI] [PubMed] [Google Scholar]
- 16. Baron‐Cohen S, Wheelwright S, Hill J, Raste Y, Plumb I. The “reading the mind in the eyes” test revised version: a study with normal adults, and adults with Asperger syndrome or high‐functioning autism. J Child Psychol Psychiatry 2001;42:241–251. [PubMed] [Google Scholar]
- 17. Marin RS, Biedrzycki RC, Firinciogullari S. Reliability and validity of the apathy evaluation scale. Psychiatry Res 1991;38:143–162. [DOI] [PubMed] [Google Scholar]
- 18. Kremer B, Goldberg P, Andrew SE, et al. A worldwide study of the Huntington's disease mutation. The sensitivity and specificity of measuring CAG repeats. N Engl J Med 1994;330:1401–1406. [DOI] [PubMed] [Google Scholar]
- 19. Diehl‐Schmid J, Pohl C, Ruprecht C, Wagenpfeil S, Foerstl H, Kurz A. The Ekman 60 faces test as a diagnostic instrument in frontotemporal dementia. Arch Clin Neuropsychol 2007;22:459–464. [DOI] [PubMed] [Google Scholar]
- 20. Dhand NK, Khatkar MS. Statulator: An online statistical calculator. Sample Size Calculator for Comparing Two Independent Means. Accessed 5 February 2022 at 2022. http://statulator.com/SampleSize/ss2M.html. [Google Scholar]
- 21. Rothman KJ. No adjustments are needed for multiple comparisons. Epidemiology 1990;1:43–46. [PubMed] [Google Scholar]
- 22. Humbert S, Bryson EA, Cordelieres FP, et al. The IGF‐1/Akt pathway is neuroprotective in Huntington's disease and involves huntingtin phosphorylation by Akt. Dev Cell 2002;2:831–837. [DOI] [PubMed] [Google Scholar]
- 23. Hellem MNN, Cheong RY, Tonetto S, et al. Decreased CSF oxytocin relates to measures of social cognitive impairment in Huntington's disease patients. Parkinsonism Relat Disord 2022;99:23–29. [DOI] [PubMed] [Google Scholar]
- 24. Unti E, Mazzucchi S, Frosini D, et al. Social cognition and oxytocin in Huntington's disease: new insights. Brain Sci 2018;8:161. [DOI] [PMC free article] [PubMed] [Google Scholar]
- 25. Dore S, Kar S, Zheng WH, Quirion R. Rediscovering good old friend IGF‐I in the new millenium: possible usefulness in Alzheimer's disease and stroke. Pharm Acta Helv 2000;74:273–280. [DOI] [PubMed] [Google Scholar]
- 26. Hong M, Lee VM. Insulin and insulin‐like growth factor‐1 regulate tau phosphorylation in cultured human neurons. J Biol Chem 1997;272:19547–19553. [DOI] [PubMed] [Google Scholar]
- 27. Busiguina S, Fernandez AM, Barrios V, Clark R, Tolbert DL, Berciano J, Torres‐Aleman I. Neurodegeneration is associated to changes in serum insulin‐like growth factors. Neurobiol Dis 2000;7:657–665. [DOI] [PubMed] [Google Scholar]
- 28. Sugranyes G, Kyriakopoulos M, Corrigall R, Taylor E, Frangou S. Autism spectrum disorders and schizophrenia: meta‐analysis of the neural correlates of social cognition. PLoS One 2011;6:e25322. [DOI] [PMC free article] [PubMed] [Google Scholar]
- 29. O'Kusky J, Ye P. Neurodevelopmental effects of insulin‐like growth factor signaling. Front Neuroendocrinol 2012;33:230–251. [DOI] [PMC free article] [PubMed] [Google Scholar]
- 30. Bianchi VE, Locatelli V, Rizzi L. Neurotrophic and neuroregenerative effects of GH/IGF1. Int J Mol Sci 2017;18:2441. doi: 10.3390/ijms18112441 [DOI] [PMC free article] [PubMed] [Google Scholar]
Associated Data
This section collects any data citations, data availability statements, or supplementary materials included in this article.
Supplementary Materials
Supplemental S1. Supplemental file.
Figure S1. Ekman‐60 face scores in relation to insulin‐like growth factor‐1 levels in patients with Huntington's disease.
Figure S2. Ekman‐60 face scores in relation to insulin‐like growth factor‐1 levels in the control group.