

Summary
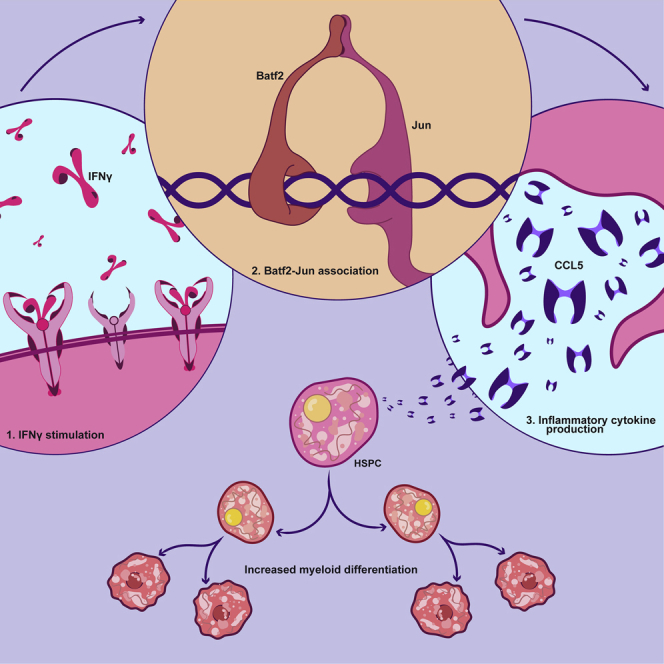
Basic leucine zipper ATF-like transcription factor 2 (BATF2), an interferon-activated immune response regulator, is a key factor responsible for myeloid differentiation and depletion of HSC during chronic infection. To delineate the mechanism of BATF2 function in HSCs, we assessed Batf2 KO mice during chronic infection and found that they produced less pro-inflammatory cytokines, less immune cell recruitment to the spleen, and impaired myeloid differentiation with better preservation of HSC capacity compared to WT. Co-IP analysis revealed that BATF2 forms a complex with JUN to amplify pro-inflammatory signaling pathways including CCL5 during infection. Blockade of CCL5 receptors phenocopied Batf2 KO differentiation defects, whereas treatment with recombinant CCL5 was sufficient to rescue IFNγ-induced myeloid differentiation and recruit more immune cells to the spleen in Batf2 KO mice. By revealing the mechanism of BATF2-induced myeloid differentiation of HSCs, these studies elucidate potential therapeutic strategies to boost immunity while preserving HSC function during chronic infection.
Subject areas: Biological sciences, Molecular physiology, Immunology
Graphical abstract
Highlights
-
•
The ATF-family transcription factor BATF2 is an amplifier of IFNγ responses in HSCs
-
•
BATF2 activates expression of the chemokine CCR5 to promote myeloid differentiation
-
•
Maraviroc therapy may prevent infection-associated cytopenias in chronic infection
Biological sciences; Molecular physiology; Immunology
Introduction
Chronic infections including tuberculosis (TB) and HIV are estimated to infect over 1.7 billion people worldwide (CDC, 2018) and are responsible for over 1.5 million deaths per year (WHO, 2020). These life-threatening diseases are associated with bone marrow suppression and increased risk for opportunistic infections.1,2,3 Indeed, 90% of military TB patients co-infected with HIV suffer from pancytopenia, a suppression of all three blood lineages, which can lead to life-threatening morbidities and death.1 Acute infections also can affect hematopoiesis. For example, acute bacterial and viral infections impair hematopoietic stem cell (HSC) engraftment and are a key risk factor for overall poor outcome in HSC transplant patients.4,5 Understanding how infection affects normal hematopoiesis is necessary to improve outcomes for these patients.
Blood cells arise from hematopoietic stem and progenitor cells (HSPCs) located in the bone marrow. Among these, HSCs have the unique ability to self-renew, ensuring lifelong blood production, and to give rise to all cellular blood components including platelets, white blood cells (WBC), and red blood cells (RBC). HSPCs consist of HSCs and multipotent progenitors (MPPs) including MPP1, MPP2, MPP3, and MPP4, which do not have long-term self-renewal capacity. Work from our lab and others has shown that chronic infections significantly decrease the self-renewal of HSCs.6 In normal conditions, HSCs are quiescent; however, in response to inflammatory stimuli including interferon-gamma (IFNγ) and C-C motif chemokine ligand 5 (CCL5), HSCs rapidly differentiate into downstream immune cells.7,8 The precise mechanisms by which chronic infections impair HSC self-renewal and deplete the HSC pool are poorly understood and are the topic of this study.
Using an established mouse model of Mycobacterium avium infection, a systemic intracellular bacterial infection that promotes a persistent IFNγ-mediated immune response,9 we showed that HSCs are depleted during chronic infection largely through excessive terminal differentiation at the expense of self-renewal.6 We further demonstrated that myeloid differentiation of HSCs during chronic infection is dependent on Basic leucine zipper ATF-like transcription factor 2 (BATF2).6 BATF2 is a member of the ATF transcription factor family, whose members typically interact with other transcription factors such as c-JUN,10,11 interferon regulatory factor 1 (IRF1),12 and nuclear factor kappa-light-chain-enhancer of activated B cells (NF-kB).13 BATF2 has been suggested to be a biomarker for Mycobacterium tuberculosis infection14 and to play a key role in activating macrophages12 and regulating type 1 and type 2 immune responses.12,14,15 We showed that Irf116 and NF-kB6 are upregulated in HSCs during M. avium chronic infection. However, the mechanism of action by which BATF2 promotes HSC differentiation, including its binding partners and key targets, has heretofore been undefined. Here, we used a chronic infection mouse model to test the hypothesis that BATF2 is a key transcriptional mechanism by which HSPCs respond to inflammation. We used cleavage under targets and release using nuclease (CUT&RUN) sequencing to identify transcriptional targets of BATF2 and validate these findings with pharmacologic approaches. Overall, our findings elucidate how BATF2 contributes to HSC differentiation and depletion during chronic infection.
Results
Batf2 KO mice show reduced early immune responses during M. avium infection
In prior work, we identified BATF2 to be a critical factor mediating HSC differentiation and depletion in response to chronic infection.6 Specifically, HSPCs were observed to differentiate in response to IFNγ exposure in vitro, but differentiation was impaired when Batf2 was knocked out by CRISPR editing. To further evaluate BATF2 function in the hematopoietic system, we created a Batf2 knock-out (KO) animal model in a C57BL/6 background in collaboration with the genetically engineered mouse core at BCM.17 We examined the blood, spleen, and bone marrow from naive WT and Batf2 KO mice by flow cytometry. At baseline, Batf2 KO and WT mice had similar immune profiles (Figures S1A–S1H), with normal development of immune cells as reported in another Batf2 KO model in the 129S6 genetic background.18
To examine the role of BATF2 in early cellular responses to the infection, we evaluated M. avium-infected WT and Batf2 KO mice at several time points following infection (Figure 1A). Batf2 KO mice showed an immune response that was similar to WT at 2 weeks of infection (Figure S1K), and the bacterial load was similar between the two strains at 2 and 4 weeks after infection (Figures 1J and S1K). There were no notable differences in clinical symptoms because of the infection caused by M. avium except that, starting at 4 weeks of infection, the Batf2 KO mice displayed a reduced overall spleen size (Figure 1G). Peripheral blood (PB) from the infected animals showed a similar decline in RBCs in both WT and Batf2 KO mice, but platelets were significantly higher in Batf2 KO mice compared to WT by 4 weeks of infection (Figures S1N and S1O). Next, we analyzed the kinetics of the cellular immune response to infection by flow cytometry. At 4 weeks after infection, we detected a lower number of inflammatory macrophages (Figures 1E and S1J) in the spleens of Batf2 KO mice compared to WT. These differences were noted at 4 weeks after infection, when there were no detectable differences in bacterial load between the strains.
Figure 1.

Batf2 KO mice show reduced immune response compared to WT during M. avium infection
(A) Experimental design: WT and Batf2 KO mice were infected with M. avium. The mice were euthanized for analysis at 0, 4, 6, and 16 weeks after infection.
(B–D) Serum cytokine levels of IFNγ (B), TNFα (C), and CCL5 (D) in WT and Batf2 KO mice in 0, 4, 6, 16 weeks after infection.
(E and F) Flow cytometric analysis showing the number of inflammatory macrophages (CD11b+Ly6g-Ly6c+) (E), and M. avium-antigen-specific T cell producing TNFα and IFNγ (CD4+CD44+Ag85b-tetramer + TNFα+IFNγ+) (F) in the spleens from WT and Batf2 KO mice in 0, 4, 6, and 16 weeks after infection. Data representing spleen weights (G-I) and (J-L) M. avium bacterial load of WT and Batf2 KO mice at 4, 6, and 16 weeks after infection. Data representative of 2 independent experiments. Mean ± SEM with t-test comparing WT and Batf2 KO mice in the same timepoint. N = 5 mice per group. ∗p<0.05, ∗∗p<0.01, ∗∗∗p<0.001, ∗∗∗∗p<0.0001.
Beginning at 6 weeks after infection, there were more marked differences between the strains. The number of activated M. avium antigen-specific T cells (CD4+CD44+Ag85b-Tetramer + IFNγ+TNFα) (Figures 1F, S1I, and S1P) was higher in WT compared to Batf2 KO mice. Cytokine profiling demonstrated that Batf2 KO mice produced less IFNγ, TNFα, and CCL5, critical mediators of myeloid differentiation and immune cell recruitment, beginning at 6 weeks after infection compared to WT (Figures 1B–1D). We observed a similar trend in IL-6, but levels were not significantly different (Figure S1M). We noted that levels of IFNγ and TNFα trended up at 16 weeks of infection. Kayama et al. reported that their Batf2 KO mouse model developed rectal prolapse after 28 weeks and had a higher propensity for colitis on induction with dextran sodium sulfate (DSS) compared to WT mice.11 Therefore, we assessed whether increased inflammation in our mice could be because of colitis. Our mice were less than 28 weeks of age at the time of analysis and did not show signs of rectal prolapse or colitis. In particular, the intestines showed normal colon length and no signs of bleeding (data not shown). Overall, the results demonstrate that Batf2 KO mice have dampened systemic inflammatory cytokines and fewer inflammatory macrophages in the spleen on M. avium infection compared to WT mice, despite a similar starting bacterial load.
Chronically infected Batf2 KO mice have reduced myeloid differentiation and bacterial loads in the spleen compared to WT mice
We previously demonstrated that chronic infection of mice with M. avium depletes the HSC population, eventually leading to bone marrow failure and pancytopenia after 3–4 months of infection.6 Furthermore, we previously reported that Batf2 KO mice are relatively resistant to depletion of HSCs on chronic infection, as the number of HSCs, determined by both flow cytometry and transplant analysis, is preserved on infection.17 These results imply that depletion of HSCs during chronic infection could be because of a BATF2-dependent process, such as differentiation. To further confirm this finding, we measured the number of HSCs in the bone marrow of WT or Batf2 KO mice at 4 months after chronic M. avium infection (Figure 2A). Although HSC frequency was similar in WT and KO mice at 1 month after infection, the HSC frequency significantly declined in WT but not KO mice (Figure 2B), suggesting that BATF2 plays a role in HSC depletion. Consistent with preserved BM function, Batf2 KO mice were more resistant to anemia and thrombocytopenia on chronic infection compared to WT mice (Figures 2C and 2D). Altogether, these findings indicate that BATF2 deletion preserves self-renewal of HSCs during chronic infection, enabling normal counts of RBCs and platelets after persistent infection.
Figure 2.

Compared to WT, Batf2 KO mice show reduced myeloid differentiation and lower bacterial loads in the spleen during chronic infection
(A) M. avium chronically infection model. Batf2 KO and WT mice (8–10 weeks old) were infected with 2 × 10⁶ CFU of M. avium monthly for four months.
(B) HSCs as percent of WBM in 1-month and 4-month infected mice. n = 5–10 mice per group. Data represent mean ± SEM with Kruskal-Wallia test between the groups at each time point. ∗p<0.05, ∗∗p<0.01, ∗∗∗p<0.001, ∗∗∗∗p<0.0001.
(C–M) CBC analysis showing the number of red blood cell (C) and platelets (D) from four-month M. avium infected Batf2 KO and WT mice with the naive controls. Flow cytometric analysis showing the number of inflammatory (E) Ly6c+, (F) Ly6c-macrophages, and (G) T cells in the blood, (H) MPP3, (I) granulocyte-monocyte progenitor, (J) common myeloid progenitor, (K) Ly6c+ and (L) Ly6c-macrophages, and (M) T cells in the bone marrow from four-month M. avium infected Batf2 KO and WT mice with naive control.
(N, O and Q) Serum cytokine levels of (N) IFNγ, (O) TNFα, (Q) CCL5 in WT and Batf2 KO mice that were naive or infected repeatedly for 4 months with M. avium.
(P––T) Representative histopathology sections (×4 magnification) in the spleens at 4 months after infection for H&E (scale bar = 500 μm). Data representing (R) spleen weights, (S) number of granulomas, and (T) M. avium bacterial load of WT and Batf2 KO mice at 4 months after infection. Data is representative of 3 independent experiments. N = 5–10 per group. Mean ± SEM with ANOVA test for four groups and t test for two groups. ∗p<0.05, ∗∗p<0.01, ∗∗∗p<0.001, ∗∗∗∗p<0.0001.
In contrast with the RBC and platelet numbers, there were significantly fewer Ly6c+ and Ly6c-macrophages in the PB (Figures 2E, 2F, and S2F) and BM (Figures 2K, 2L, and S2E) of repeatedly infected Batf2 KO mice compared to the WT controls. We observed a similar trend in other myeloid cells such as dendritic cell (DC) subsets in the PB (Figures S2A and S2F) and BM (Figures S2B and S2E) of infected Batf2 KO animals, although trends varied among different DC subsets. Among HSPCs in the bone marrow, myeloid-biased progenitors including MPP3, granulocyte-monocyte progenitors (GMPs), and common myeloid progenitor (CMP) were decreased in Batf2 KO mice compared to WT in the presence of infection (Figures 2H–2J and S2D). We excluded Sca1 from the phenotypic definitions of HSPCs because of nonspecific upregulation in response to IFNγ.19 Notably, we did not see depletion of the other progenitors such as MPP1, MPP2, MPP4, common lymphoid progenitor, or megakaryocyte–erythroid progenitors, even after four months of infection (Figure S2C). Lymphoid cells such as T cells in the PB (Figures 2G and S2F) and BM (Figures 2M and S2E) were preserved in Batf2 KO mice. Altogether, these results suggest that BATF2 plays a role in promoting myeloid differentiation in response to infection, such that MPP3, GMP, and macrophages, are specifically depleted in the Batf2 KO.
Prior studies have demonstrated that mycobacteria can hijack myeloid cells, riding along in macrophages to disseminate throughout the body.20 Given that myeloid differentiation was impaired in Batf2 KO mice, we speculated these mice might have less bacterial dissemination and reduced bacterial loads compared to WT. Indeed, hematoxylin and eosin (H&E) stained splenic sections showed infected Batf2 KO mice had reduced splenic granuloma size and number compared to infected WT (Figures 2P and S2R), which correlated with reduced overall spleen size and bacterial load (Figures 2Q and 2S). Moreover, we found that repeatedly infected Batf2 KO mice produced less TNFα, and CCL5 compared to WT mice (Figures 2N and 2O), consistent with the cytokine profiling from our single challenge experiments. Altogether, these findings demonstrate that Batf2 KO mice have impaired macrophage differentiation, lower recruitment of inflammatory macrophages to the spleen, and less bacterial dissemination in the spleen at late time points compared to WT, consistent with our prior findings.6
Batf2 KO mice show improved HSC self-renewal in response to chronic infection compared to WT mice
To even more rigorously assess whether HSCs are better preserved in infected Batf2 KO mice compared to WT, we performed secondary transplants to assess HSC self-renewal capacity in the setting of repeated chronic infection. We sorted HSCs from naive Batf2 KO and WT mice or mice that had been injected monthly with M. avium for four months and transplanted them with CD45.1 WT rescue marrow into lethally irradiated CD45.1 mice. Importantly, no bacteria were transferred to the recipient mice using this method, as confirmed by cultures of the spleen 16 weeks after transplant. Furthermore, donor mice had similar amounts of IFNγ expression at the end of 4 months of infection (Figure 2N), indicating a similar inflammatory milieu for the donor cells. After 16 weeks, CD45.2 HSCs were isolated from recipient mice and transplanted a second time into lethally irradiated CD45.1 mice (Figures 3A and S3A). At 16 weeks after primary transplant, sorted HSCs showed similar engraftment regardless of mouse genotyping (Figures S3B–S3D). However, HSCs from infected Batf2 KO showed higher engraftment and better repopulating capacity than infected WT control at 16 weeks after secondary transplant, indicating Batf2 KO HSCs have a higher self-renewal capacity (Figures 3B–3D). Consistent with earlier data, we detected significantly increased CD45.2 myeloid cells and decreased T and B cells in mice transplanted with HSCs from infected WT compared to naive WT controls, whereas these changes were blunted in the Batf2 KO (Figure 3E).
Figure 3.

Batf2 KO have better HSC self-renewal capacity compared to WT mice in chronic infection
(A) Mouse model of secondary transplant from chronically infected mice.
(B) PB was assessed 16 weeks after transplant, and engraftment is shown as percentage of CD45.2 cells in the blood.
(C and D) The percent (C) and number (D) of HSCs from CD45.2 donor in one tibia.
(E) Percent of myeloid cell, T cells, and B cells of CD45.2 population in the blood. Data represent mean ± SEM with ANOVA test. ∗p<0.05, ∗∗p<0.01, ∗∗∗p<0.001, ∗∗∗∗p<0.0001. N = 4–10 mice per group.
BATF2 forms a complex with JUN in response to IFNγ stimulation in HSPCs
To identify the protein binding partners of BATF2 in HSPCs, we administered IFNγ or saline control to 32D cells, a murine bone marrow cell line,21 and performed co-immunoprecipitation (co-IP) using a monoclonal antibody against BATF2 or IgG (control) (Figure 4A). We first confirmed that our custom BATF2 antibody detected a single band of 30 kDa, the predicted size of BATF2, on western blot (Figure S4). Mass spectrometry (MS) revealed that BATF2 and JUN family were the most abundantly detected co-IP products from IFNγ-treated cells compared to both the IgG and non-IFNγ-treated controls (Figures 4B and 4C). Although we observed upregulation of several other proteins, such as SERPINA3F and IMP3, in our MS data, they were excluded because of low peptide recovery. These results suggest that BATF2 dimerizes with JUN in HSPCs in response to IFNγ stimulation. We were unable to confirm these results by Western blot using specific antibodies in primary hematopoietic cells, likely because of overall low expression of these transcription factors. Nevertheless, the results of our mass spec co-IP are consistent with prior reports of BATF2-JUN interactions.11
Figure 4.

BATF2 forms a complex with JUN in 32D cells during IFNγ stimulation
(A) Experimental design: 32D cells were treated with IFNγ (100 ng/ml) for 17 h. The immunoprecipitation (IP) was performed using antibodies against BATF2 or IgG. The IP product were analyzed by mass spectrometry (MS).
(B) MS volcano plot showing proteins with a significant change in IP product using antibodies against BATF2 or IgG in presence and absence of IFNγ. Control group includes untreated lysates pulled with BATF2 antibody and treated lysates pulled with the preimmune IgG.
(C) MS heatmap showing proteins with a significant change in IP product using antibodies against BATF2 or IgG in presence and absence of IFNγ. Numbers represent distinct peptide counts that map to the corresponding gene locus; the heatmap color corresponds to the log-transformed z-scored iBAQ expression values.
BATF2 amplifies pro-inflammatory signaling pathways in HSCs during chronic infection
To further define the mechanisms underlying BAFT2-driven HSC depletion during chronic infection, we performed RNA sequencing (RNA-seq) analysis of WT and Batf2 KO HSCs in the presence and absence of infection. M. avium infection significantly induced the expression of inflammatory response pathways (Figures 5A–5C) and common IFNγ-regulated genes such as Stat1 and Stat2 (Figure 5D). The number of induced genes was not different when comparing HSCs from infected WT versus Batf2 KO mice (Figure S5A), but the overall degree of induction of several IFN response genes, including Stat3, Mx2, Bst2, Ifi35, and Ifngr2 was higher in the WT compared to Batf2 KO, as shown by the numerous genes labeled in purple lying below the diagonal (Figures 5D and S5C). Together, these findings suggest that BATF2 amplifies the IFN response in HSCs, augmenting expression of IFN-induced genes rather than serving to activate the expression of a distinct target gene set.
Figure 5.

BATF2 amplifies pro-inflammatory signaling pathways in HSC in chronic infection
(A) RNA-seq volcano plot presenting genes with significant change (q < 0.05) between HSCs from infected and naive WT mice.
(B) RNA-seq volcano plot presenting genes with significant change (q < 0.05) between HSCs from infected and naive Batf2 KO mice.
(C) Selected top-enriched hallmark, biocarta, and reactome gene sets in HSCs during infection from WT and Batf2 KO mice.
(D) Changes in expression levels of genes associated with the Hallmark Interferon gamma response. The X- and Yaxes represent the log2 fold-changes in gene expression on infection of WT and Batf2 KO mice, respectively. Colors mark the statistical significance of the change: genes significantly changed only the wildtype mice (green), only in Batf2 KO mice (blue), in both groups (violet), and genes that were not significant changed in any group (gray). Log2 fold changes and their pvalues were calculated using DESeq2. The data include 4 biological replicates.
BATF2 binds to cis-regulatory regions of the ccr5 gene in HSCs in chronic infection
To identify the binding sites for BATF2 in HSCs during M. avium infection, we conducted CUT&RUN sequencing of HSCs from infected WT mice using an anti-BATF2 antibody. We used an anti-IgG antibody as a control to exclude noise and nonspecific binding and an anti-H3K27ac to assess open chromatin. HOMER motif analysis of our sequencing data revealed the highest enrichment for motifs of PU.1, interferon-regulatory factor (IRF), activating transcription factor 4 (ATF4), interferon-sensitive response element (ISRE), and STAT1 (Figure 6A). This finding suggests that BATF2 shares binding motifs with common IFN response mediators. Furthermore, over 95% of CUT&RUN peaks from BATF2 were associated with areas just upstream and downstream of the transcription start of gene coding regions (Figures 6B and S6A), reinforcing its role in the regulation of gene expression. In particular, we found binding of BATF2 at cis elements of ccr5 genes (Figures 6C and S6B). These locations were highly aligned with accessible chromatin positions marked by H3K27ac, suggesting that BATF2 enhanced gene expression in response to infection. Of interest, RNA-seq analysis of gene expression showed a trend toward more effective induction of both Ccr5 (Figure 6D) and its ligand Ccl5 (Figure S5B) in WT versus Batf2 KO HSCs during infection. Taken together, these data indicate that BATF2 interacts with regulatory elements in IFN response genes and increases their expression in response to infection.
Figure 6.

BATF2 binds to cis-regulatory region of ccr5 gene in HSC in chronic infection
(A) CUT&RUN Motif analysis by HOMER showing the enrichment of sequences with lowest pvalues for BATF2 compared with IgG control in HSCs from infected WT mice.
(B and C) GREAT analysis showing percent of genomic regions associated with BATF2 (C) IGV (integrative genomics viewer) tracks of cis-regulatory regions and open chromatin regions of ccr5 genes in HSCs from infected WT. Data is representative of 2 independent experiments. Peak calling was analyzed using macs2 algorithm with q = 0.05.
(D) Log2 fold change expression of ccr5 in HSCs of infected WT and Batf2 KO mice compared to naive controls. Data present four independent experiments.
BATF2 induces CCL5 to promote myeloid differentiation in the bone marrow and recruit immune cells to the spleen
CCL5 plays a role in promoting myeloid differentiation during aging.7 Because we found that induction of CCL5 and its receptor CCR5 on infection were dampened in Batf2 KO mice, we hypothesized that BATF2 drives myeloid differentiation of HSCs by the induction of CCL5. We used qPCR to study the transcript level of Ccl5 in bone marrow cells and found that Ccl5 expression was higher in WT compared to Batf2 KO mice in presence of IFNγ (Figure 7A). Next, we used maraviroc, a CCR5 inhibitor, to block the CCL5 receptor in IFNγ-stimulated Batf2 KO and WT mice (Figure S7A). Blocking CCL5 receptors by maraviroc significantly decreased myeloid differentiation in WT bone marrow cells on IFNγ stimulation, as evidenced by decreased colony formation in methylcellulose. In contrast, maraviroc did not reduce myeloid colony formation by cells from Batf2 KO mice (Figures 7B and S7B). Of note, the baseline colony forming capacity of Batf2 KO mice is higher than that of WT mice, likely because of overall reduced cellularity of the marrow (mostly comprising differentiated myeloid cells) and relative enrichment of progenitors. We observed similar results when we normalized the number of myeloid CFUs to the naive controls (Figure S7H). Overall, these inhibitor studies indicate that whereas WT myeloid differentiation is suppressed by blockade of CCR5 signaling, CCR5 blockade has no effect on Batf2 KO differentiation, likely because these cells already lack CCL5 signal.
Figure 7.

BATF2 induces CCL5 to promote myeloid differentiation in the bone marrow and recruit immune cells to the spleen in chronic infection
(A and B) qPCR of ccl5 in BM cells from WT and Batf2 KO mice in the presence and absence of IFNγ treatment (B) Number of myeloid progenitor colonies from Maraviroc and IFNγ treated mice after 12 days of culture in methylcellulose. Data representative of 2 independent experiments. Data represent mean ± SEM with ANOVA test. N = 3–6 mice per group.
(C and D) Experimental design: WT and Batf2 KO mice were treated with IFNγ for 24 h. The whole bone marrow cells were isolated and incubated with or without CCL5 for 4 h. The cells were cultured in methylcellulose for 12 days (D) Number of myeloid progenitor colonies after 12 days of culture. Data representative of 2 independent experiments. Data represent mean ± SEM with ANOVA test. N = 6 mice per group (E). Experimental design: WT and Batf2 KO mice were infected with M. avium for 4 weeks. The mice were treated with CCL5 every other day for 2 weeks prior to euthanizing.
(F–H) Flow cytometric analysis presenting the number of inflammatory macrophages (F), CD4+T cells (G), and CD8+T cells (H) at 6 weeks after infection in the presence and absence of 2-week CCL5 treatment.
(I) M. avium bacterial load from the spleen of WT and Batf2 KO mice at 6 weeks after infection in the presence and absence of 2-week CCL5 treatment. Data representative of 2 independent experiments. Mean ± SEM with ANOVA test. N = 4–6 mice per group.
To test whether recombinant murine CCL5 could rescue IFNγ-induced myeloid differentiation in Batf2 KO mice, we isolated WBM from Batf2 KO or WT mice in the presence or absence of 24-h IFNγ stimulation and incubated the cells with or without recombinant murine CCL5 (Figure 7C). As expected, IFNγ stimulation increased WT myeloid colony formation, whereas Batf2 KO bone marrow did not respond. Combination treatment with IFNγ and CCL5 did not produce an additive effect on colony formation in the WT background. In contrast, myeloid colony formation was significantly enhanced on administration of CCL5 (Figures 7D and S7I). These findings reveal that CCL5 treatment is sufficient to rescue the myeloid differentiation in Batf2 KO mice. Collectively, the results suggest that BATF2 promotes myeloid differentiation through activation of CCL5.
To better define the role of BATF2-induced CCL5 in immune cell infiltration in the spleen, we treated Batf2 KO and WT mice with recombinant murine CCL5 (100 ng per mouse) every other day for 2 weeks after 4 weeks of M. avium infection (Figure 7E). Notably, CCL5 treatment increased the number of inflammatory macrophages and T cells migrating to the spleen in Batf2 mice treated but not WT mice (Figures 7F–7H and S5B). Dendritic cell infiltration in the spleen increased on CCL5 treatment in Batf2 KO but not WT mice (Figures S7D–S7G). In the spleen, CCL5 treatment increased the number of bacterial CFUs in Batf2 KO mice but induced no change in WT mice (Figure 7I). These results are consistent with the paradigm that the myeloid response to infection promotes dissemination of M. avium, and that CCL5 treatment rescues myeloid infiltration into the spleen in Batf2 KO mice. Overall, our findings indicate that BATF2 induces CCL5 to promote IFNγ-induced myeloid differentiation and to recruit inflammatory macrophages and T cells in response to chronic M. avium infection, supporting bacterial growth and granuloma formation in the spleen.
Discussion
Here, we found that Batf2 KO mice have impaired myeloid differentiation during M. avium infection, leading to significantly reduced pro-inflammatory cytokines (TNFα and CCL5), fewer immune cells infiltrating the spleen, fewer splenic granulomas, and lower bacterial loads compared to WT mice. Deletion of Batf2 in mice decreased myeloid differentiation while preserving the HSC population during repeated M. avium infection. Mechanistically, we found that BATF2 forms a complex with JUN in HSCs and induces CCL5 to promote macrophage differentiation in response to IFNγ stimulation. Overall, these data demonstrate that BATF2 may be a target for therapeutic intervention to preserve the HSC population and improve host immunity in the setting of chronic mycobacterial infection.
We found that BATF2 plays a role as a modulator of the immune response, serving to amplify IFNγ-dependent myeloid differentiation that depletes HSC during chronic M. avium infection. We extended these findings to characterize the overall impact of Batf2 loss of function on the immune response to mycobacterial infection. Our results are in accordance with previous findings showing that macrophages can be co-opted by mycobacteria, which have learned to transport themselves in macrophages and subsequently escape from granulomas to disseminate more widely.14,20 Indeed, BATF2 is upregulated in the whole blood of TB patients and contributes to disease progression. Furthermore, BATF2 plays a critical role in the infiltration of immune cells and inflammation in sarcoidosis, a chronic disease associated with granuloma formation.14,22
Immune signaling pathways drive HSC responses to inflammation including division and differentiation.23 A previous report revealed that CCL5 is upregulated in the aged HSC milieu, causing myeloid skewing.7 Our data provide evidence that BATF2 induces CCL5 production to promote HSC differentiation and increased immune cell infiltration and inflammation in response to infection-induced IFNγ. In support of this model, blocking CCL5 receptors using the CCR5 inhibitor maraviroc reduced IFNγ-induced myeloid differentiation in WT mice but had no impact on Batf2 KO mice. Of note, maraviroc treatment only inhibits CCR5 which is one of the three CCL5 receptors: CCR1, CCR3, and CCR5, and therefore does not result in a total blockade of WT colonies.24 We found that blockade of CCR5 partially mimics the effects of BATF2 deficiency, whereas administration of CCL5 to Batf2 KO mice rescues myeloid differentiation. Together, these studies demonstrate that induction of CCL5 is a mechanism by which BATF2 promotes myeloid differentiation. Our study provides definitive evidence that the BATF2 signaling pathway is a promising therapeutic target to prevent HSC loss during chronic infection and suggests that there may be secondary benefits of maraviroc therapy in such patients.
BATF2 is known to interact with JUN in macrophages in response to IFNγ stimulation.12,14,25 Notably, JUNB and JUND were not examined in prior studies,25 and our data provide the first evidence that BATF2 heterodimerizes with JUN, JUND, and JUNB in murine HSPC in response to IFNγ treatment. A limitation of the study is our lack of direct co-immunoprecipitation of JUN on BATF2 pull-down in primary hematopoietic cells, a result that is difficult to achieve given low protein levels.
Our transcriptional profiling data introduce the concept that quantitative but not qualitative differences in response to infection and inflammation by Batf2 KO compared to WT HSC are sufficient to preserve the HSC population during chronic infection. Consistent with this, BATF2 acts as a mediator by binding to cis-elements of inflammatory genes in response to infection. Furthermore, our data represent the first evidence that BATF2 shares similar motifs with common IFN response mediators including PU.1, IRF, and STAT1. Thus, BATF2 amplifies existing inflammatory responses rather than serving as a regulator of its own transcriptional response. This role as a signal amplifier leading to enhanced tissue inflammation in infection helps explain why Batf2 is a useful predictive biomarker for chronically infected patients.14
In summary, we demonstrate that BATF2 binds with JUN in HSCs, amplifies IFNγ responses, and induces CCL5 to promote myeloid differentiation and stimulate pro-inflammatory responses during chronic infection, leading to HSC differentiation and depletion. We envision that our work will enable the development of therapeutic approaches targeting BATF2 signaling pathways to prevent bone marrow suppression because of chronic infection.
Limitations of the study
Aside from the limitations noted above, the most significant limitation of this work is a lack of validating human data. However, Guler et al. previously demonstrated that TB patients with disease progression showed increased BATF2 expression in the whole blood compared to healthy controls.14 In addition, maraviroc, an FDA approved drug that decreases inflammatory responses, has shown potential as a treatment for chronic inflammatory diseases.24 Here, we demonstrate that mice treated with maraviroc had decreased myeloid differentiation in response to IFNγ stimulation. In future studies, it will be interesting to investigate whether maraviroc treatment prevents bone marrow suppression in chronically infected patients, demonstrating a previously unrecognized benefit of CCR5 blockade therapy.
STAR★Methods
Key resources table
| REAGENT or RESOURCE | SOURCE | IDENTIFIER |
|---|---|---|
| Antibodies | ||
| Anti-Mouse CD45.1 (PB conjugated, clone A20) | Biolegend | Cat#110721, RRID:AB_492867 |
| Anti-Mouse CD45.1 (APC conjugated, clone A20) | ebioscience | Cat#17-0453-81, RRID:AB_469397 |
| Anti-Mouse CD45.2 (BV 605 conjugated, clone 104) | Biolegend | Cat#109841, RRID:AB_2563485 |
| Anti-Mouse CD45.2 (PE conjugated, clone A20) | ebioscience | Cat#12-0453-81, RRID:AB_465674 |
| Anti-Mouse c-kit/CD117 (APC-Cy7 conjugated, clone 2B8) | ebioscience | Cat#25-1171-82, RRID:AB_469644 |
| Anti-Mouse CD4 (PE-Cy5 conjugated, clone GK 1.5) | ebioscience | Cat#15-0041-82, AB_468695 |
| Anti-Mouse CD4 (FITC conjugated, clone GK1.5) | ebioscience | Cat#11-0041-82, RRID:AB_464892 |
| Anti-Mouse CD4 (BUV661 conjugated, clone GK1.5) | BD Bioscience | Cat#612974, RRID:AB_2870246 |
| Anti-Mouse CD8 (PE-Cy5 conjugated, clone 53–6.7) | ebioscience | Cat#15-0081-82, RRID:AB_468706 |
| Anti-Mouse CD8 (FITC conjugated, clone 53–6.7) | ebioscience | Cat#11-0081-82, RRID:AB_464915 |
| Anti-Mouse CD8a (BUV395 conjugated, clone 53–6.7) | BD Bioscience | Cat#563786, RRID:AB_2732919 |
| Anti-Mouse CD45R/B220 (PE-Cy5 conjugated, clone RA3682) | ebioscience | Cat#15-0452-82, RRID:AB_468755 |
| Anti-Mouse CD45R/B220 (PE-Cy7 conjugated, clone RA36B2) | ebioscience | Cat#25-0452-82, RRID:AB_469627 |
| Anti-Mouse/Human CD45R/B220 (FITC conjugated, clone RA3-6B2) | ebioscience | Cat#11-0452-82, RRID:AB_465054 |
| Anti-Mouse Ly-6G/Gr1 (PE-Cy5 conjugated, clone RB68C5) | ebioscience | Cat#15-5931-82 RRID:AB_468813 |
| Anti-Mouse Ly-6G/Gr1 (PE-Cy7 conjugated, clone RB68C5) | ebioscience | Cat#25-5931-82, RRID:AB_469663 |
| Anti-Mouse Ly-6G (Fitc conjuagated, clone 150D) | Biolegend | Cat# 127605, RRID: AB_1236488 |
| Anti-Mouse Ly-6C (Alexa Fluor 700, clone HK1.4) | Biolegend | Cat#128024, RRID:AB_10643270 |
| Anti-Mouse CD11b/Mac1 (PE-Cy5 conjugated, clone M1/70) | ebioscience | Cat#15-0112-82, RRID:AB_468714 |
| Anti-Mouse CD11b/Mac1 (PE-Cy7 conjugated, clone M1/70) | ebioscience | Cat#25-0112-81, RRID:AB_469587 |
| Anti-Mouse CD11b/Mac1 (APC-Cy7 conjugated, clone M1/70) | Biolegend | Cat#101226, RRID:AB_830642 |
| Anti-Mouse CD11c (APC conjugated, clone N418) | ebioscience | Cat#17-0114-81, RRID:AB_469345 |
| Anti-Mouse CD44 (Alexa Fluor 700 conjugated, clone IM7) | Biolegend | Cat#103026, RRID:AB_493713 |
| Anti-Mouse Ter119 (PE-Cy5 conjugated, clone M1/70) | ebioscience | Cat#15-5921-82, RRID:AB_468810 |
| Anti-Mouse CD150/SLAM (PE-Cy7 conjugated, clone TC1512F12.2) | Biolegend | Cat#115914, RRID:AB_439797 |
| Anti-Mouse CD34 (FITC conjugated, clone RAM34) | ebioscience | Cat#11-0341-82, RRID:AB_465021 |
| Anti-Mouse CD80 (Brilliant violet 711 conjugated, clone 16-10A1 | Biolegend | Cat#104743, RRID:AB_2810338 |
| Anti-Mouse CD86 (Brilliant violet 785 conjugated, clone GL-1 | Biolegend | Cat#105043, RRID:AB_2566722 |
| Anti-Mouse CD90/Thy1.2 (BUV496 conjugated, clone 30-H12) | BD Biosciences | Cat#741047, RRID:AB_2870662 |
| Anti-Mouse NK1.1 (PE conjugated, clone PK136) | eBioscience | Cat#12-5941-83, RRID:AB_466051 |
| Anti-Mouse MHCII/I-A/I-E (Brilliant violet 421 conjugated, clone M5/114) | BD Biosciences | Cat#562564, RRID:AB_2716857 |
| Anti-Mouse Flk2/Flt3/CD135 (PE conjugated, clone A2F10) | ebioscience | Cat#12-1351-82, RRID:AB_465859 |
| Anti-Mouse IFNγ (PE-Cy7 conjugated, clone XMG1.2) | Biolegend | Cat#505826, RRID:AB_2295770 |
| Anti-Mouse TNFα (Brilliant Violet 605 conjugated, clone MP6-XT22) | Biolegend | Cat#506329, RRID:AB_11123912 |
| Tetramer I-A(b) Mtb Ag85 280–294 (PE conjugated, peptide sequence FQDAYNAAGGHNAVF) | NIH tetramer facility | IEBD ID# 17460 |
| DAPI | Life technologies | Cat#D1306 |
| Fc block | MACS Miltenyi Biotec | Cat#130-046-702 |
| Bacterial strains | ||
| Mycobacterium avium | N/A | Smt 2151 |
| Chemicals, peptides, and recombinant proteins | ||
| Recombinant Mouse IFNy | eBioscience | Cat#BMS326 |
| Recombinant Mouse CCL5 RNTES CarrierFree | Biolegend | Cat#594204 |
| Mtb peptide: FQDAYNAAGGHNAVF | Biosynthesis | N/A |
| Maraviroc, CCR5 Antagonist | Abcam | Cat#ab254450 |
| Mouse CD117 MicroBeads | MACS Miltenyi Biotec | Cat#130-091-224; RRID: AB_2753213 |
| Anti-PE Micro-Beads | MACS Miltenyi Biotec | Cat#130-048-801, RRID:AB_244373 |
| CUTANAtm pAG-MNase for ChIC/CUT&RUN Workflows | EpiCypher | Cat#15-1016 |
| Critical commercial assays | ||
| SMARTer® Stranded Total RNA-Seq Kit v2 - Pico Input Mammalian | Takara | Cat# 634411 |
| Super-Script III First-Strand Synthesis Supermix | Invitrogen | Cat#18080051 |
| iTaq Universal SYBR Green Supermix | BioRad | Cat#172-5121 |
| Immobilon Forte Western HRP substrate | MilliporeSigma | Cat#WBLUF0100 |
| Deposited data | ||
| RNA-seq | GEO | https://www.ncbi.nlm.nih.gov/geo/query/acc.cgi?acc=GSE206277 |
| Mass Spectrometry | Mendeley | https://data.mendeley.com/datasets/tgx53jscj8/1 |
| CUT&RUN sequencing | GEO | https://www.ncbi.nlm.nih.gov/geo/query/acc.cgi?acc=GSE206277 |
| Experimental models: Organisms/strains | ||
| Mice: CD45.1 | CCM core - BCM | N/A |
| Mice: CD45.2 | CCM core - BCM | N/A |
| Mice: Batf2−/− mice | BCM Mouse ES Cell Core | N/A |
| Oligonucleotides | ||
| List of primers used for qPCR are in Table S1 | ||
| Software and algorithms | ||
| Prism 9 | https://www.graphpad.com/scientific-software/prism/ | |
| FlowJo | https://www.flowjo.com/solutions/flowjo/downloads | |
| R Project for Statistical Computing | https://www.r-project.org | |
| R Studio | https://www.rstudio.com/products/rstudio/ download/#download | |
| STAR | https://github.com/al exdobin/STAR | |
| Macs2 | https://anaconda.org/bioconda/macs2 | |
| Bowtie2 | https://github.com/BenLangmead/bowtie2 | |
| Bedtools | https://github.com/arq5x/bedtools2 | |
| Biorender | https://biorender.com/ | |
| Others | ||
| MethoCult™ | StemCell Techonologies, Inc | Cat#M3434 |
Resource availability
Lead contact
Further information and requests for resources and reagents should be directed to and will be fulfilled by the lead contact, Katherine King (kyk@bcm.edu).
Materials availability
All unique/stable reagents generated in this study are available from the lead contact with a completed materials transfer agreement.
Experimental model and subject details
Mice
Batf2 KO mice were generated by the Genetically Engineered Rodent Models (GERM) Core at Baylor College of Medicine using CRISPR gene editing to delete exons 1 and 2 of Batf2 in a C57BL/6 background. We used the following CRISPR single guide RNAs: GGTGCACTCACTCGCACTCGCTC and GGTCTCACTCTTGGTTCAAAAGG. F1 pups from heterozygous and WT mice were crossed to generate homozygous mice. We used PCR and sequencing to determine the genotype. All animal studies were done under a protocol approved by the Institutional Animal Care and Use Committee of Baylor College of Medicine. Mice were used between 8 and 12 weeks of age with animals of both sexes matched between control and experimental groups.
Microbial infections
We infected the mice intravenously (IV) with M. avium (2 × 10⁶ colony-forming units) as described.26 To establish our chronic infection model, we infected the mice repeatedly every four weeks for 4 months. M. avium’s CFUs were quantified by growth on Middlebrook agar and by PCR.27 To stimulate T cell cytokine production, we IV injected the mice with a specific Ag85 peptide (aa240-254, FQDAYNAAGGHNAVF, 200 μg/mouse) 2 h prior to euthanasia.
Method details
Bone marrow transplantation
Hematopoietic stem cells (HSC) from infected mice or naive control CD45.2 donors were isolated from the whole bone marrow (WBM) cells. Using Sony cell sorter, SH800. 300 CD45.2 HSCs with 2 × 10⁵ CD45.1 competitor WBM cells were transplanted into 2-month-old recipients following a split dose of 10.5 Gy of irradiation.
Complete blood counts
Peripheral blood was collected in EDTA-coated tubes and analyzed on Heska Element HT5 machine.
FACS analysis
For FACS sorting and analysis, WBM cells were collected from tibias, femurs, and pelvises. Cell enrichment was performed using magnetic cell separation with microbead on an AutoMACS (Miltenyi Biotec, Germany). Cells were stained with the desired antibodies at a concentration of 108 cells/mL and incubated at 4°C for 30 min in the absence of light. The positive cell fragment was stained with antibodies and sorted. Cell sorting was performed on SH800 Cell Sorter (Sony Biotechnology, San Jose, CA). The list of antibodies is provided in the key resources table.
For HSPCs and immune cells analysis, total WBM cells were harvested from tibias and spleens were collected from naive and infected WT and Batf2 KO mice. Spleens were weighed, crushed, and filtered in 15 mL conical tubes. An aliquot of 100 μL of total volume was collected per sample for bacterial CFU study. Red blood cells from WBM and spleen were lysed using Biolegend RBC lysis buffer (cat# 420301). For tetramer staining, splenic cells were stained with Ag85240-254-loaded PE-conjugated tetramer (NIH Core) for 1 h at 37°C in the absence of light. Ag85-specific cells were collected sing magnetic cell separation with anti-PE microbead on MACS columns (Miltenyi Biotec, Germany). Negative and positive cell fragments were stained with antibodies to identify myeloid and lymphoid cells. A list of antibodies used for flow cytometry is indicated in the key resources table.
Quantitative real-time PCR
RNA was isolated using TRIzol (Invitrogen), isopropanol and ethanol. cDNA was generated using random hexamer primers (Super-Script IV, Invitrogen). Expression of ccl5 was quantified by using SYBR Green Supermix (BioRad) on the Roche LighCycler 96 (Roche) for 40 cycles. Samples were normalized to 18S rRNA levels and fold change was calculated using the ΔΔCt method. Primers used in PCR reactions are in Table S1.
DNA extraction and amplification of 16S bacterial gene
10 mg of spleen samples were collected from infected mice and naive control. DNA was isolated using DNeasy Blood and Tissue Kits (Qiagen, Germany). DNA from the spleen was pre-amplified with Pre-Amp Mastermix (Fuidigm, Cat#100–5581). Quantitative real-time PCR was run for 40 cycles with an annealing temperature of 60°C as previously described (Park et al., 2000).27
Bacterial CFU counting
Spleens from naive and infected WT and Batf2 KO mice were isolated and weighed. They were divided longitudinally for bacterial CFU counting and histopathology. Spleen segments for bacterial CFU counting were re-weighed, crushed, and filtered in 15 mL conical tubes. The serially diluted spleen suspensions in 1x PBS were plated in triplicate on 7H10 agar plates as previously described28 and incubated at 37°C in a biohazard incubator for 7 days prior to colony counting. Plates containing 30–250 colonies were used for calculation of bacterial CFU/g spleen.
Assessment of spleen histopathology
For spleen histology, spleen segments from naive and infected WT and Batf2 KO mice were stored in 10% formalin prior to being submitted at the BCM Pathology and Histology Core. Each spleen segment was parafilm embedded, sectioned, and hematoxylin and eosin stained.
Batf2 monoclonal antibody production
Mouse Batf2 full length cDNA (gene ID: 74,481) was amplified and cloned into pET vector with N-terminal polyhistidine tag. The protein was mainly overexpressed into the inclusion bodies of E. coli BL21 (DE3) strain. The inclusion bodies were solubilized using the buffer containing pH 7.4 PBS with 4M urea and 1 mM DTT. The protein was further purified from the whole inclusion body lysate with standard IMAC (immobilized metal affinity chromatography) protocol. The purified protein then refolded and stored in the buffer containing pH 7.4 PBS with 1 M urea and 1 mM DTT.
Batf2 KO mice (approximately 20 weeks of age) were immunized a total of four times with purified Batf2 protein. The first immunization was done subcutaneously using Complete Freund’s Adjuvant with each mouse received 100 μg of protein as the immunogen. Subsequent immunizations were performed using Incomplete Freund’s Adjuvant every two weeks, with mice receiving 50 μg of Batf2 protein/mouse, alternating between intraperitoneal and subcutaneous injections. Mice were test bled one week after the third and fourth immunization and evaluated by indirect ELISA and Western blots.
A fusion between mouse splenocytes from the chosen BATF2-immunized mouse and the mouse SP2/0-Ag14 myeloma cell line was performed using standard PEG fusion methodology. Newly formed hybridomas from the fusion were plated in ClonaCell Medium D (StemCell Technologies, Inc.). Positive hybridomas from multiple rounds of ELISA and Western blot screening were expanded in IMDM +15% FBS and cryopreserved in liquid nitrogen.
Antibody production was performed by expanding the hybridomas in IMDM +10% SuperLow Bovine IgG FBS (HyClone). The hybridomas were allowed to overgrow and the antibody-containing supernatant harvested when the viability was less than 50%. Cells were removed by centrifugation and the sterile supernatant was stored at 4°C until the monoclonal antibody was purified using Protein G Sepharose with gentle elution chromatography method.
Immunoprecipitation and mass spectrometry
32D cells (ATCC, CRL-11346) were cultured with recombinant IFNγ (100 ng/mL) for 17 h. The cells were harvested and lysed in NETN buffer (50 mM Tris pH 7.3, 170 mM NaCl, 1 nM EDTA, 0.5% NP-40) followed by sonication and ultracentrifugation. The immunoprecipitation (IP) was performed as described29 including in-gel digestion. Each IP lane was cut into several bands, in-gel digested with trypsin, and combined into three pools. The tryptic peptides were measured on nano-LC 1000 system (Thermo Fisher Scientific, San Jose, CA) coupled to Orbitrap Fusion (Thermo Fisher Scientific, San Jose, CA) mass spectrometer (MS). We used a two-column setup with precolumn (2 cm x 100μmI.D) and analytical column (20 cm x 75 μmI.D) filled with Reprosil-Pur Basic C18 (1.9 μm, Dr. Maish GmbH, Germany) to load peptides which then were eluted using a 110min gradient of 2–30% B (90% acetonitrile) at a flow rate of 200 nL/min. The eluted peptides were analyzed using Orbitrap Fusion mass spectrometer operated in the data-dependent acquisition mode acquiring fragmentation spectra of the top 35 strongest ions. The full MS scan was performed in Orbitrap in the range of 300-1400m/z at 120,000 resolutions (AGC 5e5, max IT 50ms) followed by rapid IonTrap HCD MS2 fragmentation (CE30%, AGC 5e4, max IT 30ms) at precursor isolation width of 3m/z. The dynamic exclusion was set to 5s. Proteome Discover 2.1 interface (Thermo Scientific) via Mascot algorithm was used to analyze MS raw files which were searched against target-decoy mouse NCBI refseq (downloaded on 2020-03-24). The following parameters were used for the search: variable modification of oxidation on methionine, De-Streak on cysteine and protein N-terminal acetylation; 20ppm precursor mass tolerance; 0.5Da fragment mass tolerance; 2 missed cleavages; enzyme Trysin. The initial peptide identification was done at a false discovery rate (FDR) < 0.05. Protein inference and quantitation were performed by gpGrouper (v1.0.040) using shared peptide iBAQ area distribution.30
RNA purification and RNA sequencing
RNA was isolated from 50,000 to 80,000 sorted HSCs (Lineage-c-Kit+ CD150+ CD48− CD34−) from the pools of 1-month infected mice and naive control (n = 10–12 per group) with RNeasy Kit (Qiagen, Cat#74004). RNA-seq library was generated using SMARTer Stranded Total RNA-Seq Kit v2 – Pico Input Mammalian (Takara Bio USA). The sequencing was performed using Illumina NovaSeq SP with a paired-end sequencing length of 10bp. We used STAR (https://github.com/alexdobin/STAR) to align reads against the hg38 genome, and FastQC, RSeQC, MultiQC, and FastQ Screen for the quality control and to check the results for the contamination. Finally, read were counted using featureCounts.
We filtered the count matrix using the filterByExpr() function from the R package edgeR. DESeq2 was used to perform differential expression analysis, and the false discovery rate (FDR) < 0.05 was considered statistically significant. Gene set enrichment analysis was done by sorting gene lists according to their increasing p value and running tmodCERNOtest() function from the tmod R package (Weiner third and Domaszewska).Panel plots with geneset enrichment were plotted with tmodPanelPlot() from tmod, other plots were plotted using ggplot2. Statistically significant results are listed in Tables S2 and S3. Both are related to Figure 5.
CUT&RUN
CUT&RUN sequencing was performed with modified methods as previously described.31,32 50,000 HSCs (LK CD150+, CD48−) were sorted pools of naive or 1-month (M. avium) infected WT mice for CUT&RUN sequencing (N = 7–8). Cells were washed with Wash Buffer (50 mL total with 20 mM HEPES pH 7.5, 150 mM NaCl, 0.5 mM Spermidine, and one Roche Complete protein inhibitor tablet) and bound to Concanavalin A-coated magnetic beads (Bang Laboratories L200731C) for 15 min room temperature. Sample slurries were magnetically separated, washed, and incubated with primary antibody diluted in wash buffer containing 0.05% digitonin (Dig Wash) overnight at 4°C. Slurries were then magnetically separated and washed with Dig Wash three times and then incubated with protein A-MNase (pA-MN, Epicypher 15–1016) for 1 h at 4 °C. Slurries were magnetically separated and washed, resuspended in 200uL Dig Wash, and placed on an iced heating block. 2uL of 2 mM CaCl2 was added to catalyze the pA-MN reaction and digestion. After 45 min, one equal volume of Stop Buffer (340 mM NaCl, 20 mM EDTA, 4 mM EGTA, 0.05% Digitonin, 0.05 mg/mL glycogen, 5 μg/mL RNase A, 2 pg/mL heterologous spike-in DNA) was added to end the reaction, and sample slurries were then incubated for 30 min at 37 °C to release fragments and then magnetically separated. The supernatant was collected, and DNA was purified via phenol-chloroform extraction and ethanol precipitation. Samples were resuspended in molecular-grade water after ethanol precipitation.
DNA was quantified with Qubit 2.0 DNA HS Assay (ThermoFisher, Massachusetts, USA) and quality was assessed by Tapestation High sensitivity D1000 DNA Assay (Agilent Technologies, California, USA). Library preparation was performed using the KAPA HyperPrep kit (Roche, Basel, Switzerland) according to the manufacturer’s recommendations. Library quality and quantity were assessed with Qubit 2.0 DNA HS Assay (ThermoFisher, Massachusetts, USA), Tapestation High Sensitivity D1000 Assay (Agilent Technologies, California, USA), and QuantStudio 5 System (Applied Biosystems, California, USA). Illumina 8-nt dual-indices were used. Equimolar pooling of libraries was performed based on QC values and sequenced on an Illumina NovaSeq (Illumina, California, USA) with a read length configuration of 150 paired-end (PE). Antibodies used were anti-BATF2, Rabbit-antimouse IgG (Jackson ImmunoResearch 315-005-003), and Rabbit anti-H3K27ac (Cell Signaling Technologies 8173T).
PE reads were aligned to mm10 using Bowtie2 version 2.4.5. MACS2 version 2.2.7.1 was used to call peaks and CUT&RUN IgG was used as a negative control. HOMER (Hypergeometric Optimization of Motif EnRichment) was used to discover motifs with different enrichment between CUT&RUN BATF2 and control. GREAT version 4.0.4 (Stanford University, CA) was used to predict the functions of cis-regulatory regions of CUT&RUN BATF2. Bedgraph files of normalized counts were visualized using Integrative Genomics Viewer (IGV).
Differentiation assay on Methocult™
10,000 WBM cells from mouse recombinant IFNγ (eBioscience, Cat# BMS326) treated WT and Batf2 KO mice and naive control were plated in Methocult™ (StemCell, Cat# M3434) completed media at 37°C for 12 days. Colony-forming units were counted using a light microscope.
IFNγ, CCL5, and maraviroc treatment
WT and Batf2 KO mice were treated with IP injection of 10 μg IFNγ for 24 h. For in vivo CCL5 (Biolegend, Cat# 594204), at four-week post M. avium infection, the mice were treated with IP injection of 100 ng recombinant CCL5 every other day for 2 weeks. For ex vivo treatment with CCL5, 1 × 10⁶ BONE MARROW cells from mice with or without IFNγ treatment were incubated in the presence or absence of CCL5 (50 ng/mL) for 4 h at 37°C. For maraviroc (Abcam, ab254450) treatment, at 2 days before IFNγ injection, the mice were treated with Maraviroc (50 mg/kg) by oral gavage daily.
Cytokine bead array
We performed a cardiac puncture to collect peripheral blood from infected WT and Batf2 KO mice and naive control. The serum was separated from the blood by centrifuging in BD Microtainers and was frozen at −80°C until further use. After thawing on ice, the serum was diluted 1:2 in Assay Buffer in Millipore-Sigma Mouse Cytokine/Chemokine Magnetic Bead Panel 96 well plate assay kit. The reagents were prepared immunoassay following the manufacturer’s protocol including antibody-immobilized beads, quality controls, wash buffer, and serum matrix. The serum samples were incubated with antibody-immobilized beads in absence of light overnight at 4°C with agitation. The next day, the samples were incubated with detection antibodies and secondary streptavidin-phycoerythrin for the appropriate time per kit instructions. Bio-Rad Bio-Plex 200 with Bioplex manager 6.1 software was used to run the control and experimental serum samples. The concentrations of cytokines and chemokines were calculated using the median fluorescent intensity (MFI).
Quantification and statistical analysis
Mean ± SEM are shown in all datafigures with either Student’s t test or ordinary one-way ANOVA using GraphPad Prism v9.0. The number of times each experiment repeated, n, and statistical details were provided in the figure legends.
Acknowledgments
The authors would like to thank Catherine Gillespie for editing the manuscript and members of the King lab for useful discussions. We thank Meghan Kisiel, Jack Toups, Trisha Wathan, Daniel Hormaechea-Agulla, Nelufa Islam, Yunping Lei, Daniel Kennedy II, and Apoorva Thatavarty for technical assistance. The graphical abstract was made by Mara Willis. This project depended on the support the BCM Mass Spectrometry Proteomics Core with funding from Dan L. Duncan Comprehensive Cancer Center NIH Award (P30 CA125123) and CPRIT Core Facility Award (RP210227), BCM Protein and Monoclonal Antibody Production Core with funding fromBCMCancer Center NIH Award (P30 CA125123), BCM Cytometry and Cell Sorting Core with funding from the CPRIT Core Facility SupportAward (CPRIT-RP180672), the NIH (CA125123 and RR024574), and the assistance of Joel M. Sederstrom. P.K. was co-financed by the European Union through the European Social Fund (grant. POWR.03.02.00-00-1029). K.Y.K, D.T.L., M.A.F., B.T.T., and B.K., were supported by NIH grants R01HL136333, R01HL134880, and R35HL155672 (K.Y.K), F31HL154661 (D.T.L.) and T32HL092332 (D.T.L., B.T.T), F31-diversity 1F31HL156500, T32AI053831 (B.K), and F31HL164287 (B.T.) and the American Society of Hematology Minority Hematology Graduate Student Fellowship (M.A.F.).
Author contributions
D.T.L. and K.Y.K. designed the study, conducted the experiments, and wrote the paper. M.A.F. performed splenic immune cell studies and 32D cell treatment experiments. B.T.T. performed the CUT&RUN experiment. B.K. produced the RNA-seq libraries. P.K. analyzed the RNA-seq data. Y.Z. and K.C. generated BATF2 monoclonal antibody. A.J. performed coIP and A.M. analyzed proteomics experiments.
Declaration of interests
The authors declare no competing interests.
Inclusion and diversity
One or more of the authors of this paper self-identifies as an underrepresented ethnic minority in their field of research or within their geographical location. One or more of the authors of this paper received support from a program designed to increase minority representation in their field of research.
Published: January 27, 2023
Footnotes
Supplemental information can be found online at https://doi.org/10.1016/j.isci.2023.106059.
Supplemental information
Data and code availability
Data
-
•
RNAseq and CUT&RUNdata are available through GEO at: https://www.ncbi.nlm.nih.gov/geo/query/acc.cgi?acc=GSE206277.
-
•
Mass Spectrometry Data available through Mendeley at: https://data.mendeley.com/datasets/tgx53jscj8/1.
Code
-
•
none.
Other
-
•
none.
References
- 1.Achi H.V., Ahui B.J.M., Anon J.C., Kouassi B.A., Dje-Bi H., Kininlman H. [Pancytopenia: a severe complication of miliary tuberculosis] Rev. Mal. Respir. 2013;30:33–37. doi: 10.1016/j.rmr.2012.08.008. [DOI] [PubMed] [Google Scholar]
- 2.Ramos-Casals M., García-Carrasco M., López-Medrano F., Trejo O., Forns X., López-Guillermo A., Muñoz C., Ingelmo M., Font J. Severe autoimmune cytopenias in treatment-naive hepatitis C virus infection: clinical description of 35 cases. Medicine (Baltim.) 2003;82:87–96. doi: 10.1097/00005792-200303000-00003. [DOI] [PubMed] [Google Scholar]
- 3.Scadden D.T., Zon L.I., Groopman J.E. Pathophysiology and management of HIV-associated hematologic disorders. Blood. 1989;74:1455–1463. [PubMed] [Google Scholar]
- 4.Masouridi-Levrat S., Simonetta F., Chalandon Y. Immunological basis of bone marrow failure after allogeneic hematopoietic stem cell transplantation. Front. Immunol. 2016;7:362. doi: 10.3389/fimmu.2016.00362. [DOI] [PMC free article] [PubMed] [Google Scholar]
- 5.Wingard J.R., Hsu J., Hiemenz J.W. Hematopoietic stem cell transplantation: an overview of infection risks and epidemiology. Infect. Dis. Clin. North Am. 2010;24:257–272. doi: 10.1016/j.idc.2010.01.010. [DOI] [PubMed] [Google Scholar]
- 6.Matatall K.A., Jeong M., Chen S., Sun D., Chen F., Mo Q., Kimmel M., King K.Y. Chronic infection depletes hematopoietic stem cells through stress-induced terminal differentiation. Cell Rep. 2016;17:2584–2595. doi: 10.1016/j.celrep.2016.11.031. [DOI] [PMC free article] [PubMed] [Google Scholar]
- 7.Ergen A.V., Boles N.C., Goodell M.A. Rantes/Ccl5 influences hematopoietic stem cell subtypes and causes myeloid skewing. Blood. 2012;119:2500–2509. doi: 10.1182/blood-2011-11-391730. [DOI] [PMC free article] [PubMed] [Google Scholar]
- 8.Matatall K.A., Shen C.C., Challen G.A., King K.Y. Type II interferon promotes differentiation of myeloid-biased hematopoietic stem cells. Stem Cell. 2014;32:3023–3030. doi: 10.1002/stem.1799. [DOI] [PMC free article] [PubMed] [Google Scholar]
- 9.Appelberg R. Pathogenesis of Mycobacterium avium infection: typical responses to an atypical mycobacterium? Immunol. Res. 2006;35:179–190. doi: 10.1385/IR:35:3:179. [DOI] [PubMed] [Google Scholar]
- 10.Dorsey M.J., Tae H.J., Sollenberger K.G., Mascarenhas N.T., Johansen L.M., Taparowsky E.J. B-ATF: a novel human bZIP protein that associates with members of the AP-1 transcription factor family. Oncogene. 1995;11:2255–2265. [PubMed] [Google Scholar]
- 11.Kayama H., Tani H., Kitada S., Opasawatchai A., Okumura R., Motooka D., Nakamura S., Takeda K. BATF2 prevents T-cell-mediated intestinal inflammation through regulation of the IL-23/IL-17 pathway. Int. Immunol. 2019;31:371–383. doi: 10.1093/intimm/dxz014. [DOI] [PMC free article] [PubMed] [Google Scholar]
- 12.Roy S., Guler R., Parihar S.P., Schmeier S., Kaczkowski B., Nishimura H., Shin J.W., Negishi Y., Ozturk M., Hurdayal R., et al. Batf2/Irf1 induces inflammatory responses in classically activated macrophages, lipopolysaccharides, and mycobacterial infection. J. Immunol. 2015;194:6035–6044. doi: 10.4049/jimmunol.1402521. [DOI] [PubMed] [Google Scholar]
- 13.Kanemaru H., Yamane F., Tanaka H., Maeda K., Satoh T., Akira S. BATF2 activates DUSP2 gene expression and up-regulates NF-kappaB activity via phospho-STAT3 dephosphorylation. Int. Immunol. 2018;30:255–265. doi: 10.1093/intimm/dxy023. [DOI] [PubMed] [Google Scholar]
- 14.Guler R., Mpotje T., Ozturk M., Nono J.K., Parihar S.P., Chia J.E., Abdel Aziz N., Hlaka L., Kumar S., Roy S., et al. Batf2 differentially regulates tissue immunopathology in Type 1 and Type 2 diseases. Mucosal Immunol. 2019;12:390–402. doi: 10.1038/s41385-018-0108-2. [DOI] [PMC free article] [PubMed] [Google Scholar]
- 15.Chen F.F., Jiang G., Xu K., Zheng J.N. Function and mechanism by which interferon regulatory factor-1 inhibits oncogenesis. Oncol. Lett. 2013;5:417–423. doi: 10.3892/ol.2012.1051. [DOI] [PMC free article] [PubMed] [Google Scholar]
- 16.Baldridge M.T., King K.Y., Boles N.C., Weksberg D.C., Goodell M.A. Quiescent haematopoietic stem cells are activated by IFN-gamma in response to chronic infection. Nature. 2010;465:793–797. doi: 10.1038/nature09135. [DOI] [PMC free article] [PubMed] [Google Scholar]
- 17.Hormaechea-Agulla D., Matatall K.A., Le D.T., Kain B., Long X., Kus P., Jaksik R., Challen G.A., Kimmel M., King K.Y. Chronic infection drives Dnmt3a-loss-of-function clonal hematopoiesis via IFNgamma signaling. Cell Stem Cell. 2021;28:1428–1442.e6. doi: 10.1016/j.stem.2021.03.002. [DOI] [PMC free article] [PubMed] [Google Scholar]
- 18.Tussiwand R., Lee W.L., Murphy T.L., Mashayekhi M., Kc W., Albring J.C., Satpathy A.T., Rotondo J.A., Edelson B.T., Kretzer N.M., et al. Compensatory dendritic cell development mediated by BATF-IRF interactions. Nature. 2012;490:502–507. doi: 10.1038/nature11531. [DOI] [PMC free article] [PubMed] [Google Scholar]
- 19.Baldridge M.T., King K.Y., Goodell M.A. Inflammatory signals regulate hematopoietic stem cells. Trends Immunol. 2011;32:57–65. doi: 10.1016/j.it.2010.12.003. [DOI] [PMC free article] [PubMed] [Google Scholar]
- 20.Pagán A.J., Ramakrishnan L. Immunity and immunopathology in the tuberculous granuloma. Cold Spring Harb. Perspect. Med. 2014;5:a018499. doi: 10.1101/cshperspect.a018499. [DOI] [PMC free article] [PubMed] [Google Scholar]
- 21.Aglianó A.M., Santangelo C., Silvestri I., Gazzaniga P., Giuliani L., Naso G., Frati L., Castiglia R. On chromosomal instability: what is the karyotype of your 32D CI3 cell line. Blood. 2000;95:3636–3637. [PubMed] [Google Scholar]
- 22.He J., Li X., Zhou J., Hu R. BATF2 and PDK4 as diagnostic molecular markers of sarcoidosis and their relationship with immune infiltration. Ann. Transl. Med. 2022;10:106. doi: 10.21037/atm-22-180. [DOI] [PMC free article] [PubMed] [Google Scholar]
- 23.King K.Y., Goodell M.A. Inflammatory modulation of HSCs: viewing the HSC as a foundation for the immune response. Nat. Rev. Immunol. 2011;11:685–692. doi: 10.1038/nri3062. [DOI] [PMC free article] [PubMed] [Google Scholar]
- 24.Marques R.E., Guabiraba R., Russo R.C., Teixeira M.M. Targeting CCL5 in inflammation. Expert Opin. Ther. Targets. 2013;17:1439–1460. doi: 10.1517/14728222.2013.837886. [DOI] [PMC free article] [PubMed] [Google Scholar]
- 25.Murphy T.L., Tussiwand R., Murphy K.M. Specificity through cooperation: BATF-IRF interactions control immune-regulatory networks. Nat. Rev. Immunol. 2013;13:499–509. doi: 10.1038/nri3470. [DOI] [PubMed] [Google Scholar]
- 26.Feng C.G., Weksberg D.C., Taylor G.A., Sher A., Goodell M.A. The p47 GTPase Lrg-47 (Irgm1) links host defense and hematopoietic stem cell proliferation. Cell Stem Cell. 2008;2:83–89. doi: 10.1016/j.stem.2007.10.007. [DOI] [PMC free article] [PubMed] [Google Scholar]
- 27.Park H., Jang H., Kim C., Chung B., Chang C.L., Park S.K., Song S. Detection and identification of mycobacteria by amplification of the internal transcribed spacer regions with genus- and species-specific PCR primers. J. Clin. Microbiol. 2000;38:4080–4085. doi: 10.1128/JCM.38.11.4080-4085.2000. [DOI] [PMC free article] [PubMed] [Google Scholar]
- 28.Rojony R., Martin M., Campeau A., Wozniak J.M., Gonzalez D.J., Jaiswal P., Danelishvili L., Bermudez L.E. Quantitative analysis of Mycobacterium avium subsp. hominissuis proteome in response to antibiotics and during exposure to different environmental conditions. Clin. Proteomics. 2019;16:39. doi: 10.1186/s12014-019-9260-2. [DOI] [PMC free article] [PubMed] [Google Scholar]
- 29.Chen Y., Leng M., Gao Y., Zhan D., Choi J.M., Song L., Li K., Xia X., Zhang C., Liu M., et al. A cross-linking-aided immunoprecipitation/mass spectrometry workflow reveals extensive intracellular trafficking in time-resolved, signal-dependent epidermal growth factor receptor proteome. J. Proteome Res. 2019;18:3715–3730. doi: 10.1021/acs.jproteome.9b00427. [DOI] [PMC free article] [PubMed] [Google Scholar]
- 30.Saltzman A.B., Leng M., Bhatt B., Singh P., Chan D.W., Dobrolecki L., Chandrasekaran H., Choi J.M., Jain A., Jung S.Y., et al. gpGrouper: apeptide grouping algorithm for gene-centric inference and quantitation of bottom-up proteomics data. Mol. Cell. Proteomics. 2018;17:2270–2283. doi: 10.1074/mcp.TIR118.000850. [DOI] [PMC free article] [PubMed] [Google Scholar]
- 31.Henikoff S., Henikoff J.G., Kaya-Okur H.S., Ahmad K. Efficient chromatin accessibility mapping in situ by nucleosome-tethered tagmentation. Elife. 2020;9:e63274. doi: 10.7554/eLife.63274. [DOI] [PMC free article] [PubMed] [Google Scholar]
- 32.Skene P.J., Henikoff J.G., Henikoff S. Targeted in situ genome-wide profiling with high efficiency for low cell numbers. Nat. Protoc. 2018;13:1006–1019. doi: 10.1038/nprot.2018.015. [DOI] [PubMed] [Google Scholar]
Associated Data
This section collects any data citations, data availability statements, or supplementary materials included in this article.
Supplementary Materials
Data Availability Statement
Data
-
•
RNAseq and CUT&RUNdata are available through GEO at: https://www.ncbi.nlm.nih.gov/geo/query/acc.cgi?acc=GSE206277.
-
•
Mass Spectrometry Data available through Mendeley at: https://data.mendeley.com/datasets/tgx53jscj8/1.
Code
-
•
none.
Other
-
•
none.