Abstract
Trogocytosis is an active process that transfers surface material from targeted to effector cells. Using multiple in vivo tumor models and clinical data, we report that chimeric antigen receptor (CAR) activation in natural killer (NK) cells promoted transfer of the CAR-cognate-antigen from tumor to NK cells, resulting in (1) lower tumor antigen density, thus impairing the ability of CAR-NK cells to engage with their target, (2) induced self-recognition and continuous CAR-mediated engagement, resulting in fratricide of trogocytic antigen expressing NK cells (NKTROG+) and NK cell hyporesponsiveness. This phenomenon could be offset by a dual-CAR system incorporating both an activating CAR (aCAR) against the cognate tumor antigen and an NK self-recognizing inhibitory CAR (iCAR) that transferred a “don’t kill me” signal to NK cells upon engagement with their TROG+ siblings. This system prevented trogocytic antigen-mediated fratricide, while sparing aCAR-signaling against the tumor antigen, and resulted in enhanced CAR-NK cell activity.
Editor summary:
A new dual-CAR system enhances the anti-tumor activity of CAR NK Cells, and makes them less susceptible to therapeutic resistance in preclinical models
Trogocytosis involves the rapid transfer of intact cell-surface proteins between cells and is induced by receptor-antigen ligation1–4. Trogocytosis is well-documented in leukocytes, including T cells and natural killer (NK) cells, and influences the response of the accepting cells, both positively and negatively1,4–7. Indeed, transfer of target antigen from the tumor cell surface to chimeric antigen receptor expressing T (CAR-T) cells through trogocytosis has been shown to contribute to antigen reduction and antigen-low tumor relapse in preclinical models8.
NK cells are innate immune cells that mediate strong anti-tumor activity9–11. Unlike T cells, NK cells target cancer cells in a non-antigen-dependent manner, and their allogeneic use for adoptive cell therapy is not associated with graft-vs-host-disease12–14. Trogocytosis has been reported to regulate NK cell responses in different contexts and is mediated by the ligation of NK cell activating receptors such as the natural cytotoxicity receptors (NCRs) and NKG2s with their cognate ligands15–19.
Here, we used multiple in vivo tumor models and clinical samples to show that CAR-activation promoted trogocytosis that in turn, contributed to a reduction in antigen density on the tumor targets and loss of tumor control in vivo after CAR-NK cell therapy. Acquisition of the cognate tumor antigen by CAR-NK cells led to induced self-recognition and sustained CAR-activation, but also decreased NK cell activity by driving fratricide and hyporesponsiveness. To overcome self-recognition of trogocytic antigen expressing (TROG+) NK cells by the activating CAR (aCAR), we designed an inhibitory CAR (iCAR) against an NK-specific antigen by harnessing the physiological HLA-restricted inhibitory signals that normally dampen NK cell function20–23. NK cells that expressed both an aCAR and an iCAR (AI-CARs) transferred a “don’t kill me” signal to NK cells upon recognition of the NK self-antigen, thus preventing fratricide and exhaustion mediated by the aCAR against NKTROG+ sibling cells, while sparing their activity against tumor cells, resulting in superior in vivo anti-tumor efficacy.
Our finding that trogocytosis negatively impacts the anti-tumor activity of CAR-NK cells may have significant therapeutic implications that could be overcome using rationally-designed AI-CAR systems that prevent trogocytic-antigen-induced on-target off-tumor effects while sparing their on-target anti-tumor activity.
Results
CAR-mediated TROG-antigen transfer to NK cells
Trogocytosis triggered by receptor-ligand interactions is a well-described phenomenon in NK cells1,2,4. Thus, we first asked whether an engineered activating receptor such as anti-CD19 CAR (CAR19) can also mediate the transfer of its cognate antigen CD19 to NK cells following co-culture with RajiCD19+ lymphoma cells. Non-transduced NK (NT-NK) cells and those expressing 19scFv (anti-CD19 CAR lacking all intracellular domains) were used as parental control and receptor control, respectively. Within minutes of co-culture with Raji targets, a significantly greater percentage (75%±10%) of CAR19-NK cells acquired CD19 expression as well as other B-cell associated markers such as CD20 and CD22 on their surface compared with NT-NK or 19scFv-NK controls (Fig. 1a,b, Extended Data Fig. 1a–d), suggesting that trogocytosis is a rapid process and that CAR-signaling is necessary for the robust transfer of the cognate antigens to CAR-NK cells. A similar phenomenon but to a lesser extent, was observed with CAR19-T cells (Supplementary Fig. 1a, as also previously described8. Pre-treatment of CAR-NK cells with Latrunculin A (LatA), an F-actin inhibitor that blocks immunologic synapse formation24, prevented the transfer of cognate CD19-antigen from Raji cells to CAR19-NK cells (Fig. 1a,b), supporting the importance of synapse formation in driving trogocytosis. We, therefore, termed CAR-NK cells that acquired surface expression of target-derived cognate antigen following trogocytosis (Raji-derived CD19 in this case) as the TROG+ fraction. Trogocytic antigen (TROG-antigen) acquisition on CAR-NK cells coincided with a substantial reduction in CD19 expression on the targeted Raji cells, which could also be prevented by LatA pre-treatment of CAR-NK cells (Supplementary Fig. 1b–c). In contrast, CD19 was not selectively lost in co-culture of Raji with NT-NK cells or 19scFv-NK cells (Fig. 1b, Supplementary Fig. 1c).
Figure 1. CAR19-mediated trogocytosis in NK cells co-cultured with CD19+ tumor targets.
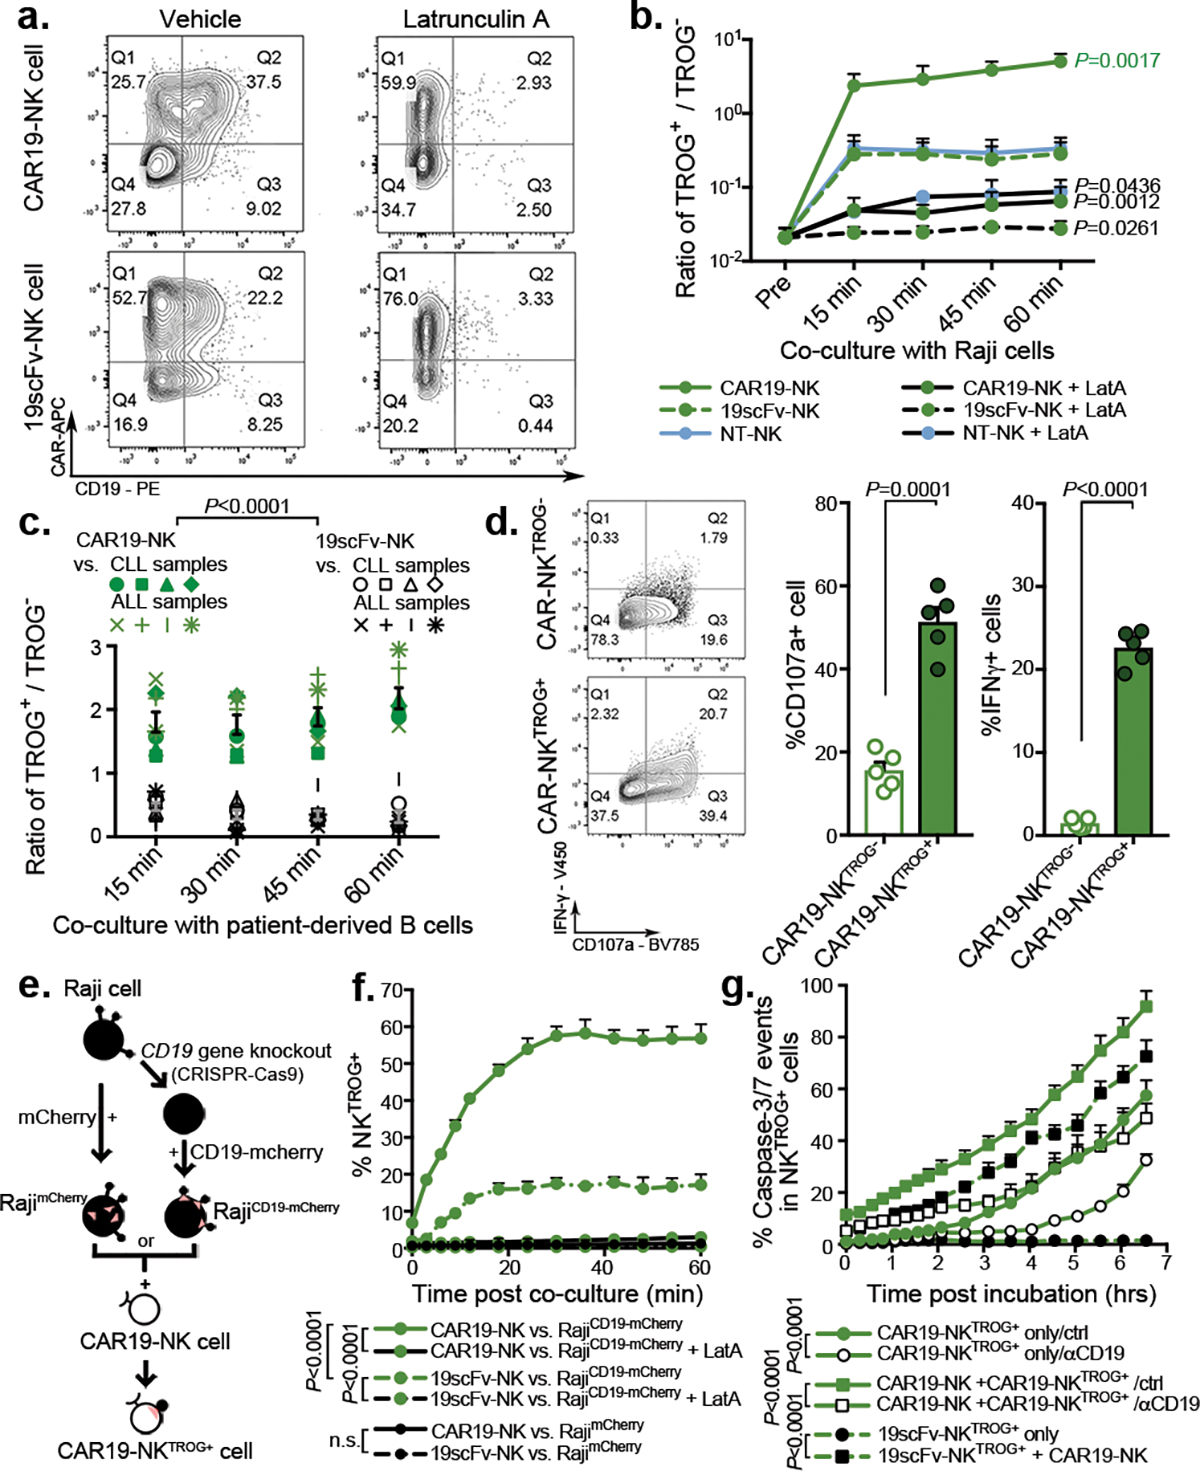
(a) FACS plots show CD19 expression on NK cells transduced with CAR19 or 19scFv (no intracellular signaling domain) after co-culture with Raji cells for 5 min with Latrunculin A (LatA) or vehicle control (representative for 3 donors). The CD19+ gate was determined based on both fluorescent minus one (FMO) control and by referring to NK cells cultured alone. (b) Trogocytic CD19 (tCD19, shown as the ratio of TROG+/TROG−) expression on singlet CAR19-NK, 19scFv-NK, and NT-NK cells after co-culture with Raji cells (n= 3 donors). TROG+ fractions comprised NK cells expressing CAR+CD19+ (eg. Q2 from panel a), while the TROG− fractions included NK cells expressing CAR+CD19− (eg. Q1 from panel a). (c) tCD19 expression (shown as the ratio of TROG+/TROG−) on singlet CAR19-NK (green symbols) or 19scFv-NK cells (black symbols) after co-culture with B-CLL cells (n=4 patients) or B-ALL cells (n=4 patients). (d) Expression of CD107a and IFN-γ in TROG+ vs. TROG− CAR19-NK cells 6 hrs after stimulation with Raji cells (representative of 3 donors). Bar graphs show the percentage (%) of CD107a+ and IFN-γ+ cells in each fraction normalized to expression in CAR19-NK cells cultured alone (n=5 donors). (e) Strategy for CD19-mCherry fusion protein expression on CD19-knockout Raji (RajiCD19-KO) cells, controlled by Raji cells genetically modified for intracellular mCherry expression (RajimCherry). (f) Percentage (%) of CAR19-NK cells or 19scFv-NK cells expressing mCherry after co-culture with RajiCD19-mCherry cells or RajimCherry in different conditions in an Incucyte assay (representative of 3 donors). (g) Incucyte analyses showing the % of caspase 3/7 events in the TROG+ fraction of CAR19-NK cells vs. 19scFv-NK cells cultured alone, or with autologous fresh CAR19-NK cells. For CAR19-NKTROG+ cells, anti-human CD19 blocking antibody (αCD19) or an antigen-mismatched scFv antibody were added as controls (representative of 3 donors).
P values were determined by two-tailed two-way ANOVA in panels b,c,f,g, or two-sided Student’s paired t test in panel d; n.s.: not significant. Data were shown by mean + s.e.m. Insert numbers indicate % in respective quadrants. Each circle represents an individual donor or experimental replicate.
CAR19-NK cells also mediated strong trogocytic CD19 (tCD19) transfer after co-culture with different CD19+ targets such as NALM-6 cells, Ramos cells, healthy B cells, and ovarian cancer cells that were genetically engineered to express CD19 (SKOV3gCD19+; Supplementary Fig. 1d). Importantly, CAR19-mediated trogocytosis was also observed when CAR19-NK cells were co-cultured with CD19+ primary tumor cells derived from patients with either CLL or ALL, concurrent with a reciprocal reduction in CD19 on the targets (Fig. 1c, Supplementary Fig. 1e). To validate this observation with different cognate antigens, we synthesized CARs that recognized CD5, CD70, CD123, BCMA, or ROR1, and evaluated their ability to mediate trogocytosis. A high level of cognate TROG-antigen was likewise detected on CAR-NK cells with the concurrent reduction of cognate antigen expression on co-cultured targets (Supplementary Fig. 2a–e). Notably, CAR-mediated trogocytosis appeared to be antigen-specific since cognate antigen transfer above baseline (seen with NT-NK control) was not observed when the CAR molecule was mismatched with the target antigen and was influenced by the affinity of the CAR molecule for its targeted antigen (Supplementary Fig. 3a). Moreover, robust TROG-antigen transfer was not only observed with CD28/CD3ζ-based CAR-signaling, but also with NK cells transduced with CARs signaling through CD3ζ only, DAP10+/− CD3ζ, NKG2D/CD3ζ, 41BB/CD3ζ, and DAP12+/− CD3ζ (Supplementary Fig. 3b).
CAR-NKTROG+ cells are active but susceptible to fratricide
Trogocytosis has been reported to modulate NK cell function15,17,18. Thus, we next asked if TROG-antigen expression on CAR-NK cells could also modulate their effector function and whether this effect is positive or negative. We observed that soon after co-culture with Raji targets, tCD19 was expressed on CAR19-NK cells (Extended Data Fig. 2a,b) and those CAR-NKTROG+ cells displayed significantly higher levels of degranulation (CD107a) and IFN-γ accumulation in response to Raji targets when compared with their TROG− counterparts (Fig. 1d), consistent with greater activation and effector potential25. To study this without the interference of using antibodies, we knocked out the endogenous CD19 gene in Raji cells followed by transduction with a CD19-mCherry fusion molecule that could be easily detected upon transfer to CAR-NK cells through trogocytosis (Fig. 1e). We confirmed the rapid transfer of both CD19 and mCherry on CAR-NK cells upon engagement with RajiCD19-mCherry cells (Extended Data Fig. 2c–e). Notably, and in keeping with our previous findings, CAR-mediated CD19-mCherry transfer required the formation of an immunological synapse, since it was prevented by LatA pre-treatment (Fig. 1f); and it also depended on CAR-activation as NK cells expressing 19scFv failed to transfer TROG-antigen to the same extent upon co-culture with RajiCD19-mCherry cells (Fig. 1f). We also confirmed that fratricide was mediated by TROG-antigen recognition, since a significantly larger proportion of TROG+ NK cell populations underwent apoptosis upon co-culture with autologous CAR19-transduced NK cells compared with the control of 19scFv-NKTROG+ cells alone (Fig. 1g, Extended Data Fig. 3a–d, and Supplementary Video 1). The addition of a CD19-blocking antibody to compete with CAR19-recognition and CD19 ligation reduced apoptosis of CAR19-NKTROG+ cells (Fig. 1g), indicating that the fratricide of NKTROG+ population is mediated by on-target recognition, ligation and cytotoxic response by CAR-NK cells.
Antigen-mediated self-engagement drives NK cell exhaustion
Repeated antigenic stimulation by tumor cells is known to drive exhaustion of immune effector cells26–28. Indeed, we found that while expression of TROG-antigen was initially associated with higher CAR-NK cell activation, it did not result in sustained anti-tumor activity in a repeated tumor challenge model (Supplementary Fig. 4a–f). Thus, we asked if TROG+ CAR-NK cells that did not succumb to fratricide are susceptible to functional exhaustion through repeated TROG-antigen-mediated CAR activation. CAR-NK cells were repeatedly challenged at a lower E:T ratio of 1:3 (to minimize fratricide) with either GFP-labeled RajiCD19+ cells or with autologous NK cells that were genetically modified to stably express CD19 on their surface and GFP intracellularly (autoNKgCD19+/GFP+ cells; Supplementary Fig. 4g). The level of CD19 expression on NKgCD19+ cells was approximately equivalent to that of tCD19 detected on CAR-NKTROG+ cells (Supplementary Fig. 4h,i). CAR19-NK cells cultured alone or after co-culture with autoNKgGFP+ cells (lacking CD19 expression) were used as controls. In keeping with our rechallenge data with Raji tumor cells, CAR-NK effector cells (GFP-negative) that were repeatedly challenged with autoNKgCD19+/GFP cells acquired an exhaustion phenotype with a notable percentage (21%±9%) of cells co-expressing multiple checkpoints (PD1, TIM3, and TIGIT)29,30, and a higher ratio of esomesodermin (EOMES) to T-bet31–33 (Supplementary Fig. 4j). Further phenotypic interrogation using mass cytometry (CyTOF) confirmed that over 65% of CAR-NK effector cells challenged with autoNKgCD19+/GFP+ targets (clusters EC3-EC5; Fig. 2a,b) co-expressed PD1, TIGIT, LAG3, TIM3, with increased EOMES, and downregulation of Tbet and Ki67, when compared with CAR-NK cells cultured alone or with autoNKgGFP+ cells that did not express CD19 (Fig. 2c). Acquisition of tCD19 from autoNKgCD19+/GFP+ cells by CAR-NK effector cells (Extended Data Fig. 4a) was associated with down-regulation of NK cell activating receptors such as NKG2D, NCRs, CD16, 2B4, adaptor molecules (Syk, Zap70, DAP12, and SAP), as well as cytolytic proteins (granzymes and perforin; Fig. 2c). Interestingly, nearly 35% of CAR-NK cells (EC4-EC5) co-cultured with autoNKgCD19+/GFP+ also expressed higher levels of co-activating receptors such as NKG2C, DNAM-1, OX40, and CS1, as well as CD25 and CD69 (Fig. 2c), suggesting that CAR-NK cells only acquire their exhausted phenotype after CAR-antigen mediated self-engagement and activation.
Figure 2. Impact of antigen-induced self-engagement on CAR-NK effector cell phenotype and function.
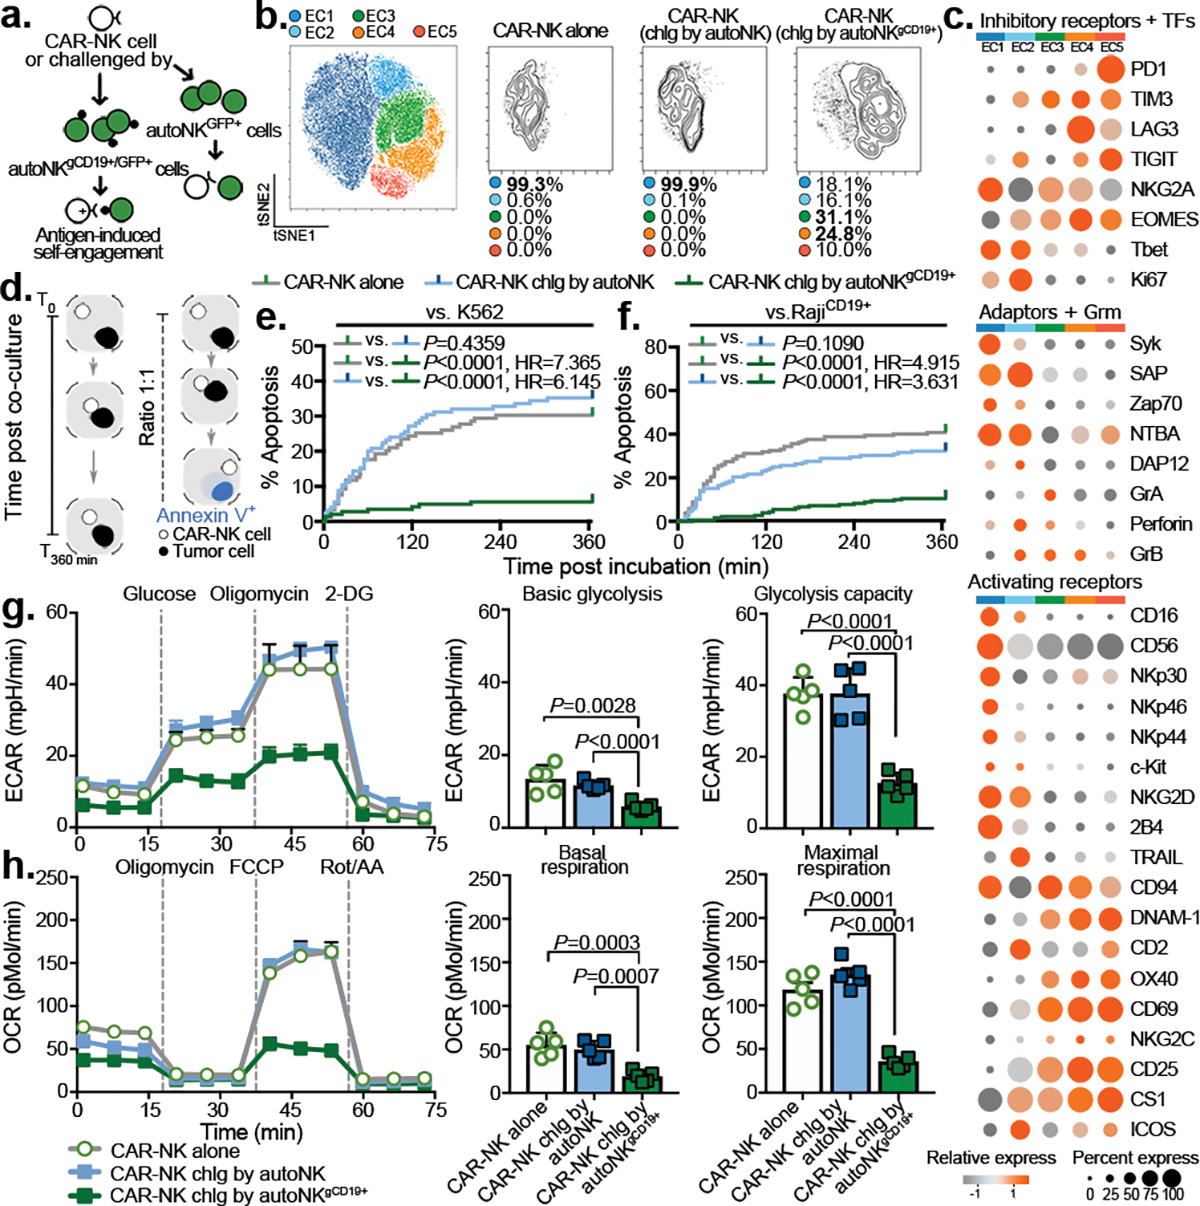
(a) Schematic illustrating a re-challenge (chlg) assay using autoNKgCD19+ at an E:T ratio of 1:3, controlled by co-culture with autoNK cell (lacking CD19 expression). Both autoNKgCD19+ and autoNK cells were genetically modified to express intracellular GFP to facilitate their identification. (b) tSNE analysis of live NKCAR19+/GFP− cells after the second round of re-challenge with autoNKgCD19+/gGFP+ cells; controls include CAR19-NK cells alone or after 4 days of co-culture with autoNKgGFP+ cells (no CD19 expression). Cells were evaluated by CyTOF, and merged to create a single t-SNE map (10,000 cells from 3 pooled donors per condition). Each cluster (EC1-EC5) is represented in a different color, and frequencies indicated for each culture condition. (c) Heat map for expression of key NK cell phenotypic and functional markers. Expression of each marker is represented by color grey (low) to orange (high) and size of the circle. TFs: transcription factors, Grm: granzyme. (d) Schematic illustrating single-cell time-lapse imaging cytotoxicity assay. Time was recorded over 6 hours (T0 –T360min) for a single CAR-NK cell co-cultured with a single tumor cell. During the incubation, Annexin V influx in the tumor cell was determined as a marker of apoptosis. (e and f) Kaplan-Meier curves showing the percent (%) apoptosis in targeted cells when CAR-NK cells were co-cultured with (e) K562 cells or (f) Raji cells (grey: CAR-NK cells alone; blue: CAR-NK cells isolated after 4 days co-culture with autoNKCD19-/GFP+ cells; green: CAR-NK cells isolated after the second round re-challenge by autoNKgCD19+/GFP+ cells). (g) Ex vivo analysis of CAR-NK cell glycolytic fitness by ECAR (extracellular acidification rate); bar graphs showing their basal ECAR (left; n=5 donors), and their maximum ECAR (right; n=5 donors). (h) Oxidative metabolism (OXPHOS) of CAR-NK cells by OCR (oxygen consumption rate); bar graphs showing their basal OCR (left; n=5 donors), and their maximal OCR (right; n=5 donors).
P values were determined by Log-rank test in panels e and f, or two-sided Student’s t test in panels g and h. Data were shown by mean + s.e.m. Each symbol represents an individual donor-derived CAR-NK cell sample.
Based on our phenotypic observation, we hypothesized that repeated antigenic challenge by sibling autoNKgCD19+/GFP+ cells drives the functional exhaustion of CAR-NK cells. To test this, we isolated CAR-NK effector cells (GFP-negative) after 4 days of co-culture with autoNKgCD19+/GFP+ cells (GFP-positive), and compared their cytotoxicity to that of CAR-NK cells cultured alone or co-cultured with autoNKGFP+ cells. In each nanowell, only one CAR-NK effector cell was incubated with its target cell to rule out the possibility of fratricide (Methods; Fig. 2d). At the single-cell level, CAR19-NK cells that were continuously activated through fratricide (vs. autoNKgCD19+/GFP+) killed significantly fewer K562 targets (Fig. 2e, Supplementary Video 2) and CD19+ Raji tumor targets (Fig. 2f, Extended Data Fig. 4b,c, and Supplementary Video 3) when compared with controls, and this was especially the case at lower E:T ratios and after multiple rounds of rechallenge with autoNKgCD19+/GFP+ cells (Extended Data Fig. 4d–f). Together, these findings confirm impaired CAR-NK effector function resulting from antigen-induced self-engagement.
Given the importance of cellular metabolic fitness for NK cell effector function34,35, we also evaluated whether CAR-NK cells co-cultured with autoNKgCD19+/GFP+ had dysregulated metabolic capacity. Compared to controls, CAR-NK cells previously challenged with autoNKgCD19+/GFP+ had significant impairment in their metabolic machinery at their baseline level (without stimulation) and in response to the maximum stimulation when compared to controls, with a significant reduction in their glycolytic capacity as measured by the extracellular acidification rate (ECAR; Fig. 2g), and oxygen consumption rate (OCR) and oxidative phosphorylation (OXPHOS; Fig. 2h). Taken together, these data support a model in which continuous CAR-activation, via self-engagement with the TROG antigen, drives the functional exhaustion and metabolic dysregulation of CAR-NK cells.
TROG-antigen expression reduces CAR-NK cells persistence
To investigate the in vivo kinetics of TROG-antigen acquisition by CAR-NK cells, we xenografted mice with 3 escalating dose levels of Raji cells (0.2×10⁵, 1×10⁵, or 0.5×10⁶), respectively, to cover the various levels of tumor burden, followed by a single infusion of CAR-NK cells (Methods; Extended Data Fig. 5a,b). In keeping with our in vitro data, significant fractions of CD19-expressing CAR19-NK cells (CAR19-NKtCD19+) were detected as early as six days post-infusion, with the TROG+ population increasing over the treatment course, regardless of their initial tumor burden (Extended Data Fig. 5c). The transfer of tCD19 to CAR-NK cells was also associated with a decrease in CD19 expression on Raji cells (Extended Data Fig. 5d), but the same phenomenon was not observed in mice treated with ex vivo expanded non-transduced NK cells (NT-NK cells; Extended Data Fig. 5e), suggesting a robust in vivo CAR-mediated trogocytosis. Notably, CD19 expression in Raji cells harvested from the organs of the animals returned to baseline after a short-term period of ex vivo culture (Supplementary Fig. 5a) with the restoration of their susceptibility to CAR-NK cell-mediated cytotoxicity in vitro (Supplementary Fig. 5b). Notably, in vivo acquisition of TROG-antigen by CAR-NK cells was associated with a reduction in their cell number and lower viability when compared with controls (Extended Data Fig. 6a–e), suggesting that trogocytosis of the CD19 antigen was associated with fratricide that contributed to the substantial in vivo loss of CAR19-NK cells.
Similar observations were detected in mouse models treated with anti-CD5 CAR-NK cells (grafted with CCRFCD5+; Supplementary Fig. 6a–e) and anti-CD123 CAR-NK cells (grafted with MOLM14CD123+; Supplementary Fig. 7a–e). Together, our findings suggest that TROG-antigen induced in vivo fratricide of CAR-NK cells was quite common, if not universal.
CAR-NKTROG+ cells accumulate during tumor progression in vivo
We next used a non-curative mouse model of Raji tumor, where a single dose of CAR-NK cell infusion could initially control tumor progression, but was frequently followed by tumor relapse36,37. Mice were sacrificed at regular intervals following CAR-NK cell infusion, with their blood and tissues harvested for comprehensive phenotypic analysis by CyTOF (Extended Data Fig. 7a,b). Using a t-SNE map, we observed 4 major clusters of CAR-NK cells (Fig. 3a). Pre-infusion CAR-NK cells were exclusively clustered in C1 (more than 99%; Fig. 3b), but cells from early time points post-infusion were predominantly found in C2 (more than 66%; Fig. 3b); at later time points and during the relapse phase, the majority of CAR-NK cells were segregated in C3 and C4 (73%–97%; Fig. 3b), with higher expression of TROG-antigen (such as tCD19) when compared with their non-CAR expressing NK counterparts (Fig. 3c). In vivo acquisition of TROG-antigen was associated with higher expression of both activation and inhibitory markers (Extended Data Fig. 7c,d). Notably, CAR-NK cells in C3 and C4 showing higher expression of checkpoint markers (PD1, TIM3, TIGIT), lower expression of transcription factors, cytolytic proteins, and adaptor molecules, but upregulation of cytokine receptors IL-2R (CD25), SCF receptor (c-Kit), co-activating receptors (NKG2C, 2B4, DNAM-1), and chemokine receptors (Fig. 3d), which is consistent with a previously activated phenotype and eventual exhaustion27,38,39.
Figure 3. Impact of TROG-antigen acquisition on CAR-NK cell phenotype and function in vivo.
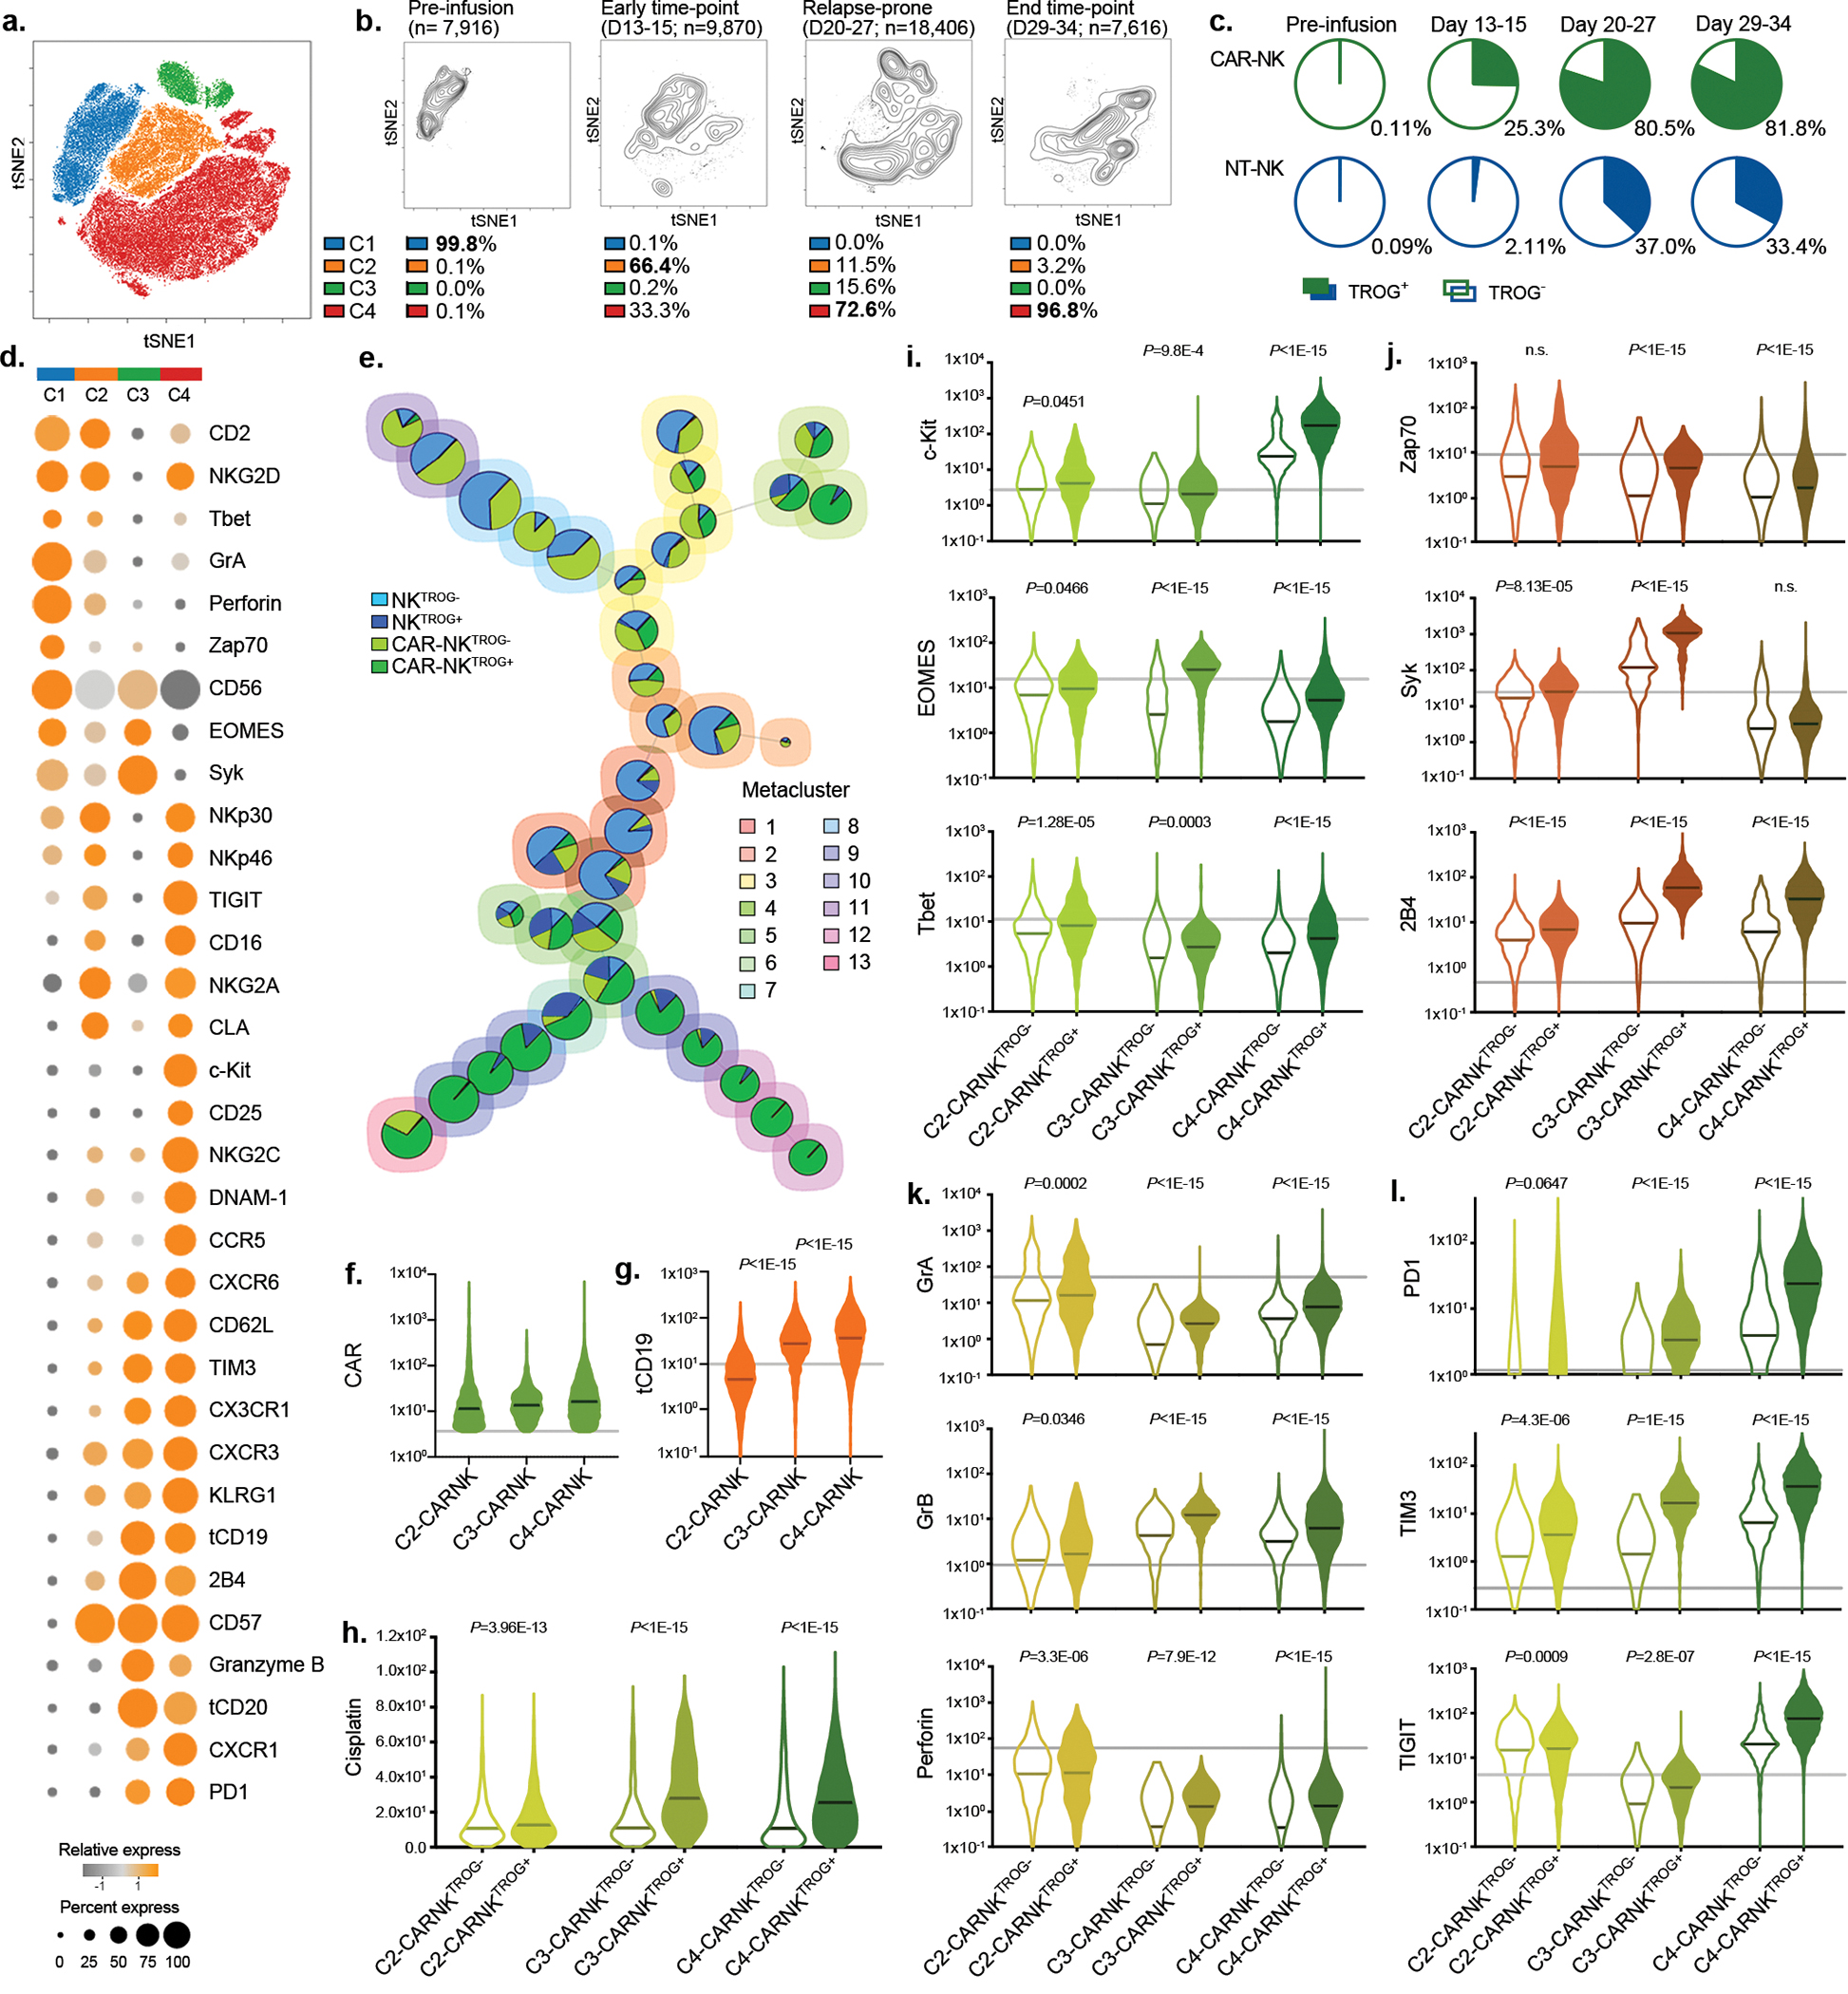
(a) tSNE analysis of live hCD45+GFP−CD56+CD3− NK cells collected from different organs (blood, bone marrow, spleen, and liver) of mice at different points during the treatment course. Phenotypic signatures of all collected NK cells were evaluated by mass cytometry and merged to create a single tSNE map. (b) Contour plots showing the tSNE cluster prevalence in the pre-infusion product, 2 weeks after infusion, 3–4 weeks after infusion, or at the endpoint. The number of cell objects for each condition was indicated. (c) Frequencies of NK cells expressing the TROG-antigen (tCD19) in the CAR19-positive (green) or CAR-negative (blue) fractions at different time points during treatment are presented, controlled by their counterparts in the pre-infusion product. (d) Heat map representing the expression levels of phenotypic and functional markers on CAR-NK cells within each cluster. The expression level for each marker is represented by the color grey (low) - orange (high) and the size. (e) FlowSOM analysis of post-infusion NK cell populations where each metacluster is mapped using a self-organizing mapping strategy. Each colored region corresponds to a metacluster with inserted pie chart representing the frequency of NK cells expressing CAR and TROG-antigen (tCD19) on clustered cells; the size of each chart represents the number of clustered cells. (f and g) Violin plots showing the expression of (f) CAR19, and (g) tCD19 on CAR19-NK cells in each cluster, determined based on their level in pre-infused NT-NK cells shown as the grey line, (h) Violin plot showing cisplatin levels in post-infusion CAR19-NKTROG+ cell (expressing CD19) or their CAR19-NKTROG− counterparts for each cluster. Cisplatin level represents the cellular viability of each population. (i-l) Violin plots showing the expression of (i) c-Kit, EOMES, and Tbet; (j) Zap70, Syk, and 2B4; (k) Granzyme (Gr) A, GrB, and perforin; (l) PD-1, TIM3, and TIGIT in TROG+ and TROG− fractions of CAR19-NK cells. The median expression strength for each marker in CAR19-NK cells prior to infusion (in C1) is indicated by the grey line.
P values were determined by two-tailed Wilcoxon matched pairs test.
We next remapped cells to metaclusters using FlowSOM, an unbiased gating method from the inbuilt algorithm of tSNE40, to compare the phenotypic signatures of TROG+ vs. TROG− CAR-NK cells (Fig. 3e). Indeed, in keeping with our earlier results, expression of tCD19 on CAR-NK cells was associated with a reduction in their in vivo viability, as shown by the accumulation of cisplatin (Fig. 3f–h, Extended Data Fig. 7e). However, this phenomenon was not observed in NKTROG+ cells from mice treated with NT-NK cells alone (Extended Data Fig. 7f), confirming our in vitro results that NK cell fratricide was antigen-specific and depended upon recognition and ligation of CAR with the TROG-antigen. In addition, when compared to the TROG− CAR-NK cell population, TROG+ CAR-NK cells displayed higher expression of c-kit, Tbet, EOMES, activating adaptors, and cytolytic proteins (Fig. 3i–k), while also expressing checkpoint markers such as TIGIT, PD1, and TIM3 (Fig. 3l), especially at late time points (exclusively in C4). These data suggest that acquisition of TROG-antigen on CAR-NK cells was associated with activation first, followed by fratricide, functional exhaustion, and failure of NK cells to control the tumor in vivo.
At the mRNA level, B cell markers (CD19, MSA41) were not detected in the NK cell clusters (defined by NKG7 and FCGR3A expression; Extended Data Fig. 7g). Taken together, these findings confirm that TROG-antigen expression on CAR-NK cells is mediated by post-transcriptional transfer of protein from tumor targets that leads to activation, fratricide, and eventual exhaustion of infused CAR-NK cells.
Lower TROG-antigen expression favors clinical response
We next investigated if trogocytosis contributes to CAR-NK cell fratricide and tumor progression in patients with lymphoid malignancies treated in our previously reported CAR-NK cell trial (NCT03056339)41. Using peripheral blood samples collected at multiple time points after CAR-NK cell infusion, patients were divided into two groups based on the overall tCD19 expression in CAR-NK cells [TROGhigh (n=4) vs. TROGlow (n=7); Fig. 4a,b, Supplementary Fig. 8]. Acquisition of tCD19 expression on CAR-NK cells was associated with a reciprocal reduction in CD19 expression on B cells and a higher probability of relapse (3 of 4 patients) compared to patients in the TROGlow group (0 of 7 patients; Fig. 4c,d). Although this analysis was based on a small number of patients, our clinical observations further support the unfavorable effect of CAR-mediated trogocytosis on the anti-tumor efficacy of CAR-NK cells.
Figure 4. A lower level of CAR-mediated TROG-antigen expression was associated with improved clinical response to CAR-NK cell-based immunotherapy.
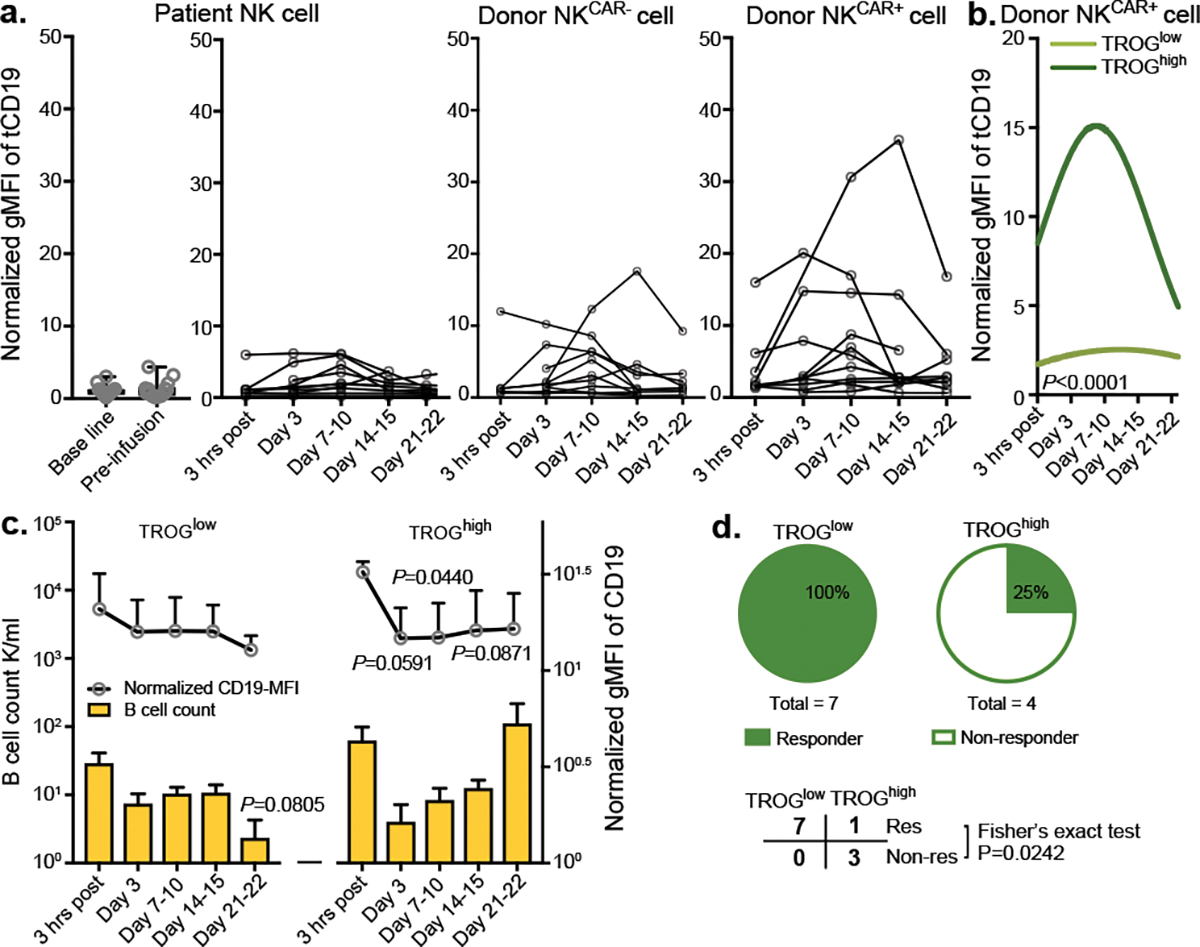
(a) tCD19 expression on singlet cells of donor-derived CAR-expressing NK cells (NKCAR+), donor-derived non-CAR expressing NK cells (NKCAR−) and patient-derived NK cells at different time points after receiving CAR19-NK cell immunotherapy. Geometric mean fluorescent intensity (gMFI) of tCD19 expression was assessed by flow cytometry. Samples from individual patients at different times after CAR-NK cell infusion are presented. (b) Non-linear regression analyses using polynomial models show tCD19 expression on donor-derived NKCAR+ cells over time after CAR-NK cell infusion. The normalized mean tCD19 gMFI on CAR19-NK cells for the whole patient population was 6.29 (range of 0.61–35.77). Patients with a high (> mean) versus low (≤ mean) normalized tCD19-gMFI at more than one time point were defined as group of TROGhigh (n=4 patients) vs. TROGlow (n=7 patients), respectively. (c) CD19 expression (upper), and cell counts (lower) for singlet CD19+ B cells in the TROGlow vs. TROGhigh patient groups at different time points after CAR-NK cell infusion. (d) Pie charts showing the number of responders (res, upper) vs. non-responders (non-res, lower) after receiving CAR19-NK cell infusion in the TROGlow vs. TROGhigh groups.
P value was determined by two-tailed two-way ANOVA in panel b, two-sided Student’s t test in panel c, two-tailed Fisher’s exact test in panel d; Data were assessed by mass cytometry and shown by mean + s.e.m. Each circle represents an individual patient.
iCAR against an NK-antigen prevents self-engagement by aCAR
The dynamic balance of activating and inhibitory signals determines NK cell-mediated cytotoxicity and target lysis22,23. Thus, we used a genetic engineering strategy that exploits the physiological HLA class-I mediated NK cell inhibition in order to control NK cell activity in an antigen-specific manner20–22. We hypothesized that an inhibitory CAR (iCAR), which incorporated an scFv directed to an NK-specific antigen linked to a powerful NK cell inhibitory signal, can limit NK cell responsiveness despite the simultaneous antigen-engagement of an activating CAR (aCAR), thus allowing for on-target/on-tumor recognition.
We designed a series of iCAR constructs that fused an antigen-specific scFv with the transmembrane domain and immunoreceptor tyrosine-based inhibition motifs (ITIMs) derived from key NK cell inhibitory receptors (KIR2DL142, LIR-143, CD300A44, NKG2A45, and LAIR146). As proof-of-principle, we first tested an scFv specific for CD19 and confirmed that anti-CD19 iCARs (iCAR19s) were expressed on the surface of NK cells at similar levels to their aCAR-NK cell counterparts (CAR19: CD28/CD3ζ-based; Extended Data Fig. 8a,b). We next asked if iCARs limit NK cell activity in an antigen-specific manner by culturing iCAR19-expressing NK cells with CD19+ targets and measuring the phosphorylation status of inhibitory signals vs. activating signals upon target engagement22,47,48. Antigen stimulation resulted in higher phosphorylation of SHP1 in iCAR19-expressing NK cells (Extended Data Fig. 8c), without inducing phosphorylation in ITAM adapter proteins (Sky and Zap70; Extended Data Fig. 8d). Additionally, iCAR19-NK cells produced fewer effector cytokines with lower cytotoxicity against CD19+ targets (such as Raji cell, or autoNKgCD19+ cell), but not against CD19-negative targets such as K562 or CD19-KO Raji cells (Extended Data Fig. 8e–j). Of note, iCARs did not negatively impact the proliferation of NK cells cultured with an engineered K562 cell line (uAPC) and IL-2 (Extended Data Fig. 8k,l). Compared to the CD19-aCARs, trogocytosis was significantly less with iCARs, with the lowest level observed when NK cells were transduced with an iCAR incorporating a KIR2DL1 (iCAR1; Extended Data Fig. 8m). Thus, for all subsequent experiments, the signaling endodomain for KIR2DL1 (iCAR1) was used.
To determine if iCARs can inhibit the on-target off-tumor fratricide mediated through the aCAR, we next sought to synthesize an iCAR that recognized an NK self-antigen by fusing the transmembrane and intracellular domains of iCAR1 with an scFv targeting CS1, a co-receptor that is constitutively expressed on all normal NK cells49,50, but absent on most CD19+ lymphoid-derived malignancies51,52(Supplementary Fig. 9a,b). We confirmed that CS1 was expressed at high levels on NKTROG+ cells both in vitro and in vivo (Supplementary Fig. 9c–f). Primary NK cells were transduced with the AI-CAR system (aCAR targeting CD19: aCAR19; and iCAR targeting CS1: iCAR1-CS1), and evaluated for their function against different targets (Fig. 5a,b). Controls included 19scFv and CS1-scFv without activating or inhibitory signaling endodomains, respectively. iCAR-CS1 expression spared the on-target anti-tumor activity of aCAR19 against CD19+ tumor targets (Fig. 5c), including primary CLL samples from patients (Fig. 5d, Supplementary Fig. 10a), but inhibited the activity of aCAR-NK cells when both CD19 and CS1 were expressed on the target (Fig. 5e, Supplementary Fig. 10b). We next investigated the ability of iCAR to restrict aCAR-mediated cytotoxicity against autoNKgCD19+/CS1+ cells. NK cells expressing the AI-CARs displayed marked reduction in cytotoxicity and fratricide against autoNKgCD19+/CS1+ cells (Fig. 5f), but maintained their effector function and cytokine response to CD19+CS1− target cells (Supplementary Fig. 10c,d), with no evidence of exhaustion (Fig. 5g,h), or significant impairment in their in vitro proliferation capacity (Fig. 5i). Notably, iCAR expression had little impact on aCAR-mediated cognate-antigen trogocytosis in co-cultures of NK cells with CD19+CS1− Raji targets (Fig. 5j). These findings confirmed that the CS1-targeting iCAR selectively prevents NK cells from antigen-induced on-tumor/off-target effect, while preserving the therapeutic response of the aCAR against “on-target” CD19+ tumor cells.
Figure 5. Expression of an iCAR by NK cells reduced fratricide and exhaustion induced by aCAR.
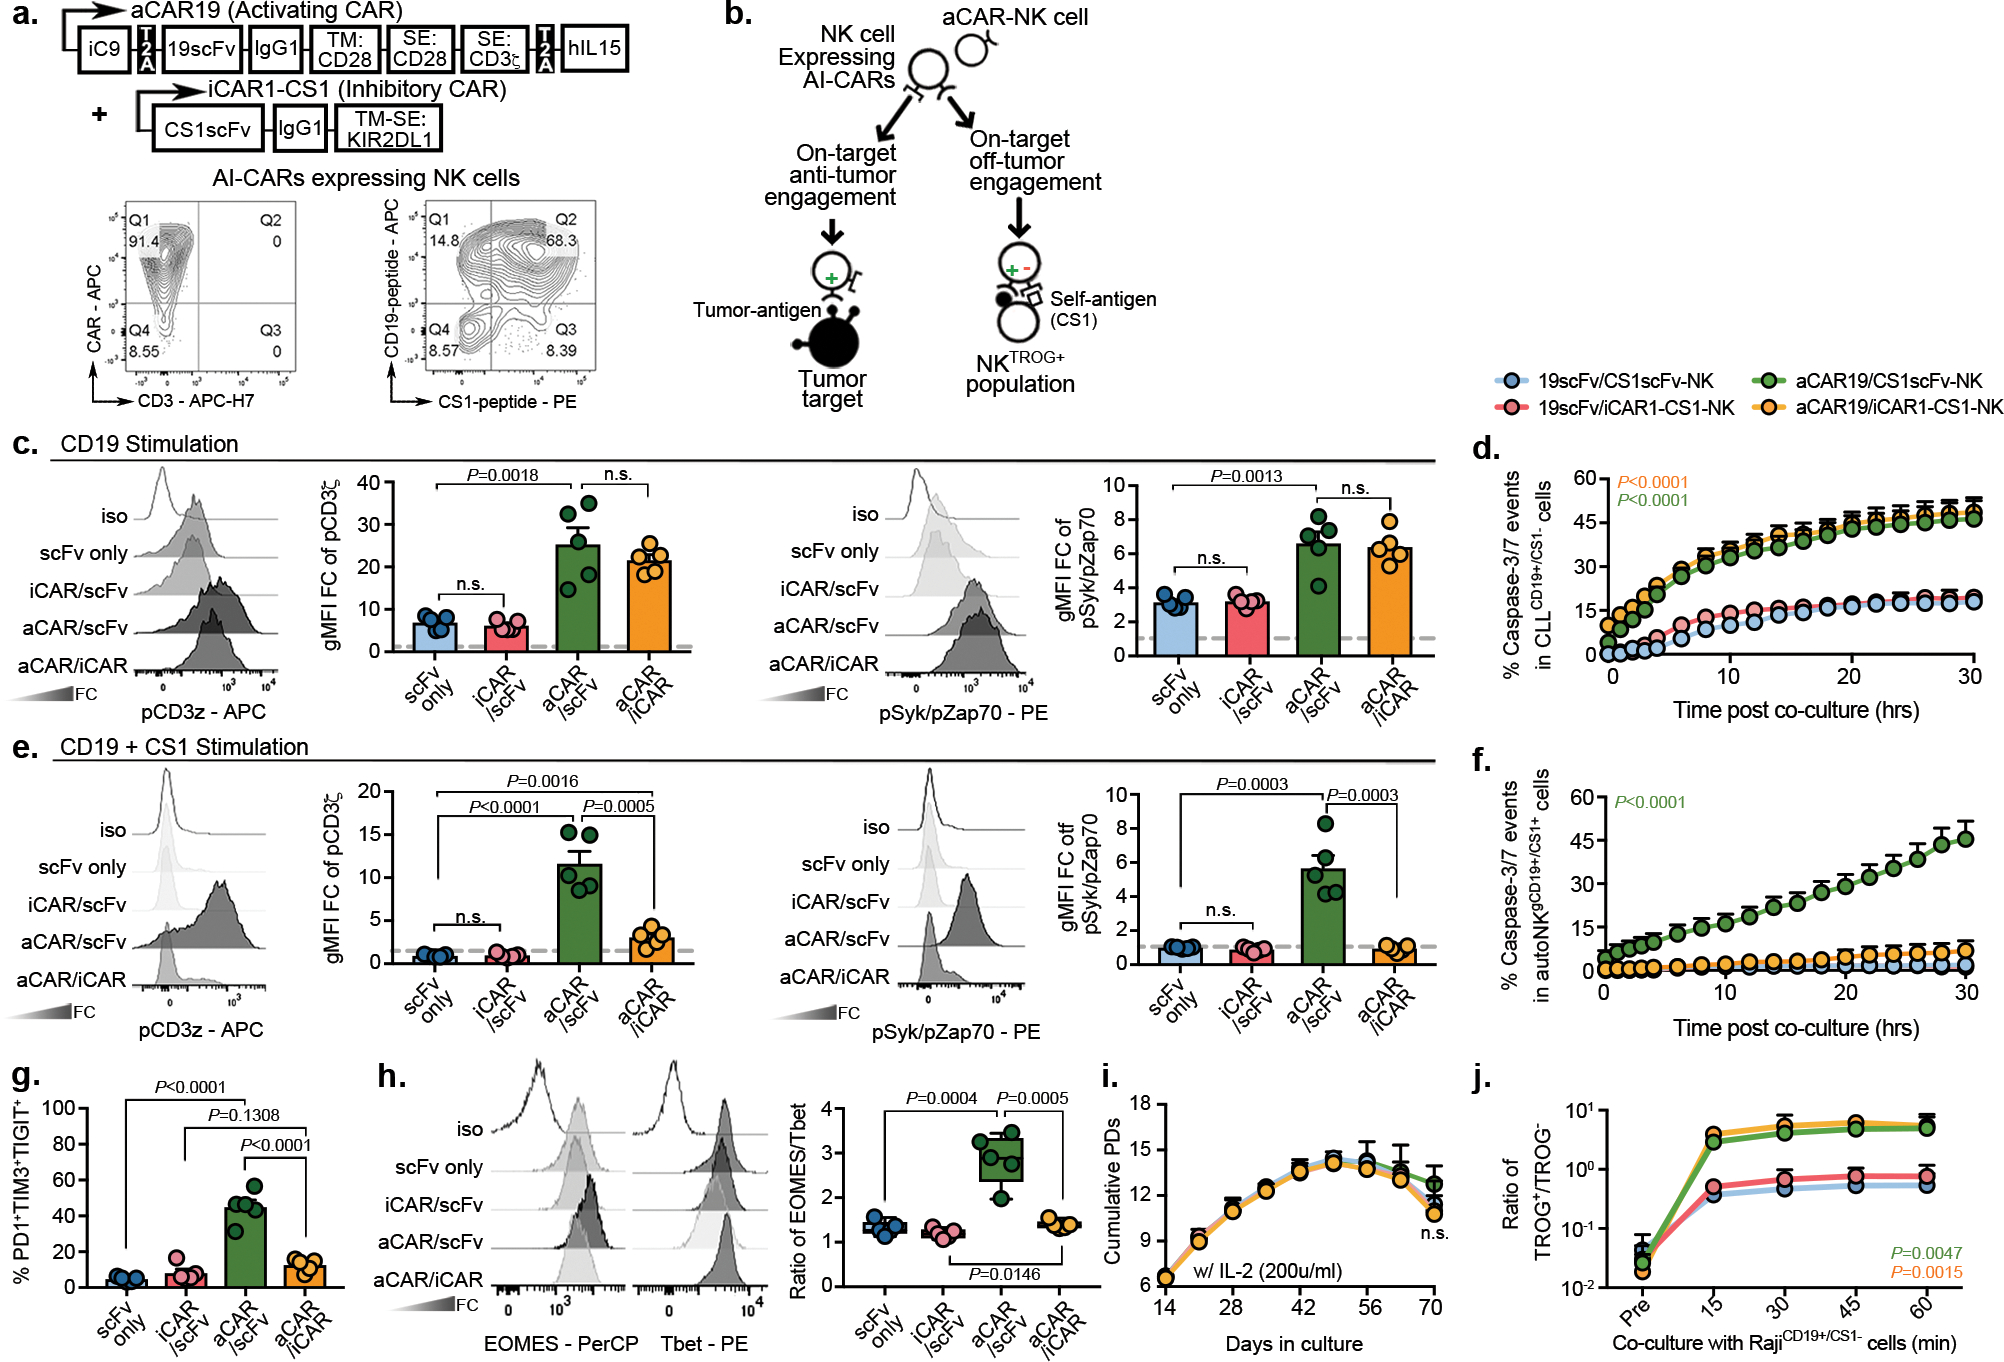
(a) Schematic of the retrovirus vector for aCAR19 and iCAR1-CS1. Flow cytometric analysis shows dual expression of aCAR19 and iCAR1-CS1 on NK cells, measured by tagged peptides (CD19 and CS1). TM: transmembrane; SE: signaling endodomain. CAR expression levels are indicated within respective quadrants. (b) Diagram illustrating engagement of AI-CAR-expressing NK cells with their targets; red symbol indicates inhibitory signal ‘−’, green symbol indicates activating signal ‘+’. (c) Phos-CD3ζ (pCD3z, left) and phos-Syk/Zap70 (right) levels in NK cells expressing 19scFv/CS1scFv (scFv only- no intracellular signaling; blue), 19scFv/iCAR1-CS1 (iCAR/scFv; red), aCAR19/CS1scFv (aCAR/scFv; green), or aCAR19/iCAR1-CS1 (aCAR/iCAR; yellow) after stimulation with RajiCD19+/CS1− cells; the following bar graphs show fold change (FC) in gMFI after normalization to isotype control (n=5 donors/condition). (d) Incucyte analyses showing caspase 3/7 events in CD19+CS1− primary CLL cells after co-culture with CAR-NK cells, controlled by scFv-expressing NK cells (n=3 donors/condition). (e) Phos-CD3ζ (pCD3z, left) and phos-Syk/Zap70 (right) levels in NK cells expressing 19scFv/CS1scFv, 19scFv/iCAR1-CS1, aCAR19/CS1scFv, or aCAR19/iCAR1-CS1 stimulated with CD19+ autoNKCS1+ cells; bar graphs show the FC in gMFI after normalization to isotype control (n=5 donors/condition). (f) Incucyte analysis showing caspase 3/7 events in gCD19+CS1+ autoNK cells after co-culture with CAR-expressing NK cells, controlled by scFv-expressing NK cells (n=3 donors/condition). (g) Co-expression of PD1, TIM3, and TIGIT, and (h) ratio of EOMES/Tbet in singlet CAR-NK cells after the second round of antigen challenge with autoNKgCD19+/CS1+/GFP+ cells (n=5 donors). Representative flow histograms for EOMES and Tbet were shown. (i) Cumulative population doublings (PDs) for each CAR-expressing NK cell condition (n=3 donors) over 70 days of culture with IL-2. (j) tCD19 expression (shown as ratio of TROG+/TROG−) on singlet CAR-expressing NK cells (n=3 donors) after co-culture with Raji cells, controlled by scFv-expressing NK cells (representative of 3 donors).
P values were determined by two-tailed two-way ANOVA in panels d,f,I,j, or two-sided Student’s t test in panels c,e,g,h; n.s: not significant. Data were assessed by flow cytometry in panels a,c,e,g,h,j, and shown as mean + s.e.m, or medium (min/max) in boxplot. Each circle represents an individual donor.
AI-CARs improve in vivo anti-tumor activity of NK cells
To investigate whether AI-CAR-NK cells could protect NK cells from aCAR-mediated fratricide and exhaustion in vivo, we used our well-established NSG mouse model with Raji tumor36,37. Mice received one dose of 1×10⁷ NK cells expressing anti-CD19 aCAR/anti-CS1 iCAR1, with controls of NK cell expressing anti-CD19 scFv/anti-CS1 scFv, anti-CD19 scFv/anti-CS1 iCAR1, or anti-CD19 aCAR/anti-CS1 scFv (Fig. 6a). The anti-CD19 aCAR/anti-CS1 iCAR1-NK cells mediated the strongest anti-tumor response with a significantly lower BLI signal and better overall survival compared to the control groups (Fig. 6b–d). To confirm that the improved in vivo anti-tumor response is mediated through a decrease in TROG-antigen induced fratricide and improved effector function by AI-CAR-NK cells, in a parallel experiment we sacrificed mice at serial time points and collected blood and organs for NK cell profiling. While the AI-CAR-NK cells did not impact the extent of aCAR-mediated trogocytosis (Fig. 6e), we observed less trogocytosis-mediated in vivo fratricide, as evidenced by the better viability, higher persistence (Fig. 6f–h, Supplementary Fig. 11a–e), and improved effector function compared with the control groups (Fig. 6i, Supplementary Fig. 11f).
Figure 6. AI-CAR expressing NK cells showed superior in vivo anti-tumor activity.
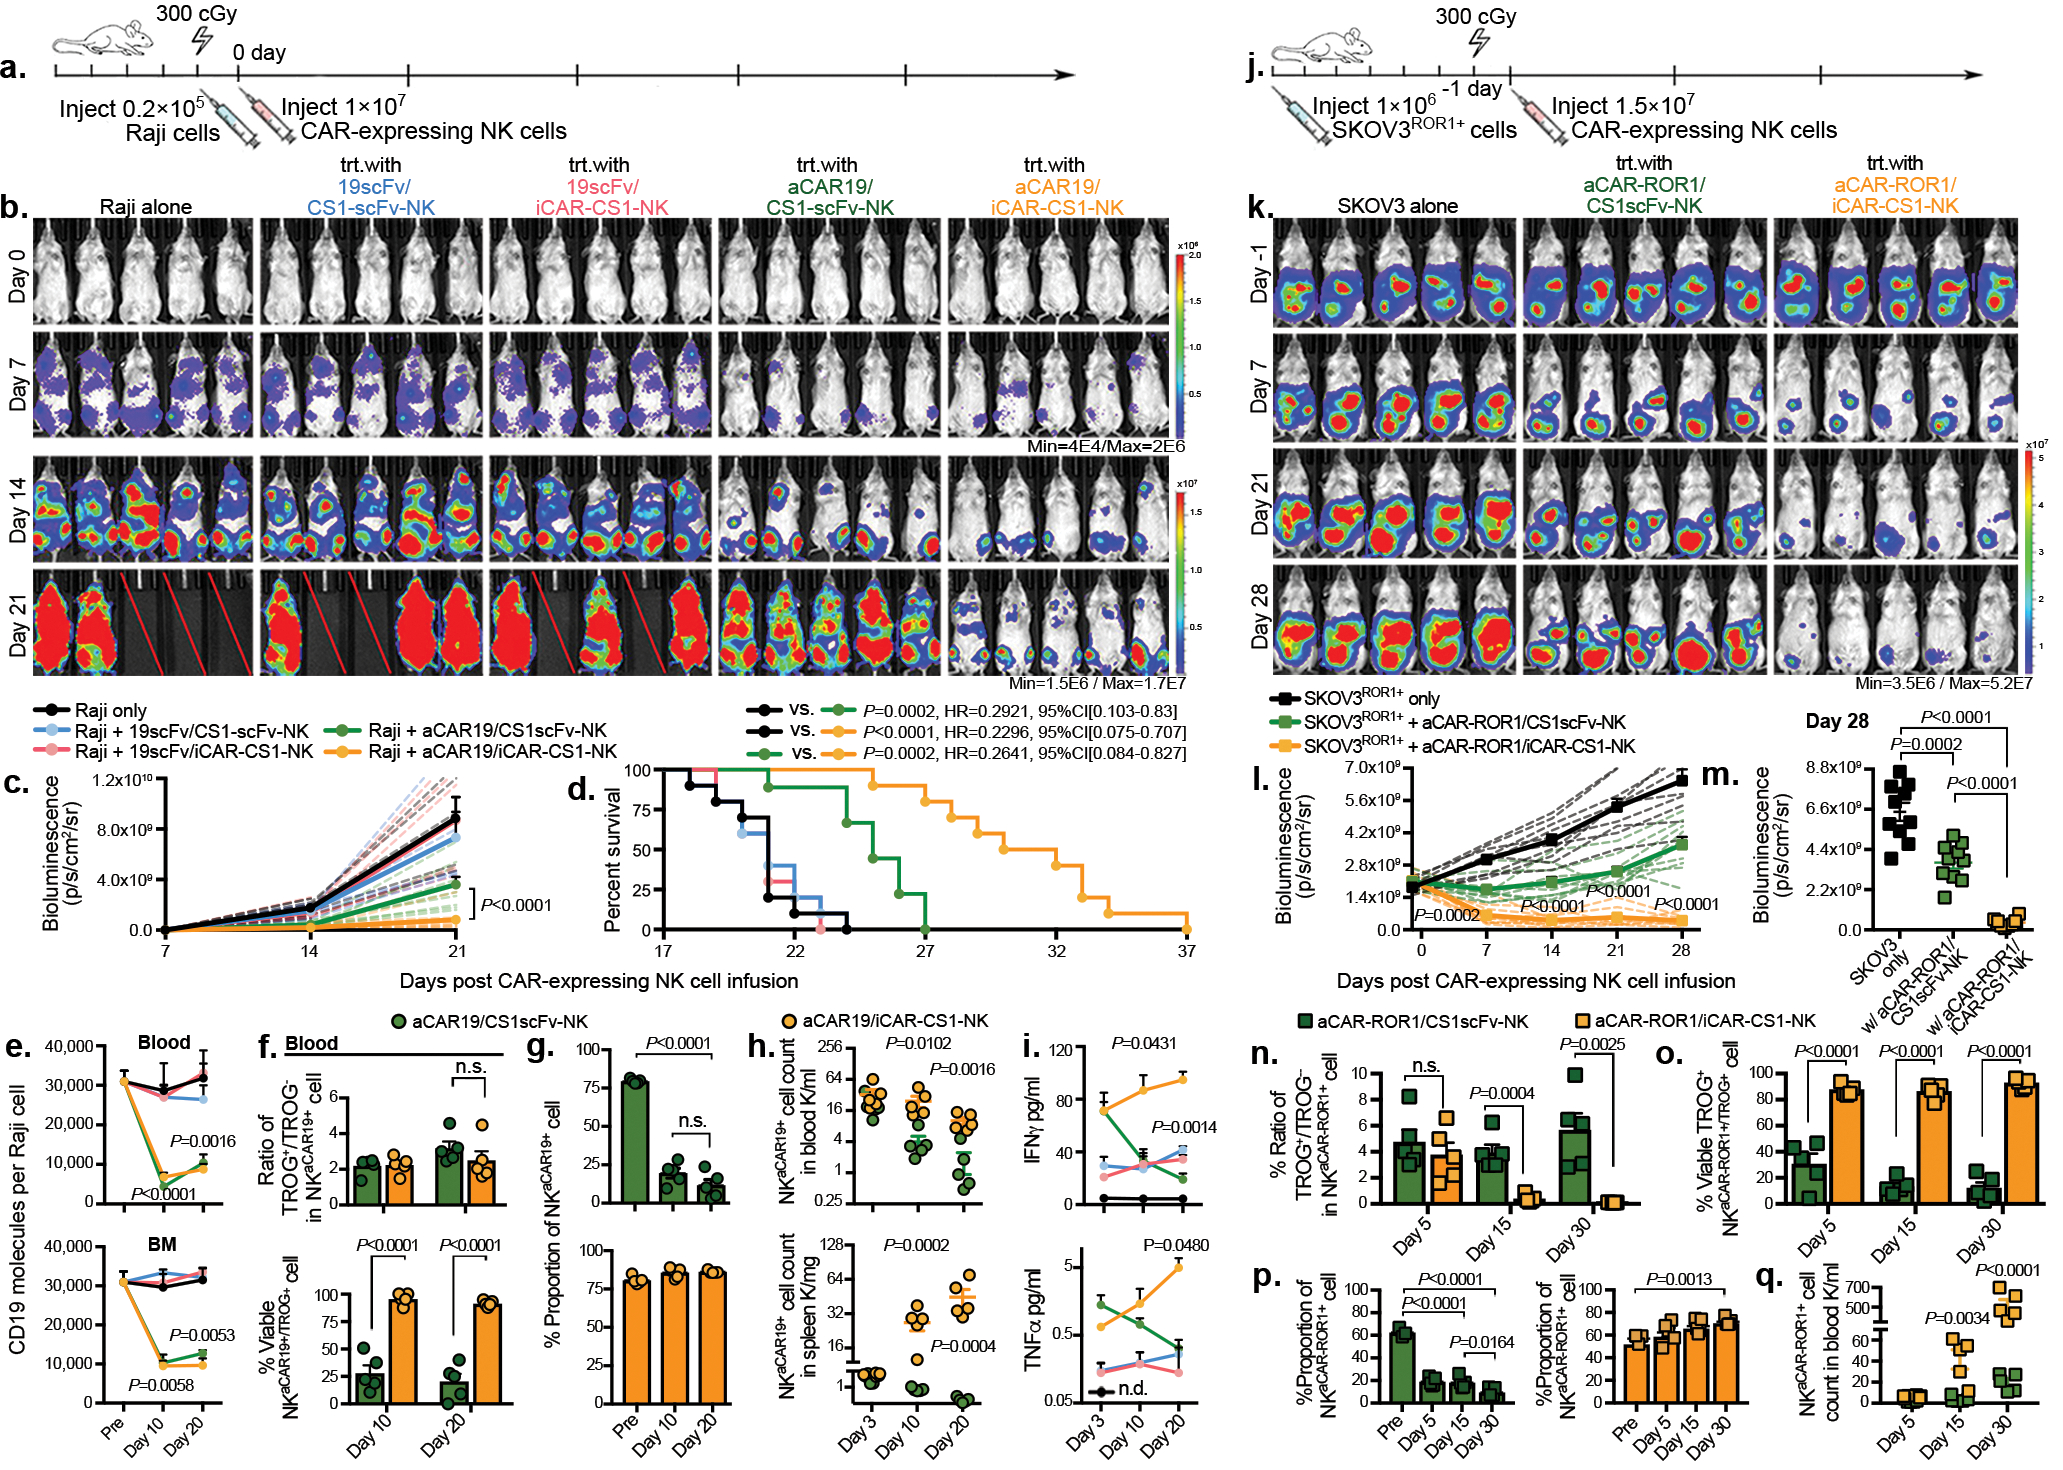
(a) Schema of the mouse model of Raji tumor. Mice received a single infusion of NK cells expressing 19scFv/CS1scFv (blue), 19scFv/iCAR-CS1 (red), aCAR19/CS1scFv (green), or aCAR19/iCAR-CS1 (orange). trt: treatment, n=5 mice). (b) Tumor burden was assessed weekly by bioluminescence imaging (BLI); and (c) presented as the normalized intensity of BLI; dashed lines refer to each mouse. (d) Kaplan-Meier curves showing survival of mice (e) CD19 expression on Raji cells (molecule count per cell) in peripheral blood (PB) and bone marrow (BM), controlled against tumor only (n=5 mice). (f) tCD19 expression on singlet NKCAR19+ cells, indicated as TROG+/TROG− ratio (left), and viability (%) of TROG+ fraction (NKtCD19+, right) for aCAR19/CS1scFv vs. aCAR19/iCAR-CS1 NK cells, in PB (n=5 mice/group). (g) NK cell viability in PB after aCAR19/iCAR1-CS1 (green bars, left) or aCAR19/CS1scFv NK cell infusion (orange bars, right; n=5 mice/group). (h) Viable NKaCAR19+ cell count in PB and spleen (n=5 mice/group). (i) Serum IFN-γ and TNF-α levels (n=5 mice/group). (j) Schema of SKOV3ROR1+engrafted mouse model receiving a single infusion of NK cells expressing aCAR-ROR1/CS1scFv (green), or aCAR-ROR1/iCAR-CS1 (orange), with non-treated tumor-engrafted group as control (n=5 mice/group). (k-m) Weekly tumor burden assessment by BLI (k); and (l) the normalized BLI intensity for each mouse is indicated by dashed lines, and (m) BLI intensity at day 28. (n) tROR1 expression on singlet NKaCAR-ROR1+ cells (ratio of TROG+/TROG−). (o) Percent viable TROG+ fraction (NKtROR1+) for aCAR-ROR1/CS1scFv (green bar), or aCAR-ROR1/iCAR-CS1 NK cells (orange bar) in PB (n=5 mice/group). (p) Percent viable GFP−CD3−CD56+aCAR-ROR1+ NK cells in PB after aCAR-ROR1/CS1scFv (green bar, left) or aCAR-ROR1/iCAR-CS1 NK cell infusion (orange bar, right; n=5 mice/group). (q) Viable NKaCAR-ROR1+ cell count in PB after aCAR-ROR1/CS1scFv (green symbols), or aCAR-ROR1/iCAR-CS1 cell infusion (orange symbols; n=5 mice per group).
P values were determined by two-tailed two-way ANOVA in panel c, Log-rank test in panel d, or two-tailed Student’s t test in panels e,f,g,h,i,l,m,n,o,p,q. Data were pooled from two independent experiments using NK cells from different donors in panels c,d,i m. Flow cytometry data are shown as mean + s.e.m. Each symbol represents an individual mouse sample.
We also investigated the validity of our results in a solid tumor model of ovarian cancer. We injected SKOV3 cells intraperitoneally that were endogenously expressing ROR1, or genetically engineered to express CD19 (SKOV3gCD19+) into NSG mice, followed by a single infusion of NK cells co-expressing antigen-specific AI-CARs or the relevant scFv controls (Fig. 6j, Extended Data Fig. 9a). Again, we observed superior anti-tumor control with AI-CAR-NK cells (Fig. 6k–m, Extended Data Fig. 9b–d), associated with improved NK cell viability, persistence and infiltration within the tumor microenvironment with variable expression of the ROR1 TROG-antigen on their surface (Fig. 6n–q, Extended Data Fig. 9e–i). Taken together, these results provide evidence that iCAR limit the aCAR response to the TROG-antigen on NK cells in an antigen-specific fashion in vivo, reducing fratricide, preserving NK cell effector function and persistence without abrogating the aCAR response to the tumor target, thus, resulting in improved NK cell anti-tumor activity.
Discussion
Trogocytosis is a well-described phenomenon by which lymphocytes extract plasma membrane fragments from their targets following immunological synapse formation1,2,4. In this study, we revealed a unique mechanism for tumor escape following CAR-NK cell therapy, specifically that activation of aCAR drives the transfer of target antigen from tumor cells that are engaged but not killed by NK cells. The aCAR-NK cells that acquired TROG-antigen, in turn, become target cells (antigen-induced self-recognition) and are lysed by other aCAR-NK cells while those that are not killed by fratricide become hyporesponsive, similar to reports with CAR-T cells8,53. This phenomenon is associated with a concurrent loss of target antigen on the cancer cells, rendering them less susceptible to aCAR-mediated killing, and thus, increasing the risk of tumor relapses. Finally, we showed that a novel dual AI-CAR system that combines an extracellular domain targeting an NK-specific antigen with the signaling endodomain from an inhibitory KIR (iCAR) successfully achieves antigen-specific suppression of aCAR-mediated NK cell fratricide and hyporesponsiveness, while retaining their on-target anti-tumor activity with improved persistence in multiple in vivo models (Extended Data Fig. 10a,b).
Intercellular protein transfer is mediated through multiple pathways2,54,55. Among these, trogocytosis is a well-described phenomenon that mediates surface protein transfer from targets to NK cells5,56,57, and has been shown to significantly impact NK cell function15,17,18. For instance, NKG2D-mediated trogocytosis of NKG2D-ligands has been associated with NK cell hyporesponsiveness and fratricide15,16,19,58. Similarly, trogocytosis triggered by the engagement of the CD16 receptor on NK cells with monoclonal antibodies leads to target antigenic modulation and compromised therapeutic efficacy59,60. A recent study reported how trogocytosis promotes antigen density reduction and T-cell exhaustion and fratricide after CAR-T cell therapy8. Our study is the first to show that human CAR-NK cells acquire cognate-antigen targets from tumor cells through antigen-specific trogocytosis that requires CAR-activation and signaling. This phenomenon was observed with CARs expressing different CAR-signaling endodomains and targeting different antigens, but the degree of trogocytosis was influenced by the density of the antigen on tumor cells as well as the affinity of the CAR for its cognate ligand. Interestingly, however, high binding-affinity scFv domain did not always result in a high level of TROG-antigen transfer possibly because other factors could also play a role such as rate of disassociation from the cognate antigen. Given that TROG-antigen expressing NK cells are susceptible to aCAR-NK cell cytotoxicity by induced self-recognition, preventing trogocytosis could be a beneficial approach to improving the efficacy and in vivo persistence of aCAR-NK cells.
However, to date, there are no strategies that can be applied therapeutically to regulate trogocytosis in a specific manner. Here, we developed a novel engineering approach that took advantage of normal NK cell biology and employed an ITIM-containing iCAR to suppress the aCAR-mediated recognition of TROG-antigen-expressing NK cells (on-target/off-tumor recognition of TROG+ NK cells), while retaining the aCAR activity against tumor targets. By combining the activity of two chimeric receptors, one of which generated a dominant negative signal upon recognition of an NK-specific antigen and one that induced an activating signal upon engagement with the tumor target, we could successfully switch off the response of the counteracting aCAR-activation against the TROG-antigen on NK cells in an antigen-specific manner, while sparing their activity against the tumor target. NK cells transduced with this AI-CAR system were less susceptible to TROG-antigen-mediated fratricide, and mediated a superior anti-tumor response both in vitro and in multiple in vivo models.
Together, this study reports aCAR-mediated trogocytosis, which contributes to a reduction in target antigen density, and NK cell fratricide and hyporesponsiveness, as a novel mechanism of disease relapse after aCAR-NK cell therapy. We provide a proof of concept approach to preventing aCAR-NK cells from TROG-antigen induced immunomodulatory consequences using antigen-specific inhibitory KIR–based receptors (iCARs) that successfully inhibit aCAR-mediated TROG-antigen induced NK cell fratricide, while retaining critical effector function against tumor cells expressing the same antigen. This dynamic modulation of AI-CAR-signaling may find useful applications to improve the in vivo persistence and therapeutic efficacy of a range of adoptive NK cell therapies.
Methods
Cell lines, primary cells and culture conditions
CD19+ cell lines of Raji (CCL-86), NALM-6 (CRL-3273) and Ramos (CRL-1596), CD5+ cell line CCRF (CRM-CCL-119), CD70+ cell line THP-1 (TIB-202), CD123+ cell line MOLM-14 (ACC 777), BCMA+ cell line MM1S (CRL-2974), SKOV3 cell line (HTB-77), K562 cell line (CRL-3344) and 293T cell line (CRL-3216) were obtained from the American Type Culture Collection (ATCC). Cells of Raji, NALM-6, Ramos, CCRF, MOLM-14, K562 were cultured in RPMI-1640 (Invitrogen) supplemented with 10% fetal bovine serum (FBS; HyClone), 1% penicillin-streptomycin, and 1% GlutaMAX™; cells of THP-1 and 293T cells were cultured in DMEM (Invitrogen) supplemented with 10% FBS, 1% penicillin-streptomycin and 1% GlutaMAX™; SKOV3 cells were cultured in McCoy’s 5a Medium (Invitrogen) supplemented with 10% FBS, 1% penicillin-streptomycin and 1% GlutaMAX™. K562 cells were retrovirally transduced to co-express 4–1BBL, CD48, and membrane-bound interlukin (IL)-21 and served as universal antigen presenting cells (uAPC) for in vitro NK cell expansion61. To model trogocytosis detection by using a fluorescent-traceable marker, the CD19 gene in Raji cells was deleted using the CRISPR-Cas9 system (crRNA1: CTAGGTCCGAAACATTCCAC-CGG, crRNA2: CGAGGAACCTCTAGTGGTGA-AGG); CD19-knockout Raji (RajiCD19-KO) cells were purified by MoFlo Astrios (Beckmen Coulter) and then retrovirally transduced to express CD19-mCherry fusion protein with or without GFP co-expression (RajiCD19-mtCherry/GFP and RajiCD19-mCherry). Raji cells were transduced with firefly luciferase-GFP to allow in vivo tumor burden examination using the IVIS Spectrum imaging system (Caliper). To have an in vivo model of solid tumors with target antigen CD19 expression, SKOV3 cells were genetically modified (SKOV3gCD19+) and labeled with firefly luciferase-GFP. All cells were maintained in a 37°C incubator with 5% CO2, and regularly tested for mycoplasma contamination using the MycoAlert Mycoplasma Detection Kit (Lonza).
PBMCs from patients treated with CAR19/IL-15 NK cells
Clinical samples used in this study were collected from patients treated on a clinical trial of iC9/CAR19/IL-15 (CAR19/IL-15) transduced cord blood (CB)-NK cells as previously reported (NCT03056339)41. Peripheral blood mononuclear cells (PBMCs) from 11 patients with chronic lymphocytic leukemia (CLL) or non-Hodgkin lymphoma (NHL) were collected at different time points following CAR19/IL-15 NK cell adoptive therapy at MD Anderson Cancer Center. The normalized mean TROG-CD19 (tCD19) gMFI on CAR19-NK cells for the whole patient cohort was 6.29 (range of 0.61–35.77). Patients with a high (> mean) versus low (≤ mean) normalized tCD19-gMFI at more than one time point were defined as group of TROGhi (n=4 patients) vs. TROGlow (n=7 patients), respectively. In addition, circulating leukemia cells from four patients with CLL and four patients with B cell-acute lymphocytic leukemia (ALL) enrolled on laboratory protocols were isolated after density-gradient centrifugation for in vitro studies of trogocytosis. All patients gave informed consent per the Institutional Review Board (IRB). All studies were performed in accordance with the Declaration of Helsinki.
Vector constructs and retrovirus production
The retroviral vector encoding iCas9, 19scFv.CD28.zeta.2A.IL-15 (CAR19/IL15), was kindly provided by Dr. Gianpietro Dotti (University of North Carolina - Chapel Hill)62. The iCas9.19scFv.2A.IL-15 (19scFv/IL15), iCas9.CD5scFv (XZ-CD563).CD28.zeta.2A.IL-15 (CAR5/IL15), iCas9.CD5scFv.DAP10.zeta.2A.IL-15 [CAR(DAP10z)/IL15], iCas9.CD5scFv.zeta.2A.IL-15 [CAR(3z)/IL15], iCas9.CD5scFv.DAP12.zeta.2A.IL-15 [CAR(DAP12z)/IL15], iCas9.CD5scFv.NKG2D.zeta.2A.IL-15 [CAR(2Dz)/IL15], iCas9.CD5scFv.41BB.zeta.2A.IL-15 [CAR(BBz)/IL15], iCas9.CD5scFv.DAP10.2A.IL-15 [CAR(DAP10)/IL15], iCas9.CD5scFv.DAP12.2A.IL-15 [CAR(dap12)/IL15], iCas9.CD70scFv (ARGX-11064, or LB#14).CD28.zeta.2A.IL-15 (CAR70/IL15), iCas9.CD27(ECD).CD28.zeta.2A.IL-15 (CAR27s/IL15), iCas9.CD123scFv (2629265).CD28.zeta.2A.IL-15 (CAR123/IL15), and iCas9.BCMAscFv (huc11D5.3-Luc9066).CD28.zeta.2A.IL-15 (CAR-BCMA/IL15) constructs were cloned into the SFG retroviral backbone to generate additional viral vectors. For the construction of inhibitory CARs (iCARs), transmembrane domains of KIR2DL1 and LIR-1, cytoplasmic signaling domains of KIR2DL1, LIR-1, LAIR-1, NKG2A, and CD300A were used as inhibitory signals. Extracellular domains comprising either 19scFv or CS1scFv (HuLuc6349), along with IgG hinge, were used to fuse and generate iCAR19 or iCAR-CS1 constructs, respectively. CS1-scFv, iCAR-CS1, and iCAR19/IL15 constructs were then each cloned into the SFG retroviral backbone. The whole CD19 coding sequence was fused to an mCherry reporter gene at the 3’ end to generate the CD19-mCherry construct. CD19-mCherry and GFP were then linked using the 2A peptide resulting in the bicistronic CD19-mCherry/GFP construct. mCherry, CD19-mCherry, CD19-mCherry/GFP were also each cloned into the SFG retroviral backbone. All construct syntheses and molecular cloning were performed by GeneArt Gene Synthesis (Thermo Fisher Scientific). Transient retroviral supernatants were produced from transfected 293T cells as previously described67.
Cord Blood NK cell transduction and expansion
CB units for research were provided by the MD Anderson Cancer Center (MDACC) CB Bank under an IRB approved protocol (Lab04-0249). CB-derived NK cells (CB-NK) were isolated and expanded as previously described36. In brief, lymphocytes were collected by density-gradient centrifugation using Ficoll-Histopaque solution (Sigma-Aldrich). CD56+CD3− NK cells were then purified using an NK negative isolation kit (Miltenyi Biotec), and co-cultured with irradiated (100 Gy) uAPCs at a 2:1 ratio in complete stem cell growth medium (SCGM), supplemented with 200 U/ml recombinant human IL-2 (Proleukin). On Day 4 post uAPC stimulation, fresh NK cells were purified again and transduced with retroviral vectors expressing CAR-constructs. A second retroviral transduction of iCAR constructs was performed on Day 6 to then generate NK cells expressing AI-CAR. Following the same approach, CD19-mCherry or CD19-mCherry/GFP expressing cells (both primary NK cells and tumor cells) were prepared. CAR transduction efficiency was measured by flow cytometry. Irradiated uAPC were added weekly to the NK cell culture to support NK cell expansion.
Flow cytometry
CAR expression was measured by detection of IgG hinge using conjugated goat anti-human lgG (H+L; Jackson ImmunoResearch). For AI-CAR detection, anti-CD19 aCAR expression was measured using the CD19-CAR detection reagent (Miltenyi Biotec). Expression of anti-CS1 iCAR was measured by binding of CAR to CS1 his-tag fusion protein (ACRO Biosystems). Ghost Dye™ Violet 450 (TONBO Biosciences) was used to determine viability, and aqua fixable viability dye (eBioscience) was used for assessing viability when fixation protocols were applied. Human Fc receptor blocking solution (Miltenyi Biotec) was used to block Fc receptors to minimize non-targeted specific staining. For intracellular staining, cells were fixed and permeabilized using Intracellular Fixation and Permeabilization Buffer Kit (eBioscience) according to the manufacturer’s protocol. For phosphoflow staining, cells were prepared and fixed using the Perfix Expose Kit from Beckman Coulter, according to the manufacturer’s protocol. Phycoerythrin Fluorescence Quantitation Kit (BD Biosciences) was used according to the manufacturer’s protocol to determine the number of molecules of CD19, CD5, CD70, CD123, and BCMA per cell. AccuCheck Counting Beads (ThermoFisher) were used to determine the cell concentration in each tested population. Amnis Imagestream-X MarkII (Millipore) was used to visualize fixed cells at 60X magnification with a pixel size of 0.1 μm2, data were analyzed using IDEAS (Millipore). Flow cytometry analysis was performed on LSRFortessa™ X-20 (BD Bioscience) and data were analyzed using FlowJo (BD Bioscience). Cell sorting was performed using MoFlo XDP cell sorter (Beckman Coulter). Antibodies used for flow cytometry analysis include: CD45-Krome Orange (1:40), CD56-BV650 (1:200), CD16-BV605 (1:100), Anti-His Tag-PE (1:100), CD19-APC (1:100), CD20-APC (1:100), CD19-BV785 (1:100), CD3-APC-H7 (1:200), CD19-PE (1:100), Biotin-APC (1:100), CD20-PerCP/Cyanine5.5 (1:100), CD22-PerCP/Cyanine5.5 (1:100), CD22-APC (1:100), GFP-AF488 (1:100), Fixable Viability Dye-eFluor 506 (1:200), CD319-PE/Cyanine7 (1:100), CD366-PE/Cyanine7 (1:100), CD223-BV785 (1:100), TIGIT-BV421 (1:100) CD279-PE (1:100), Isotype-PE (1:100), Isotype-BV786 (1:100), EOMES-PerCP (1:100), T-bet-PE (1:100), LIVE/DEAD™ Fixable Aqua Dead Cell Stain (1:200), ROR1-PE (1:100), Human BD Fc Block (1:200), CD19-PerCP (1:100), Perforin-AF647 (1:100), CD107a-BV785 (1:100), TNF-α-PE/Cyanine7 (1:100), IFN-γ-V450 (1:100), Zap70 (Y319)/Syk (Y352)-PE (1:100), ROR1 Protein/His Tag (1:100), SLAMF Protein/His Tag (1:100), Biotinylated Human CD19 (20–291) Protein (1:100), pSHP-1-PE (1:100), Phalloidin-AF647 (1:10,000), CD56-PE/Cyanine7 (1:50), CD19-AF594 (1:50), CD20-APC/Cyanine7 (1:50), CD22-APC/Cyanine7 (1:50). Gt F(ab’)2- PE (1:200)
Trogocytosis assay
NK cells were co-cultured with designated GFP+ target cells at an effector:target (E:T) ratio of 1:1. Co-cultured cells were washed with FACS buffer and then subjected to surface staining of anti-hCD56 (Biolegend, HCD56, 1:200) and anti-hCD3 (Biolegend, SK7, 1:200) antibodies at 4°C for 20 minute in the dark. Following staining, cells were washed and assessed by flow cytometry. The TROG+ population was defined by the detection of TROG-antigen on the surface of singlet NK (CD56+CD3−GFP−) cells; also, the cognate antigen expression on the co-cultured tumor cells (CD56−GFP+) was evaluated. The Incucyte Live-Cell Analysis System (ESSEN Bioscience) was used for the mCherry-based trogocytosis assay, where RajiCD19-mCherry cells or RajimCherry cells were co-cultured with CFSE (ThermoFisher) labeled NK cells at a 1:1 ratio. Image scanning of the mCherry signal in NK cells was recorded in real-time and cells that showed both mCherry and CFSE signals were identified as the NKTROG+ population. To block trogocytosis, NK cells were pre-treated with 1 μM latrunculin A (Sigma-Aldrich) at 37 °C for 20 min before co-culture with target cells.
NK activation assay
NK cells were stimulated by target cells at an E:T ratio of 1:1 for 6 hrs. To inhibit protein transport, GolgiStop and GolgiPlug (BD Bioscience) were added to the culture at the second hour post-co-culture according to the manufacturer’s protocol. Anti-CD107a (Biolegend, H4A3, 1:100) was also added at this time point to capture CD107a as a marker of NK cell degranulation. When examining NKTROG+ cell populations, GolgiStop and GolgiPlug were not added to allow the trogocytosis. After incubation, cells were washed with FACS buffer (BD Bioscience) and stained with anti-hCD56, anti-hCD3. Ghost Dye™ Violet 450 (Tonbo Biology, 1:200) was used to identify the viability of NK populations. Intracellular staining with interferon-gamma (IFN-γ, BD Bioscience, B27, 1:100) and tumor necrosis factor-alpha (TNF-α, BD Bioscience, MAb11 antibodies were subsequently applied,1:100). Expression of CD107a, IFN- γ, and TNF-α was measured and expressed as a percentage of CD56+CD3− NK cells when compared with un-stimulated NK cells.
Cytotoxicity assay in Incucyte system
NK cells were co-cultured at an E:T ratio of 1:1 with tumor cells either labeled with Vybrant DyeCycle Ruby Stain (ThermoFisher) or expressing mCherry signal. The Incucyte caspase-3/7 green apoptosis assay reagent (SAETORIUS) was added to each well to label apoptotic cells. Images of each well were captured in real-time during the period of 6–30 hrs post addition. Data were analyzed using the Incucyte Live-Cell Analysis System that assessed the number of apoptotic cells (green) and target cells (red) in a real-time manner. The percentage (%) of caspase-3/7 expression was measured in cells showing both green and red signals, and computed as an expression of the total detected target cells (red). CD19-scFv antibody (200 ng/ml, Invivogen) was pre-incubated with NKTROG+ populations for 30 min to block CD19-antigen exposure, and anti-β-Gal scFv antibody (200 ng/ml, Invivogen) was used as the negative control.
Single-cell cytotoxicity assay
Time-lapse imaging microscopy in nanowell grids (TIMING) was used to test NK-mediated cytotoxicity at a single-cell scale as previously described68. In brief, the sorted NK cell populations and target cells (K562 or Raji) were labeled with lipophilic PKH dyes, respectively, and loaded onto nanowell arrays. The array was incubated with media that was pre-mixed with Annexin V (BD Bioscience), and monitored in real-time for 5–6 hrs by a Carl Zeiss Axio Observer fitted with a Hamamatsu Orca-Flash sCMOS camera using a 20 × 0.8 NA objective. Images of ~5,000 wells were collected and processed using an in-house algorithm for cell tracking and segmentation69.
NK Population Doubling assay
CB-NK cells were subcultured every week, with or without uAPC feeder cells, after the initial transduction and expansion. Using the equation for Population Doubling (PD)=log10[(A/B)/2], where A is the number of harvested cells and B the number of plated cells from each subculture, the weekly PD was measured, then, the sum of each PD over time was determined as the accumulative PDs. Assays were terminated three weeks after the cell count from the subculture failed to achieve at least an equal amount of seeded cells. Data were obtained from three different CB-derived NK populations for each condition.
Mass Cytometry (CyTOF)
Mass cytometry was performed as previously described37,38. Primary antibodies were conjugated in-house with corresponding metal tags using MaxparX8 polymer antibody labeling kit per manufacturer’s protocol (Fludigm). NK cells were washed with cell staining buffer (0.5% bovine serum albumin/PBS), and incubated with human Fc receptor blocking solution (Miltenyi Biotec) before antibody mix was added. Cells were then incubated with 2.5 μM cisplatin (Sigma Aldrich), followed by fixation and permeabilization using BD Cytofix/Cytoperm™ solution according to the manufacturer’s protocol. For intracellular staining, cells were washed twice with perm/wash buffer and incubated directly with antibody master mix against intracellular markers. Cells were then stored overnight in 500 μl of 1.6% paraformaldehyde (EMD Milipore)/ PBS with 125 nM iridium nucleic acid intercalator (Fluidigm). On the days that cells were assessed, they were washed in 1 ml of MilliQ dH2O, and filtered through a 35 μm nylon mesh (cell strainer cap tubes, BD Bioscience). The cells were then resuspended in MilliQ dH2O supplemented with EQTM 4-element calibration beads, and subsequently acquired at 300 events/second on a Helios instrument (Fluidigm).
For CyTOF analysis, antibodies used with the corresponding metal tag isotopes in vitro experiments include: CD45 (Fluidigm, HI30, 89Y), GFP (Biolegend, FM264G, 144Nd), DAP12 (RD, 406288, 146Nd), NKG2C (Biolegend, 134591, 147Sm), TRAIL (Miltenyi, REA1113, 148Nd), CD25 (Miltenyi, REA570, 149Sm), CD69 (Biolegend, FN50, 150Nd), CD2 (Miltenyi, REA972, 151Eu), CAR (Jackson immune research, polyclonal, 152Sm), PAN-KIR (RD, 180704, 153Eu), TIGIT (ThermoFisher, MBSA43, 154Sm), KLRG1 (Miltenyi, REA261, 156Gd), OX40 (Miltenyi, REA621, 158Gd), Perforin (Miltenyi, REA1061, 159Tb), PD1 (Miltenyi, PD1.3.1.3, 160Gd), EOMES (ThermoFisher, WD1928, 161Dy), Tbet (Miltenyi, 4B10, 162Dy), c-Kit (Miltenyi, REA787, 163Dy), SAP (Biolegend, 1A9, 164Dy), TIM3 (RD, 344823, 165Ho), NKG2D (Miltenyi, REA797, 166Er), 2B4 (ThermoFisher, C1.7, 167Er), Ki67 (Biolegend, Ki67, 168Er), NKG2A (Miltenyi, REA110, 169Tm), DNAM-1 (Miltenyi, REA1040, 170Er), CS1 (Biolegend, 162.1, 172Yb), Granzyme B (Miltenyi, REA226, 173Yb), CD94 (Miltenyi, REA113, 174Yb), LAG3 (Miltenyi, REA351, 175Lu), ICOS (Miltenyi, REA192, 176Yb), CD16 (Fluidigm, 3G8, 209Bi), CD3 (Biolegend, UCHT1, 194Pt), Cisplatin L/D (Fluidigm, 198Pt), CD56 (BD Bioscience, NCAM16.2, 106Cd), CD19 (Biolegend, HIB19, 110Cd), Granzyme A (Miltenyi, REA162, 111Cd), Syk (Biolegend, 4D10.2, 112Cd), NKp30 (Miltenyi, AF29-4D12, 113Cd), NKp46 (Miltenyi, REA808, 114Cd), NKp44 (Miltenyi, REA1163, 116Cd). Antibodies used with the corresponding metal tag isotopes in vivo experiments include: CD45 (Biolegend, HI30, 89Y), CD2 (Biolegend, TS1/8, 141Pr), CD62L (BD Biosciences, DREG-56, 143Nd), CD27 (Biolegend, M-T271, 144Nd), CD56 (Biolegend, HCD56, 146Nd), NKG2C (RD, 134591, 147Sm), CXCR6 (RD, 56811, 148Nd), CXCR3 (RD, 49801, 149Sm), Granzyme B (RD, polyclonal, 150Nd), Tbet (Biolegend, 4B10, 151Eu), TIGIT (Biolegend, A15153G, 152Sm), Granzyme A (Biolegend, CB9, 154Sm), NKG2A (RD, 131411, 155Gd), TIM3 (Biolegend, F38-2E2, 156Gd), CD19 (Biolegend, HIB19, 157Gd), 2B4 (Biolegend, 2–69, 158Gd), CLA (Biolegend, KPL-1, 159Tb), CD20 (Biolegend, RIK-2, 160Gd), DNAM-1 (Miltenyi, DX11, 161Dy), EOMES (Thermo Fisher, WD1928, 162Dy), NKp30 (Biolegend, P30-15, 163Dy), c-Kit (BD, YB5.B8, 164Dy), CD25 (BD, 2A3, 165Ho), NKG2D (RD, 149810, 166Er), Perforin (BD, δG9, 167Er), ZAP70 (ThomoFisher, 1E7.2, 168Er), CCR5 (Biolegend, J418F1, 169Tm), CAR (Jackson immune research, polyclonal, 170Er), CX3CR1 (Bioledend, 2A9-1, 171Yb), CXCR1 (Biolegend, 8f1, 172Yb), PD1(Biolegend, EH12.2H7, 173Yb), Syk (Bioledend, 4D10.2, 174Yb), NKp46 (RD, 195314, 175Lu), KLRG1 (ThermoFisher, 13F12F2, 176Yb), CD57 (Biolegend, HNK-1, 194Pt), Cisplatin L/D (Fluidigm, 198Pt), CD16 (Fluidigm, 3G8, 209Bi).
Mass Cytometry data analysis
Mass cytometry data were analyzed using Cytobank. NK cell populations were identified by using the strategy of gating singlets in Pt195 (cisplatin)low hCD45+CD56+CD3−, and were applied to all files. CAR+ and CD19+ expression was determined based on either isotype control or NK cells culture alone as controls. Data from 10,000 identified NK cells per each in vitro sample were randomly subsampled in FlowJo. Normalized data from each sample were pooled and analyzed to acquire their variability in signals. A t-Distribution Stochastic Neighbor Embedding (t-SNE) map was generated by the t-SNE analysis that performed a pairwise comparison of cellular phenotypes to optimally plot clusters and reduce dimensions from multiple parameters. Subsequently, FlowSOM analysis was performed to determine metaclusters in optimized grouping distance between the empirically expected node and to build a minimum spanning tree by connecting nodes hierarchically. The expression of each marker was transformed and normalized locally, then hierarchically clustered, and plotted as a heatmap using Morpheus matrix visualization and analysis software (Broad Institute).
Metabolism assays
Extracellular acidification rate (ECAR) and oxygen consumption rate (OCR) were measured in GFP-negative CAR-NK effector cells using Seahorse XF Cell Mito Stress Test Kit (Agilent), and Seahorse XF Glycolysis Stress Test Kit (Agilent) in Agilent Seahorse XFe96 Analyzer according to the manufacturer’s protocol. The assay was performed in phenol red/carbonate free RPMI media (Agilent) containing 2 nM L-glutamine (Agilent), 25 mM glucose and 2 mM pyruvate (Agilent, but excluded in the glycolysis assay). Cell mito stress test was performed by examining OCRs after administering 1.5 μM oligomycin, 0.5 μM fluorocarbonyl cyanide phenylhydrazone (FCCP), 0.5 μM rotenone, and antimycin A. Glycolysis test was measured as the ECAR following injection with 10 mM glucose, 1 μM oligomycin, and 50mM 2-Deoxy-D-glucose (2-DG).
CAR-NK cell affinity experiment
Experiments were performed using Poly-L-Lysine (Sigma-Aldrich) coated z-Movi® chips. MM1SCD70+ cells were seeded onto z-Movi® chip, creating a monolayer. The z-Movi® chip was then sealed and incubated in a dry incubator for 30 minutes. Effector cells were stained with Cell Trace Far Red (ThermoFisher) and their flow measured onto the monolayer, 200–500 cells at a time. Effectors were then incubated with the target cell monolayer for five minutes before the start of the force ramp. Force ramp was set at 1000 pN over 90 seconds for each run. Affinity measurements were conducted on a z-Movi® Cell Avidity Analyzer using the Oceon software.
Luminex assays
The MILLIPLEX®MAP magnetic bead (Millipore) kit was used to measure human granzyme A, granzyme B, perforin, TNF-α, and IFN-γ in serum collected from mice at different time points after receiving NK cell infusion as per the manufacturer’s protocol. Measurements were performed on the Luminex 200 System.
Xenogeneic Tumor-grafted Mouse Models
NOD/SCID IL-2Rγnull (NSG) mice grafted with aggressive, NK-resistant tumor cells were used to examine the anti-tumor activity of different NK populations as previously described36,37. Tumor models included CD19+ Raji lymphoma, CD5+ CCRF T-ALL, CD123+ MOML14 acute myeloid leukemia (AML), and SKOV3 ovarian cancer. All experiments were performed in accordance with American Veterinary Medical Association (AVMA) and NIH recommendations under protocols approved by the MDACC Institutional Animal Care and Use Committee (protocol number 00000889-RN02). Mice were maintained under specific-pathogen-free conditions, with a 12 hr night/day cycle of light, and at stable ambient temperature with 40–70% relative humidity. Seven-week-old female NSG mice (Jackson Laboratories) were irradiated (300 cGy) on Day −1. On Day 0 firefly luciferase-GFP labeled Raji cells were injected intravenously (i.v.) at three escalating dose levels of Raji cells (0.2×10⁵, 1×10⁵, or 5×10⁵), respectively; for the other blood tumor models, one dose of CCRFCD5+/Luci+/GFP+ cells (0.5×10⁵), or MOML14CD123+/Luci+/GFP+ cells (0.5×10⁵) were injected i.v., respectively. The mice were then serially treated with the indicated NK cell populations. For ovarian cancer models, 7-week old female NSG mice (Jackson Laboratories) were injected intraperitoneally (i.p.) with luciferase-GFP labeled SKOV3 cells (1×10⁶ of SKOV3ROR1+ or 0.5×10⁶ of SKOV3gCD19+) seven days (Day −7) before the treatment; at Day −1 the mice were irradiated (300 cGy), and then received AI-CAR expressing NK cells (1–1.5×10⁷) via i.p. injection on Day 0. Bioluminescence imaging (Xenogen-IVIS 200 Imaging system; Caliper) was performed regularly to examine the engraftment of Raji cells and SKOV3 cells. Signal quantitation in photons/second was measured using IVIS Living Image software (Caliper Life Sciences). H&E and immunohistochemistry staining (IHC) were performed on formalin-fixed paraffin-embedded (FFPE) tumour tissue sections. The tumour tissues were fixed in 10% formalin, embedded in paraffin, and serially sectioned. Four-micrometer sections were used for the histopathological studies, images were analyzed by ImageJ.
Statistics
Statistical analyses were performed and plotted using Prism 7 software (GraphPad). The Student’s t-test was used to test for significance; one-way ANOVA was applied to determine the comparison among groups at a certain condition; two-way ANOVA was applied to determine the comparison among groups in a time course; P value for pairwise comparisons was conservatively adjusted for multiple comparisons using Bonferroni correction. Mean values + s.e.m. are shown. The non-linear regression model with the least trimmed sum of squares was selected as the robust goodness-of-fit70. Overall survival (OS) analysis was calculated using Kaplan-Meier methods and compared to the treatment group using Log-rank tests with 95% confidence intervals (CI).
Extended Data
Extended Data Fig. 1. CAR-mediated CD19 trogocytosis on NK cells in vitro.
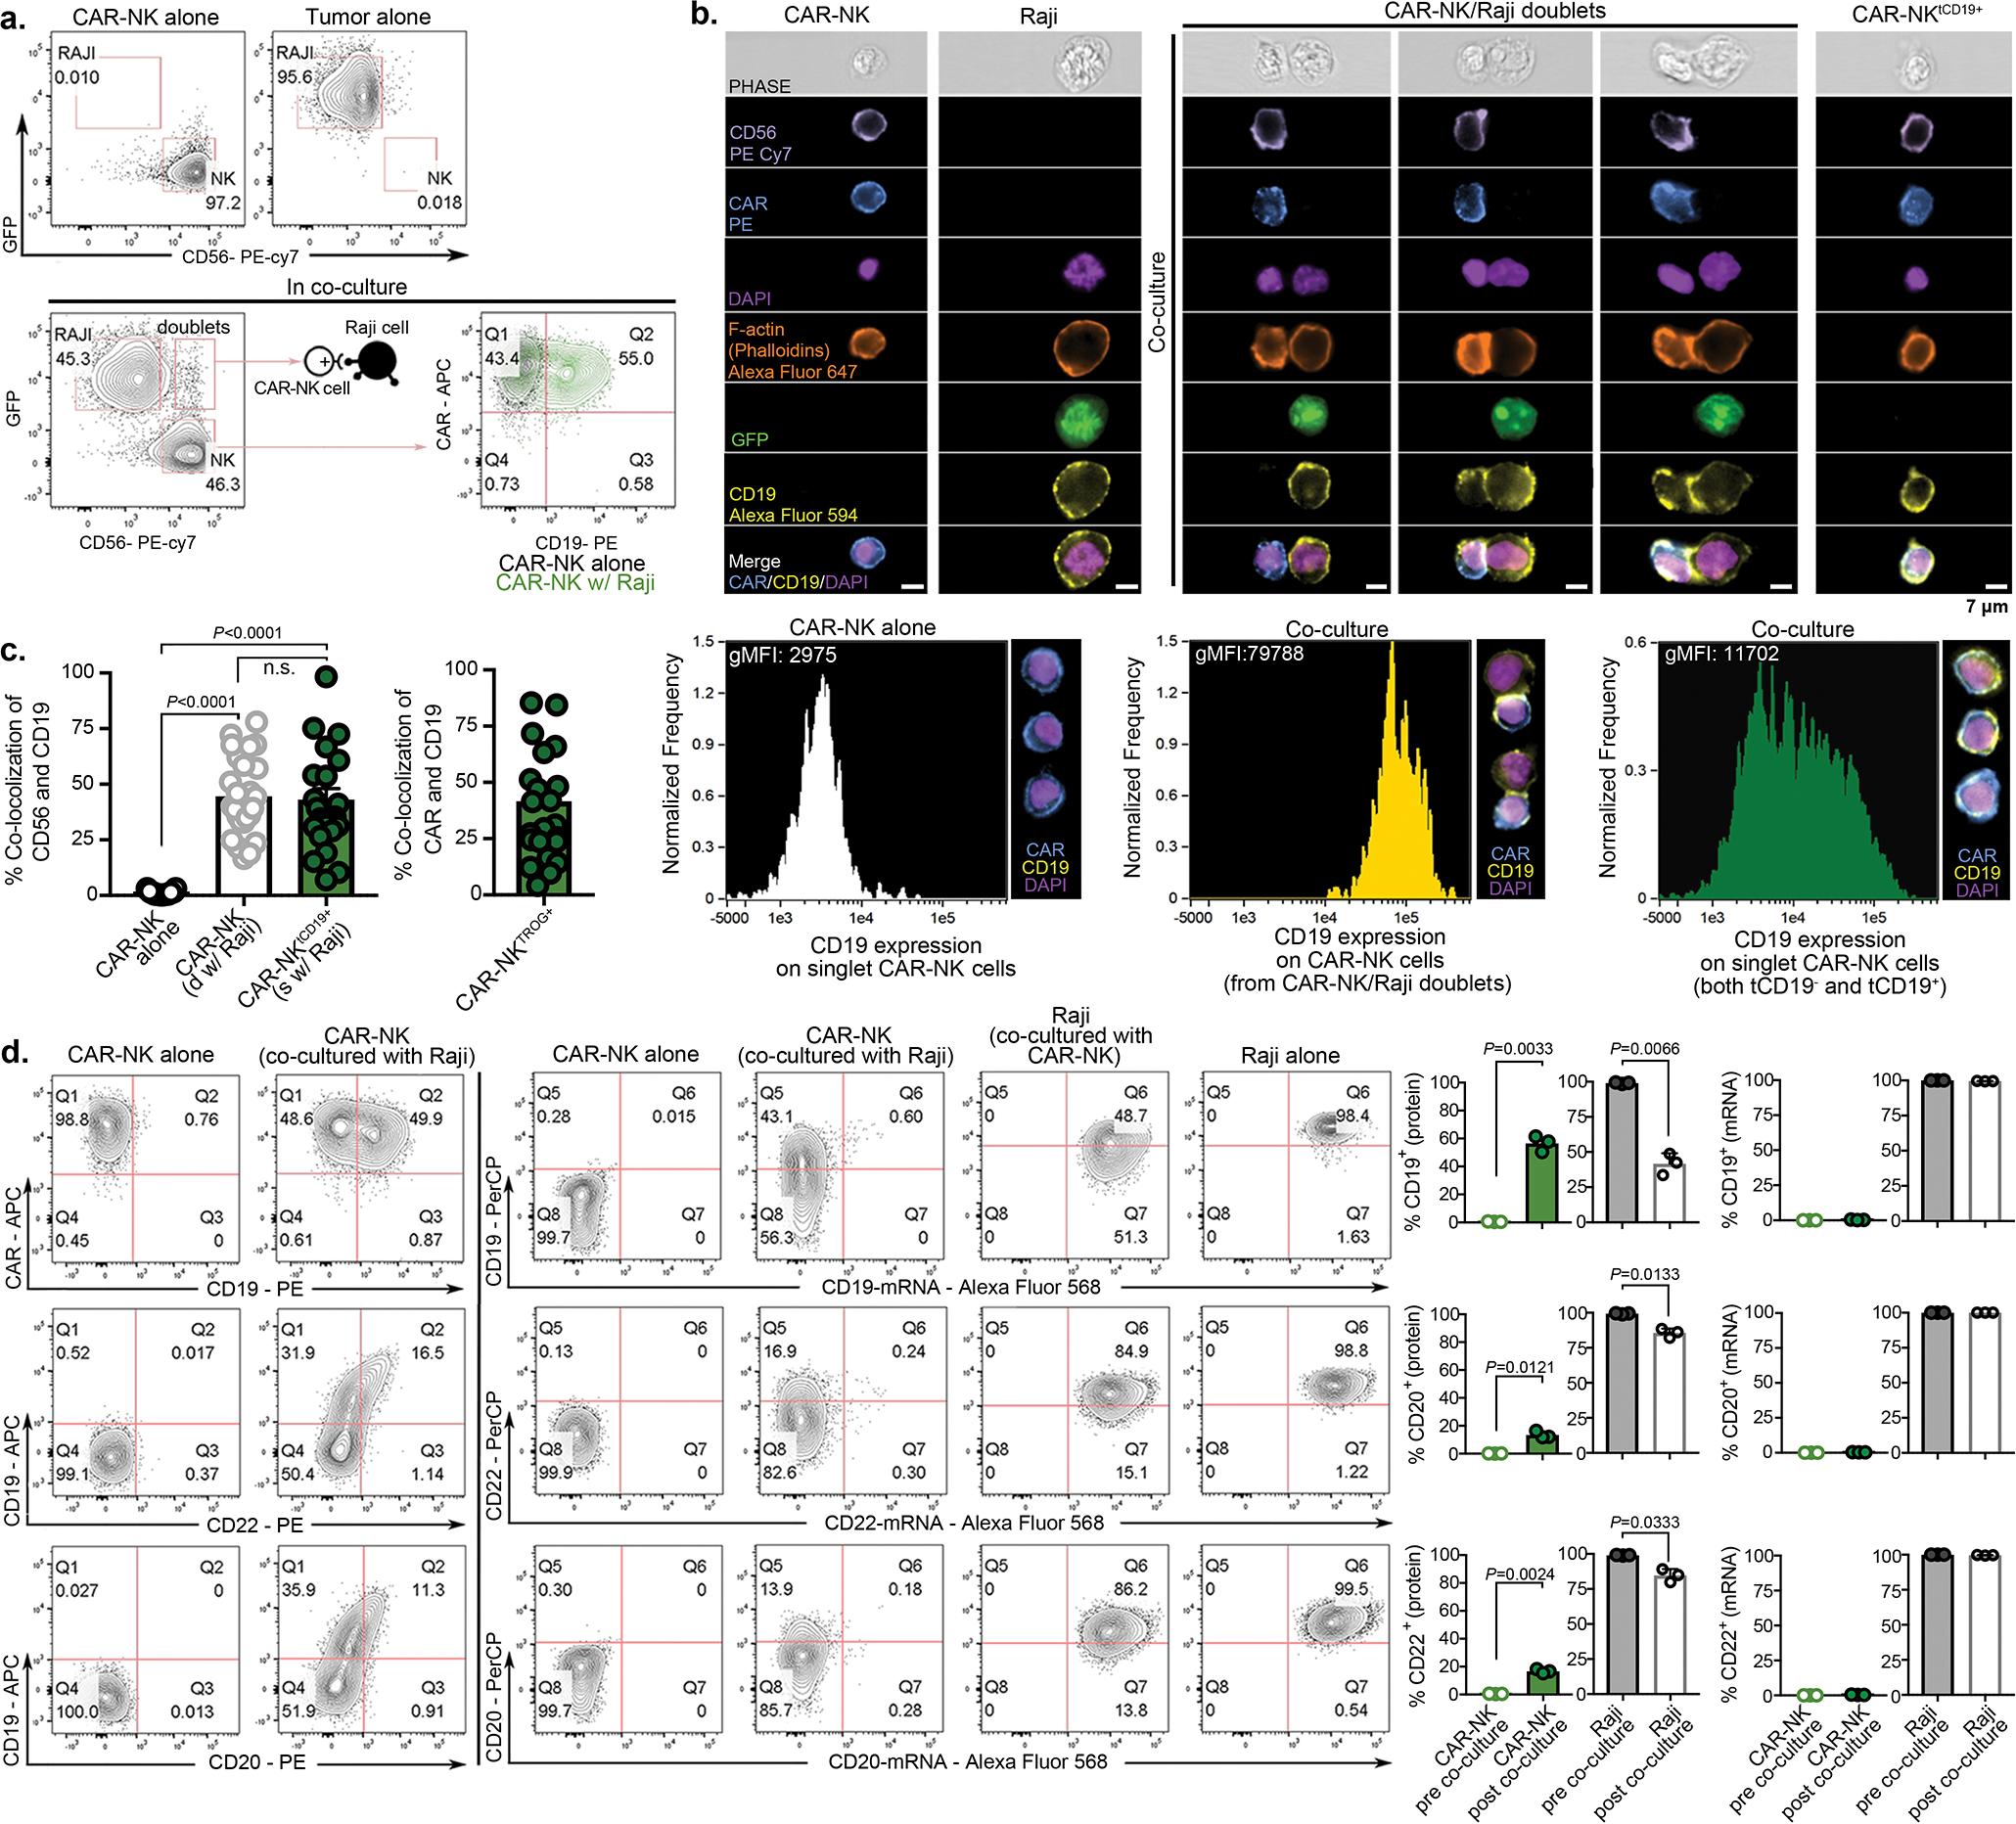
(a) Gating strategy to distinguish NK cells and Raji cells in co-culture experiments. Expression of GFP/CD56/CAR was used to identify CAR-NK cells (GFP−CD56+CAR+), Raji cells genetically modified to express GFP (CD19+GFP+CD56−CAR−), and CAR-NK/Raji doublets (CD19+GFP+CD56+CAR+). Expression of CD19 on CAR-NK cells after co-culture with Raji cells was compared to that of control CAR-NK cells cultured alone. Inset numbers indicate the percentage (%) of cells within the indicated gated regions. (b) Representative Amnis® images showing surface protein expression of CD56/CAR/CD19, and intracellular expression of F-actin/GFP in CAR-NK cells cultured alone, Raji cells cultured alone, or CAR-NK/Raji doublets (CAR-NK cell engaged with Raji cell). Cells were identified by DAPI nuclear stain; scale bar indicates 7 μm. Representative images show trogocytic CD19 (tCD19) expression on CAR-NK cells following engagement with Raji targets, as assessed by Amnis® imaging flow cytometry. Data are shown for singlet CAR-NK cells cultured alone (negative control), CAR-NK cells engaged with Raji cells (d: CAR-NK/Raji doublet), or singlet CAR-NK cells after 5 min co-culture with Raji cells. The geometric mean fluorescent intensity (gMFI) of CD19 was indicated for each condition (lower panels). Inserted image shows representative cells for each culture condition. (c) Amnis® imaging showing the % of tCD19 expression on singlet CD56+ CAR-NK cells cultured alone, CAR-NK cells engaged with Raji cells, or the tCD19+ fractions of singlet CAR-NK cells after 5 min co-culture with Raji cells (left); and % of co-localized tCD19 and CAR molecules on singlet NK cells (right; n=25 objects). (d) Flow cytometric analyses show expression of CD19/CD20/CD22 at the protein level (left) and the mRNA level (middle) in CAR-NK cells cultured alone, Raji cells cultured alone, and CAR-NK cells co-cultured with Raji cells for 5 mins (representative of 3 donors). Inset numbers indicate percentages of cells within the indicated gated regions. Bar graphs show the summary data for each marker (right).
P values were determined by two-tailed Student’s t-test in panel c, or two-tailed Student’s paired t test in panel d. Data were shown by mean + s.e.m. Each circle represents an individual cell.
Extended Data Fig. 2. CAR19-mediated acquisition of tCD19 on NK cells from targeted Raji cells was associated with decreased anti-tumor cytotoxicity.
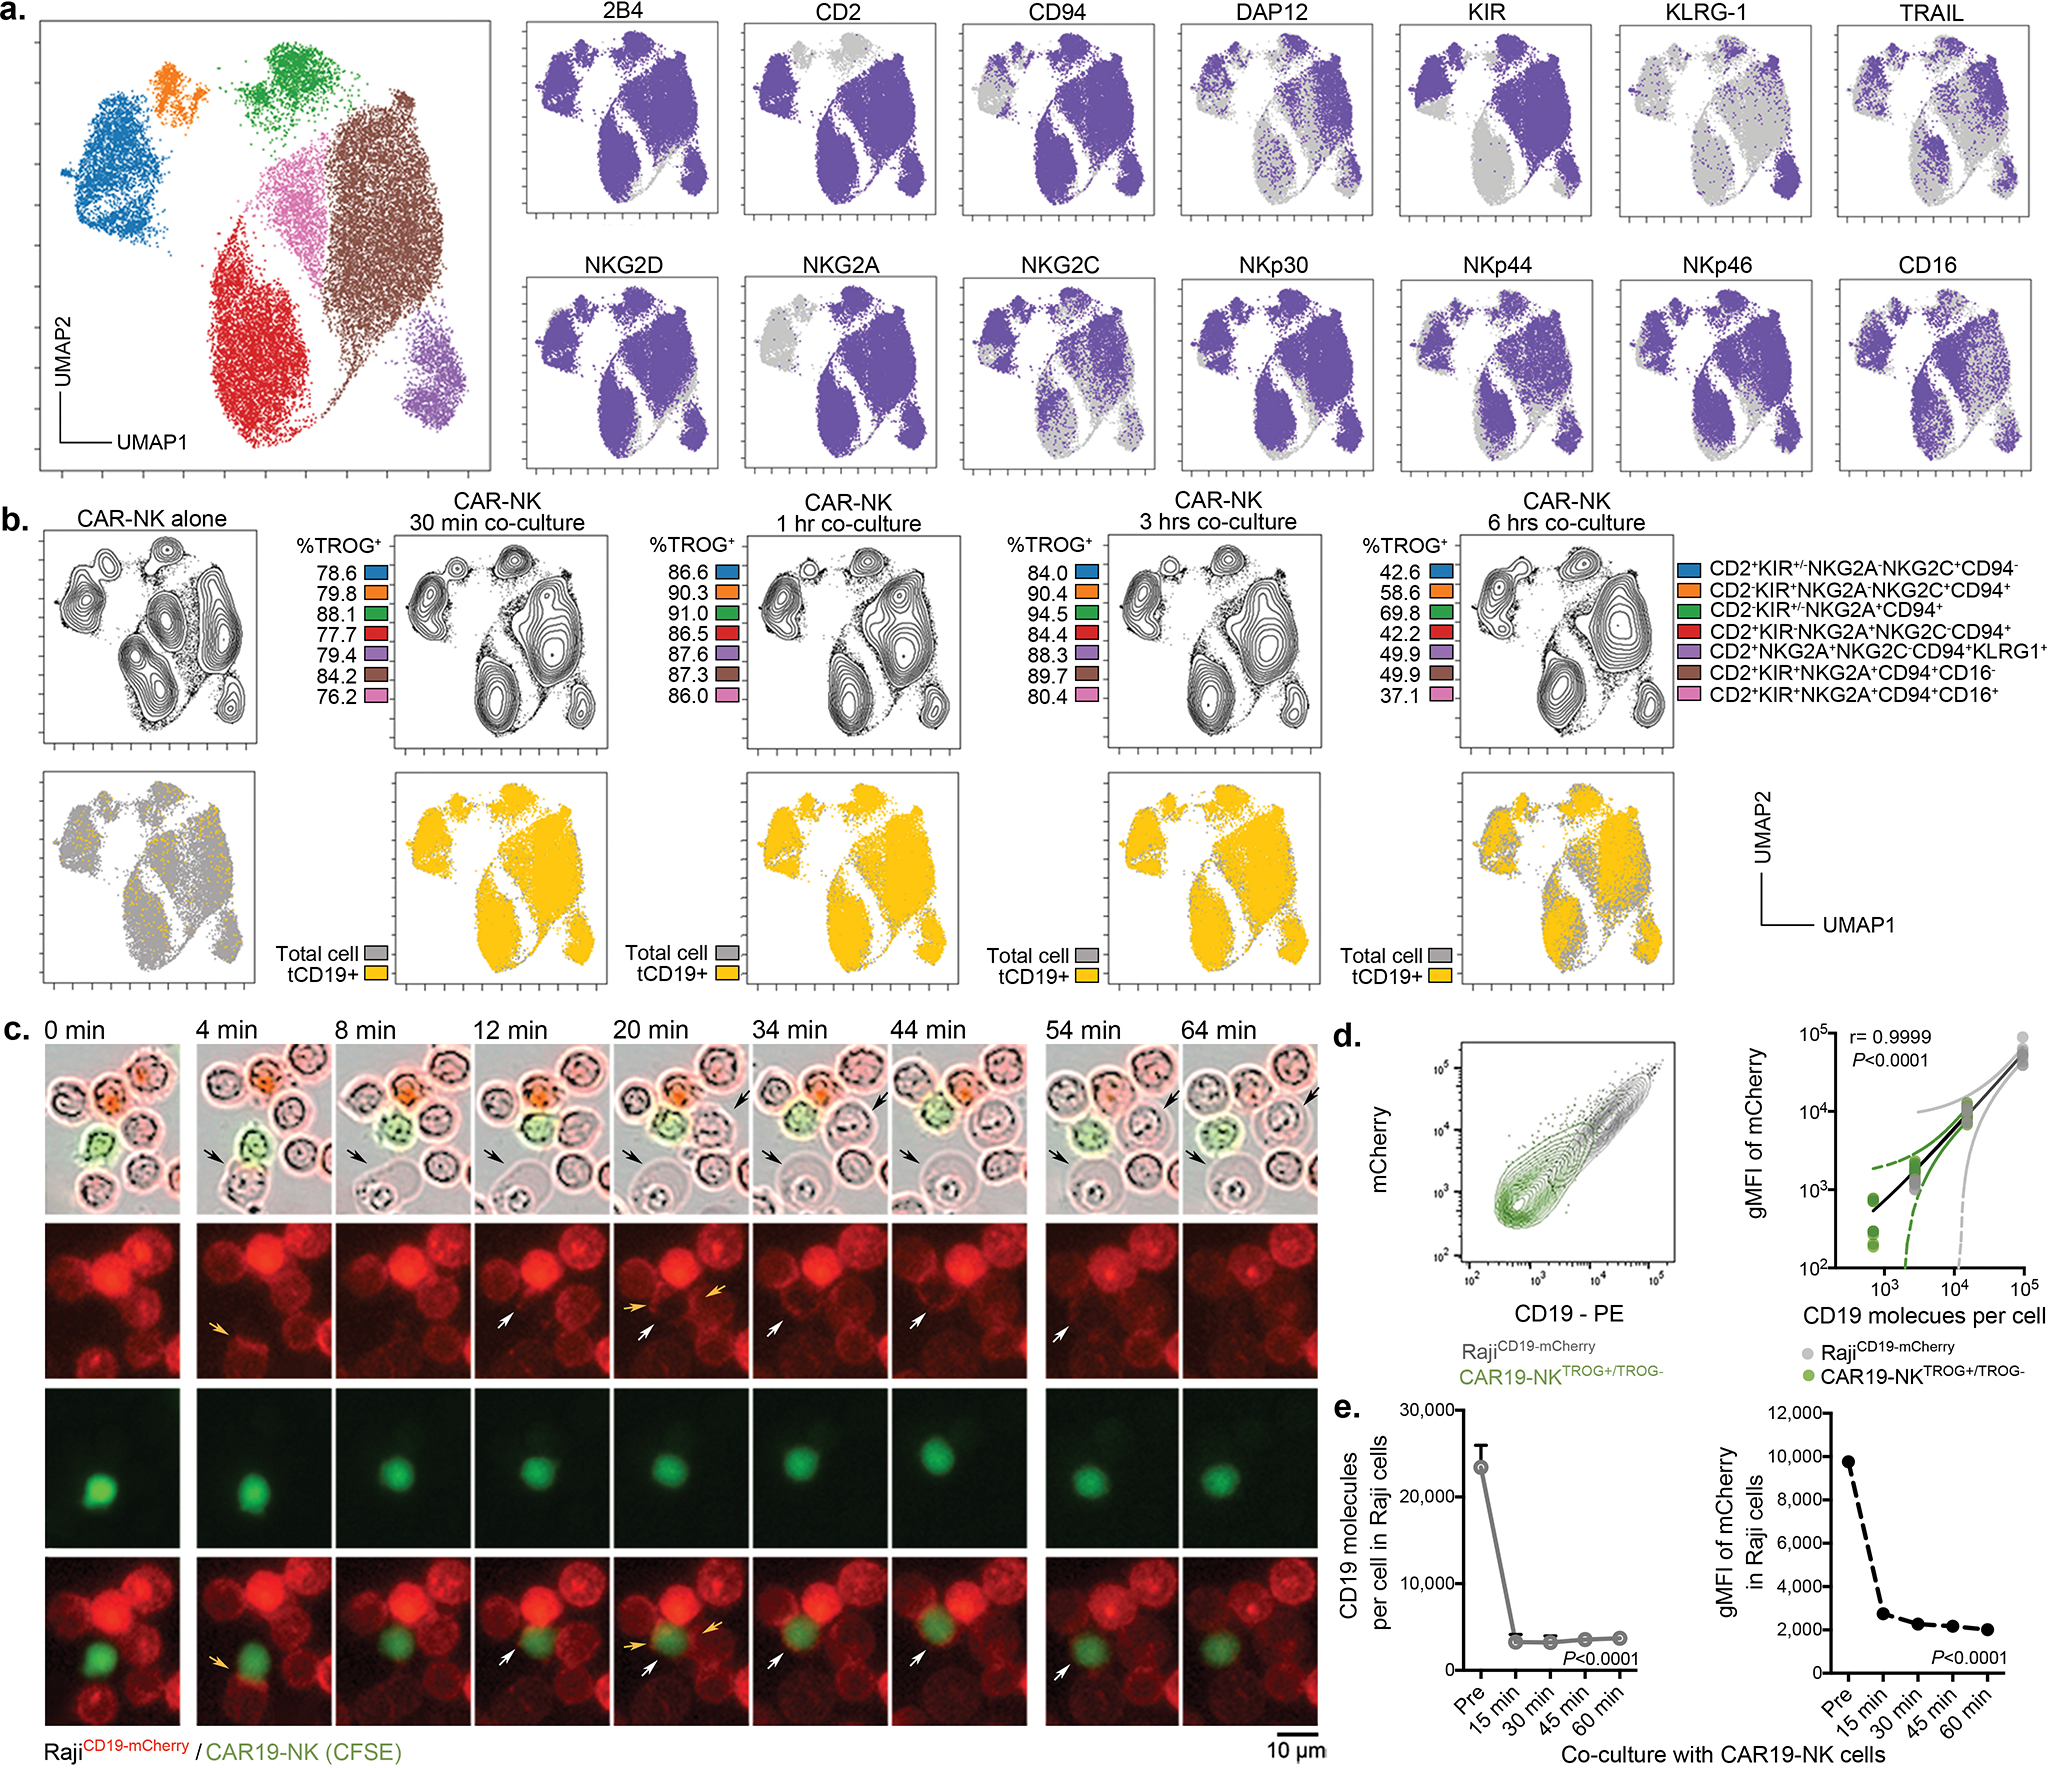
(a) UMAP analyses of CAR-NK cells collected after co-culture with RajiCD19+ cells. Phenotypic signatures of all collected CAR-NK cells were evaluated by mass cytometry, and data from 10,000 cells derived from 3 donors were merged to create a single UMAP map, where the analysis generated eight distinct color-coded clusters that represented the different subsets of NK cells. Marker expression for each NK cell subset was shown in UMAP plots. (b) Contour plots showing the UMAP cluster prevalence of CAR-NK cells alone, 30 min, 1 hr, 3 hrs, or 6 hrs after co-culture with Raji cells. The percentage of TROG+ CAR-NK cells (upper panel), and tCD19 expression are presented for each subset for the different conditions (lower panel). (c) Real-time images representing the co-culture of CAR19-NK cells (green) with RajiCD19-mCherry cells (red). Black arrows indicate events of cell apoptosis; yellow arrows indicate the immunologic synapse-like structure; white arrows indicate CAR19-NK cells with evidence of mCherry transfer; scale bar indicates 10 μm. (d) Flow cytometric analyses represent co-expression of CD19 and mCherry on singlet RajiCD19-mCherry cells cultured either alone (grey, representative for 3 samples) or CAR19-NK cells after co-culture with RajiCD19-mCherry cells for 5 mins only (green, representative for 5 donors); the following graph shows the correlation between mCherry (as determined as gMFI) and CD19 (as determined as the number of molecules per cell) for each singlet cell. (e) CD19 (as determined as the number of molecules per cell), and gMFI of mCherry expression on singlet RajiCD19-mCherry cells at different time points during co-culture with CAR19-NK cells (n=3 donors).
P values were determined by two-tailed Pearson’s correlation coefficient in panel d, two-tailed one-way ANOVA in panel e. Data were assessed by flow cytometry in panels d and e, and shown by mean + s.e.m.
Extended Data Fig. 3. Self-engagement of TROG+ CAR-NK cells resulted in NK cell fratricide.

(a and b) Schematic illustrating the single-cell time-lapse imaging cytotoxicity assay. Time was recorded over 5 hours (T0 –T300min) from the start of co-culture, (a) where one single cell, or (b) two cells of non-TROG-antigen expressing fresh CAR-NK cells (control; grey) or CAR-NKTROG+ cells (green) were incubated in each nanowell. For the duration of the assay, the amount of time taken to detect Annexin V influx in the sorted CAR-NK cell was determined as the time taken to induce cell apoptosis. The following Kaplan-Meier curves show the percent (%) of apoptosis in CAR-NK cells during incubation. (c) Schematic representation of the experimental plan: TROG+ CAR19-NK cells were purified, and their phenotypic signature were evaluated before and 5 hrs post-culture by mass cytometry. Data from 10,000 cells from 3 donors per condition were merged to create a single UMAP map with eight distinct color-coded clusters that represented the different subsets of CAR-NK cells. Marker expression for each NK cell subset is shown. (d) UMAP plots showing the expression of TROG-antigen (tCD19; left) on CAR-NK cells before and after 5 hrs of culture with their sibling cells; the contour plots show the prevalence of each CAR-NK cell subset before and after 5 hrs of culture, with the percentage of each subset also indicated (right).
P value was determined by Log-rank test in panels a,b.
Extended Data Fig. 4. Repeated challenge of CAR19-NK cells with autoNKCD19+ cells result in CAR-NK cell hyporesponsiveness.
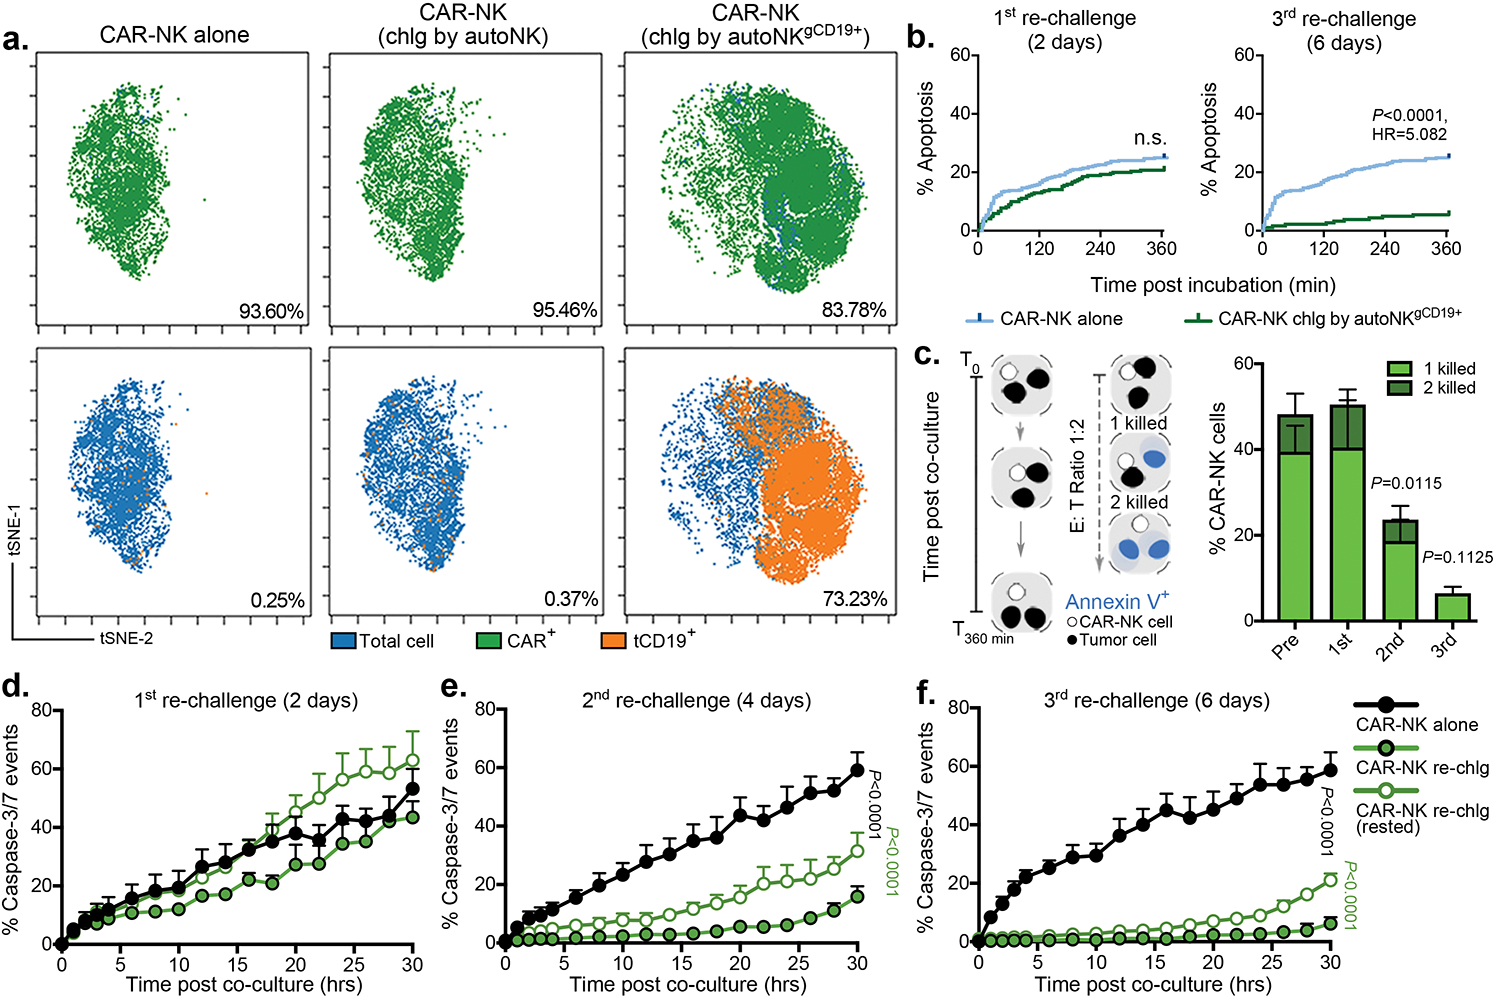
(a) tSNE analysis of live hCD45+GFP−CD56+CD3− CAR19-NK cells 4 days following a second round of antigen challenge with autoNKgCD19+gGFP+ cells; controls include CAR19-NK cells cultured alone or co-cultured with autoNKgGFP+ cells for 4 days (lacking CD19 expression). The phenotypic cell signature was evaluated by CyTOF and merged to create a single t-SNE map (10,000 cells from 3 pooled donors per condition). Expression of CAR19 (green) and tCD19 (orange) is determined against NT-NK cell controls. Insert numbers indicate the percentages (%) of CAR and tCD19 expression on CAR19-NK cells. (b) Kaplan-Meier plots showing the percentage (%) of apoptotic Raji cells following co-culture with CAR-NK cell isolated after the 1st round (2 days, left) or 3rd round (6 days, right) of re-challenge with autoNKgCD19+/GFP+ cells compared to fresh CAR-NK cells. Assays were performed in microwells with E:T ratio of 1:1; data were pooled from two donors. (c) Schematic representation of single-cell time-lapse imaging cytotoxicity assay, where a single CAR-NK cell was cultured with two Raji cells. Annexin V influx in Raji cells defined cell apoptosis. The bar plots show the percentage of CAR-NK cells isolated at different time points after re-challenge with autoNKgCD19+/GFP+ cells that succeeded in lysing one (light green) or two (dark green) Raji cells. Fresh CAR-NK cells (pre) were used as control (n= 4 donors for pre, 3 donors for 2nd, and 2 donors for 1st and 3rd challenge). (d-f) Incucyte analyses showing the percentage (%) of caspase 3/7 events in Raji cells co-cultured with CAR19-NK cells isolated after (d) the 1st round, (e) 2nd round, or (f) 3rd round of re-challenge with autoNKgCD19+/GFP+ cells. CAR-NK cells isolated after each round of re-challenge and cultured for 24 hrs in complete media supplemented with 100 U/mL IL-2 (referred to as ‘rested’ cells) were used as controls (representative of 3 donors).
P values were determined by Log-rank test in panel b, two-tailed Student’s paired t test in panel c, or two-tailed two-way ANOVA in panels d,e,f, n.s.: not significant. Data were shown by mean + s.e.m.
Extended Data Fig. 5. CAR19-NK cell trogocytosis and reciprocal reduction in CD19 antigen expression on tumor cells in vivo.
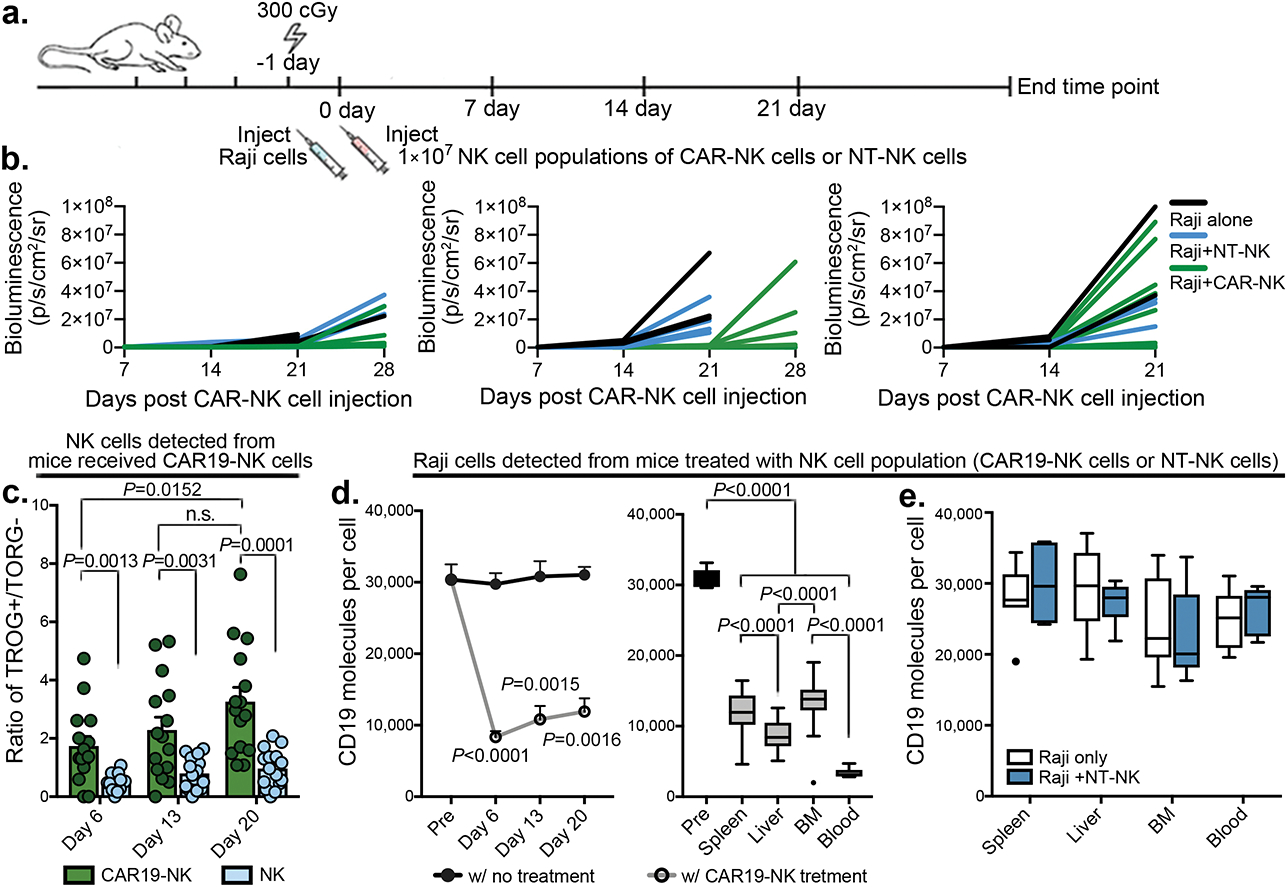
(a) Schematic illustration of timeline using a mouse model engrafted with Raji cells. Mice received three dose levels of Luc/GFP-expressing CD19+ Raji cells (0.2×10⁵, 1×10⁵, or 5×10⁵), respectively, followed by a single infusion of CAR19-NK cells (1×10⁷) or NT-NK cells alone (1×10⁷) as control, (b) Graphs showing the intensity of bioluminescence imaging (BLI) over time; black: Raji cells only; blue: Raji cells with NT-NK cell infusion; green: Raji cells with CAR19-NK cell infusion. (b) tCD19 expression (indicated as TROG+/TROG− ratio) on singlet hCD45+GFP−CD56+CD3− on CAR-NK cell products gated on CAR19-expressing (green) vs. CAR-negative fractions (light blue) in peripheral blood samples collected at different time points after infusion (n=15 mice). (c) CD19 expression on Raji cells, shown as the count of molecules per cell (grey) in peripheral blood (left, n=15 mice), and organs [spleen, liver, bone marrow (BM), and blood] of mice at the end time point (right, n=24 mice) after CAR19-NK cell infusion. (d) CD19 expression on Raji cells, shown as the count of molecules per cell in organs harvested at the end time point after NT-NK cell infusion (n=10 mice).
P values were determined by two-tailed Student’s t test for analyses, and two-tailed one-way ANOVA in panel d. Data were assessed by flow cytometry in samples with cell objects of interest >20 counts, and shown by mean + s.e.m, or medium (min/max) in boxplot. Each circle represents an individual mouse sample and outliers are indicated as dark dots.
Extended Data Fig. 6. In vivo trogocytosis was associated with limited persistence of CAR-NK cells.
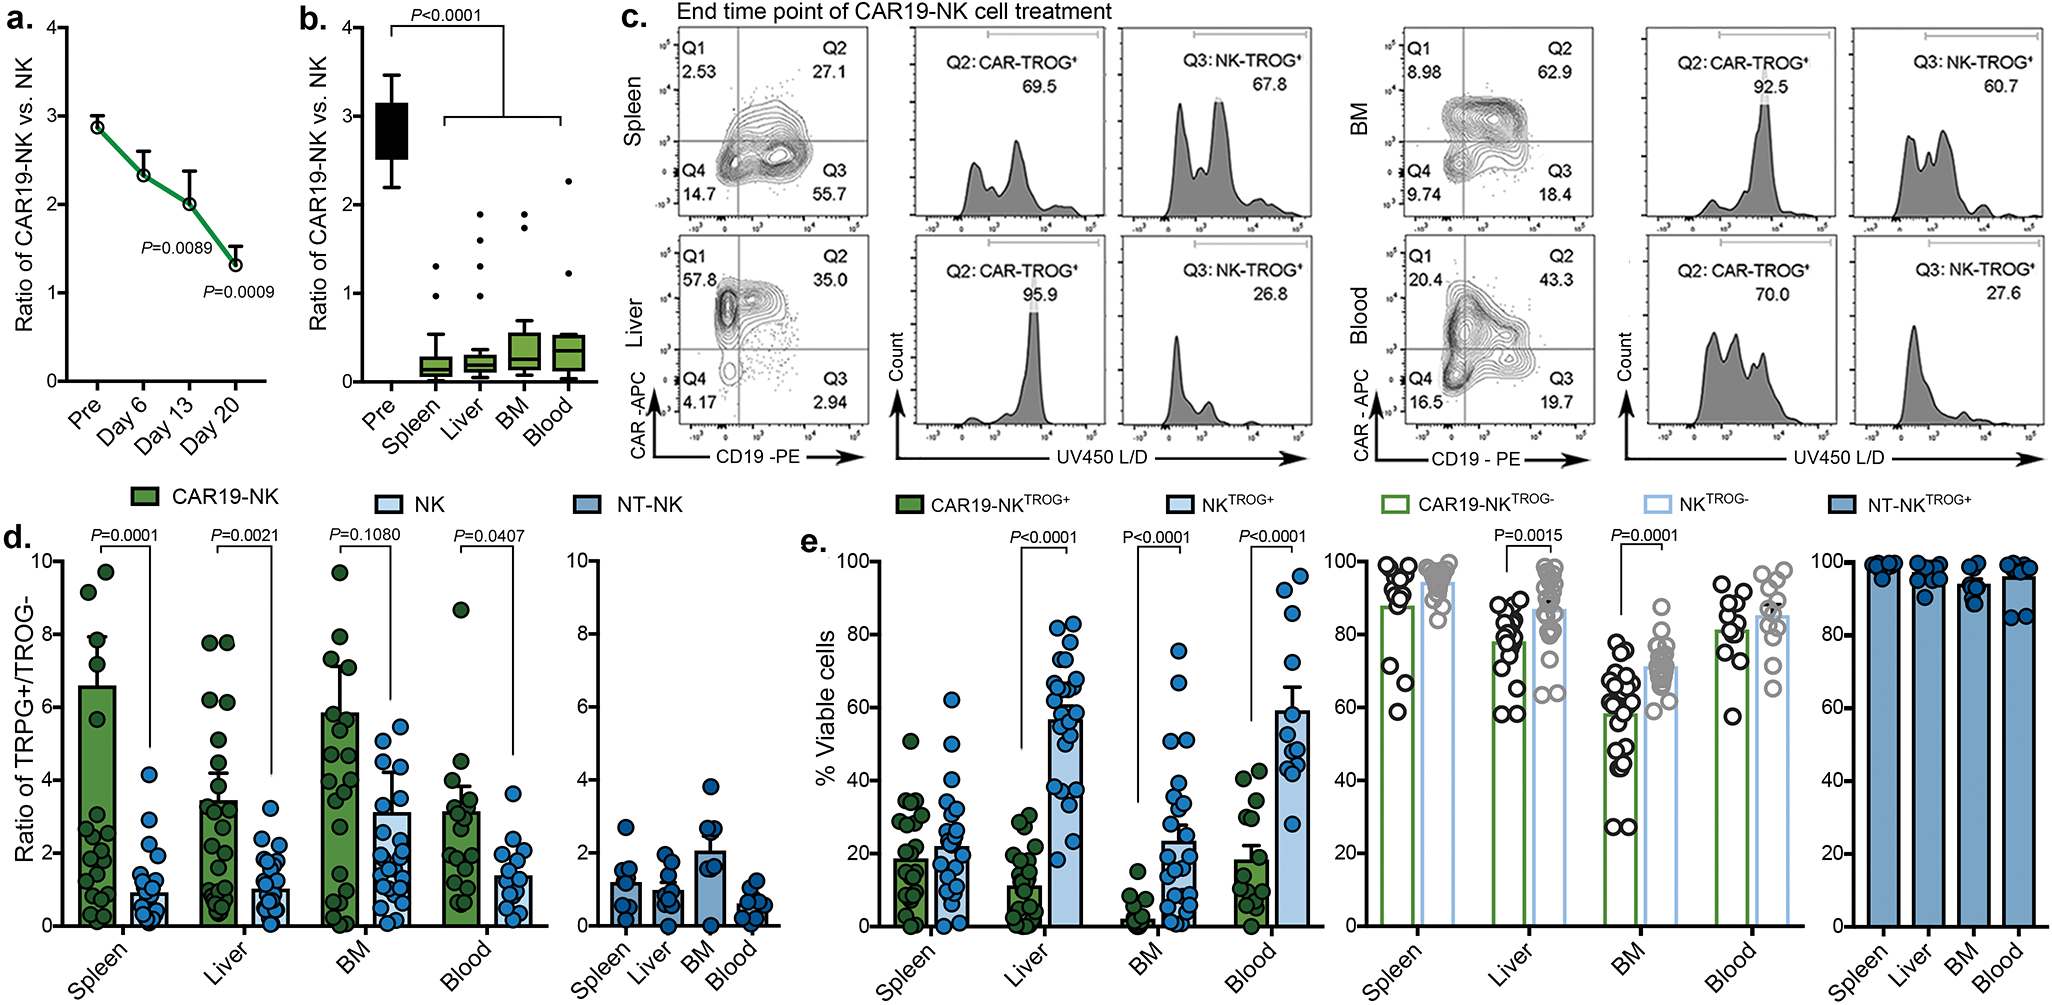
(a-b) The proportion of CAR19-expressing vs. CAR-negative live NK cells (a) in the peripheral blood of mice at different time points after CAR-NK cell infusion (left, n=15 mice), and (b) in different organs at the end time point (right, n=24 mice). (c) tCD19 expression on NK cells in the CAR19-expressing vs. the CAR-negative NK cell fractions and their viability based on TROG-positivity (Q2: CAR19-NKTROG+, Q3: CAR-negative NKTROG+) in cells harvested from different organs collected at the end time point (representative of n=24 mice). Inset numbers indicate the percentages of cells within the indicated gated regions. (d) tCD19 expression (indicated as TROG+/TROG− ratio) on singlet hCD45+GFP−CD56+CD3− CAR19-NK vs. CAR-negative NK cells harvested from organs at the end time point after CAR-NK cell infusion (left, n=24 mice) and in mice treated with NT-NK cells alone (right: dark blue, n=10 mice). (e) Percentage (%) of viable NKTROG+ (tCD19+, left) and viable NKTROG− cells (middle) for CAR19-NK cells vs. CAR-negative NK cells harvested from organs at the end time point after infusion of CAR-NK cells (n=24 mice), or in mice treated with NT-NK cells (right: dark blue, n=10 mice).
P values were determined by two-tailed Student’s paired t test in panel a, two-tailed one-way ANOVA in panel b, two-tailed Student’s t test in panels d and e. Data were assessed by flow cytometry in samples with cell objects of interest >20 counts, and shown by mean + s.e.m, or medium (min/max) in boxplot. Each circle represents an individual mouse sample, and outliers were indicated as dark dots.
Extended Data Fig. 7. In vivo trogocytosis was associated with poor viability of CAR-NK cells.
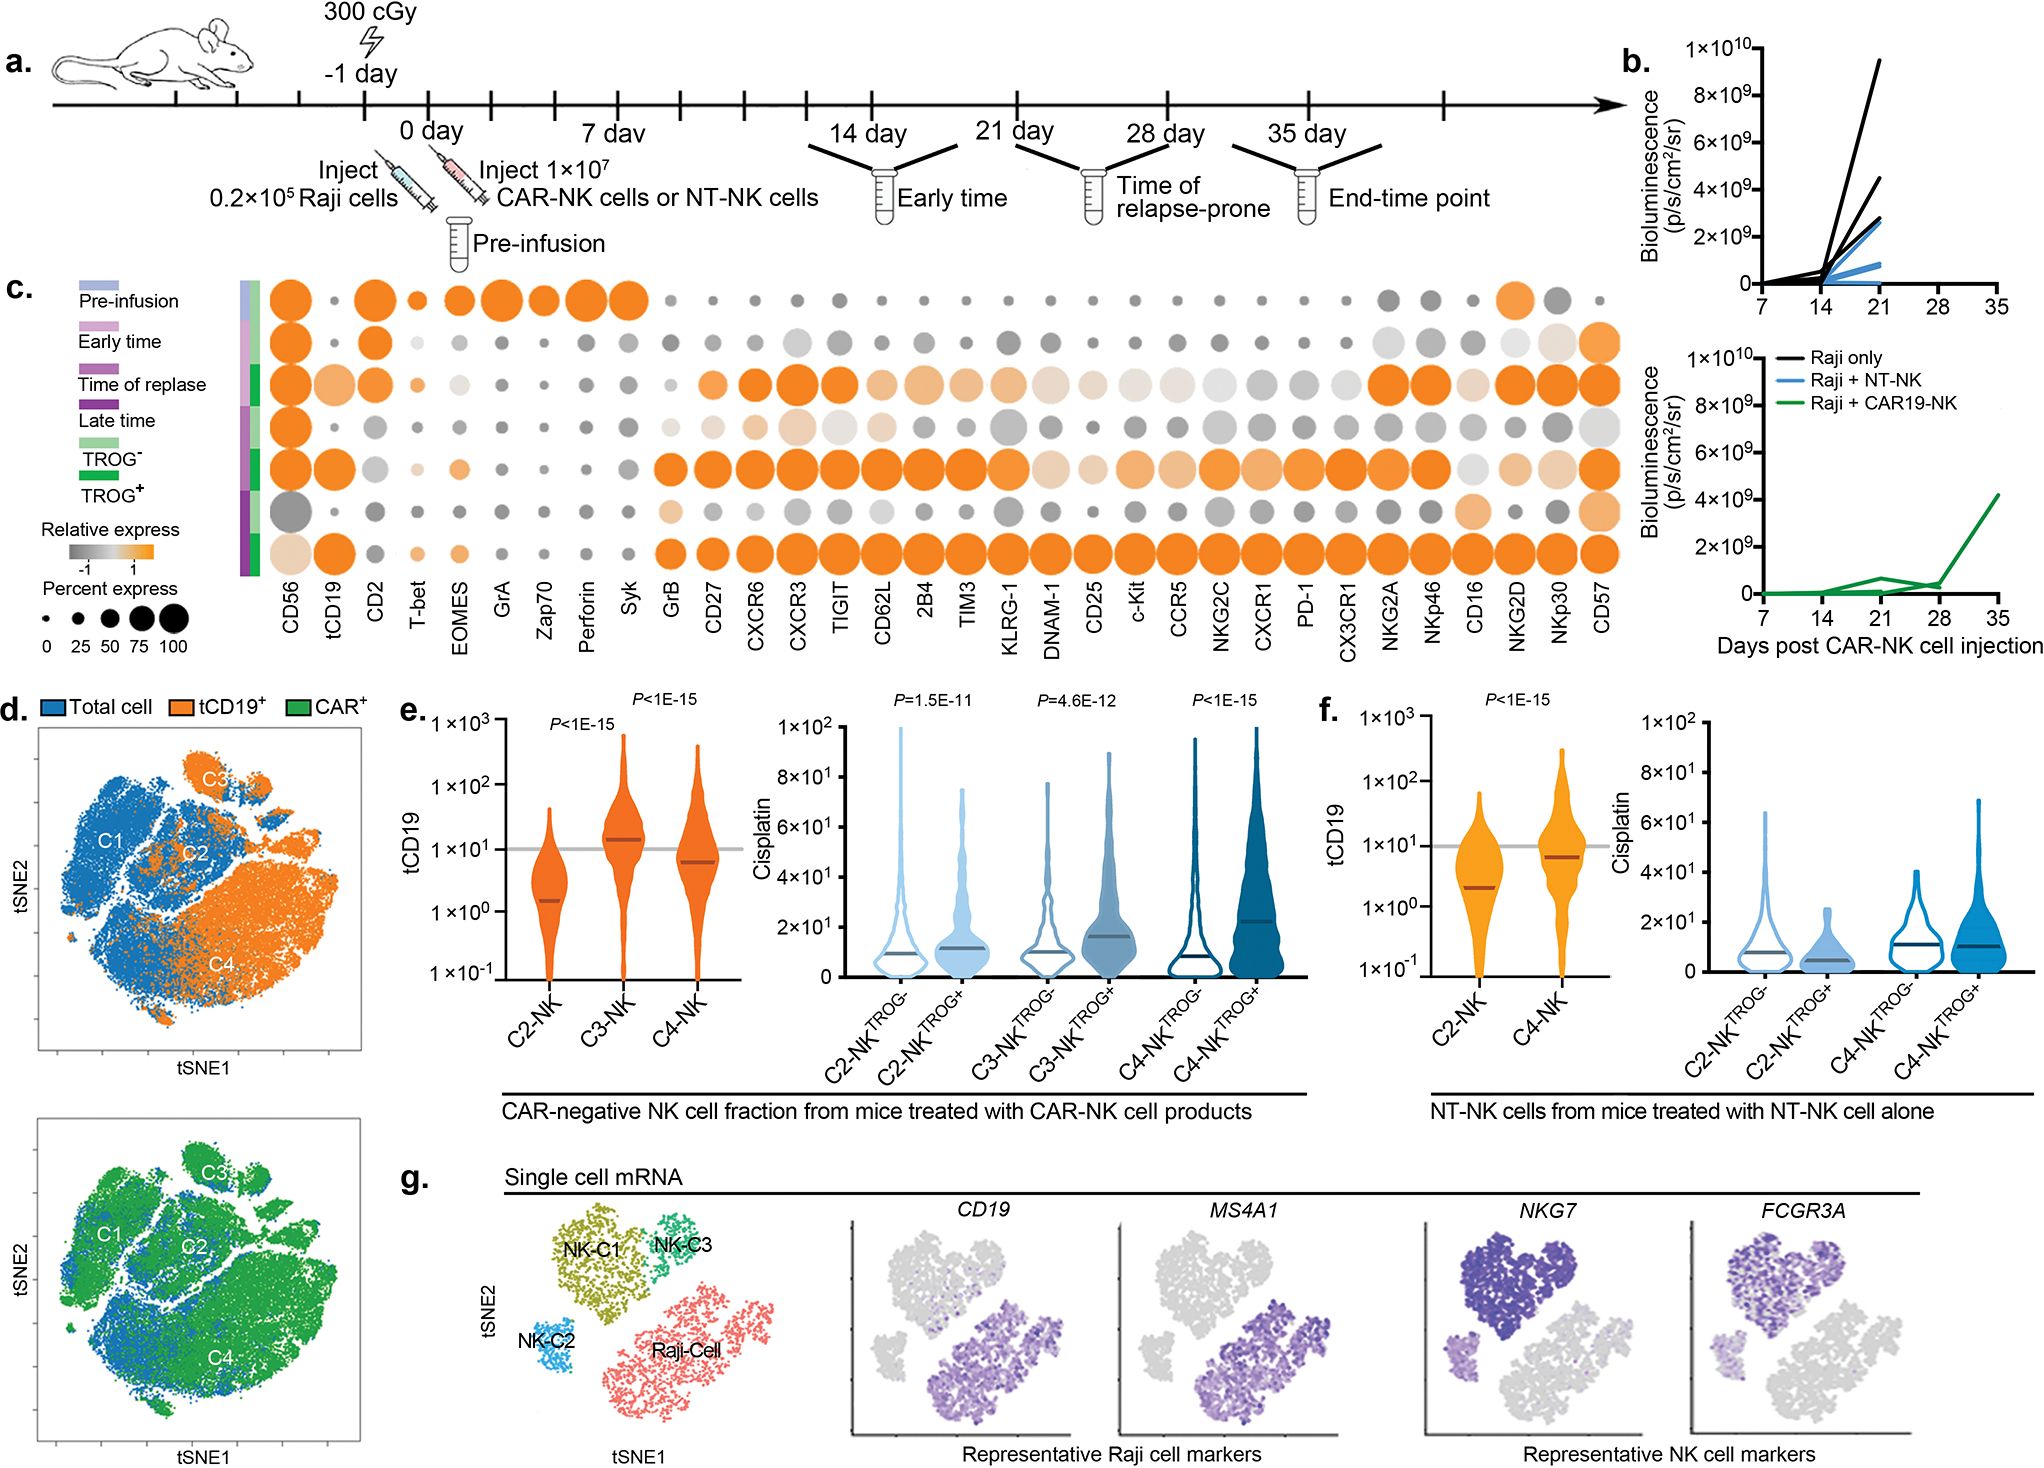
(a) Schematic illustration of the timeline using a mouse model of lymphoma, engrafted with 0.2×10⁵ luc/GFP-expressing CD19+ Raji cells and treated with a single infusion of CAR19-NK cells or NT-NK cells as control. Blood, BM, spleen and liver were harvested for analysis at two weeks (day 13–15), three to four weeks (day 20–27), or at the end time point (day 29–34) after infusion. (b) Tumor burden was assessed weekly by BLI. The BLI intensity is shown for each mouse after infusion with CAR-NK cells (green) or NT-NK cells (blue). Untreated mice were used as controls (black). (c) Heatmap showing expression levels of phenotypic and functional markers on fractions of TROG+ (tCD19+) and TROG− live hCD45+GFP−CD56+CD3− NK cells at different timepoints post-infusion. The expression level for each marker is represented by the color grey (low) - orange (high) and the size. (d) The phenotypic cell signature for each condition was evaluated by mass cytometry and merged to create a single t-SNE map. Expression of tCD19 (orange) and CAR19 (green) on hCD45+GFP−CD56+CD3− NK cells was determined based on their expression on NT-NK cell controls. (e) Violin plots showing expression of tCD19 on NK cells within each cluster harvested from mice treated with CAR19-NK cells (left); cisplatin levels within the TROG+ vs. TROG− fractions for each cluster (right) are shown. (f) Violin plots showing expression of tCD19 on NT-NK cells within each cluster (left); cisplatin levels within the TROG+ vs. TROG− fractions for each cluster (right) are shown. (g) Gene signature for total hCD45+ cells at different time points during the treatment course. The t-SNE maps, generated with the Seurat package in R, show color-coded expression levels for CD19 and MS4A1 (Raji cells), NKG7 and FCGR3A (NK cells) for each cluster.
P values were determined by two-tailed Wilcoxon matched pairs test in panels e and f. Data were assessed by mass cytometry and shown in violin graph with the indicated median.
Extended Data Fig. 8. iCAR design, expression and impact on primary human NK cell signaling and function.
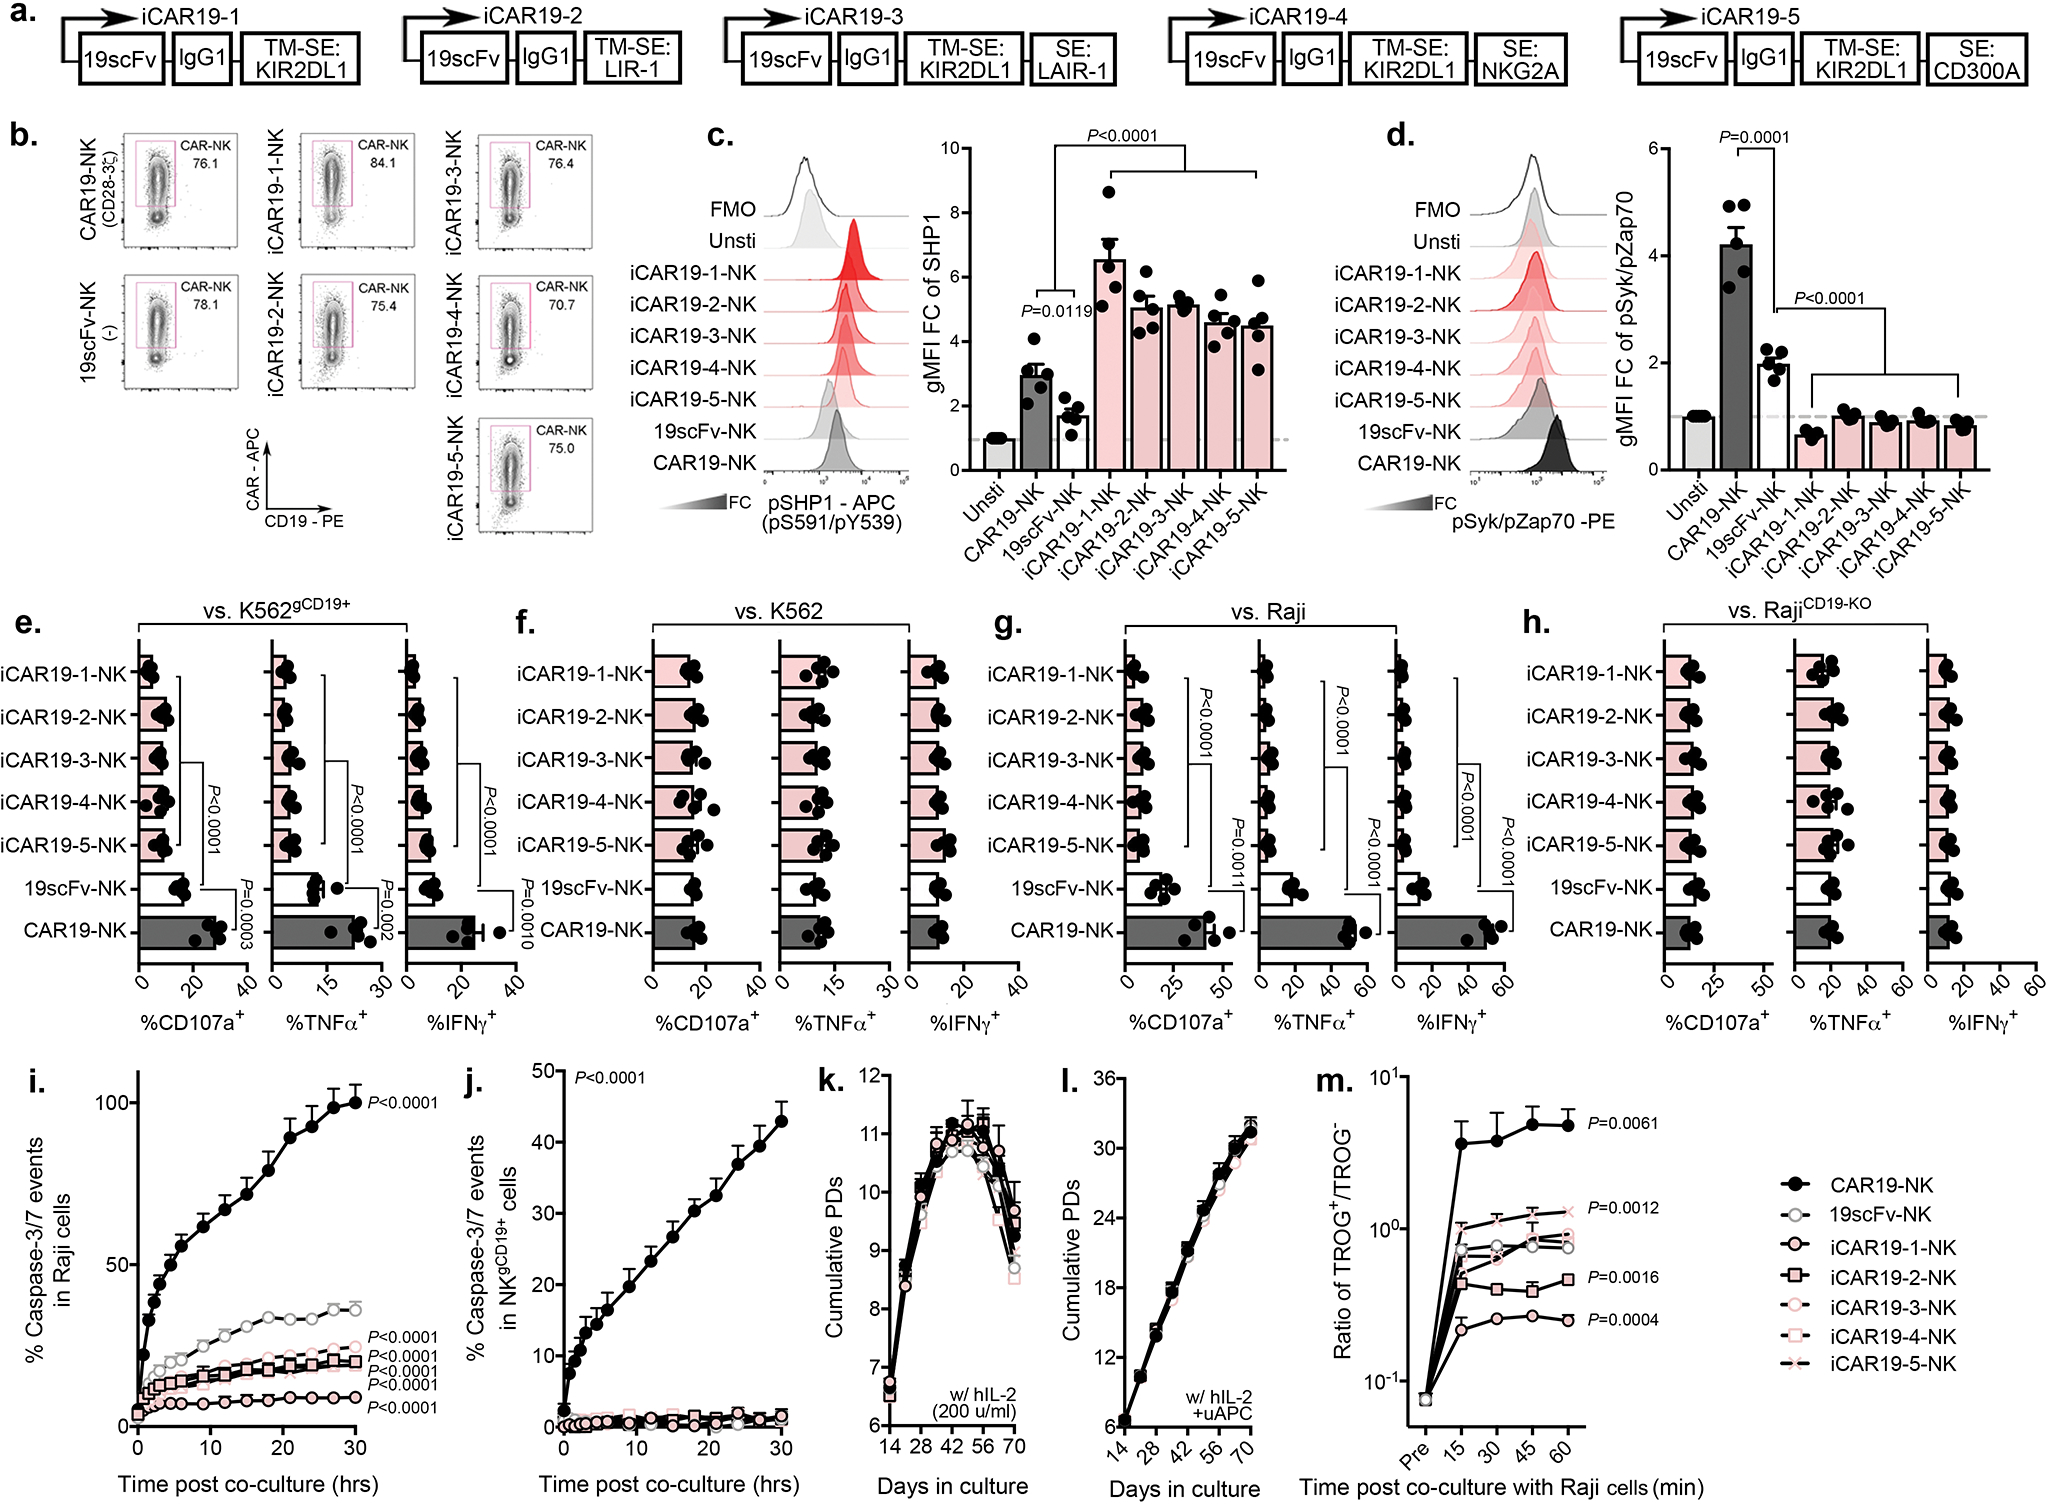
(a) Schematic diagram of the viral vector design for the different anti-CD19 iCARs; TM: transmembrane; SE: signaling endodomain. (b) Cell surface expression of aCAR19, 19scFv, or iCAR19 constructs by flow cytometry in transduced primary human NK cells. Dot plots are representative of three different donors. Inset numbers indicate the percentage of CAR-expressing cells within the indicated gated regions. (c and d) Flow cytometric expression of (c) phospho-SHP1 (pSHP1) and (d) phospho-Syk/Zap70 in NK cells expressing CAR19, 19scFv or the different iCAR19 constructs (n=5 donors) in response to stimulation with CD19+ Raji cells; the following bar graphs show their expression, determined by gMFI normalized to the unstimulated NK cell population. (e-h) CD107a (left), TNF-α (middle), and IFN-γ production by NK cells transduced with CAR19, 19scFv, or the different iCAR19 constructs in response to 6-hr stimulation with (e) CD19+ K562 cells (K562gCD19+), (f) K562, (g) RajiCD19+, or (h) CD19− RajiCD19-KO target cells (n=5 donors). (i and j) Incucyte analyses of percentage (%) caspase 3/7 events in (i) RajiCD19+ and (j) autoNKgCD19+ target cells after co-culture with NK cells expressing CAR19, 19scFv or the different iCAR19 constructs, (representative for three donors). (k and l) Cumulative population doubling (PD) of NK cells expressing CAR19, 19scFv or the different iCAR19 constructs over 70 days of culture with (k) IL-2 only or with (l) IL-2 plus weekly uAPC stimulation (n=3 donors). (m) tCD19 expression on NK cells transduced with CAR19, 19scFv or the different iCAR19 constructs, presented as ratio of TROG+/TROG− cells at different time points during co-culture with RajiCD19+ cells (n=3 donors)
P values were determined by two-tailed one-way ANOVA in panels c-h, or two-tailed two-way ANOVA in panels i-m. Data were assessed in flow cytometry in panels b,c,d,e,f,g,h,m, and shown by mean + s.e.m. Each symbol represents an individual donor.
Extended Data Fig. 9. AI-CAR expressing NK cells exert superior in vivo anti-tumor activity in a SKOV3gCD19+ ovarian cancer model.
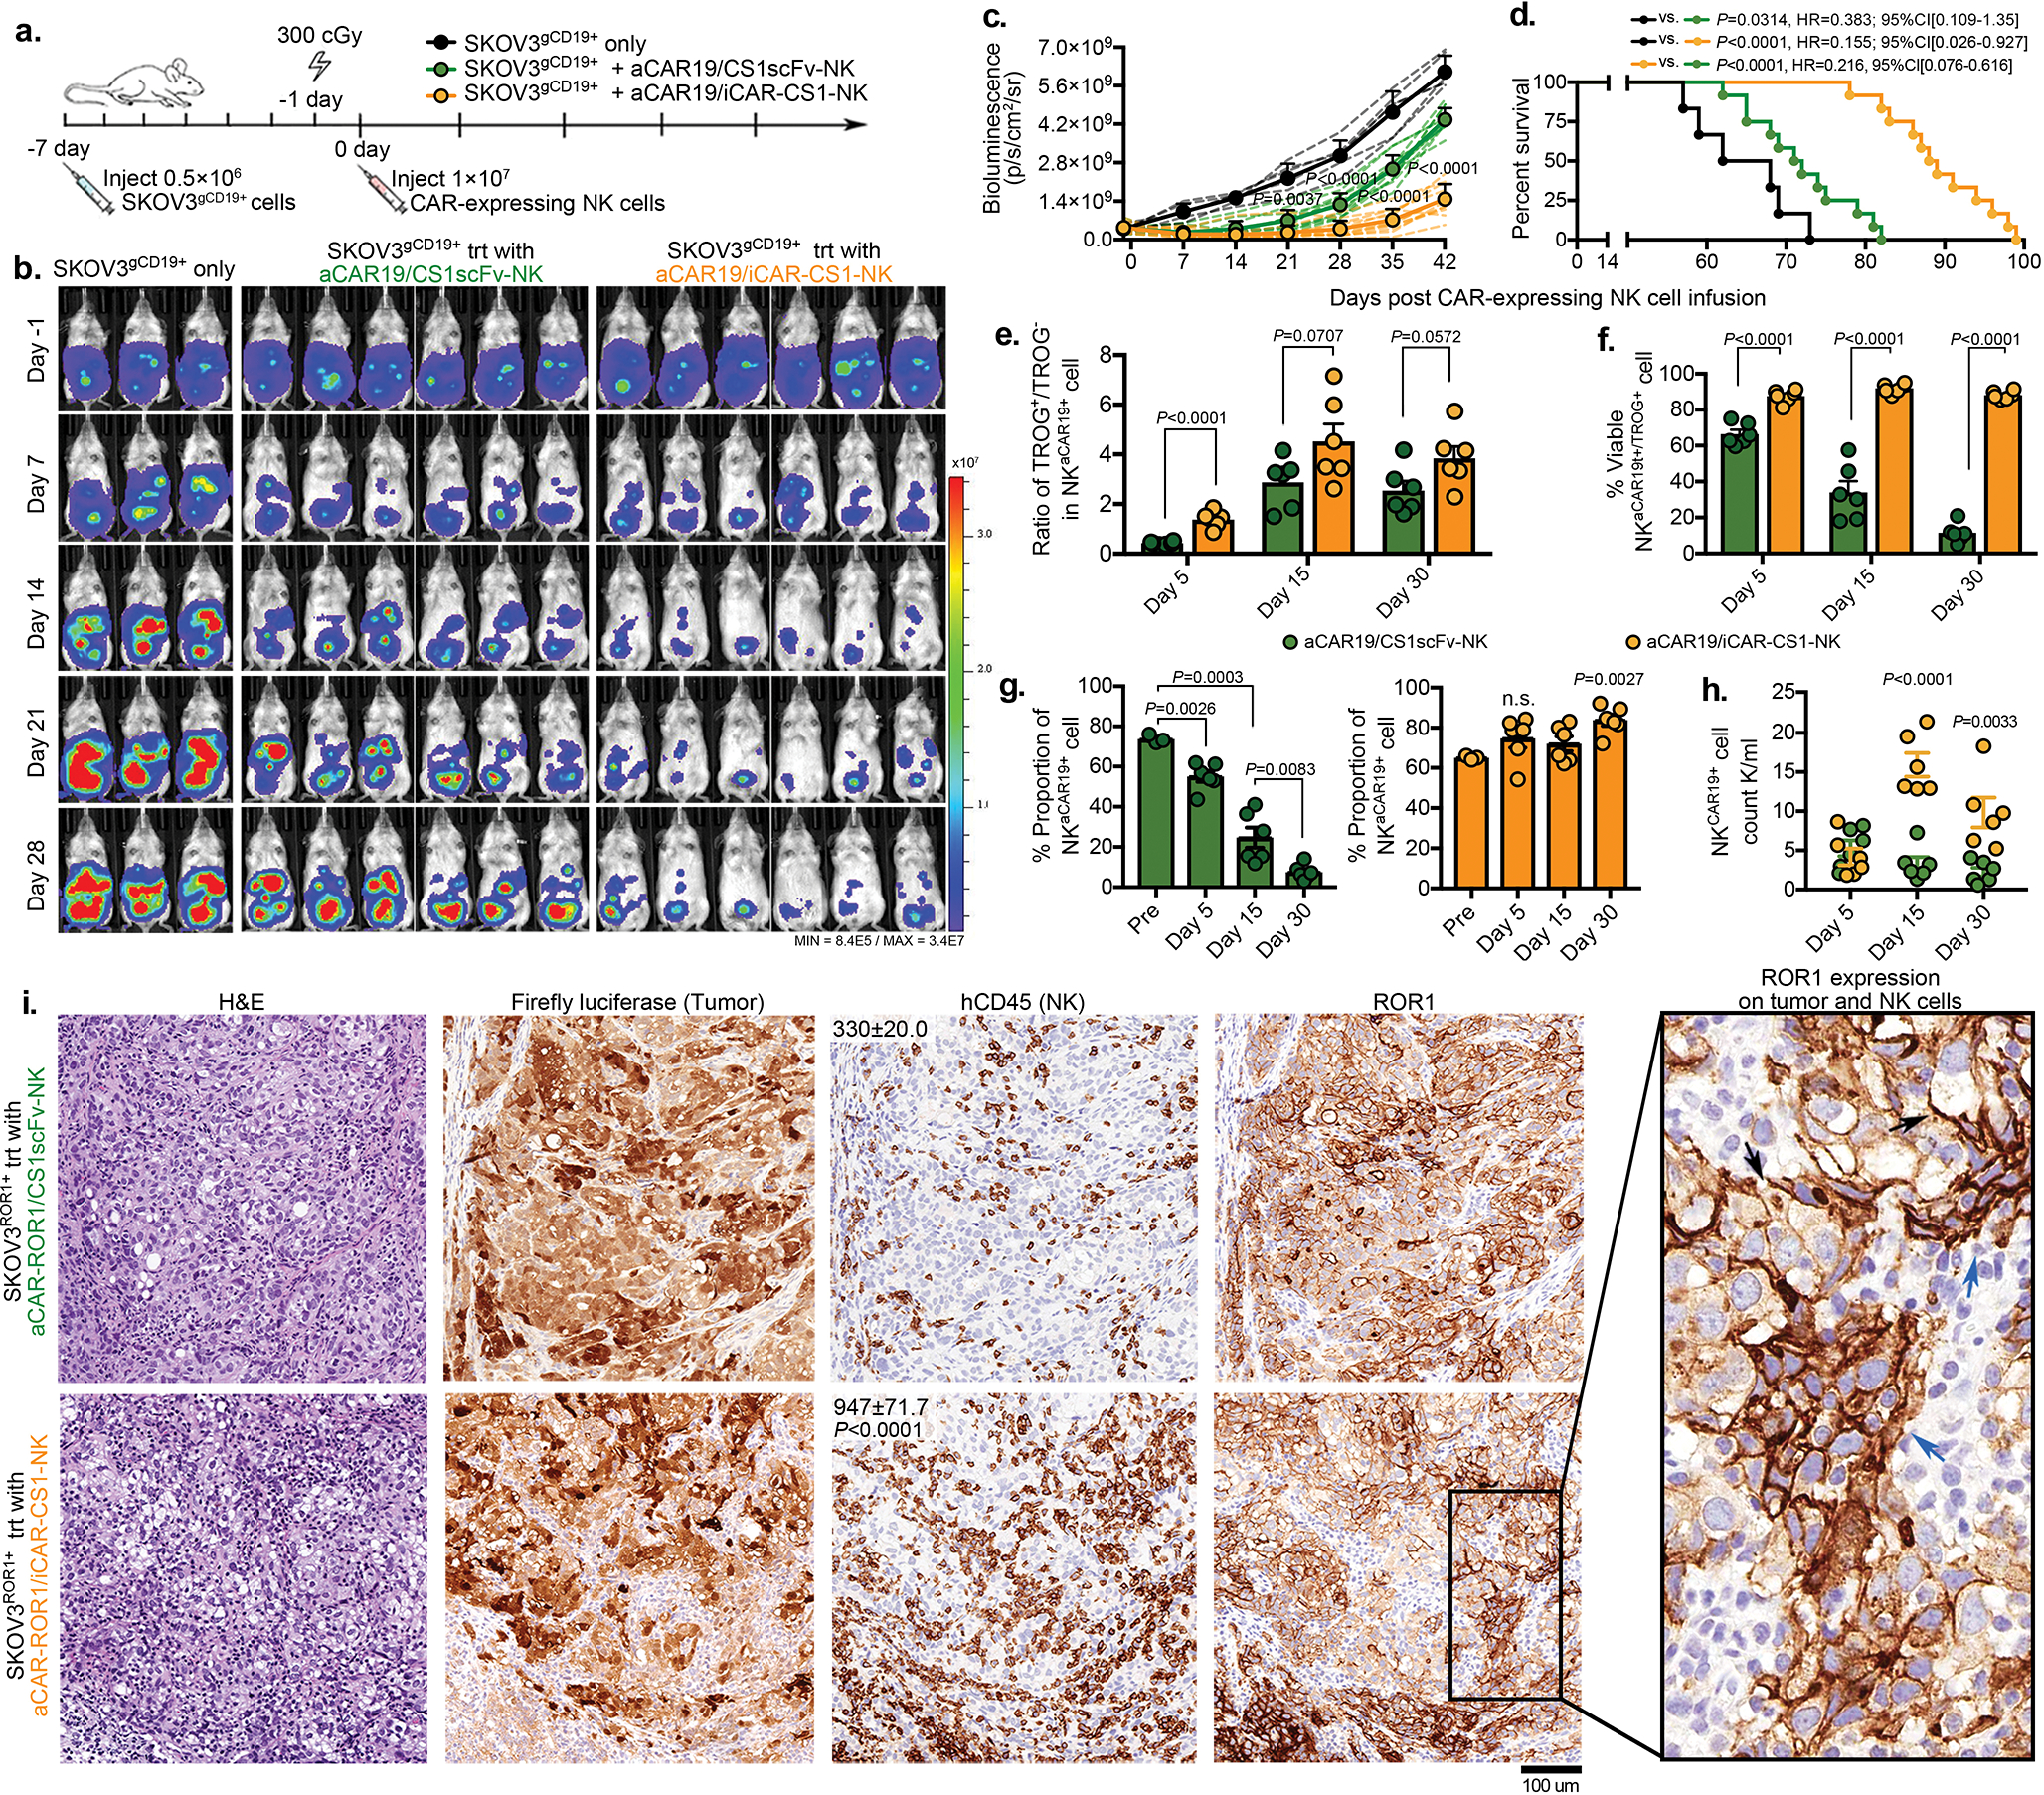
(a) Schematic illustration of the timeline using a mouse model of SKOV3gCD19+ ovarian cancer. Seven days later, mice received a single infusion of 1×10⁷ NK cells expressing aCAR19/CS1scFv (green), or aCAR19/iCAR-CS1 (orange), or no NK cells (tumor only) (n=5 mice/group). (b and c) Tumor burden as determined by weekly BLI, (b) representative images at select time points are shown; (c) normalized intensity of BLI for each treatment group over the treatment course; dashed lines represent data for each mouse. (d) Kaplan-Meier curves showing survival of mice after NK cell infusion. (e and f) (e) tCD19 (indicated as TROG+/TROG− population) and (f) viability of the TROG+ fraction (NKtCD19+) in the peripheral blood of mice at Days 5, 15, and 30 after infusion of aCAR19/CS1scFv (green) or aCAR19/iCAR-CS1 (orange) NK cells (n=5 mice/group). (g) Percentage (%) of live GFP−CD3−CD56+CAR19+ NK cells in the peripheral blood of mice at Days 5, 15, and 30 after infusion of aCAR19/CS1scFv (green, left) or aCAR19/iCAR-CS1 (orange, right) NK cells (n=5 mice/group). (h) Live NKCAR19+ NK cell counts in the peripheral blood of mice at Days 5, 15, and 30 after infusion of aCAR19/CS1scFv (green) or aCAR19/iCAR-CS1 (orange) NK cells (n=5 mice/group). (i) Representative images showing H&E and IHC staining with anti-Luciferase, anti-hCD45, or anti-hROR1 antibodies on sections from the mesentery tissue of SKOV3ROR1+ grafted mice treated with aCAR-ROR1/CS1-scFv NK cells or aCAR-ROR1/iCAR-CS1 NK cells. Inserted numbers indicate hCD45+ cell count per 0.1 mm2. Black arrows indicate ROR1 expression on tumor cells; blue arrows indicate ROR1 expression on NK cells; scale bar indicates 100 μm.
P values were determined by two-tailed Student’s t test in panels c, e,f,h,i,g, Log-rank test in panel d; n.s.: not significant. Date was pooled from two independent experiments in panels c and d, where NK cells were derived from different donors, or assessed by flow cytometry in panels e,f,g,h and shown by mean + s.e.m. Each circle represents an individual mouse sample.
Extended Data Fig. 10. Model of AI-CAR NK cell function.
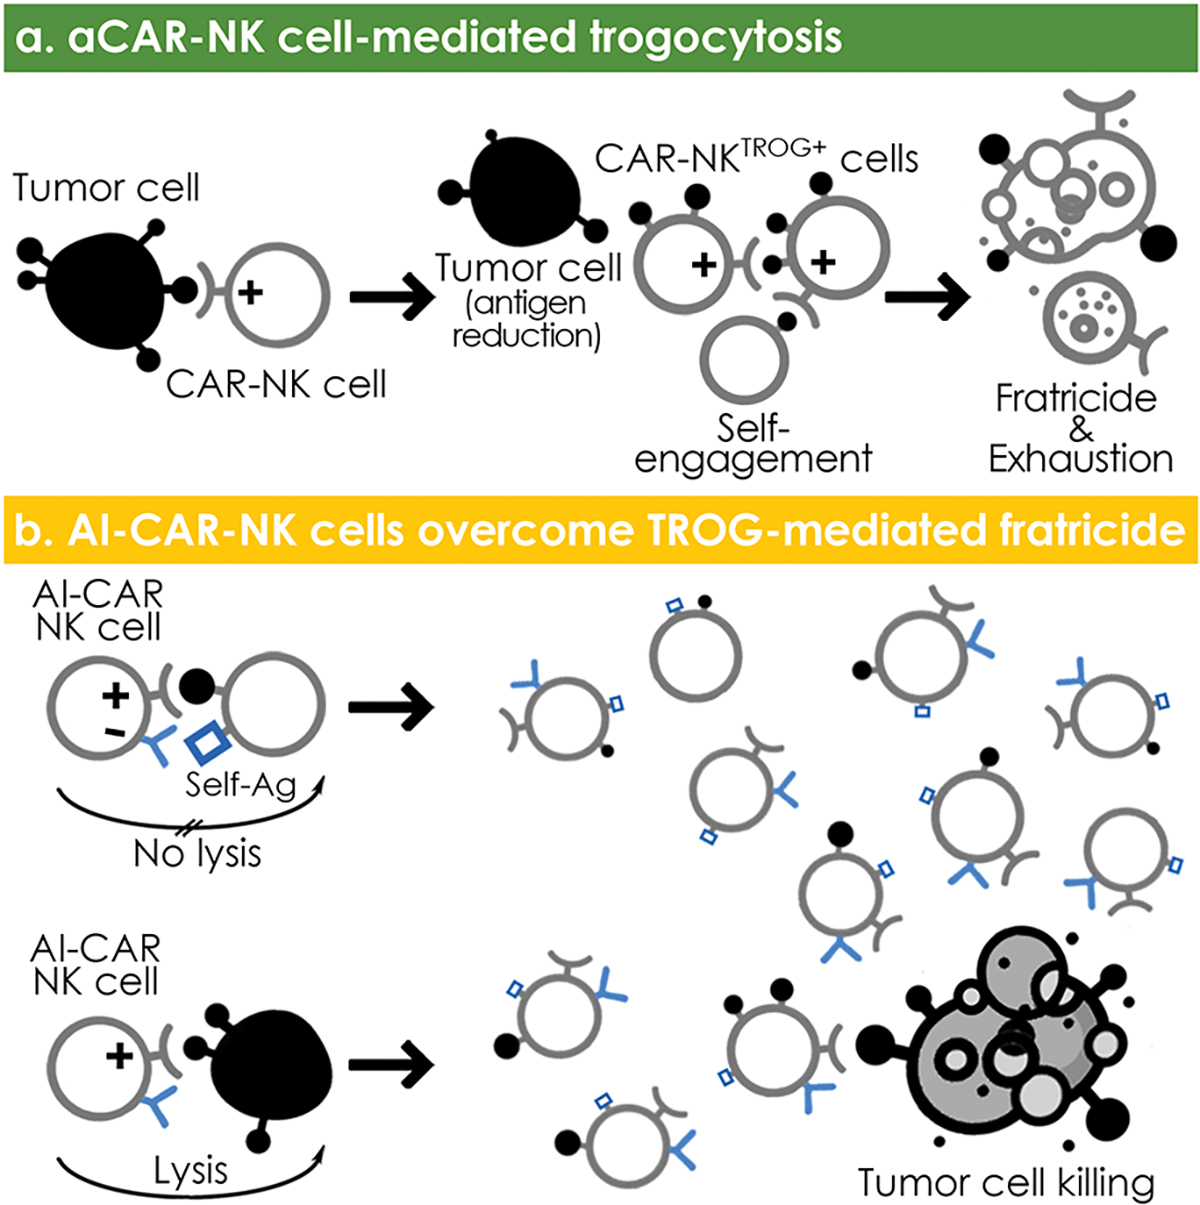
(a) aCAR-NK cell-mediated trogocytosis results in a decrease in antigen density on tumor cells, and promotes CAR-NK cell fratricide and hyporesponsiveness; (b) Engineering NK cells to express both an aCAR against a tumor antigen and a KIR-based inhibitory CAR (iCAR) against an NK self-antigen prevents TROG-induced self-recognition and TROG-antigen mediated fratricide of CAR-NK cells, while preserving their on-target tumor recognition and cytotoxicity.
Supplementary Material
Acknowledgments
This work was supported in part by the generous philanthropic contributions to The University of Texas MD Anderson Cancer Center Moonshot Program, and The Sally Cooper Murray endowment; by Grants (1 R01 CA211044-01, 5 P01CA148600-03, P50CA100632-16, and R01GM143243) from the National Institutes of Health (NIH), CPRIT (RP180466), Stand Up To Cancer Dream Team Research Grant (SU2C-AACR-DT-29-19), the Leukemia Specialized Program of Research Excellence (SPORE) Grant (P50CA100632), a Grant from the NIH to the MD Anderson Cancer Center Advanced Technology Genomics Core (ATGC) Facility (CA016672), and the Grant (P30 CA016672) from the NIH to the MD Anderson Cancer Center Flow Cytometry and Cellular Imaging Core Facility that assisted with the CyTOF studies. We gratefully appreciate Drs. Afshar-Kharghan Vahid, Michael A. Curran, Michael R. Green, and Yair Reisner for their supportive suggestions and consultations in this study. We also thank Elif Gokdemir, Benjamin T. Whitfield, Junjun Lu for their technical assistance.
Footnotes
Disclosure of Conflict of Interest
RB, EL, LNK, PPB, SA, DM, MD, REC, EJS, KR, and The University of Texas MD Anderson Cancer Center have an institutional financial conflict of interest with Takeda Pharmaceutical. SA, DM, RB, EL, LNK, EJS, KR, and The University of Texas MD Anderson Cancer Center have an institutional financial conflict of interest with Affimed GmbH. KR participates on the Scientific Advisory Board for GemoAb, AvengeBio, Virogin Biotech, GSK, Caribou Biosciences, Navan Technologies and Bayer. The remaining authors declare no competing financial interests.
Code availability
No custom code was developed.
Peer review information:
Primary Handling editors: Saheli Sadanand and Joao Monteiro, in collaboration with the Nature Medicine team.
Peer review information:
Nature Medicine thanks Adelheid Cerwenka, Nathan Singh and Evan Weber for their contribution to the peer review of this work.
Data availability
The human gene database GeneCard (genecards.org) were used to design the CAR constructs such as KIR2DL1 (GC19P067381), LIR-1 (GC19P067376), LAIR-1 (GC19M054351), NKG2A (GC12M021112), and CD300A (GC17P074466). Transcriptome data used in the generation of Extended Data Fig. 7g are available through the Gene Expression Omnibus (https://www.ncbi.nlm.nih.gov/geo/) under accessions GSE190976. Source data are included.
References
- 1.Joly E & Hudrisier D What is trogocytosis and what is its purpose? Nat Immunol 4, 815 (2003). [DOI] [PubMed] [Google Scholar]
- 2.Dance A Core Concept: Cells nibble one another via the under-appreciated process of trogocytosis. Proc Natl Acad Sci U S A 116, 17608–17610 (2019). [DOI] [PMC free article] [PubMed] [Google Scholar]
- 3.Bettadapur A, Miller HW & Ralston KS Biting Off What Can Be Chewed: Trogocytosis in Health, Infection, and Disease. Infect Immun 88(2020). [DOI] [PMC free article] [PubMed] [Google Scholar]
- 4.Ahmed KA, Munegowda MA, Xie Y & Xiang J Intercellular trogocytosis plays an important role in modulation of immune responses. Cell Mol Immunol 5, 261–269 (2008). [DOI] [PMC free article] [PubMed] [Google Scholar]
- 5.Miyake K & Karasuyama H The Role of Trogocytosis in the Modulation of Immune Cell Functions. Cells 10(2021). [DOI] [PMC free article] [PubMed] [Google Scholar]
- 6.Alhajjat AM, et al. Trogocytosis as a mechanistic link between chimerism and prenatal tolerance. Chimerism 4, 126–131 (2013). [DOI] [PMC free article] [PubMed] [Google Scholar]
- 7.Ford McIntyre MS, Young KJ, Gao J, Joe B & Zhang L Cutting edge: in vivo trogocytosis as a mechanism of double negative regulatory T cell-mediated antigen-specific suppression. J Immunol 181, 2271–2275 (2008). [DOI] [PubMed] [Google Scholar]
- 8.Hamieh M, et al. CAR T cell trogocytosis and cooperative killing regulate tumour antigen escape. Nature 568, 112–116 (2019). [DOI] [PMC free article] [PubMed] [Google Scholar]
- 9.Cheng M, Chen Y, Xiao W, Sun R & Tian Z NK cell-based immunotherapy for malignant diseases. Cell Mol Immunol 10, 230–252 (2013). [DOI] [PMC free article] [PubMed] [Google Scholar]
- 10.Fang F, Xiao W & Tian Z NK cell-based immunotherapy for cancer. Semin Immunol 31, 37–54 (2017). [DOI] [PubMed] [Google Scholar]
- 11.Myers JA & Miller JS Exploring the NK cell platform for cancer immunotherapy. Nat Rev Clin Oncol 18, 85–100 (2021). [DOI] [PMC free article] [PubMed] [Google Scholar]
- 12.Koehl U, et al. Advances in clinical NK cell studies: Donor selection, manufacturing and quality control. Oncoimmunology 5, e1115178 (2016). [DOI] [PMC free article] [PubMed] [Google Scholar]
- 13.Daher M, Melo Garcia L, Li Y & Rezvani K CAR-NK cells: the next wave of cellular therapy for cancer. Clin Transl Immunology 10, e1274 (2021). [DOI] [PMC free article] [PubMed] [Google Scholar]
- 14.Li Y, Hermanson DL, Moriarity BS & Kaufman DS Human iPSC-Derived Natural Killer Cells Engineered with Chimeric Antigen Receptors Enhance Anti-tumor Activity. Cell Stem Cell 23, 181–192 e185 (2018). [DOI] [PMC free article] [PubMed] [Google Scholar]
- 15.Caumartin J, et al. Trogocytosis-based generation of suppressive NK cells. EMBO J 26, 1423–1433 (2007). [DOI] [PMC free article] [PubMed] [Google Scholar]
- 16.Nakamura K, et al. Fratricide of natural killer cells dressed with tumor-derived NKG2D ligand. Proc Natl Acad Sci U S A 110, 9421–9426 (2013). [DOI] [PMC free article] [PubMed] [Google Scholar]
- 17.Domaica CI, et al. Tumour-experienced T cells promote NK cell activity through trogocytosis of NKG2D and NKp46 ligands. EMBO Rep 10, 908–915 (2009). [DOI] [PMC free article] [PubMed] [Google Scholar]
- 18.Lu T, et al. Hijacking TYRO3 from tumor cells via trogocytosis enhances NK-cell effector functions and proliferation. Cancer Immunol Res (2021). [DOI] [PMC free article] [PubMed] [Google Scholar]
- 19.Miner CA, Giri TK, Meyer CE, Shabsovich M & Tripathy SK Acquisition of activation receptor ligand by trogocytosis renders NK cells hyporesponsive. J Immunol 194, 1945–1953 (2015). [DOI] [PMC free article] [PubMed] [Google Scholar]
- 20.Elliott JM & Yokoyama WM Unifying concepts of MHC-dependent natural killer cell education. Trends Immunol 32, 364–372 (2011). [DOI] [PMC free article] [PubMed] [Google Scholar]
- 21.Anfossi N, et al. Human NK cell education by inhibitory receptors for MHC class I. Immunity 25, 331–342 (2006). [DOI] [PubMed] [Google Scholar]
- 22.Bryceson YT & Long EO Line of attack: NK cell specificity and integration of signals. Curr Opin Immunol 20, 344–352 (2008). [DOI] [PMC free article] [PubMed] [Google Scholar]
- 23.Pegram HJ, Andrews DM, Smyth MJ, Darcy PK & Kershaw MH Activating and inhibitory receptors of natural killer cells. Immunol Cell Biol 89, 216–224 (2011). [DOI] [PubMed] [Google Scholar]
- 24.Hudrisier D, Aucher A, Puaux AL, Bordier C & Joly E Capture of target cell membrane components via trogocytosis is triggered by a selected set of surface molecules on T or B cells. J Immunol 178, 3637–3647 (2007). [DOI] [PubMed] [Google Scholar]
- 25.Alter G, Malenfant JM & Altfeld M CD107a as a functional marker for the identification of natural killer cell activity. J Immunol Methods 294, 15–22 (2004). [DOI] [PubMed] [Google Scholar]
- 26.Poorebrahim M, et al. Counteracting CAR T cell dysfunction. Oncogene 40, 421–435 (2021). [DOI] [PMC free article] [PubMed] [Google Scholar]
- 27.Judge SJ, Murphy WJ & Canter RJ Characterizing the Dysfunctional NK Cell: Assessing the Clinical Relevance of Exhaustion, Anergy, and Senescence. Front Cell Infect Microbiol 10, 49 (2020). [DOI] [PMC free article] [PubMed] [Google Scholar]
- 28.Good CR, et al. An NK-like CAR T cell transition in CAR T cell dysfunction. Cell (2021). [Google Scholar]
- 29.Pesce S, et al. Identification of a subset of human natural killer cells expressing high levels of programmed death 1: A phenotypic and functional characterization. J Allergy Clin Immunol 139, 335–346 e333 (2017). [DOI] [PubMed] [Google Scholar]
- 30.Anderson AC, Joller N & Kuchroo VK Lag-3, Tim-3, and TIGIT: Co-inhibitory Receptors with Specialized Functions in Immune Regulation. Immunity 44, 989–1004 (2016). [DOI] [PMC free article] [PubMed] [Google Scholar]
- 31.Gill S, et al. Rapid development of exhaustion and down-regulation of eomesodermin limit the antitumor activity of adoptively transferred murine natural killer cells. Blood 119, 5758–5768 (2012). [DOI] [PMC free article] [PubMed] [Google Scholar]
- 32.Myers JA, et al. Balanced engagement of activating and inhibitory receptors mitigates human NK cell exhaustion. JCI Insight (2022). [DOI] [PMC free article] [PubMed] [Google Scholar]
- 33.Simonetta F, Pradier A & Roosnek E T-bet and Eomesodermin in NK Cell Development, Maturation, and Function. Front Immunol 7, 241 (2016). [DOI] [PMC free article] [PubMed] [Google Scholar]
- 34.Gardiner CM & Finlay DK What Fuels Natural Killers? Metabolism and NK Cell Responses. Front Immunol 8, 367 (2017). [DOI] [PMC free article] [PubMed] [Google Scholar]
- 35.O’Brien KL & Finlay DK Immunometabolism and natural killer cell responses. Nat Rev Immunol 19, 282–290 (2019). [DOI] [PubMed] [Google Scholar]
- 36.Liu E, et al. Cord blood NK cells engineered to express IL-15 and a CD19-targeted CAR show long-term persistence and potent antitumor activity. Leukemia 32, 520–531 (2018). [DOI] [PMC free article] [PubMed] [Google Scholar]
- 37.Daher M, et al. Targeting a cytokine checkpoint enhances the fitness of armored cord blood CAR-NK cells. Blood 137, 624–636 (2021). [DOI] [PMC free article] [PubMed] [Google Scholar]
- 38.Li L, et al. A novel immature natural killer cell subpopulation predicts relapse after cord blood transplantation. Blood Adv 3, 4117–4130 (2019). [DOI] [PMC free article] [PubMed] [Google Scholar]
- 39.Merino A, et al. Chronic stimulation drives human NK cell dysfunction and epigenetic reprograming. J Clin Invest 129, 3770–3785 (2019). [DOI] [PMC free article] [PubMed] [Google Scholar]
- 40.Van Gassen S, et al. FlowSOM: Using self-organizing maps for visualization and interpretation of cytometry data. Cytometry A 87, 636–645 (2015). [DOI] [PubMed] [Google Scholar]
- 41.Liu E, et al. Use of CAR-Transduced Natural Killer Cells in CD19-Positive Lymphoid Tumors. N Engl J Med 382, 545–553 (2020). [DOI] [PMC free article] [PubMed] [Google Scholar]
- 42.Vivier E, Nunes JA & Vely F Natural killer cell signaling pathways. Science 306, 1517–1519 (2004). [DOI] [PubMed] [Google Scholar]
- 43.Kirwan SE & Burshtyn DN Killer cell Ig-like receptor-dependent signaling by Ig-like transcript 2 (ILT2/CD85j/LILRB1/LIR-1). J Immunol 175, 5006–5015 (2005). [DOI] [PubMed] [Google Scholar]
- 44.Zenarruzabeitia O, Vitalle J, Eguizabal C, Simhadri VR & Borrego F The Biology and Disease Relevance of CD300a, an Inhibitory Receptor for Phosphatidylserine and Phosphatidylethanolamine. J Immunol 194, 5053–5060 (2015). [DOI] [PubMed] [Google Scholar]
- 45.Andre P, et al. Anti-NKG2A mAb Is a Checkpoint Inhibitor that Promotes Anti-tumor Immunity by Unleashing Both T and NK Cells. Cell 175, 1731–1743 e1713 (2018). [DOI] [PMC free article] [PubMed] [Google Scholar]
- 46.Meyaard L, et al. LAIR-1, a novel inhibitory receptor expressed on human mononuclear leukocytes. Immunity 7, 283–290 (1997). [DOI] [PubMed] [Google Scholar]
- 47.Wu Z, et al. Dynamic variability in SHP-1 abundance determines natural killer cell responsiveness. Sci Signal 14, eabe5380 (2021). [DOI] [PMC free article] [PubMed] [Google Scholar]
- 48.Long EO, Kim HS, Liu D, Peterson ME & Rajagopalan S Controlling natural killer cell responses: integration of signals for activation and inhibition. Annu Rev Immunol 31, 227–258 (2013). [DOI] [PMC free article] [PubMed] [Google Scholar]
- 49.Tai YT, et al. Anti-CS1 humanized monoclonal antibody HuLuc63 inhibits myeloma cell adhesion and induces antibody-dependent cellular cytotoxicity in the bone marrow milieu. Blood 112, 1329–1337 (2008). [DOI] [PMC free article] [PubMed] [Google Scholar]
- 50.Hsi ED, et al. CS1, a potential new therapeutic antibody target for the treatment of multiple myeloma. Clin Cancer Res 14, 2775–2784 (2008). [DOI] [PMC free article] [PubMed] [Google Scholar]
- 51.Ma X, et al. Pan-cancer genome and transcriptome analyses of 1,699 paediatric leukaemias and solid tumours. Nature 555, 371–376 (2018). [DOI] [PMC free article] [PubMed] [Google Scholar]
- 52.Lohr JG, et al. Discovery and prioritization of somatic mutations in diffuse large B-cell lymphoma (DLBCL) by whole-exome sequencing. Proc Natl Acad Sci U S A 109, 3879–3884 (2012). [DOI] [PMC free article] [PubMed] [Google Scholar]
- 53.Olson ML, et al. Low-affinity CAR T cells exhibit reduced trogocytosis, preventing rapid antigen loss, and increasing CAR T cell expansion. Leukemia (2022). [DOI] [PMC free article] [PubMed] [Google Scholar]
- 54.Hochreiter-Hufford A & Ravichandran KS Clearing the dead: apoptotic cell sensing, recognition, engulfment, and digestion. Cold Spring Harb Perspect Biol 5, a008748 (2013). [DOI] [PMC free article] [PubMed] [Google Scholar]
- 55.Kalluri R & LeBleu VS The biology, function, and biomedical applications of exosomes. Science 367(2020). [DOI] [PMC free article] [PubMed] [Google Scholar]
- 56.Tabiasco J, et al. Acquisition of viral receptor by NK cells through immunological synapse. J Immunol 170, 5993–5998 (2003). [DOI] [PubMed] [Google Scholar]
- 57.Tabiasco J, et al. Active trans-synaptic capture of membrane fragments by natural killer cells. Eur J Immunol 32, 1502–1508 (2002). [DOI] [PubMed] [Google Scholar]
- 58.Nakamura K, et al. NK-cell fratricide: Dynamic crosstalk between NK and cancer cells. Oncoimmunology 2, e26529 (2013). [DOI] [PMC free article] [PubMed] [Google Scholar]
- 59.Carlsten M, et al. Checkpoint Inhibition of KIR2D with the Monoclonal Antibody IPH2101 Induces Contraction and Hyporesponsiveness of NK Cells in Patients with Myeloma. Clin Cancer Res 22, 5211–5222 (2016). [DOI] [PMC free article] [PubMed] [Google Scholar]
- 60.Taylor RP & Lindorfer MA Fcgamma-receptor-mediated trogocytosis impacts mAb-based therapies: historical precedence and recent developments. Blood 125, 762–766 (2015). [DOI] [PubMed] [Google Scholar]
Associated Data
This section collects any data citations, data availability statements, or supplementary materials included in this article.
Supplementary Materials
Data Availability Statement
The human gene database GeneCard (genecards.org) were used to design the CAR constructs such as KIR2DL1 (GC19P067381), LIR-1 (GC19P067376), LAIR-1 (GC19M054351), NKG2A (GC12M021112), and CD300A (GC17P074466). Transcriptome data used in the generation of Extended Data Fig. 7g are available through the Gene Expression Omnibus (https://www.ncbi.nlm.nih.gov/geo/) under accessions GSE190976. Source data are included.


