

Keywords: collecting duct, Foxi1, G protein-coupled receptor 116, intercalated cells, V-ATPase
Abstract
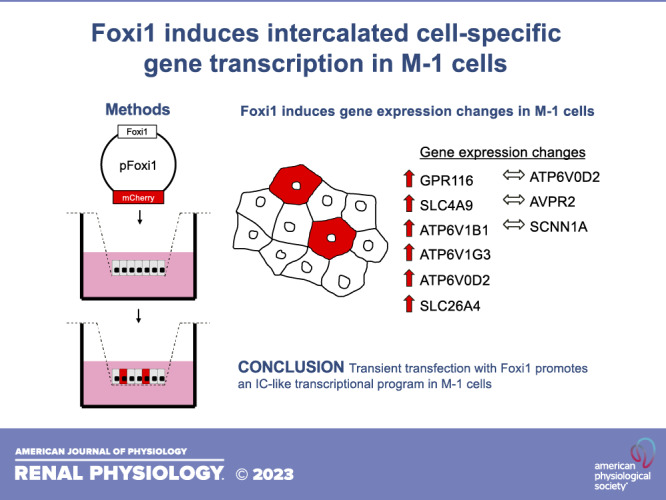
The diverse functions of each nephron segment rely on the coordinated action of specialized cell populations that are uniquely defined by their transcriptional profile. In the collecting duct, there are two critical and distinct cell populations: principal cells and intercalated cells. Principal cells play key roles in the regulation of water, Na+, and K+, whereas intercalated cells are best known for their role in acid-base homeostasis. Currently, there are no in vitro systems that recapitulate the heterogeneity of the collecting ducts, which limits high-throughput and replicate investigations of genetic and physiological phenomena. Here, we demonstrated that the transcription factor Foxi1 is sufficient to alter the transcriptional identity of M-1 cells, a murine cortical collecting duct cell line. Specifically, overexpression of Foxi1 induces the expression of intercalated cell transcripts including Gpr116, Atp6v1b1, Atp6v1g3, Atp6v0d2, Slc4a9, and Slc26a4. These data indicate that overexpression of Foxi1 differentiates M-1 cells toward a non-A, non-B type intercalated cell phenotype and may provide a novel in vitro tool to study transcriptional regulation and physiological function of the renal collecting duct.
NEW & NOTEWORTHY Transfection of M-1 cells with the transcription factor Foxi1 generates cells that express V-ATPase and Gpr116 as well as other genes associated with renal intercalated cells. This straightforward and novel in vitro system could be used to study processes including transcriptional regulation and cell specification and differentiation in renal intercalated cells.
INTRODUCTION
The renal collecting duct is a heterogeneous epithelium composed of principal cells (PCs) and intercalated cells (ICs). PCs play a critical role in the maintenance of blood volume and are sensitive to both vasopressin and aldosterone, which drive apical expression of aquaporin-2 (AQP2) water channels and epithelial Na+ channels (ENaC), respectively (1–3). ICs are characterized by plasma membrane expression of vacuolar-type H+-ATPase (V-ATPase); A-type ICs (AICs) express V-ATPase on the luminal membrane, and B-type ICs (BICs) express V-ATPase on the serosal membrane (4–6). Due to their reliance on V-ATPase for transport processes, ICs are considered important renal regulators of pH homeostasis.
Unlike other epithelial tissues [such as the lung (7, 8) and intestine (9, 10)], there are limited in vitro systems that recapitulate the physiological function of the nephron, let alone the patterned collecting ducts [although a recent report demonstrated directed differentiation of human pluripotent stem cells into collecting duct epithelial cells (11)]. To date, significant advances in our understanding of transport phenomena in the collecting ducts have relied on low-throughput methods such as perfused (12, 13) or split-open single tubules (14, 15) as well as transgenic animal models. Immortalized cell lines, such as mpkCCD cells, have been effective tools in understanding AQP2 regulation in PCs (16, 17) as well as amiloride-sensitive ENaC current (18, 19). However, these cells vary by clonal population and are largely representative of PCs, not ICs. Therefore, an in vitro system that replicates the patterned cell types of the collecting duct could become an important tool for the investigation of both PC and IC physiology.
Cells of the collecting duct are derived developmentally from the ureteric bud, which matures in a Notch-dependent manner into the “salt and pepper” distribution of minority ICs among majority PCs (20–23). Genetic deletion of the transcription factor Foxi1 leads to the absence of ICs, and Foxi1-deficient mice develop distal renal tubular acidosis (24, 25). Foxi1 mutation is similarly associated with acidosis and deafness in humans (26). Indeed, Foxi1 is a transcriptional regulator of IC-specific expression of V-ATPase subunits (27, 28) as well as BIC-specific expression of anion exchanger-4 (AE4) (29), a Na+-dependent anion exchanger, emphasizing the critical role of Foxi1 in IC specification. In addition, a recent study identified Foxi1 as a critical regulator of airway cystic fibrosis transmembrane conductance regulator-rich ionocytes (30). Notably, these pulmonary ionocytes express an adhesion-class G protein-coupled receptor [G protein-coupled receptor 116 (Gpr116)/ADGRF5] that we previously revealed to be a critical regulator of V-ATPase in AICs (31), suggesting that Foxi1 initiates a transcriptional program that includes Gpr116. Here, we tested the hypothesis that heterologous expression of Foxi1 in an immortalized murine cortical collecting duct cell line [M-1 (32)] is sufficient to generate IC-like cells in vitro.
METHODS
Cell Culture
M-1 cells (American Type Culture Collection) were grown in a 1:1 mixture of DMEM and Ham’s F-12 medium with 2.5 mM l-glutamine adjusted to contain 15 mM HEPES, 0.5 mM sodium pyruvate, and 1.2 g/L sodium bicarbonate supplemented with 0.005 mM dexamethasone, 10% FBS, 1% penicillin-streptomycin, and 5 µg/mL plasmocin (Invivogen). M-1 cells were grown on coverslips (for RNAScope) or Transwell 0.4-µm-pore polyester membranes (Corning). Human embryonic kidney (HEK)29T, MCF7, IMCD3, Madin-Darby canine kidney (MDCK), and MDCK-C11 cells were grown in minimal essential medium supplemented with 10% FBS, 1% penicillin-streptomycin, and 1% l-glutamine. Cells were maintained in a 37°C humidified incubator with 5% CO2. Once cultures reached 60% confluence, cells were reverse transfected with Lipofectamine 2000 (ThermoFisher Scientific) at a plasmid mass-to-transfection reagent volume ratio of 2:1 and grown for at least 2 days before experimentation. Experiments were repeated a minimum of three times for PCR assays and twice for RNAscope.
Cloning
Foxi1 (NM_023907.4) cDNA was cloned from the whole mouse kidney into a pME18S expression vector (pFoxi1) using forward primer 5′-TAATAGgaattcATGAGCTCCTTCGAC-3′ (EcoRI) and reverse primer 5′-TAATTTctcgagCTAGACTTCAGTGCC-3′ (XhoI) and validated by Sanger sequencing. Foxi1 was then subcloned into the pLVX-EF1alpha-IRES-mCherry vector at EcoRI and BamHI restriction sites using forward primer 5′-TAATAGgaattcATGAGCTCCTTCGAC-3′ and reverse primer 5′-TAATTTggatccCTAGACTTCAGTGCC-3′ to make pFoxi1-IRES-mCherry.
Conventional and Quantitative RT-PCR
RNA was isolated from cells and the mouse kidney using the RNeasy Mini Kit (Qiagen). cDNA was generated using the QuantiTect reverse transcription kit with gDNA Wipeout (Qiagen). Conventional PCR amplification of Gpr116 was achieved using forward primer 5′- TCCAATTCGAGGGACCGAAG-3′ and reverse primer 5′- GTAGTTCACAACCACGCTGC-3′. TaqMan real-time PCR assays were performed in triplicate according to the manufacturer’s standard protocol (Thermo). Ten nanograms of cDNA were PCR amplified using an Applied Biosystems QuantStudio 6 PCR system (Thermo). Amplification data were analyzed on Microsoft Excel and plotted with GraphPad Prism version 9.1.2. All quantitative PCR data are mean values of three biological replicates and are presented as relative expression per Gapdh. TaqMan assays are shown in Table 1.
Table 1.
TaqMan assays and RNAscope probes
| Target | TaqMan Assay ID |
|---|---|
| Adh1 | Mm00507711_m1 |
| Aqp2 | Mm00437575_m1 |
| Aqp6 | Mm00558232_m1 |
| Atp6v0a4 | Mm00459882_m1 |
| Atp6v0d2 | Mm01222963_m1 |
| Atp6v1b1 | Mm00460309_m1 |
| Atp6v1g3 | Mm00616840_m1 |
| Avpr2 | Mm01193534_g1 |
| Car2 | Mm00501576_m1 |
| Clcn5 | Mm00443851_m1 |
| Dmrt2 | Mm00659912_m1 |
| Fxyd4 | Mm01184749_m1 |
| Gpr116 | Mm01269030_m1 |
| Hsd11b2 | Mm01251104_m1 |
| Scnn1a | Mm00803386_m1 |
| Scnn1g | Mm00441228_m1 |
| Slc26a4 | Mm01258316_m1 |
| Slc4a1 | Mm01245920_g1 |
| Slc4a9 | Mm01130729_m1 |
| Gapdh | Mm99999915_g1 |
| Target | RNAscope Probe |
|---|---|
| Atp6v1g3 | 1086401-C3 |
| Foxi1 | 483021 |
| Gpr116 | 318021-C2 |
Immunofluorescent Microscopy and RNAscope In Situ Hybridization
Mice harboring an enhanced green fluorescent protein (EGFP) gene driven by the ATP6V1B1 promoter [a kind gift from Dennis Brown, MGH (33)] were perfusion fixed by intracardial transfusion of ∼20 mL of PBS followed by 20 mL of 4% paraformaldehyde (PFA) under deep anesthesia. The kidneys were harvested and drop fixed in 4% PFA overnight at 4°C. The kidneys were then dehydrated in a 30% sucrose solution overnight, embedded into Tissue-Tek OCT compound, and flash frozen with liquid nitrogen. Frozen kidneys were sectioned at 8 µm on a cryostat and mounted on slides.
M-1 cells were grown on Transwell membranes (immunofluorescence) or a Nunc Lab-Tek chambered coverglass (RNAscope, Thermo) until 60% confluent, transfected with pFoxi1 or pFoxi1-IRES-mCherry, and then fixed with 4% PFA after 4 days (immunofluorescence) or 2 days (RNAscope) of culture. For immunofluorescence, cells were permeabilized with 0.3% Triton X-100 for 10 min and then blocked with 3% BSA for 60 min. Cells were treated with primary antibodies (Foxi1: ab20454, Abcam; and V-ATPaseβ1/2: sc-55544, Santa Cruz Biotechnology) diluted 1:100 in blocking buffer overnight at 4°C. Cells were washed in PBS, exposed to secondary antibodies diluted 1:500 in PBS for 45 min at room temperature, and then counterstained with DAPI. Membranes were excised from the Transwells and mounted on glass slides for imaging.
RNAscope in situ hybridization was performed using the RNAscope Fluorescent Multiplex Assay kit per the manufacturer’s instructions (Biotechne). RNAscope hybridization probes specific to murine Foxi1, ATPase H+-transporting V1 subunit G3 (Atp6v1g3), and Gpr116 are shown in Table 1. To improve detection of the EGFP signal after RNAscope, a primary antibody targeting GFP was added (diluted 1:100 in blocking buffer, A-6455, Thermo), followed by the addition of a fluorescent Alexa Fluor secondary antibody. Fluorescent images were captured on a Zeiss LSM880-Airyscan FAST Super-Resolution laser scanning confocal microscope and processed in Zeiss Zen software at the Johns Hopkins University School of Medicine Microscope Core Facility.
Animals
All animal procedures were conducted in accordance with guidelines set forth by the National Institutes of Health Guide for the Care and Use of Laboratory Animals and were approved by the Johns Hopkins University Animal Care and Use Committee.
Statistics
All values are given as means ± SE. Student’s t test was used for statistical analysis. A P value of <0.05 was considered to be significant.
RESULTS
Foxi1 and Gpr116 Are Expressed in the Renal Collecting Duct
To verify that Foxi1 and Gpr116 are coexpressed in renal intercalated cells, we used transgenic mice expressing EGFP driven by the Atp6v1b1 promoter to identify V-ATPase-expressing ICs in the collecting ducts (Fig. 1). RNAscope in situ hybridization confirmed expression of Foxi1 and Gpr116 in EGFP-expressing cells, although a subset of cells expressed Foxi1 without Gpr116.
Figure 1.

Coexpression of Foxi1 and G protein-coupled receptor 116 (Gpr116) in murine collecting ducts. Detection of Foxi1 (red) and Gpr116 (white) transcripts by RNAscope hybridization demonstrated colocalization in intercalated cells [identified by enhanced green fluorescent protein (EGFP) expression in ATP6V1B1-EGFP mice]. Gpr116 was not detected in some Foxi1+ cells (top, *). Scale bars = 10 µm (top) and 5 µm (bottom).
M-1 Cells Transfected With pFoxi1 Induce Expression of Gpr116
Next, we overexpressed murine Foxi1 in immortalized cell lines (Fig. 2A). RT-PCR revealed induction of Gpr116 transcript in M-1 cells but not in HEK293T, IMCD3, MCF7, MDCK, or MDCK-C11 cells (Fig. 2, A and B). These results were validated by quantitative PCR in M-1 cells (Fig. 2C). M-1 cells do not express endogenous Foxi1, but M-1 cells transfected with pFoxi1 expressed Gpr116 as detected by RNAscope (Fig. 2D).
Figure 2.

Induction of G protein-coupled receptor 116 (Gpr116) transcription in M-1 cells transfected with Foxi1. A: heterologous expression of Foxi1 induced Gpr116 transcription in M-1 cells but not in other immortalized cell lines, as revealed by RT-PCR. Endogenous expression of Gpr116 in the murine kidney is shown as a positive control. B: repeat measurement of Gpr116 expression by RT-PCR in M-1 cells transfected with pFoxi1. Endogenous expression of Foxi1 and Gpr116 in murine kidney is shown as a positive control. C: Foxi1-induced Gpr116 transcription in M-1 cells as measured by Taqman quantitative PCR. Relative expression is per Gapdh. Cycle threshold (CT) of 35 ≈ relative expression 0.0001. n = 3. Bars are means ± SE. ND, no detection (CT > 35). *P < 0.05 vs. M-1 cells. D: colocalization of Foxi1 and Gpr116 transcripts in an M-1 cell transfected with pFOXI1 as detected by RNAscope. Scale bar = 5 µm. HEK, human embryonic kidney; MDCK, Madin-Darby canine kidney.
Foxi1 Overexpression in M-1 Cells Induces V-ATPase Subunit Transcription
Foxi1 is a transcriptional regulator of V-ATPase proton pump subunits and a necessary transcription factor for IC specification. Therefore, we investigated if transfection with Foxi1 caused a broader remodeling of the transcriptional landscape in M-1 cells. Indeed, we observed induction of Atp6v1b1, Atp6v1g3, and Atp6v0d2 V-ATPase subunits in M-1 cells as well as colocalization of Atp6v1g3 and Foxi1 transcripts in transfected M-1 cells (Fig. 3, A and B). Notably, M-1 cells have no endogenous expression of these V-ATPase subunits. Moreover, expression of Foxi1 was necessary but not sufficient for expression of Atp6v1g3 transcript as revealed by RNAscope (Fig. 3B). In addition, M-1 cells express endogenous Atp6v0a4, and this transcript was not affected by Foxi1 transfection.
Figure 3.

Transfection with pFoxi1 induces V-ATPase subunit transcription in M-1 cells. A: heterologous expression of Foxi1 induces transcription of V-ATPase subunits Atp6v1b1, Atp6v1g3, and Atp6v0d2 as measured by Taqman quantitative PCR. B: colocalization of Foxi1 and Atp6v1g3 transcripts in an M-1 cell transfected with pFOXI1 as detected by RNAscope. C: M-1 cells transfected with pFoxi1-IRES-mCherry expressed Foxi1 as detected by immunofluorescent microscopy using primary antibody targeting Foxi1. D: M-1 cells transfected with control IRES-mCherry vector did not express V-ATPase. E: M-1 cells transfected with pFoxi1-IRES-mCherry expressed V-ATPase β1/2 subunits as detected by immunofluorescent microscopy. F: V-ATPase localized at or near the plasma membrane in transfected M-1 cells but was not restricted to the apical or basolateral side. The dashed line indicates the orthogonal plane shown at the bottom. The Z-plane is labeled from apical to basolateral. Scale bar = 10 µm. G: other transcripts associated with intercalated cells were unaffected by pFoxi1. H: many transcripts associated with principal cells were unaffected by pFoxi1. I: pFoxi1 induced Slc4a9 [anion exchanger 4 (AE4)] and Slc26a4 (pendrin) transcription in M-1 cells as measured by Taqman quantitative PCR. Relative expression is per Gapdh. Cycle threshold (CT) of 35 ≈ relative expression 0.0001. n = 3. Bars are means ± SE. *P < 0.05 vs. M-1. ND, no detection (CT > 35). All scale bars = 5 µm unless noted (orthogonal images shown in F).
Next, using a heterologous expression vector containing Foxi1 and mCherry separated by an internal ribosome entry site (pFoxi1-IRES-mCherry; Fig. 3C), we confirmed expression of V-ATPase protein in transfected M-1 cells by immunofluorescent microscopy (Fig. 3, D–F). Confirmation of Foxi1 protein expression using primary antibody targeting Foxi1 is shown in Fig. 3C. V-ATPase appeared to localize at or near the plasma membrane in M-1 cells grown on Transwell filter membranes. V-ATPase localization was not polarized toward the apical or basolateral membranes (Fig. 3F).
Foxi1 Induced Transcription of Ae4 and Pendrin
Several other genes associated with ICs [doublesex and mab-3 related transcription factor 2 (Dmrt2), aquaporin-6 (Aqp6), Cl− voltage-gated channel 5 (Clcn5), and carbonic anhydrase 2 (Car2)] and PCs [Aqp2, arginine vasopressin receptor 2 (Avpr2), Na+ channel epithelial 1 subunit α (Scnn1a), Na+ channel epithelial 1 subunit γ (Scnn1g), alcohol dehydrogenase 1 (Adh1), hydroxysteroid 11-β dehydrogenase 2 (Hsd11b2), and FXYD domain-containing ion transport regulator 4 (Fxyd4)] were unchanged by quantitative PCR in response to Foxi1 overexpression (Fig. 3, G and H). However, M-1 cells transfected with pFoxi1 demonstrated transcriptional upregulation of Slc4a9 (Ae4) and Slc26a4 (pendrin), both specific transcripts of BICs (Fig. 3I). In contrast, AIC-specific transcript Slc4a1 (Ae1) was not detected in transfected cells.
DISCUSSION
We hypothesized that heterologous expression of the transcription factor Foxi1 was sufficient to generate IC-like cells in vitro. Here, we present an in vitro system that transforms M-1 collecting duct cells into heterogeneous monolayers harboring cells that express Gpr116, Atp6v1b1, and Slc4a9. Although considerable work remains to functionally characterize our system, the generation of cells expressing IC-specific transcripts represents a significant development for high-throughput analysis of collecting duct physiology. Of note, pFoxi1 does not induce transcription of AIC-specific Slc4a1 (Ae1) in M-1 cells. Although Gpr116 is restricted to AICs in vivo, it may be that Gpr116 expression is initiated by Foxi1 during IC specification, with further layers of regulation contributing to Gpr116 expression in AICs versus BICs. Therefore, our in vitro system generates IC-like cells that can be best described as non-A, non-B type ICs. Furthermore, our results demonstrate that there are additional factors required to generate AIC-specific transcripts like Slc4a1. Whether Foxi1 is necessary and permissible for Slc4a1 expression is the subject of ongoing investigation.
Interestingly, heterologous expression of Foxi1 does not induce transcription of Gpr116 or V-ATPase subunits in all cell lines. We tested several immortalized cell lines including IMCD3, MCF7, MDCK, MDCK C11, and HEK293T, but only M-1 cells demonstrated a transcriptional response to pFoxi1. M-1 cells have been reported to have both PC- and IC-like characteristics (32). Indeed, transcriptionally, M-1 cells express PC-specific genes such as Avpr2 and Scnn1a as well as Dmrt2, Car2, and Aqp6 (IC-specific markers). Our finding that pFoxi1 induces Atp6v1b1 transcription in M-1 cells suggests the epigenetic landscape of M-1 cells is permissive to transcriptional regulation by Foxi1.
Although M-1 cells are clearly responsive to Foxi1 transcriptional regulation, we do not yet have a full understanding of the extent of IC specification in cultured cells. While we can detect robust upregulation of Foxi1 target genes (Atp6v1b1, Gpr116, and Slc4a9) by quantitative PCR, this transcriptional activity presumably occurs only in the subset of M-1 cells that are transfected by pFoxi1. And, as the majority of M-1 cells in a culture dish are not transfected and express PC-specific genes such as Avpr2, we are unable to determine if pFoxi1 causes the downregulation of PC genes in transfected M-1 cells. Therefore, our data do not eliminate the possibility that pFoxi1-transfected M-1 cells downregulate PC-specific genes in favor of BIC-specific Foxi1 target genes. Of note, there are advantages to transient transfection in that the resultant cell population is a mix of PC-like and IC-like cells and thus resembles the cell populations found in the collecting duct in vivo. However, there are also clear advantages of stable transfection, and stable transfection of Foxi1 may be a powerful tool as well.
In addition to inducing V-ATPase transcription, M-1 cells transfected with pFoxi1 significantly upregulate Slc4a9 (Ae4) and Slc26a4 (pendrin). The expression of Slc4a9 is in agreement with a previous study showing that Slc4a9 is targeted by Foxi1 (29). The generation of cells expressing Ae4, a poorly understood Cl−/ exchanger, represents a potentially significant advancement for in vitro investigations of Ae4 and BIC function. Future experiments that assess the functional attributes of these cells will be critical to determine the usefulness of this cell model, which we hope will become a useful tool for investigations of IC differentiation, function, and regulation.
DATA AVAILABILITY
Data will be made available upon reasonable request.
GRANTS
This work was supported by National Institutes of Health Grants T32HL007534 (to M.K.), F32DK116499 and K99DK127215 (to N.A.Z.), and R56DK107726 (to J.L.P.). Research reported in this publication (JHU SoM MicFac) was supported by the Office of the Director and National Institutes of Health under Grant S10OD023548.
DISCLOSURES
J. L. Pluznick is an editor of American Journal of Physiology-Renal Physiology and was not involved and did not have access to information regarding the peer-review process or final disposition of this article. An alternate editor oversaw the peer-review and decision-making process for this article. None of the other authors has any conflicts of interest, financial or otherwise, to disclose.
AUTHOR CONTRIBUTIONS
M.K. and N.A.Z. conceived and designed research; M.K. and N.A.Z. performed experiments; M.K. and N.A.Z. analyzed data; M.K., J.L.P., and N.A.Z. interpreted results of experiments; M.K. and N.A.Z. prepared figures; M.K. and N.A.Z. drafted manuscript; M.K., J.L.P., and N.A.Z. edited and revised manuscript; M.K., J.L.P., and N.A.Z. approved final version of manuscript.
ACKNOWLEDGMENTS
The authors acknowledge the members of the Pluznick laboratory for constructive discussion and support as well as the faculty, trainees, and staff of the Department of Physiology and Johns Hopkins School of Medicine Microscopy Facility. We also acknowledge Dennis Brown (MGH) for kindly providing the EGFP-reporter mice.
REFERENCES
- 1. Staruschenko A. Regulation of transport in the connecting tubule and cortical collecting duct. Compr Physiol 2: 1541–1584, 2012. doi: 10.1002/cphy.c110052. [DOI] [PMC free article] [PubMed] [Google Scholar]
- 2. Naray-Fejes-Toth A, Canessa C, Cleaveland ES, Aldrich G, Fejes-Toth G. sgk is an aldosterone-induced kinase in the renal collecting duct. Effects on epithelial Na+ channels. J Biol Chem 274: 16973–16978, 1999. doi: 10.1074/jbc.274.24.16973. [DOI] [PubMed] [Google Scholar]
- 3. Verkman AS, Lencer WI, Brown D, Ausiello DA. Endosomes from kidney collecting tubule cells contain the vasopressin-sensitive water channel. Nature 333: 268–269, 1988. doi: 10.1038/333268a0. [DOI] [PubMed] [Google Scholar]
- 4. Breton S, Brown D. Regulation of luminal acidification by the V-ATPase. Physiology (Bethesda) 28: 318–329, 2013. doi: 10.1152/physiol.00007.2013. [DOI] [PMC free article] [PubMed] [Google Scholar]
- 5. Wagner CA, Finberg KE, Breton S, Marshansky V, Brown D, Geibel JP. Renal vacuolar H+-ATPase. Physiol Rev 84: 1263–1314, 2004. doi: 10.1152/physrev.00045.2003. [DOI] [PubMed] [Google Scholar]
- 6. Chambrey R, Kurth I, Peti-Peterdi J, Houillier P, Purkerson JM, Leviel F, Hentschke M, Zdebik AA, Schwartz GJ, Hubner CA, Eladari D. Renal intercalated cells are rather energized by a proton than a sodium pump. Proc Natl Acad Sci USA 110: 7928–7933, 2013. doi: 10.1073/pnas.1221496110. [DOI] [PMC free article] [PubMed] [Google Scholar]
- 7. Zaidman NA, Panoskaltsis-Mortari A, O'Grady SM. Differentiation of human bronchial epithelial cells: role of hydrocortisone in development of ion transport pathways involved in mucociliary clearance. Am J Physiol Cell Physiol 311: C225–C236, 2016. doi: 10.1152/ajpcell.00073.2016. [DOI] [PMC free article] [PubMed] [Google Scholar]
- 8. Srisomboon Y, Ohkura N, Iijima K, Kobayashi T, Maniak PJ, Kita H, O'Grady SM. Airway exposure to polyethyleneimine nanoparticles induces type 2 immunity by a mechanism involving oxidative stress and ATP release. Int J Mol Sci 22: 9071, 2021. doi: 10.3390/ijms22169071. [DOI] [PMC free article] [PubMed] [Google Scholar]
- 9. In JG, Foulke-Abel J, Clarke E, Kovbasnjuk O. Human colonoid monolayers to study interactions between pathogens, commensals, and Host Intestinal Epithelium. J Vis Exp 146: 10.3791/59357, 2019. doi: 10.3791/59357. [DOI] [PMC free article] [PubMed] [Google Scholar]
- 10. Johnson K, Yin J, In JG, Kulkarni S, Pasricha P, Tse CM, Donowitz M. Cholinergic-induced anion secretion in murine jejunal enteroids involves synergy between muscarinic and nicotinic pathways. Am J Physiol Cell Physiol 319: C321–C330, 2020. doi: 10.1152/ajpcell.00179.2020. [DOI] [PMC free article] [PubMed] [Google Scholar]
- 11. Shi M, McCracken KW, Patel AB, Zhang W, Ester L, Valerius MT, Bonventre JV. Human ureteric bud organoids recapitulate branching morphogenesis and differentiate into functional collecting duct cell types. Nat Biotechnol. In press. doi: 10.1038/s41587-022-01429-5. [DOI] [PMC free article] [PubMed] [Google Scholar]
- 12. Burg M, Grantham J, Abramow M, Orloff J. Preparation and study of fragments of single rabbit nephrons. Am J Physiol 210: 1293–1298, 1966. doi: 10.1152/ajplegacy.1966.210.6.1293. [DOI] [PubMed] [Google Scholar]
- 13. Carrisoza-Gaytan R, Ray EC, Flores D, Marciszyn AL, Wu P, Liu L, Subramanya AR, Wang W, Sheng S, Nkashama LJ, Chen J, Jackson EK, Mutchler SM, Heja S, Kohan DE, Satlin LM, Kleyman TR. Intercalated cell BKα subunit is required for flow-induced K+ secretion. JCI Insight 5: e130553, 2020. doi: 10.1172/jci.insight.130553. [DOI] [PMC free article] [PubMed] [Google Scholar]
- 14. Mironova E, Bugay V, Pochynyuk O, Staruschenko A, Stockand JD. Recording ion channels in isolated, split-opened tubules. Methods Mol Biol 998: 341–353, 2013. doi: 10.1007/978-1-62703-351-0_27. [DOI] [PMC free article] [PubMed] [Google Scholar]
- 15. Khayyat NH, Zaika O, Tomilin VN, Pyrshev K, Pochynyuk O. Angiotensin II increases activity of the ClC-K2 Cl− channel in collecting duct intercalated cells by stimulating production of reactive oxygen species. J Biol Chem 296: 100347, 2021. doi: 10.1016/j.jbc.2021.100347. [DOI] [PMC free article] [PubMed] [Google Scholar]
- 16. Kortenoeven MLA, Trimpert C, van den Brand M, Li Y, Wetzels JFM, Deen PMT. In mpkCCD cells, long-term regulation of aquaporin-2 by vasopressin occurs independent of protein kinase A and CREB but may involve Epac. Am J Physiol Renal Physiol 302: F1395–F1401, 2012. doi: 10.1152/ajprenal.00376.2011. [DOI] [PubMed] [Google Scholar]
- 17. Kortenoeven MLA, van den Brand M, Wetzels JFM, Deen PMT. Hypotonicity-induced reduction of aquaporin-2 transcription in mpkCCD cells is independent of the tonicity responsive element, vasopressin, and cAMP. J Biol Chem 286: 13002–13010, 2011. doi: 10.1074/jbc.M110.207878. [DOI] [PMC free article] [PubMed] [Google Scholar]
- 18. Rein JL, Heja S, Flores D, Carrisoza-Gaytan R, Lin NYC, Homan KA, Lewis JA, Satlin LM. Effect of luminal flow on doming of mpkCCD cells in a 3D perfusable kidney cortical collecting duct model. Am J Physiol Cell Physiol 319: C136–C147, 2020. doi: 10.1152/ajpcell.00405.2019. [DOI] [PMC free article] [PubMed] [Google Scholar]
- 19. Staruschenko A, Pochynyuk O, Vandewalle A, Bugaj V, Stockand JD. Acute regulation of the epithelial Na+ channel by phosphatidylinositide 3-OH kinase signaling in native collecting duct principal cells. J Am Soc Nephrol 18: 1652–1661, 2007. doi: 10.1681/ASN.2007010020. [DOI] [PubMed] [Google Scholar]
- 20. Nagalakshmi VK, Yu J. The ureteric bud epithelium: morphogenesis and roles in metanephric kidney patterning. Mol Reprod Dev 82: 151–166, 2015. doi: 10.1002/mrd.22462. [DOI] [PMC free article] [PubMed] [Google Scholar]
- 21. Wall SM, Verlander JW, Romero CA. The renal physiology of pendrin-positive intercalated cells. Physiol Rev 100: 1119–1147, 2020. doi: 10.1152/physrev.00011.2019. [DOI] [PMC free article] [PubMed] [Google Scholar]
- 22. Mukherjee M, deRiso J, Otterpohl K, Ratnayake I, Kota D, Ahrenkiel P, Chandrasekar I, Surendran K. Endogenous notch signaling in adult kidneys maintains segment-specific epithelial cell types of the distal tubules and collecting ducts to ensure water homeostasis. J Am Soc Nephrol 30: 110–126, 2019. doi: 10.1681/ASN.2018040440. [DOI] [PMC free article] [PubMed] [Google Scholar]
- 23. Jeong H-W, Jeon US, Koo B-K, Kim W-Y, Im S-K, Shin J, Cho Y, Kim J, Kong Y-Y. Inactivation of Notch signaling in the renal collecting duct causes nephrogenic diabetes insipidus in mice. J Clin Invest 119: 3290–3300, 2009. doi: 10.1172/JCI38416. [DOI] [PMC free article] [PubMed] [Google Scholar]
- 24. Blomqvist SR, Vidarsson H, Fitzgerald S, Johansson BR, Ollerstam A, Brown R, Persson AEG, Bergstrom GG, Enerback S. Distal renal tubular acidosis in mice that lack the forkhead transcription factor Foxi1. J Clin Invest 113: 1560–1570, 2004. doi: 10.1172/JCI20665. [DOI] [PMC free article] [PubMed] [Google Scholar]
- 25. Barone S, Zahedi K, Brooks M, Henske EP, Yang Y, Zhang E, Bissler JJ, Yu JJ, Soleimani M. Kidney intercalated cells and the transcription factor FOXi1 drive cystogenesis in tuberous sclerosis complex. Proc Natl Acad Sci USA 118: e2020190118, 2021. doi: 10.1073/pnas.2020190118. [DOI] [PMC free article] [PubMed] [Google Scholar]
- 26. Enerback S, Nilsson D, Edwards N, Heglind M, Alkanderi S, Ashton E, Deeb A, Kokash FEB, Bakhsh ARA, Van't Hoff W, Walsh SB, D'Arco F, Daryadel A, Bourgeois S, Wagner CA, Kleta R, Bockenhauer D, Sayer JA. Acidosis and deafness in patients with recessive mutations in FOXI1. J Am Soc Nephrol 29: 1041–1048, 2018. doi: 10.1681/ASN.2017080840. [DOI] [PMC free article] [PubMed] [Google Scholar]
- 27. Vidarsson H, Westergren R, Heglind M, Blomqvist SR, Breton S, Enerback S. The forkhead transcription factor Foxi1 is a master regulator of vacuolar H-ATPase proton pump subunits in the inner ear, kidney and epididymis. PLoS One 4: e4471, 2009. doi: 10.1371/journal.pone.0004471. [DOI] [PMC free article] [PubMed] [Google Scholar]
- 28. Blomqvist SR, Vidarsson H, Soder O, Enerback S. Epididymal expression of the forkhead transcription factor Foxi1 is required for male fertility. EMBO J 25: 4131–4141, 2006. doi: 10.1038/sj.emboj.7601272. [DOI] [PMC free article] [PubMed] [Google Scholar]
- 29. Kurth I, Hentschke M, Hentschke S, Borgmeyer U, Gal A, Hubner CA. The forkhead transcription factor Foxi1 directly activates the AE4 promoter. Biochem J 393: 277–283, 2006. doi: 10.1042/BJ20051094. [DOI] [PMC free article] [PubMed] [Google Scholar]
- 30. Plasschaert LW, Zilionis R, Choo-Wing R, Savova V, Knehr J, Roma G, Klein AM, Jaffe AB. A single-cell atlas of the airway epithelium reveals the CFTR-rich pulmonary ionocyte. Nature 560: 377–381, 2018. doi: 10.1038/s41586-018-0394-6. [DOI] [PMC free article] [PubMed] [Google Scholar]
- 31. Zaidman NA, Tomilin VN, Hassanzadeh Khayyat N, Damarla M, Tidmore J, Capen DE, Brown D, Pochynyuk OM, Pluznick JL. Adhesion-GPCR Gpr116 (ADGRF5) expression inhibits renal acid secretion. Proc Natl Acad Sci USA 117: 26470–26481, 2020. doi: 10.1073/pnas.2007620117. [DOI] [PMC free article] [PubMed] [Google Scholar]
- 32. Fejes-Toth G, Naray-Fejes-Toth A. Differentiation of renal beta-intercalated cells to alpha-intercalated and principal cells in culture. Proc Natl Acad Sci USA 89: 5487–5491, 1992. doi: 10.1073/pnas.89.12.5487. [DOI] [PMC free article] [PubMed] [Google Scholar]
- 33. Miller RL, Zhang P, Smith M, Beaulieu V, Paunescu TG, Brown D, Breton S, Nelson RD. V-ATPase B1-subunit promoter drives expression of EGFP in intercalated cells of kidney, clear cells of epididymis and airway cells of lung in transgenic mice. Am J Physiol Cell Physiol 288: C1134–C1144, 2005. doi: 10.1152/ajpcell.00084.2004. [DOI] [PubMed] [Google Scholar]
Associated Data
This section collects any data citations, data availability statements, or supplementary materials included in this article.
Data Availability Statement
Data will be made available upon reasonable request.