

Abstract
Four high spin Fe(III) macrocyclic complexes, including three dinuclear and one mononuclear complex, were prepared towards the development of more effective iron-based MRI contrast agents. All four complexes contain a 1,4,7-triazacyclononane macrocyclic backbone with two hydroxypropyl pendant groups, an ancillary aryl or biphenyl group and a coordination site for a water ligand. The pH potentiometric titrations support one or two deprotonations of the complexes, most likely deprotonation of hydroxypropyl groups at near neutral pH. Variable temperature 17O NMR studies suggest that the inner-sphere water ligand is slow to exchange with bulk water on the NMR time scale. Water proton T1 relaxation times measured for solutions of the Fe(III) complexes at pH 7.2 showed that the dinuclear complexes have a 2–3-fold increase in r1 relaxivity in comparison to the mononuclear complex per molecule at field strengths ranging from 1.4 T to 9.4 T. The most effective agent, a dinuclear complex with macrocycles linked through para-substitution of an aryl group (Fe2(PARA)), has an r1 of 6.7 mM−1s−1 at 37 °C and 4.7 T or 3.3 mM−1s−1 per iron center in the presence of serum albumin and shows enhanced blood pool and kidney contrast in mice MRI studies.
INTRODUCTION
Efforts are underway to develop paramagnetic transition metal complexes as alternatives to the Gd(III) based T1 MRI contrast agents that are currently used in clinical diagnostic procedures. It is challenging to develop alternatives, considering that Gd(III) complexes have been successfully employed as contrast agents for the past three decades.1–3 Effective proton relaxation by Gd(III) complexes is attributed to their seven unpaired electrons (S = 7/2), their relatively slow electronic relaxation attributed to their symmetric S electronic ground state, and rapid inner-sphere water exchange (kex = 106-109 s−1).1, 4 Clinically used agents may contain macrocyclic or linear polyaminocarboxylate chelates of Gd(III).3, 5 Yet, recent concern over the retention of Gd(III) in the brain, bones and skin of patients has motivated the development of transition metal contrast agents as alternatives.6–8 High spin Mn(II) or Fe(III) complexes are logical alternatives based on their five unpaired electrons (S = 5/2), relatively slow electronic relaxation9–12 and natural occurrence in the human body. Mn(III) complexes, as additional alternatives, have fewer unpaired electrons but have been shown to produce effective proton relaxivity, especially in porphyrin complexes.13–15 While Mn-based agents have been the central focus of research in the search for alternatives, there has been comparatively little focus on iron coordination complexes.8 Early studies on Fe(III) agents showed that simple chelate complexes produced lowered proton relaxation in solution and correspondingly less contrast in animals compared to Gd(III) based contrast agents.16–18 Moreover, many Fe(III) complexes feature notoriously complicated aqueous solution chemistry and complexes are often not sufficiently soluble for use as MRI contrast agents. For example, a recent study shows the formation of dimeric μ-hydroxy Fe(III) complexes in solution that have reduced r1 relaxivity.19 Other examples of Fe(III) agents require the addition of cosolvents to solubilize the complexes for solution studies20 or have low stability under physiological conditions including neutral pH.21–23
Water ligand interactions in Fe(III) complexes are another challenging feature to incorporate into the design of contrast agents. Inner-sphere, second-sphere and outer-sphere water interactions may play an important role in proton relaxation for T1 contrast agents, although the focus for Gd(III) and Mn(II) complexes has been on inner-sphere water exchange.24–29 Seven-coordinate Fe(III) complexes have been shown to have inner-sphere water ligands that have exchange rate constants of 106-107 s−1, somewhat lower than those of Gd(III) agents.30–32 Such seven-coordinate Fe(III) complexes with polyaminocarboxylate ligands such as 1,2-transcyclohexane diamine tetraacetic acid (t-CDTA)16, 33 or analogs32 have been recently studied as MRI contrast agents. Other examples of Fe(III) coordination complexes, including those of N,N’-bis(2-hydroxyphenyl)ethylene diamine-N,N’-diacetic acid (HBED)18, 34, 35 and derivatives with phosphonate pendants in lieu of carboxyl pendants lack a bound water ligand and are thought to function through second-sphere and outer-sphere water interactions.34 Significantly, complexes with groups that may increase second-sphere water interactions such as phosphonate or produce proton exchange through protons of hydroxyl pendants, show improved r1 relaxivity.36, 37
Research in our laboratories has focused on 1,4,7-triazacyclononane (TACN) macrocyclic complexes of Fe(III) that contain hydroxypropyl pendants.38–40 The TACN macrocycle stabilizes the Fe(III) oxidation state and hydroxypropyl pendants on TACN combine to produce a high spin Fe(III) center. The hydroxypropyl groups also serve as a source of protons for exchange with bulk water and for interaction with second-sphere water molecules. These six-coordinate complexes contain an inner-sphere water, but produce little line broadening or shift of the 17O resonance of bulk water as shown by variable temperature NMR studies.30, 38, 40 Despite the fact that these complexes do not have an rapidly exchanging inner-sphere water ligand, promising r1 relaxivity in serum phantoms at 4.7 T, 37 °C is observed with values that match that of Magnevist (Gd(DTPA)). In vivo, one of the complexes, (Fe(TOB) in Scheme 1), shows strong enhancement of contrast in kidneys and blood pool.40 Given the advantages of macrocyclic ligands for controlling Fe(III) solution chemistry and imparting kinetic inertness to dissociation as well as the need for agents with higher relaxivity, we decided to test whether linking two Fe(III) centers would give improved contrast while maintaining good solubility in aqueous solution. Linking together multiple chelates has produced Gd(III) and Mn(II) complexes with effective proton relaxivity. The enhanced relaxivity is attributed to the larger number of paramagnetic centers and from the decrease in rotational correlation time which is dependent on both the shape and size of the multimeric molecule.41–45 This approach has not been reported, to the best of our knowledge, for Fe(III) macrocyclic complexes that have well-defined solution chemistry, but has recently been reported for Fe(III) complexes that are t-CDTA derivatives.33 Contrast agents that have been reported to date that contain more than one Fe(III) center are typically polymeric agents or cluster complexes with poorly defined solution chemistry and solubility. 46, 47
Scheme 1.

Fe(III) complexes studied as MRI contrast agents. The predominate species is that predicted at neutral pH as based on pH-potentiometric titrations.
To date, we have only reported relaxivity studies of Fe(III) T1 MRI probes at the relatively high magnetic field strength of 4.7 T. Notably, many small animal MRI scanners have higher field strengths (4.7, 7.0 or 9.4 T) than those used in human procedures (1.5 to 3.0 T). To address this discrepancy, solution studies were undertaken here at a lower field strength of 1.4 T to more closely match that of human MRI scanners. This is an especially important experiment for Fe(III) complexes, as calculations have predicted a field strength dependence of proton relaxation that diverges from that of Mn(II) and Gd(III) at intermediate to high magnetic field strengths.48–52
Here we show that macrocyclic ligands with hydroxypropyl pendants bind multiple Fe(III) centers to produce complexes with straightforward solution chemistry, good solubility, and robust kinetic inertness. One of the goals of these studies was to determine whether the dinuclear Fe(III) complexes would produce higher relaxivity in solution as well as show improved MRI contrast enhancement in mice.
RESULTS
The macrocyclic ligands studied here were prepared in a four-step synthetic procedure (Scheme 2). The two TACN macrocycles were linked through monoalkylation of two ortho-amide protected macrocycles, with precipitation of the dicationic precursor following a well-known procedure.53–56 Deprotection of the macrocycles followed by treatment with S-propylene oxide produced three new ligands for dinuclear complexes, including H-PARA, H-META and H-DIP. The H-TOLPO ligand was synthesized to prepare a mononuclear Fe(III) analog for comparison with the dinuclear complexes in solution studies. Spectroscopic data for ligands and complexes is shown in Figures S.1-S.12. All ligands were designed to provide five donor groups to coordinate and leave a sixth site for binding a water ligand.
Scheme 2.
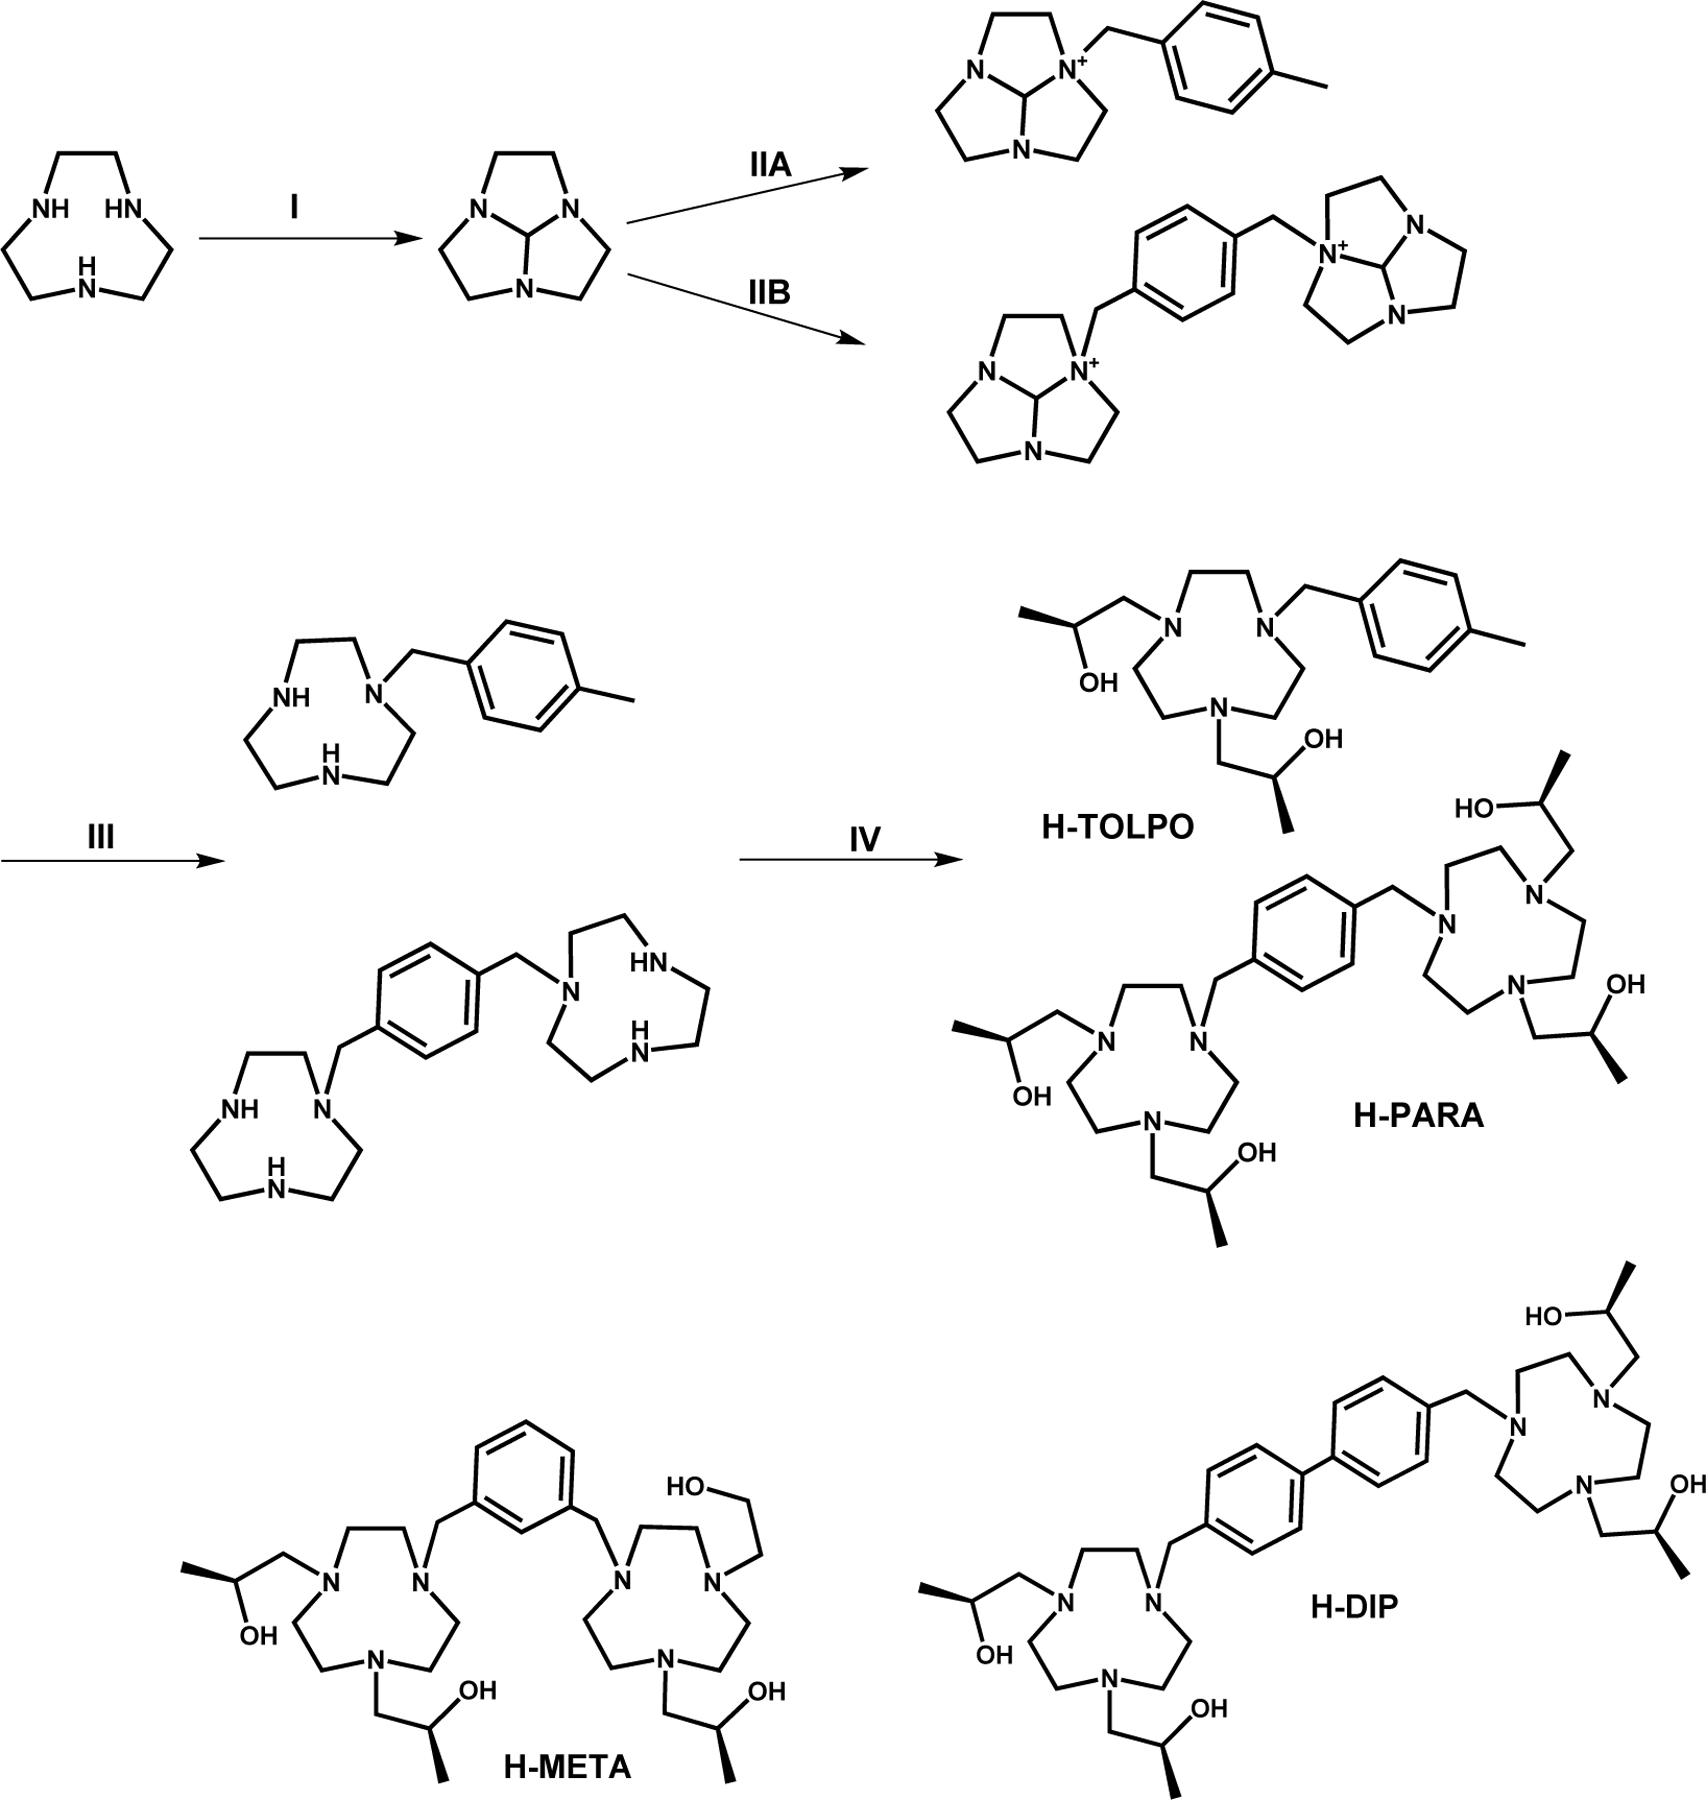
Synthesis of H-TOLPO and H-PARA showing routes for mononuclear (A) and dinuclear ligands (B). H-DIP and H-META were prepared in a similar procedure. (I) N,N-dimethylformamide dimethylacetal, (IIA) 4-methylbenzyl bromide (IIB) α, α’-dibromo-p-xylene (III) NaOH, (IV) S-propylene oxide.
The Fe(III) complexes were prepared by stirring the ligands with ferrous chloride salts in ethanol in the presence of air. The dinuclear Fe(III) complexes and the mononuclear Fe(III) complexes were isolated as chloride salts. Analysis of the complexes was consistent with the formulation of [Fe(L)Cl]Cl and [Fe2(L)Cl2]Cl2 for mononuclear and dinuclear complexes, respectively. The effective magnetic moment values (ueff) ranged from 5.6–5.9 per iron as measured by Evans method in aqueous solution, and were consistent with two high spin Fe(III) centers (Table S1).
Alternative methods to form Fe(III) complexes were unsuccessful. For example, treatment of the TOB ligand with one equivalent of Fe(III) salts in ethanolic solution produced a mixture of free ligand and complex. Rather, the complexes were best prepared by treatment of the neutral ligands with Fe(II) salts in organic solvent, followed by oxidation in solution exposed to air as described above. Moreover, complexes do not form to any measurable extent upon incubation of one equivalent of FeCl3 with the ligand TOB in water at the requisite conditions used in pH potentiometric titrations. Thus, incubation of solutions at 25 °C containing 1.0 mM ligand and 1.0 mM FeCl3 at pH 3, 5 or 7 over a period of 1 hour or 18 hours did not produce measurable amount of complex as assessed by using mass spectrometry (Figures S13-S15). This suggests that the Fe(III) complexes have small formation constants in aqueous solution. Once formed, however, the Fe(III) complexes are inert to dissociation as discussed below.
The solution chemistry of the intact Fe(III) macrocyclic complexes was studied by using pH potentiometric titrations (Figures S.16-S.19). Fitting of the data to equations given in the supplementary section (Table S2) gives the protonation constants given as pKa values for the complexes as presented in Table 1. For these experiments the intact, fully formed complexes were titrated with hydroxide from pH 3 to 11. The complexes had one to two deprotonations over the pH range of 3 to 11. The Fe(TOLPO) complex showed a single deprotonation with a pKa of 6.3 which is assigned to a hydroxypropyl group based on comparisons to previously reported complexes.38 Dinuclear complexes Fe2(PARA), Fe2(META) and Fe2(DIP) showed similar deprotonation constants with one at slightly acidic pH (6.6) and one at slightly basic pH (7.8–7.9). Assignment of these deprotonations to the hydroxypropyl groups and not the water ligands is based on comparison to analogous Fe(III) complexes that lack an inner-sphere water38, 40 although we cannot rule out deprotonation of the water ligand. Based on this data, the predominant species at pH 7.4 are proposed in Scheme 1.
Table 1.
The protonation constants of the Fe(III) complexes and their 1-octanol water partition coefficients. Equilibrium expressions are listed in supplementary section.
| Compound | pKa1 | pKa2 | log P |
|---|---|---|---|
| Fe(TOB)a | 7.1 ± 0.06 | --- | −0.13 |
| Fe(TOLPO) | 6.3±0.02 | --- | −0.32 ± 0.04 |
| Fe2(META) | 7.0±0.24 | 7.7±0.25 | −1.68 ± 0.09 |
| Fe2(PARA) | 6.6±0.06 | 7.9±0.11 | −1.48 ± 0.35 |
| Fe2(DIP) | 6.6±0.08 | 7.8±0.05 | −1.24 ± 0.08 |
From reference 40
The lipophilicity of the complexes was assessed by calculating the octanol/water partition coefficients (log P in Table 1.). Dinuclear complexes had similar log P values that ranged from −1.7 to −1.3. In contrast, the mononuclear complexes Fe(TOB) and Fe(TOLPO) were more lipophilic as represented by log P values closer to zero. The increased lipophilicity is consistent with the higher cationic charge on the dinuclear complexes in comparison to the mononuclear complexes.
The electronic absorbance spectra of the complexes showed characteristic peaks at 330 nm that were used to monitor the kinetic inertness of the complexes. The extinction coefficients ranged from 2800 M−1cm−1 to 4500 M−1cm−1 and are similar to those measured previously for mononuclear Fe(III) complexes with hydroxyalkyl pendants. This absorbance is attributed to a ligand to metal charge transfer band (Figures S.20-S.23) based on comparison to electronic absorbances of Fe(III) complexes with alkoxide ligands.57 In acidic solutions the complexes had distinctive absorbance bands at 250 nm which decreased in intensity in neutral solutions. The Fe2(DIP) complex had a characteristic biphenyl absorbance peak at 260 nm which dominated the electronic spectra.
The resistance of the complexes to dissociation was characterized by monitoring the absorbance peaks at 330 nm. None of the complexes showed measurable dissociation in 100 mM HCl over 4 hours. The dissociation percentages over 72 hours in 100 mM HCl were in the range of 18% to 63% (Table S.3.) The equilibrium condition is complete complex dissociation under these conditions as shown for the Fe(TOB) complex (Figures S13-S15). The complexes did not dissociate measurably over a 72-hour period in solutions containing biologically relevant concentrations of hydrogen carbonate (25 mM), phosphate (0.4 mM) or in HEPES buffer at pH 7.2.
Our previous studies with Fe(TOB) and analogs showed that these TACN based complexes are six coordinate.40 The sixth ligand, initially a chloride or bromide from the ferrous salt used as reagent, is displaced by water in aqueous solutions. Similarly, we anticipate that the Fe(III) complexes studied here will substitute a bound chloride with a water ligand. However, to contribute optimally to increased T1 water proton relaxation, the exchange of the bound water with bulk water is typically in the range of 106-108 s−1.37, 48 We used variable temperature 17O NMR experiments as the classic method for characterization of water ligand exchange at paramagnetic metal ion centers.30, 58
Exchange rate constants of water ligands with bulk water for paramagnetic complexes are typically obtained by fitting the inverse of the natural logarithm of the reduced transverse relaxation rate constant for 17O resonance of water as a function of temperature.59 The transverse relaxation rate constants are determined by measuring the 17O water resonance peak width in the presence of the paramagnetic complex compared to that of a reference 17O water resonance. Data is plotted and fit to the Swift-Connick equations.59, 60 Such a plot is shown in Figure S24 for Fe(CDTA) with the data fit to obtain a kex of 3.7 × 10⁷ s−1. Our results are somewhat similar to those reported earlier,30, 61 with small differences attributed to the lower concentration and higher pH of our studies (4 mM complex, pH 7) compared to previous studies (20 mM complex, pH 4).
In contrast, the Fe(III) macrocyclic complexes studied here did not produce substantial broadening of the 17O resonance. To illustrate the lack of line broadening, the transverse relaxation (1/T2o) rate constants are compared with established complexes that have an inner-sphere water or have no inner-sphere water. The rate constants were normalized to metal complex concentration to give the 17O transverse relaxivity (r2O relaxivity) and plotted as a function of temperature in Figure 1. Data for Fe2(PARA), Fe2(META) and Fe(TOLPO) complexes are plotted along with the standards. Notably, none of the macrocyclic Fe(III) complexes show r2O values that approach that of Fe(CDTA) which has a bound water, but rather match closely to that of Fe(DTPA) which lacks an exchangeable water. The minimal line broadening also matches that of an analogous six-coordinate Fe(III) complex with three hydroxypropyl groups and no bound water.38 The largest 17O NMR resonance broadening for the macrocyclic complexes was observed for Fe(TOB) with a value that was 15% of that of Fe(CDTA) at neutral pH. Fe2(PARA) complex had a value of 0.64 % of the Fe(CDTA) complex, whereas Fe2(META) complex produced a transverse 17O relaxivity that was 7.1% of Fe(CDTA). These data suggest that none of the dinuclear complexes studied here have an integral number of inner-sphere water molecules that exchange with bulk solvent on the 17O NMR time scale. Rather, it is likely that the small 17O resonance broadening is due to second-sphere water interactions or a fractional bound water. This feature is consistent with a strongly bound inner-sphere water molecule or, alternatively, a bound hydroxide. However, as noted above, the pKa values are most consistent with a deprotonated hydroxypropyl group rather than a deprotonated water ligand.
Figure 1.
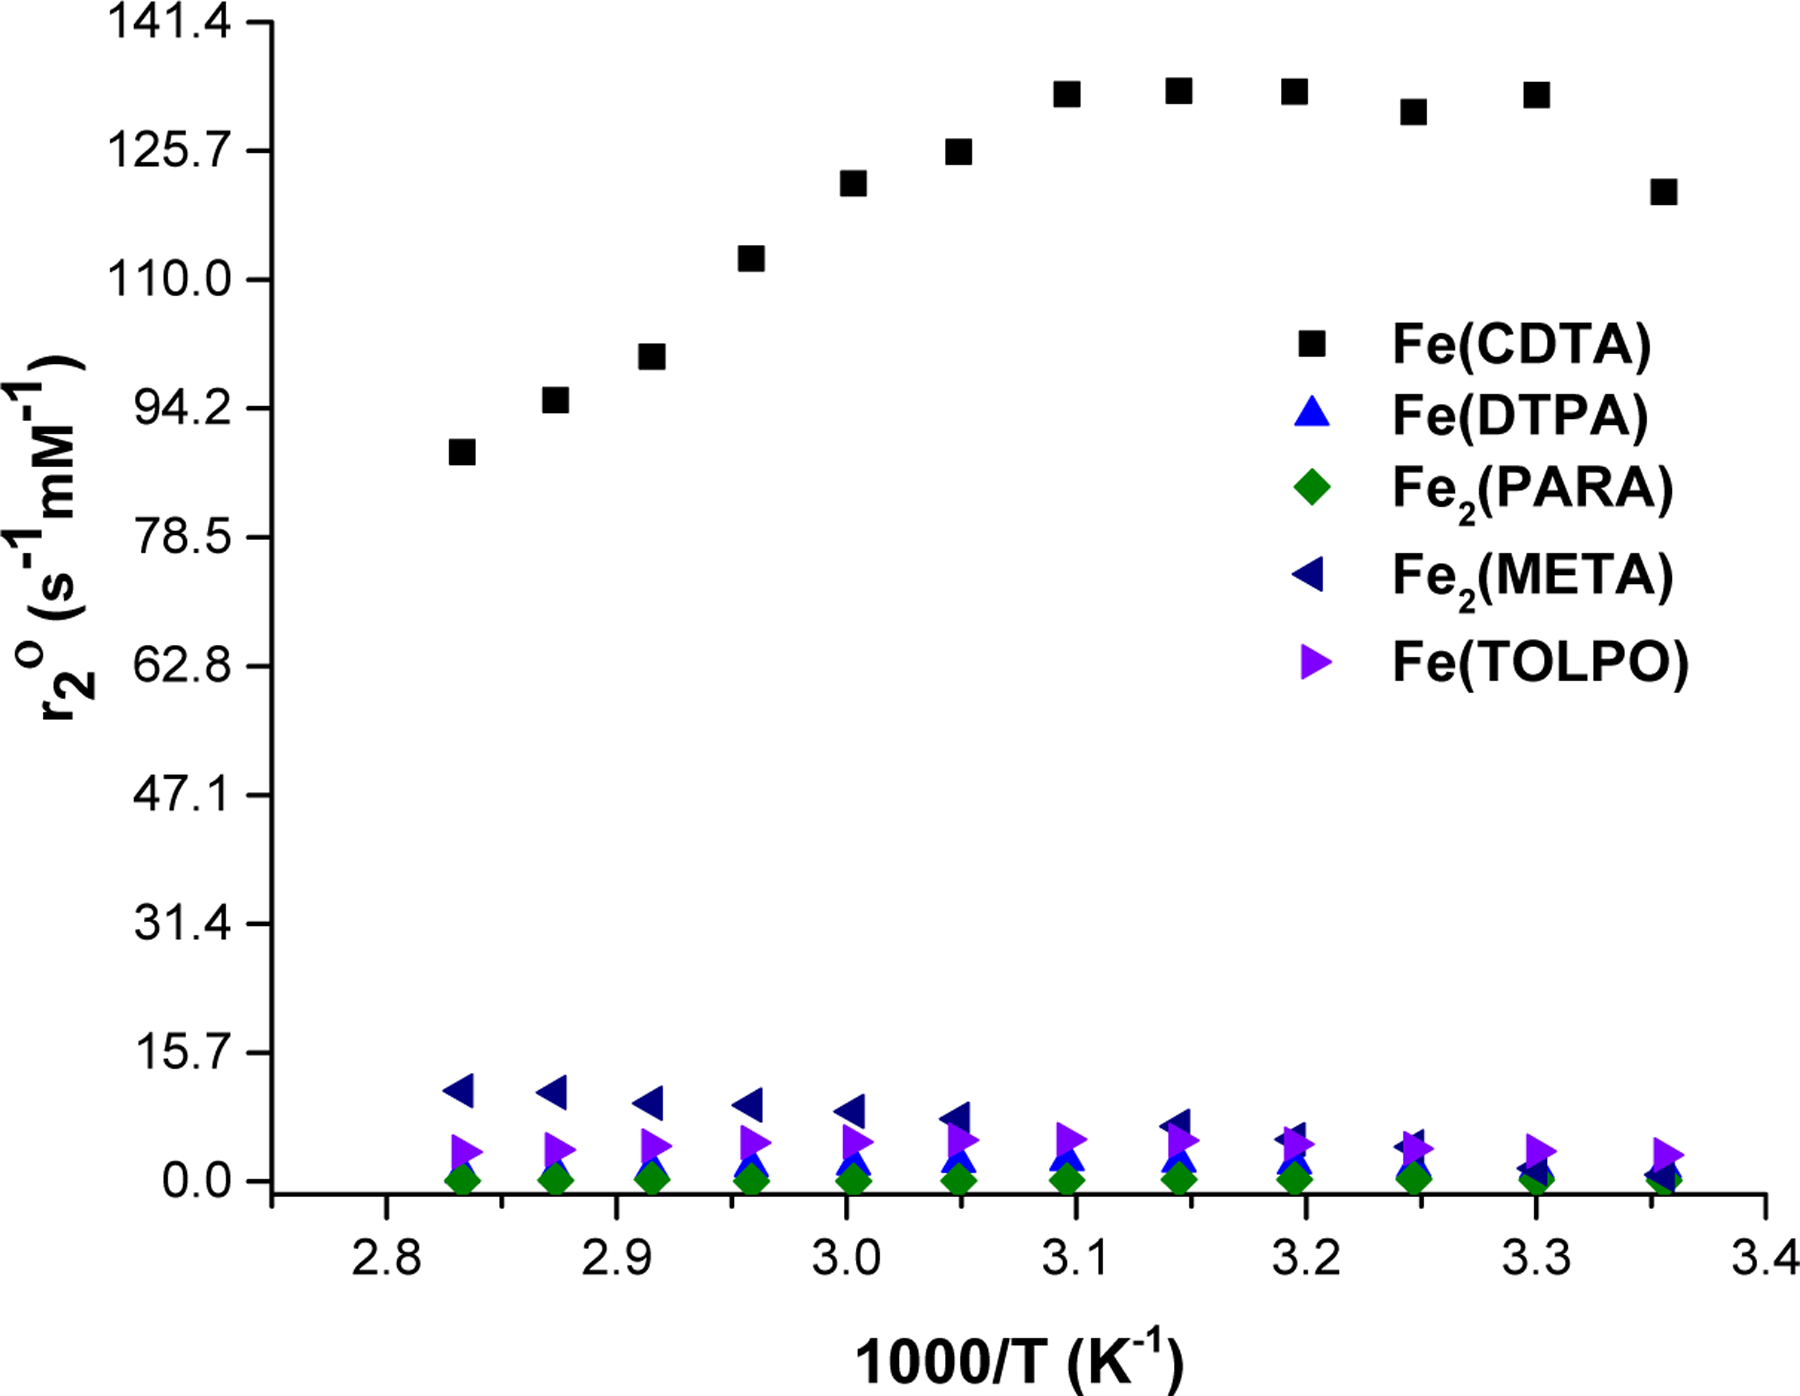
Comparison of 17O‐NMR transverse relaxivity (r2O) for Fe(TOLPO), Fe2(PARA), Fe2(META), Fe(DTPA), Fe(CDTA)40 at pH 6.8 as a function of temperature.
The T1 and T2 proton relaxation times of the Fe(III) complexes were recorded with and without human serum albumin (HSA) in HEPES buffer, 0.100 M NaCl at several magnetic field strengths including 1.4 T at 34 °C, 4.7 T and 9.4 T at 37 °C. Relaxivity (r1 or r2) values were obtained as slopes of 1/T1 or 1/T2 rate constants as a function of Fe(III) complex concentration (Figures S.25-S.29 and Table 2). The dinuclear complexes showed higher relaxivity than mononuclear complexes at all magnetic field strengths on a per molecule basis. Moreover, the Fe2(PARA) complex showed higher r1 relaxivity on a per Fe basis than mononuclear complexes Fe(TOLPO) and Fe(TOB). The relaxivity of the Fe(TOLPO) complex was similar to that of the Fe(TOB) complex on 4.7 T MRI scanner, suggesting that the methyl group does not significantly lower relaxivity, unlike substituents that are electron withdrawing.39, 40 Data for the clinically used contrast agents, Gd(DOTA) (DOTAREM) or Gd(DTPA) (Magnevist), are shown for comparison and match those reported previously.62 Notably, the Gd(III) complexes demonstrated decreasing r1 relaxivity values upon increasing the magnetic field from 1.4 to 9.4 T. In contrast, the relaxivity values of Fe(III) complexes generally increased by 20–30% on going from 1.4 to 4.7 T with a smaller increase on going to 9.4 T.
Table 2.
Proton r1 and r2 relaxivity values for Fe(III) complexes compared to Gd(III) complexes with or without human serum albumin (HSA) on a per molecule basis.
| Complex | r1 (mM−1s−1) 1.4T | r1 (mM−1s−1) 4.7T | r1 (mM−1s−1) 9.4T | r2 (mM−1s−1) 4.7T | r1 (mM−1s−1) in HSA 4.7T | r2 (mM−1s−1) in HSA 4.7T | r1(mM−1s−1) increase HSA 4.7T |
|---|---|---|---|---|---|---|---|
| Fe(TOB)a | ------ | 2.2 ± 0.30 | ------ | 4.5 ± 1.1 | 2.5 ± 0.10 | 4.2 ± 0.70 | 1.14 |
| Fe(TOLPO) | 1.51 ± 0.12 | 1.83 ± 0.31 | 2.39 ± 0.30 | 5.81 ± 0.98 | 2.71 ± 0.17 | 4.32 ± 0.12 | 1.48 |
| Fe2(META) | 3.08 ± 0.08 | 4.06 ± 0.33 | 4.15 ± 0.56 | 13.70 ± 0.42 | 6.56 ± 0.46 | 8.85 ± 2.02 | 1.62 |
| Fe2(PARA) | 3.49 ± 0.29 | 5.26 ± 0.07 | 4.92 ± 0.26 | 13.44 ± 0.71 | 6.71 ± 0.04 | 11.90 ± 0.42 | 1.28 |
| Fe2(DIP) | 3.18 ± 0.28 | 4.36 ± 0.50 | 5.90 ± 0.28 | 10.93 ± 1.00 | 5.82 ± 0.50 | 7.56 ± 0.14 | 1.34 |
| Gd(DTPA) | 3.4 ± 0.10 | 3.1 ± 0.31 | 2.88 ± 0.54 | 3.9 ± 0.39 | 3.2 ± 0.32 | 4.0 ± 0.40 | 1.03 |
| Gd(DOTA) | 3.1 ± 0.30 | 2.8(2.7–2.9)b | 2.89 ± 0.13 | 3.7 (3.5–3.9)b | ------ | ------ | ------ |
Proton relaxivity for Fe(III) complexes in 100 mM NaCl, 20 mM HEPES buffer, pH 7.2 whereas Gd(III) complexes contained only meglumine excipient. Studies at 4.7 T and 9.4 T were conducted at 37 °C, whereas studies at 1.4 T were at 33 °C. a. from reference 40
The r1 values for the iron complexes increased in solutions containing HSA by 1.2 to 1.6-fold, consistent with binding to the serum protein. Binding of the dinuclear Fe2(PARA) complex and the mononuclear complexes, Fe(TOLPO) and Fe(TOB) to HSA was further studied by using an ultrafiltration method that is commonly used for Gd(III) based MRI contrast agents.63 Solutions containing 0.40 mM Fe(III) complex, variable HSA concentrations from 0.050 mM to 2.0 mM, HEPES buffer and salt were incubated at 37 °C for 30 minutes. After the solutions were centrifuged in ultrafiltration tubes, the unbound Fe(III) complex concentration was calculated by analyzing Fe content by using ICP-MS. The data were fit to a one site specific binding equation (Eq. 4, Figure 2) or a multiple binding site equation with Hill coefficient (Eq. 5, Figure S30). Fitting of the data to the single-site binding equation yielded correlation coefficients higher than 0.98 for the mononuclear complexes. This supports a single strong binding site for the Fe(III) complexes to HSA, although we cannot rule out more complicated interactions. For example, data for the Fe2(PARA) complex also showed a good fit to two-site binding (Figure S26). Further studies such as dye displacement studies would be necessary to distinguish between these possible stoichiometries and to gauge the site of binding. Association constants from these fits to binding isotherms are given in Table 3 and in Table S4.
Figure 2.
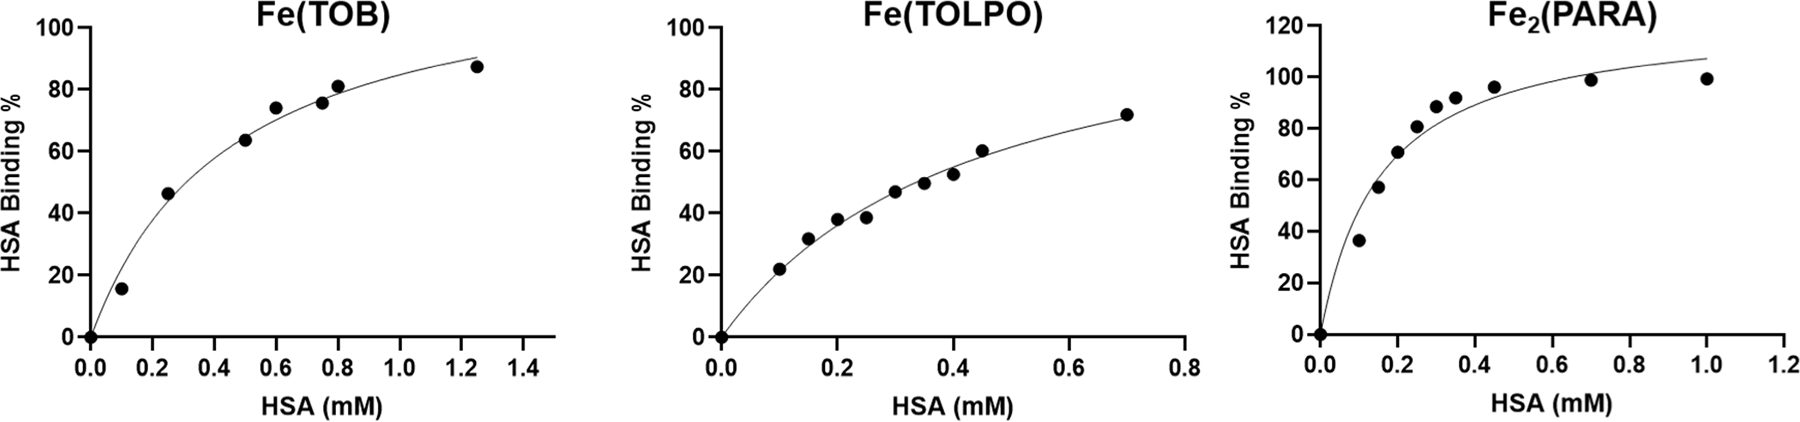
The HSA binding isotherms for Fe(TOB), Fe(TOLPO) and Fe2(PARA) at 0.40 mM, Ph 7.2 in HEPES, 37 °C. The solid line is fit to a binding isotherm described by Eq. 4.
Table 3.
Binding constants and percentage bound for 0.40 mM Fe(III) complex to serum albumin (4.5% w/v) at pH 7.2, 37 °C.
| Compound | HSA % | Ka | R2 |
|---|---|---|---|
| Fe(TOB) | 75 ± 4 | 2.2 × 10³ | 0.9886 |
| Fe(TOLPO) | 71 ± 2 | 2.3 × 10³ | 0.9912 |
| Fe2(PARA) | 98.8 ± 0.5 | 6.3 × 10³ | 0.9629 |
| Fe2(META) | 80.5 ± 0.4 | - | - |
| Fe2(DIP) | 95 ± 2 |
Based on these data, Fe2(PARA) binds three-fold more strongly to serum albumin than either of the mononuclear complexes, Fe(TOB) or Fe(TOLPO). For the other two dinuclear complexes, Fe2(META) and Fe2(DIP), the calculated percentages of complex bound to HSA in solutions containing 4.5% HSA (w/v) and 0.400 mM complex were measured and reported in Table 3. These data suggest that all complexes are mostly protein bound under physiological concentrations of serum albumin.
Fe2(PARA) was chosen for studies in mice on a 4.7 T MRI scanner, based on its higher r1 relaxivity compared to other dinuclear complexes. Balb/c mice were injected via tail vein with solutions containing 0.025 mmol/kg molecule or 0.050 mmol/kg Fe. MRI was used to monitor the pharmacokinetic biodistribution and clearance over 4 hours. The T1-weighted images of kidneys and urinary bladder at pre-injection, and 40 minutes or 4 hours post-injection with Fe2(PARA) are shown in Figure 3. Significantly higher kidney enhancement of contrast was obtained at 40 minutes post-injection time. At 40 minutes, elimination was detected with the distinctive enhancement in urinary bladder. After 4 hours, nearly complete clearance of the complex from kidneys was observed (Figure S31).
Figure 3.
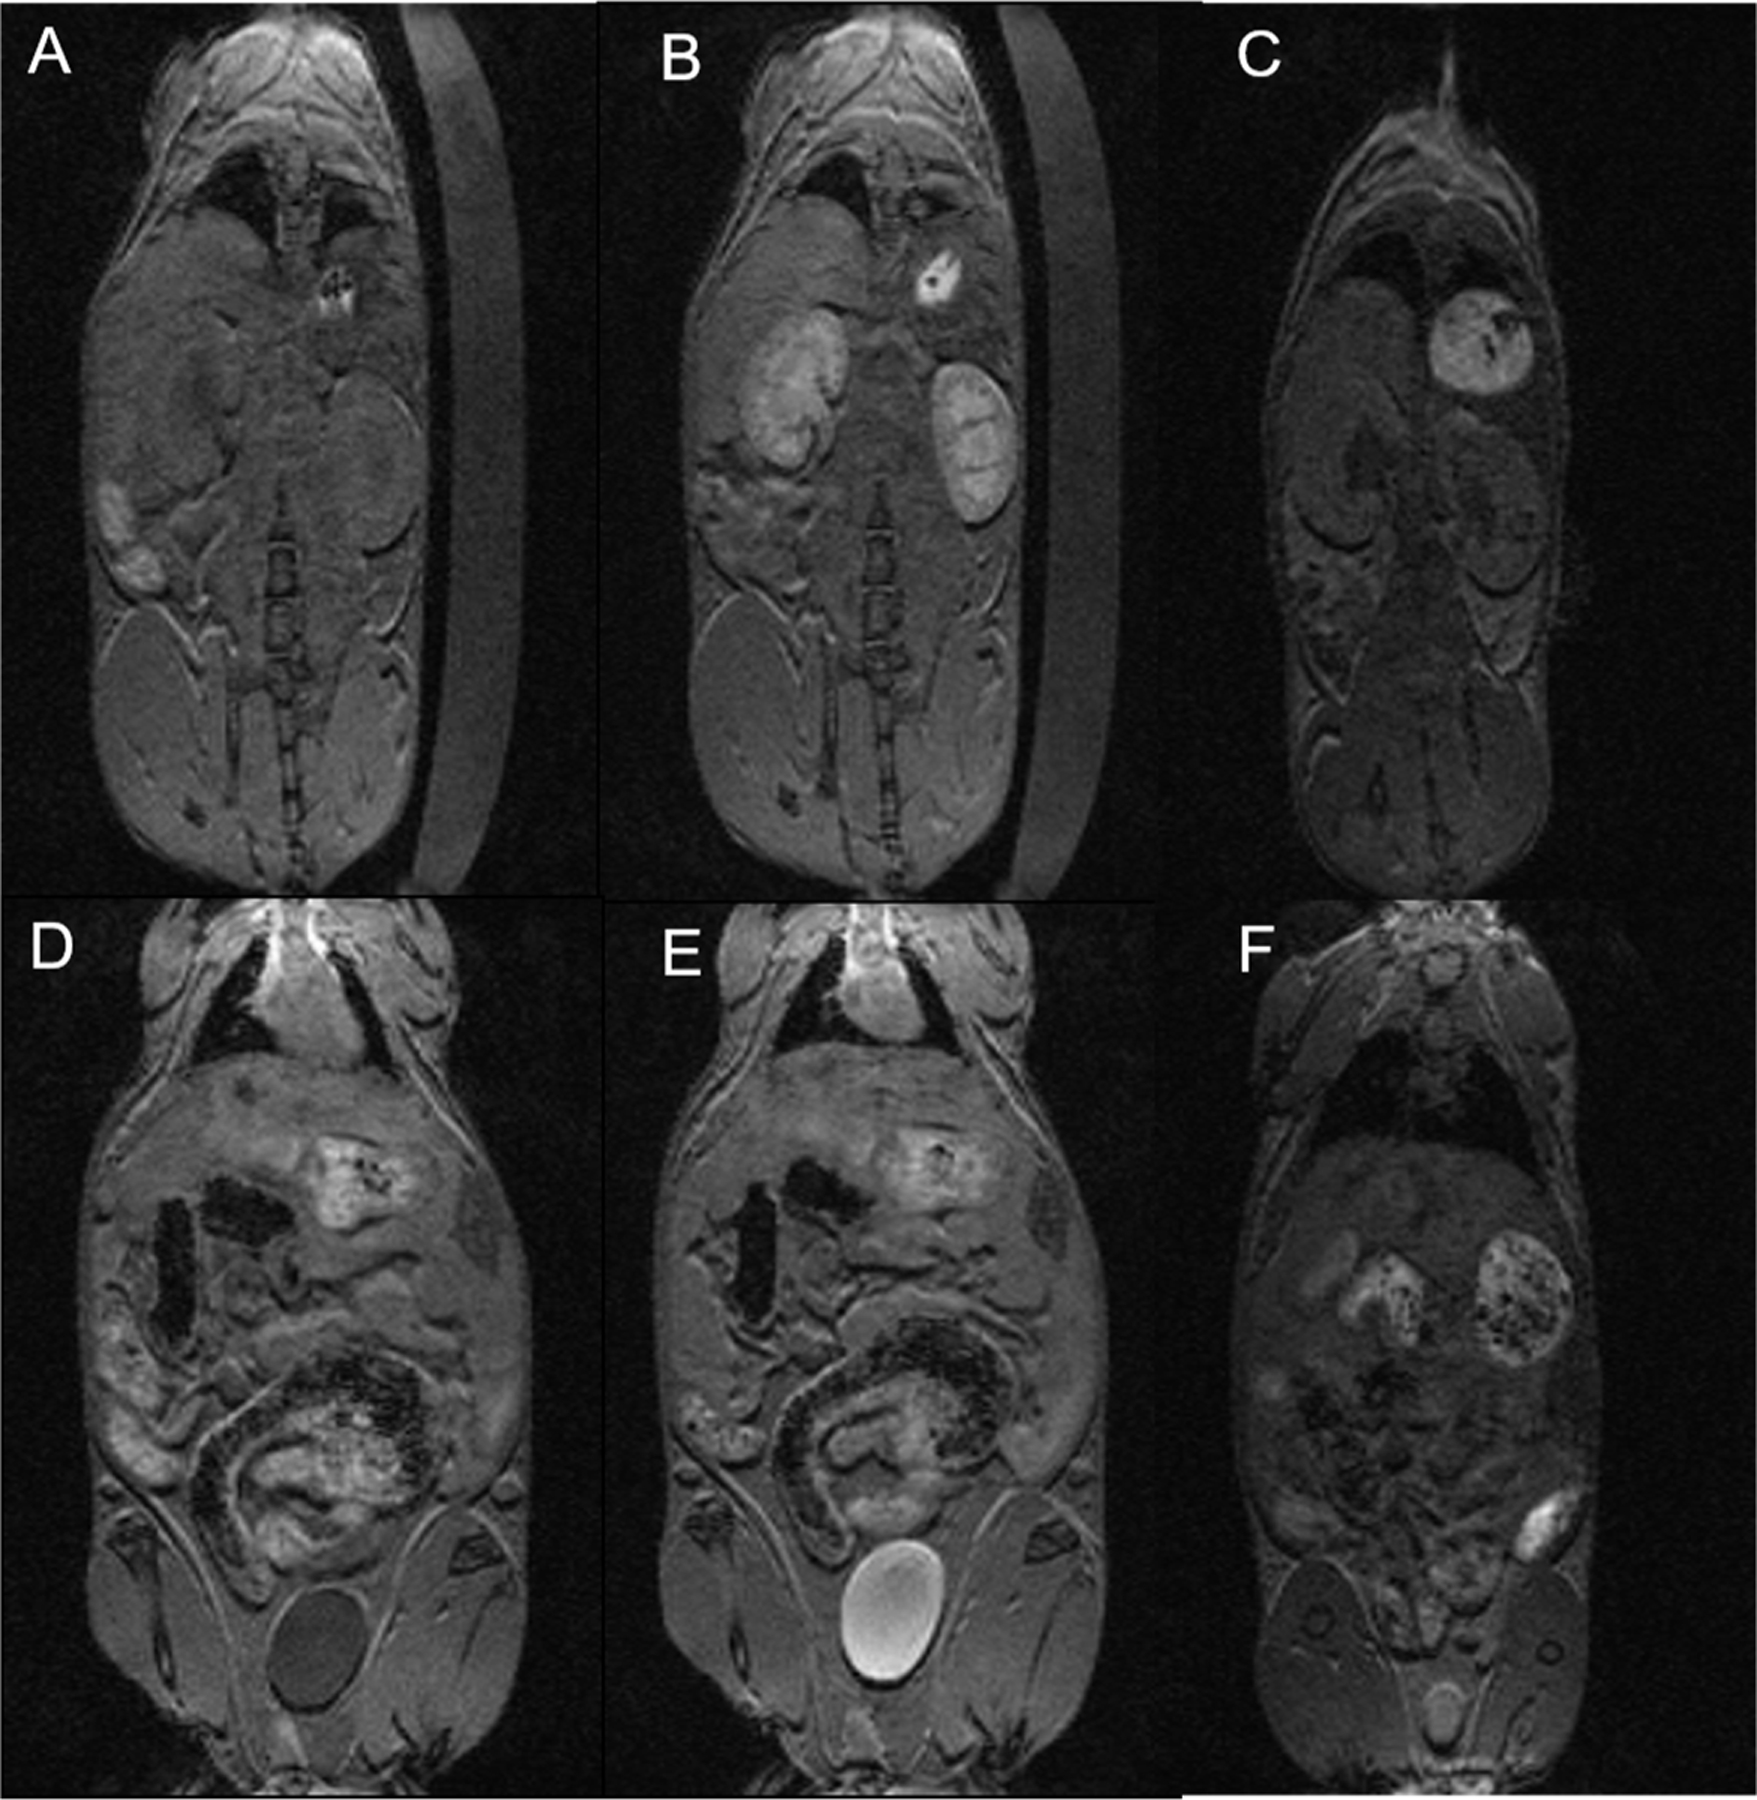
T1‐weighted MRI of a healthy Balb/C mouse at 4.7 T at a dose of 0.025 mmol/kg Fe2(PARA). Top row: before (a), after 40 minutes (b), and after 4 hours (c) post‐injection images showing enhancement of kidneys. Bottom row: urinary bladder images before (d), after 40 minutes (e), and after 4 hours (f).
The pharmacokinetic data of Fe2(PARA), as shown by plotting changes in R1 rate constants in the kidneys, the liver and the blood vessel (inferior vena cava) at 0.025 mmol/kg dose, are shown in Figure 4 and Figures S31 and S32. The data are compared to the pharmacokinetic profile of Fe(TOB), Gd(DOTA) and Gd(DTPA) at 0.050 mmol/kg dose. In the kidneys, the Fe(III) complexes showed notably stronger contrast enhancement compared to the Gd(III) complexes. Fe2(PARA) and Fe(TOB) had similar T1 rate constant differentials over 15 minutes. However after 15 minutes Fe2(PARA) reached a plateau with slightly increased enhancement whereas the enhancement of Fe(TOB) was slightly reduced over 45 minutes. In the vena cava (blood vessel), both Fe(III) complexes indicated a slightly stronger enhancement compared to Gd(III) complexes but the observed enhancement from Fe(TOB) was stronger at early time points.
Figure 4.

Changes in R1 rate constants for Fe2(PARA) at 0.025 mmol/kg dose; Fe(TOB), Gd(DTPA) and Gd(DOTA) at a 0.050 mmol/kg dose over time in the kidneys (A) and inferior vena cava (B) healthy Balb/C mice at 4.7 T.
Discussion
Solution characterization of complexes.
Our previous studies showed that TACN-based macrocyclic ligands with at least two hydroxypropyl pendant groups coordinate and stabilize trivalent iron, a small sized cation which is very Lewis acidic.52, 64 In these complexes, one of the hydroxyalkyl pendant groups deprotonates at near neutral pH and the two chiral hydroxypropyl pendants contribute to the rigidity of the complexes. The third ancillary pendent is a non-coordinating aryl group in the derivatives studied here to allow a coordination site for an inner-sphere water in the Fe(III) complex. In the dinuclear complexes, the aryl group links the two macrocyclic ligands. Two different benzyl derivatives were studied with either para or meta-substitution and one biphenyl linker, (meta-xylene, para-xylene and 4,4’ dimethylbiphenyl). We anticipated that the different aryl linkers might affect the solution chemistry of the Fe(III) complexes. For example, the meta-substituted linker might allow the formation of μ-hydroxy bridged Fe(III) centers or modulate interactions with other anions. The biphenyl linker was studied to determine whether two aryl groups in the dinuclear Fe(III) complex would be beneficial to increase relaxivity in solution for this larger sized linker. Moreover, the proton relaxivity of Fe(III) macrocyclic complexes varies with the type of substituents on the aryl ring.37, 38 Thus the mononuclear complex, Fe(TOLPO), was prepared and studied here as a better comparison to the dinuclear Fe(III) complexes with disubstituted aryl groups.
The dinuclear complexes had similar solution chemistry. Each of the complexes showed two deprotonations, presumably one at each Fe(III) center at near neutral pH. Although we cannot rule out deprotonation of a hydroxypropyl group or bound water at pH values less than 3, the dinuclear complexes are isolated with four chloride counterions, which is most consistent with a total of two deprotonations. We anticipated that the coordination sphere in the dinuclear complexes would be completed with an inner-sphere water, one at each Fe(III) center based on our previous studies of the analogous Fe(TOB) complexes.38, 40 Determination of the number of inner-sphere water molecules for paramagnetic metal ions is typically studied by monitoring the paramagnetic induced 17O resonance shift as a function of metal ion concentration.60, 65–67 Another method is to use the 17O NMR line widths to gauge the hydration state of the metal ion.68 This method is especially useful for high spin d5 metal ions such as Mn(II) that exhibit such dramatic line broadening that the shift cannot be accurately measured.68 Application of this method to Fe(III) complexes suggests that the inner-sphere water ligand of our complexes does not exchange sufficiently rapidly to give rise to substantial broadening of the 17O NMR resonance. Related six-coordinate Fe(III) macrocyclic complexes that have an inner-sphere water also show very limited line-broadening that is most consistent with very slow water exchange, whereas polyaminocarboxylate Fe(III) complexes that show limited 17O resonance broadening are assumed to lack an exchangeable water.30, 38, 40, 61 The 17O NMR line broadening observed for the complexes studied here is similar to that observed for the Fe(III) complex of 1,4,7-tris(hydroxypropyl)-1,4,7-triazacyclononane, a six-coordinate complex with hydroxypropyl pendants that has no inner-sphere water ligands.38 In contrast, seven coordinate Fe(III) complexes that are more common in studies of MRI contrast agents have a water ligand with kex values of 106 to 107s−1 as shown by 17O NMR studies.30
Proton relaxivity studies.
Proton relaxation by paramagnetic probes is dependent on the hydration of the complexes, including inner-sphere, second-sphere and outer-sphere water interactions, as well as the rate of exchange of such water molecules with bulk water. In addition, relaxivity contributions through ligand proton exchange may be important for complexes that lack rapidly exchanging inner-sphere water molecules.28, 69, 70 The defining feature of the Fe(III) complexes studied here, both dinuclear and mononuclear, is the apparent lack of a rapidly exchanging inner-sphere water molecule. Thus, second-sphere water interactions are expected to be of importance in these complexes, although relaxation through exchange of protons of the hydroxypropyl groups or the protons of the inner-sphere water molecule may also be important contributors.24, 28, 71 It is intriguing that Fe(TOLPO) has higher r1 relaxivity than Fe(EDTA), which contains a rapidly exchanging inner-sphere water,72 and also a higher r1 relaxivity than an analog with no bound water and three hydroxypropyl groups.38
Proton r1 relaxivity arises from the fluctuating magnetic dipole of the paramagnetic ion and there are several contributing processes with associated correlation times.41 In addition to the correlation time from the interactions with water protons as the water moves in and out of the coordination sphere, correlation times associated with rotational diffusion of the contrast agent, and relaxation of the electrons of the metal ion are important. Rotational motion of small mononuclear coordination complexes is very fast, on the order of 50–100 picoseconds and thus rotational correlation time is often the one that limits water proton relaxation. Dinuclear metal ion complexes have larger molecular weights and increased rotational times compared to mononuclear complexes. However, simple dinuclear metal ion complexes with aromatic xylyl linkers still have relatively short rotational times on the order of 300 picoseconds,73 in part due to the flexible local motions in non-rigid xylyl linkers that may decrease the rotational correlation time. The size and shape of the complex are important in determining the rotational motion. We anticipated that the Fe2(DIP) complex would be the most effective of the dinuclear complexes, given the importance of having an Fe(III) macrocyclic complex with an aryl group and the larger size of the linker, but this clearly is not the case. Instead Fe2(DIP) and Fe2(PARA) show similar r1 relaxivity in solution at all field strengths, whereas the Fe2(META) complex is slightly lower than these two. It is quite likely that outersphere interactions through water or anions in solution differ for the complexes to affect their shape and rotational diffusion. Protein bound contrast agents are expected to have much longer rotational correlation times, on the order of nanoseconds, which is expected to increase relaxivity given that rotational motions are generally the limiting correlation time. Thus, the dinuclear Fe(III) complexes studied here bind to serum albumin and experience an increase in r1 relaxivity of up to 160%. Further, the mode of binding of the complexes to the serum albumin will also affect relaxivity. For example, the Fe(III) complex may be surface bound and accessible to water or buried to be inaccessible to bulk water.73
Most contrast agents that have been studied for binding to HSA are charged complexes with aromatic groups.74–77 In previous studies, we showed that Fe(TOB) binds to HSA more strongly than analogs that lack a benzyl group.38 The increase in binding strength for dinuclear complexes such as Fe2(PARA) or Fe2(META) suggests that the additional cationic charge is beneficial. Cationic metallodrugs and metal ions have been shown to bind to HSA through distinct sites.78 Given that our MRI studies here involve mice, it is notable that mouse serum albumin (MSA) and HSA both have hydrophobic pockets for binding to lipophilic molecules and have a high degree of sequence and structural similarity.79
Electron spin relaxation times, T1e, are expected to be quite variable for Fe(III) complexes, depending on geometry and ligand type.80 For Fe(EDTA), relatively large zero field splitting is a dominant factor to give T1e times that are shorter than those of the Mn(II) analog.52, 80 At field strengths greater than 30 MHz, Fe(EDTA) is predicted to show an increase in r1 relaxivity as short T1e values are less limiting at high field strengths. Supporting this prediction, polymeric Fe(III) complexes, Fe(III) complexes of CDTA and Fe(III) salts have shown an increase in r1 relaxivity at intermediate field strengths (>100 MHz).33, 81 In studies here, all Fe(III) complexes show slightly decreased r1 relaxivity at 1.4 T compared to 4.7 T (20–30%) whereas the change in relaxivity on going from 4.7 to 9.4 T is nearly within experimental error. These increases in Fe(III) relaxivity from 1.4 to 4.7 T, are likely due, in part, to the shorter electronic relaxation times of Fe(III) that are better matched for higher magnetic field strengths.
Mice MRI studies.
In vivo MRI studies of Fe2(PARA) at the low dose of 0.025 mmol/kg shows clearance predominantly from the kidneys. The dinuclear complex shows a striking contrast enhancement in the kidneys and the contrast is prolonged for several hours, but clears over four hours. The prolonged and highly enhanced kidney contrast was a hallmark of the Fe(TOB) complex and is observed for cationic Fe(III) macrocyclic complexes that contain an aromatic group.40 Analogous Fe(III) complexes with reduced cationic charge and/or lack of a benzyl group do not show strong enhancement of the kidneys.38 Moreover, the pharmacokinetic clearance from the blood is prolonged in comparison to Gd(DTPA) and Fe(TOB). This correlates to the stronger binding of Fe2(PARA) to serum albumin in comparison to these complexes.
CONCLUSIONS
Two Fe(III) macrocyclic complexes are linked together through aryl groups to produce dinuclear complexes that retain solution chemistry at the Fe(III) center which is similar to that observed for mononuclear complexes. There is no evidence of aggregation or the formation of hydroxy-bridged complexes as shown by pH potentiometric titrations and by the relaxivity plots which show linearity up to 400 μmol complex. One of the complexes, Fe2(PARA) shows r1 relaxivity at 4.7 T that is 3-fold larger per molecule than that of the mononuclear complex, Fe(TOLPO). The larger relaxivity is anticipated based on having two Fe(III) centers and a slower rotational correlation time. Further improvements may be gained from the use of more rigid linkers and a further increase in size and shape with corresponding slowing of rotational correlation times. Such complexes of moderate size are proposed to have advantages for the development of contrast agents that function optimally at high field strengths.48 The trend towards improved relaxivity of the Fe(III) complexes at field strengths of 4.7 T or greater should also contribute favorably to this effort.
While linking together two Fe(III) centers produces results that correlate well to predictions for proton relaxivity enhancement in phantoms, in vivo data does not follow as readily from simple models. The biodistribution and clearance of the dinuclear Fe(III) complex from the mice as studied by MRI showed some similarity to the mononuclear complex. On a per Fe(III) basis, enhanced kidney contrast was similar in magnitude. However, the enhanced contrast from the dinuclear complex was prolonged and clearance from the kidney was even slower than for the mononuclear complex. This was not expected as the dinuclear complex had greater hydrophilicity compared to the mononuclear analog (Fe(TOB). For example, in studies of Mn(II) complexes, greater hydrophilicity correlated to more rapid clearance from mice.77 Further studies are required to better understand the factors that are important in the enhanced contrast of kidneys and blood pool, as well as the pharmacokinetic clearance of these Fe(III) agents from mice.
Macrocyclic Fe(III) complexes are in early stages of development as MRI contrast agents and there is much to learn about their aqueous solution chemistry. The properties of this highly polarizing ion differ in many ways from those of Gd(III) and Mn(II), especially in water exchange rates. Moreover, the class of complexes studied here features coordination chemistry that differs from that of most other Fe(III) complexes studied as MRI probes. Fe(III) complexes studied to date as MRI probes or contrast agents contain ligands with multiple anionic oxygen donors17 that mitigate the Lewis acidity of the Fe(III) center. In comparison, the Fe(III) centers in hydroxypropyl-appended macrocyclic complexes have a single anionic donor group in a six-coordinate complex. The inertness of the inner-sphere water ligand to exchange in these complexes is attributed to the highly Lewis acidic Fe(III) center.
EXPERIMENTAL SECTION
Materials.
All reagents were used without further purification with the exception of using dried solvent. N,N-Dimethylformamide dimethyl acetal – 97%, Benzyl Bromide – 99%, L-Ascorbic acid sodium salt – 99%, and Propargyl Alcohol – 99% (Alfa Aesar); 1,4,7-Triazacyclononane – 97% and (S)-(−)-Propylene Oxide - >98% (TCI America);Ethylenediaminetetraacetic acid (EDTA) and diethylenetriaminepentaacetic acid (DTPA) (J.T. Baker). Ferrous Chloride Tetrahydrate and ferrous bromide – 99%. Column chromatography was performed using Alumina gel, basic Brockman Activity 1 – 60 × 325 mesh (Fisher Chemical). Sodium sulfate and buffer 4-(2-hydroxyethyl)-1-piperanineethanesulfonic acid (HEPES), tert-butanol, acetone, diethyl ether, hydrogen chloride and formaldehyde (Fischer Scientific). ICP Fe, Co standard solutions (Inorganic Ventures), metal free nitric acids, α, α’-Dibromo-m-xylene, α, α’-Dibromo-p-xylene, 4,4’-Bis(chloromethyl)-1,1’-biphenyl, 4-Methylbenzyl bromide (Sigma Aldrich)
Instrumentation.
A Nanalysis Benchtop 60‐MHz NMR, a Varian Inova 500‐MHz NMR spectrometer equipped with FTS Systems TC‐84 Kinetics Air Jet Temperature Controller were used to collect 1H‐NMR spectra. A Varian Mercury 300‐MHz NMR spectrometer operating at 75 MHz was used to collect 13C‐NMR spectra. Varian Inova 400‐MHz spectrometer equipped with a 5‐mm broad‐band probe operating at a resonance frequency of 54.24 MHz were used for 17O‐NMR spectroscopy experiments. All pH measurements were performed by using an Orion 8115BNUWP Ross Ultra Semi Micro pH electrode connected to a 702 SM Titrino pH. A Thermo Finnigan LCQ Advantage (Thermofisher, Waltham, MA, USA) with ESI ionization and Surveyor HPLC and a 12T Bruker SolariXR 12 Hybrid FTMS (Bruker Scientific, Billerica, MA, USA) with Imaging MALDI and Nano‐LC were used for analyzing masses of the complexes and the ligands. Iron concentration was determined using a ThermoElectron X‐Series 2 ICP‐MS (Thermofisher, Waltham, MA, USA). Absorbance spectra were recorded on a Beckman‐Coulter DU 800 UV–Vis Spectrophotometer (Beckman Coulter, Pasadena, CA, USA) equipped with a Peltier temperature controller.
Methods
Magnetic Susceptibility.
The effective magnetic moment (μeff) was calculated by using Evans method 82, 83 (Equations (1) and (2)). Samples were prepared by using a coaxial NMR insert with an outer 5-mm NMR tube. The NMR insert contained a solution of 5% t-butanol and 95% D2O by volume and 4.00 mM complex. The outer NMR tube contained 5% t-butanol and 95% D2O by volume. Experiments were carried out at 298 K (T). Measurements were made in triplicate, and the averaged values are presented in Table S1 (Supplementary Materials).
| (1) |
| (2) |
The mass susceptibility (χg) was calculated using Equation (1), where Δf is the shift in frequency (Hz), ν0 is the operating frequency of NMR spectrometer (Hz), m is the concentration of the substance (g/mL), do and ds are the densities of pure solvent and solution, and χ0 is the mass susceptibility of the solvent (χ0 = −0.6466 × 10⁻⁶ cm3/g). 3 The molar susceptibility (χm) is obtained by multiplying the mass susceptibility (χg) by the molar mass. This result was used to calculate the effective magnetic moment μeff (Equation (2)).
UV-Vis Spectroscopy.
Absorbance of Fe(III) complexes was measured from 200–800 nm over a period of 48 and 72 h. A Peltier temperature controller was used to keep the temperature at 37 °C. The sample solutions contained 0.200 mM Fe(III) complex. Solutions for kinetic inertness experiments contained 25.0 mM NaHCO3, 0.500 mM Na2HPO4, and 10.0 mM HEPES buffer (pH 7.4). Acidic solutions for the kinetic inertness experiments contained 0.10 M HCl. For each of these experiments, extinction coefficients were determined by using the Beer–Lambert law.
pH potentiometric Titrations.
All solutions were prepared by using carbonate-free water. Aqueous solutions containing 0.5–1.0 mM Fe(III) complex, 2 mM meglumine and 100 mM NaCl were titrated with a 98.84 mM NaOH solution. 10 μL aliquots of the NaOH solution were added over 60 seconds with an interval of 300 seconds using a Nexus 3000 High Flow Syringe Pump from Chemyx Inc. (Stafford, TX) equipped with a 10 mL Hamilton gastight syringe.
In all fits of the data, meglumime was used as a third reagent, and the equilibrium equation corresponding to its ionization was added to the model data fit as determined from separate titrations. The titration was completed under Ar(g) at 25 °C. The titrations were monitored from pH 3 to pH 11. Equilibrium constants for all complexes were determined by fitting the data using HYPERQUAD 2013 Version 6.0.1. Speciation diagrams were plotted by utilizing HySS Version 4.0.31.
Measurement of Log P Octanol.
Fe(III) complex solutions (0.5 mM) were prepared in 1mL H2O with HEPES buffer (pH 7.4, 20.0 mmol) and 100 mM NaCl. 1.0 mL of a 1:1 mixture of Fe(III) complex solution and 1-octanol was prepared. The mixture was shaken for 24 h then centrifuged at 13,000 rpm for 1 min. Then, the solution was allowed to stand for 1 h. Iron concentration in the aqueous layer before and after mixing with 1-octanol was determined by ICP-MS. The partition coefficient was calculated from Equations (3), where Co is the concentration of iron in the 1-octanol layer and Cw is the concentration of iron in the water layer.84
| (3) |
ICP-MS Measurement.
A Thermo X-Series 2 ICP-MS was used to determine Fe concentration of the Fe(III) complexes. The samples were diluted from 5.0 mM to 1.00 mM Fe concentration solutions. Then, 100.0-μL (1.00 mM) sample solutions were dissolved in 90% v/v metal-free HNO3 (total 1.00 mL) for digestion. After a three-day digestion process, they were diluted to 2% HNO3 and 50 ppb internal solution in 10.0 mL of Milli-Q water. A linear calibration curve for iron metal ranging from 0.1 ppb to 100 ppb was prepared for the quantification. As an internal standard, cobalt standard solution was used. Data analysis was performed by using PlasmaLab software.
17O Variable-Temperature NMR Spectroscopy.
Samples were prepared in 1% H217O enriched water solution and studied at variable temperatures (20–80 °C). The transverse relaxation rates of 17O water (1/T2) were estimated by subtracting the full width at half maximum (FWHM) of the 17O resonance in solutions containing the Fe(III) complex from that in the absence of complex and multiplying by a factor of π.68 These 17O transverse relaxation rates were divided by the concentration of the Fe(III) complex to give r2O as a function of temperature over the range of 20–80 °C.
Binding Measurements of Fe(III) Complexes to Human Serum Albumin (HSA).
The molecular weight of 66,435 Da was used to determine the molar concentrations of HSA. Fe(III) complex (0.400 mM) solutions were incubated with 0.05–1.5 mM HSA in 0.100 M NaCl and 20.0 mM HEPES buffer (pH 7.2). All solutions were incubated at 37 °C for 30 min.85 Aliquots (0.300 mL) were placed in ultra-centrifugal filter units with a 3-kDa membrane and centrifuged at 13,000 rpm for 5 min. The filtrates were used to determine Fe concentration from digested unbound Fe(III) complexes by using ICP-MS. The hill and one-specific binding equations were used for fitting binding curves. The Kd and the coefficient of determination (r2 ) values of the plots were calculated by using GraphPad Prism 8 software.
| (4) |
| (5) |
In Equation 4 and 5, B is the binding coefficient, Bmax is the maximum binding coefficient, n is the number of binding sites and Kd is the binding dissociation constant.
T1/T2 proton relaxation measurements.
The r1 proton relaxivity of the complexes were measured at 1.4 T, 4.7 T and 9.4 T (400 MHz NMR). The r2 water proton relaxivity of the complexes was measured at 4.7 T. Both T1 and T2 proton relaxation experiments were performed at 37 °C at 4.7 and 9.4 t or 34 °C at 1.4 T for the concentration range of 50.0 μM to 400 μM Fe(III) complex. The solutions contained 0.100 M NaCl and HEPES buffer (pH 7.2, 20 mM). An inversion-recovery, balanced steady state free precession scan (IR-SSFP) was used to measure T1 relaxation rate constants. T2 relaxation rates were measured by using multi-echo, Carr–Purcell–Meiboom–Gill spin-echo sequence with a fixed TR of 3000 ms and TE times ranging from 20–1200 ms. The r1 and r2 relaxivity values were calculated by using linear regression fitting of 1/T1 (s−1) and 1/T2 (s−1) versus concentration (mM) in Microsoft Excel.
Mice Imaging Studies.
In vivo imaging studies with the Fe(III) complexes were studied on at 4.7 T Bruker preclinical MRI in healthy mice (BABC/cJ, Jackson Laboratory). Solutions were formulated with 5 mM Fe(III) complex, 10 mM meglumine, 100 mM NaCl, and 20 mM HEPES buffer (pH 7.4). Two scan procedures were used: (1) a T1-weighted, 3D, spoiled-gradient echo scan covering the mouse from thorax to tail to determine signal enhancement and (2) T1 relaxometry using an IR-SSFP scan to measure T1 rate constants in the blood (inferior vena cava), kidneys, liver, gall bladder and back muscle. The samples with a concentration of 50 μmol [Fe] / kg were injected intravenously via tail vein and MR data were recorded continuously for up to 1 hour. Distribution studies and clearance kinetics were studied by using MR data acquired over several time points for up to 1 hour, and additionally at 4 hours and 24 hours. For comparison, FDA-approved MRI contrast agent gadopentetate dimeglumine (Gd-DTPA, Magnevist®) was injected at 50 μmol [Gd] / kg into separate group of mice. For SPGR scan, signal intensities were normalized to the phantoms, signal increase in each organ was measured. For T1 relaxometry, T1 rate constants were calculated by in-house MATLAB routines and the increases in T1 rates (ΔR1) were calculated by subtracting the pre-injection T1 rates from each post-injection value.
H-TOLPO. (2S,2’S)-1,1’-(7-(4-methylbenzyl)-1,4,7-triazonane-1,4-diyl)bis(propan-2-ol).
To a 25 mL round bottom flask with gas inlet and stir bar was added 0.500 g TACN (3.876 mmol) in 10 mL toluene 2 mL chloroform solution. 0.460 g N,N-dimethylformamide dimethylacetal (3.870 mmol) was added to the flask. The solution was stirred for 24 hours at room temperature. ESI-MS (m/z) of 1,4,7-triazatricyclo[5.2.1.04,10]decane (tacn orthoamide), calculated: 140.1 [M + H+] (100%). The solution was dried by placing the flask on a rotoevaporator. The dried TACN orthoamide and 20 mL dry acetonitrile was added in 50 mL 3-necked round bottom flask equipped with a magnetic stir bar, reflux condenser, gas inlet tube and addition funnel. 0.721 g 4-methylbenzyl bromide (3.876 mmol) in 15 ml dry acetonitrile solution was added into the flask by dropwise addition with an addition funnel for 30 min. The solution was heated to reflux for 2 hours and was stirred overnight at room temperature. A white precipitate was collected by suction filtration method and washed with dry acetonitrile (5 mL) and diethyl ether (5mL). This solid was dissolved in 20 mL water and heated to reflux for 4 h. After the solution was cooled to room temperature, NaOH pellets (2.168 g, 54.18 mmol) were added slowly and the solution was refluxed for 12 h for deprotection process. The product was extracted with chloroform (6 × 60 mL). The organic fractions were dried over anhydrous Na2SO4. The solvent of the dried organic layers was removed on a rotary evaporator and light yellow oil was obtained. ESI-MS (m/z): 234.32 (M + H+) (100 %). The product was dissolved in 25 mL ethanol in 50 mL round bottom flask with 0.500 g S-propylene oxide (8.61 mmol) and stirred for 24 hours at room temperature. The final solution was placed on a rotoevaporator and the solvent and volatiles were removed under vacuum. The residue was dried on a Schlenk line under vacuum. Further purification was performed by using basic alumina column chromatography with MeOH/DCM. The yield was 56%. M: H-TOLPO, ESI-MS (m/z): 350.41 (M + H+, 100 %). 1H NMR (CDCl3, 25 °C, 400 MHz): δ1.04 and 1.20 (9H, CH3), 2.29–2.84 (12H, CH2 macrocycle and 4H, CH2 alcohol pendant groups), 3.42–3.70 (2H, CH2 benzyl and 2H, CH alcohol pendant groups) 7.09 and 7.21 (4H, benzyl and CDCl3) (Figure S.1.) 13C‐NMR (75 MHz, CDCl3) δ: 19.82, 21.09, 50.38, 55.25, 62.38, 63.89, 66.45, 76.67–77.52*( CDCl3) 128.80, 129.50, 136.20, 136.50 (Figure S.2.).
H-META.(2S,2’S,2’’S,2’’’S)-1,1’,1’’,1’’’-((1,3-phenylenebis(methylene))bis(1,4,7 triazonane-7,1,4-triyl))tetrakis(propan-2-ol).
To a 25 mL round bottom flask with gas inlet and stir bar was added 0.100 g TACN (0.774 mmol) in 4 mL toluene 1 mL chloroform solution. 0.0920 g N,N-dimethylformamide dimethylacetal (0.774 mmol) was added to the flask. The solution was stirred for 24 hours at room temperature. ESI-MS (m/z) of 1,4,7-triazatricyclo[5.2.1.04,10]decane (tacn orthoamide), calculated: 140.1 [M + H+] (100%). The solvent and volatiles were removed by rotoevaporation. The dried TACN orthoamide and 15 mL dry acetonitrile was added in 50 mL 3-necked round bottom flask equipped with a magnetic stir bar, reflux condenser, gas inlet tube and addition funnel. 0.100 g α, α’-dibromo-m-xylene (0.384 mmol) in 10 ml dry acetonitrile solution was added into the flask by dropwise addition with an addition funnel for 30 min. The solution was heated to reflux for 2 hours and was stirred overnight at room temperature. A white-beige color precipitate was collected by suction filtration method and washed with dry acetonitrile (5 mL) and diethyl ether (5mL). 6 mL methanol and 6 mL 12 M HCl was added to the precipitate in the flask for the deprotection process. The solution was heated to reflux for 4 hours. After the solution was cooled to room temperature, NaOH pellets were added to bring the pH of the solution to 8. The product was filtered to remove NaCl salt precipitate and extracted with chloroform (3 × 60 mL). ESI-MS (m/z), calculated: 361.4 (M + H+, 100 %). The solvent of the dried organic layers was removed by rotoevaporation and the resulting solid was dissolved in 15 mL ethanol in 25 mL round bottom flask with 0.202 g S-propylene oxide (3.483 mmol) and stirred for 24 hours at room temperature. The final solution was placed under vacuum to remove solvent by rotoevaporation and further dried on a Schlenk line under vacuum. The yield was 58%. M: H-META (Scheme 1.), ESI-MS (m/z): 593.6 (M + H+, 45 %), 615.6 (M + Na+, 100 %) and 297.5 ((M + 2H+) /2, 45 %). 1H NMR (CDCl3, 25 °C, 500 MHz): δ 1.20 (12H, CH3), 2.30/2.82 (8H, NCH2CH), 2.60 (24H, CH2CH2), 3.60 (4H, CHOH), 3.75 (4H, NCH2C) and 7.28 (4H, CH in benzene ring )and CDCl3 peak (Figure S.3.). 13C‐NMR (75 MHz, CDCl3) δ: 19.87, 54.47, 55.20, 62.45, 63.86, 66.39, 76.12–77.45* (CDCl3), 128.09, 128.41, 130.71, 139.04 (Figure S.4.).
H-PARA.(2S,2’S,2’’S,2’’’S)-1,1’,1’’,1’’’-((1,4-phenylenebis(methylene))bis(1,4,7-triazonane-7,1,4-triyl))tetrakis(propan-2-ol).
To a 25 mL round bottom flask with gas inlet and stir bar was added 0.500 g TACN (3.876 mmol) in 10 mL toluene 2 mL chloroform solution. 0.460 g N,N-dimethylformamide dimethylacetal (3.870 mmol) was added to the flask. The solution was stirred for 24 hours at room temperature. ESI-MS (m/z) of 1,4,7-triazatricyclo[5.2.1.04,10]decane (tacn orthoamide), calculated: 140.1 [M + H+] (100%). The solvent was removed under vaccum. The dried TACN orthoamide and 20 mL dry acetonitrile was added in 50 mL 3-necked round bottom flask equipped with a magnetic stir bar, reflux condenser, gas inlet tube and addition funnel. 0.468 g α, α’-dibromo-p-xylene (1.773 mmol) in 15 ml dry acetonitrile solution was added into the flask by dropwise addition with an addition funnel for 30 minutes. The solution was heated to reflux for 2 hours and was stirred overnight at room temperature. A white-beige color precipitate was collected by suction filtration method and washed with dry acetonitrile (5 mL) and diethyl ether (5mL). This solid was dissolved in 20 mL water and heated to reflux for 4 h. After the solution was cooled to room temperature, NaOH pellets (2.168 g, 54.18 mmol) were added slowly and the solution was refluxed for 12 h for deprotection process. The product was extracted with chloroform (6 × 60 mL). The organic fractions were dried over anhydrous Na2SO4. The solvent was removed on a rotary evaporator and a light yellow oil was obtained. ESI-MS (m/z), calculated: 361.4 (M + H+, 100 %). The product was dissolved in 25 mL ethanol in 50 mL round bottom flask with 0.500 g S-propylene oxide (8.61 mmol) and stirred for 24 hours at room temperature. The solvent was removed by placing on a rotoevaporator and then dried on a Schlenk line under vacuum. Further purification was performed by using basic alumina column chromatography with MeOH/DCM. The yield was calculated as 41%. M: H-PARA (Scheme 1.), ESI-MS (m/z): 593.5 (M + H+, 20%), and 297.4 ((M + 2H+) /2, 100 %). 1H NMR (CDCl3, 25 °C, 500 MHz): δ 1.07 (12H, CH3), 2.23/2.81 (8H, NCH2CH), 2.42–2.58 (24H, CH2CH2), 3.53 (4H, CHOH), 3.74 (4H, NCH2C), 5.56 (4H, OH), 7.27 and 7.32 (4H, CH in benzene ring) and CDCl3 peak (Figure S.5.). 13C‐NMR (75 MHz, CDCl3) δ: 19.72, 54.39–55.176, 62.55, 63.74, 66.38, 76.59–77.44* (CDCl3), 127.89, 128.41, 130.70, 139.04 (Figure S.6.)
H-DIP.(2S,2’S)-1,1’-(1,4,7-triazonane-1,4-diyl)bis(propan-2-ol)--(2S,2’S)-1,1’-(7-((4’-ethyl-[1,1’-biphenyl]-4-yl)methyl)-1,4,7-triazonane-1,4-diyl)bis(propan-2-ol).
To a 25 mL round bottom flask with gas inlet and stir bar was added 0.500 g TACN (3.876 mmol) in 10 mL toluene 2 mL chloroform solution. 0.460 g N,N-dimethylformamide dimethylacetal (3.870 mmol) was added to the flask. The solution was stirred for 24 hours at room temperature. ESI-MS (m/z) of 1,4,7-triazatricyclo[5.2.1.04,10]decane (tacn orthoamide), calculated: 140.1 [M + H+] (100%). The solvent was removed by rotoevaporation. The dried TACN orthoamide and 20 mL dry acetonitrile was added in 50 mL 3-necked round bottom flask equipped with a magnet stir bar, reflux condenser, gas inlet tube and addition funnel. 0.445 g 4,4’-bis(chloromethyl)-1,1’-biphenyl (1.773 mmol) in 15 mL dry acetonitrile solution was added into the flask by dropwise addition with an addition funnel for 30 min. The solution was heated to reflux for 2 hours and was stirred overnight at room temperature. A white-beige color precipitate was collected by suction filtration method and washed with dry acetonitrile (5 mL) and diethyl ether (5 mL). This solid was dissolved in 20 mL water and heated to reflux for 4 h. After the solution was cooled to room temperature, NaOH pellets (2.168 g, 54.18 mmol) were added slowly and the solution was refluxed for 12 h for the deprotection process. Then the solution was extracted with chloroform (6 × 60 mL). The organic fractions were dried over anhydrous Na2SO4. The solvent was removed by rotoevaporation and light yellow oil was obtained. ESI-MS (m/z), calculated: 220.2 ((M + 2H+)/2, 100 %). The product was dissolved in 25 mL ethanol in 50 mL round bottom flask with 0.500 g S-propylene oxide (8.61 mmol) and stirred for 24 hours at room temperature. The final solution was placed on a rotoevaporator to remove solvent and the residue was dried on a Schlenk line under vacuum. Further purification was performed by using basic alumina column chromatography with MeOH/DCM. The yield was calculated as 39%. M: H-DIP (Scheme 1.), ESI-MS (m/z): 335.6 ((M + 2H+) /2, 100 %). 1H NMR (CDCl3, 25 °C, 500 MHz): δ 1.09 (12H, CH3), 2.27/2.89 (8H, NCH2CH), 2.51–2.65 (24H, CH2CH2), 3.64 (4H, CHOH), 3.78 (4H, NCH2C), 4.73* (D2O remained), 7.26* (CDCl3), 7.45 (4H, CH in benzene ring) and 7.55 (4H, CH in benzene ring) (Figure S.7.). 13C‐NMR (75 MHz, CDCl3) δ: 19.73, 54.68, 55.43, 62.46, 63.84, 66.48, 76.55–77.40* (CDCl3), 126.69, 129.93, 138.37, 139.54 (Figure S.8).
Synthesis of Complexes.
Iron complexes were synthesized by dissolving the corresponding ligand (H-META, H-PARA, H-DIP, and H-TOLPO, 0.500 mmol) in ethanol (40.0 mL). Then, ferrous chloride tetrahydrate (1.05 equivalents, 0.53 mmol) was dissolved in ethanol (10.0 mL) and was added dropwise to the ligand solution. Reactions were stirred with exposure to air overnight. The reaction solutions were monitored by ESI-MS. The Fe(III) complexes precipitate as yellow solids upon adding with diethyl ether. The products were washed with diethyl ether and dried under vacuum. The [Fe2(TOB)Cl]Cl complex was synthesized according to a reported procedure.40 Please see Scheme S1 for definition of species detected by mass spectrometry which is the species designated with an asterisk.
[Fe(TOLPO)Cl]Cl.
Complex was synthesized using ferrous chloride tetrahydrate and the product isolated as a yellow solid (0.15 mg, 62%). Fe content through ICP-MS calculated for Fe content through ICP-MS calculated for [Fe(TOLPO)Cl]Cl: 11.79 %, found: 11.79 %. M: [Fe(TOLPO)*]+ (Scheme S.1); FT-ICR-MS: Calculated m/z 403.19167, Found m/z 403.19140 (M, 100%) (Figure S.9).
[Fe2(META)Cl2]Cl2.
Complex was synthesized by using ferrous chloride tetrahydrate and the product was isolated as a yellow solid (0.23 g, 55%). Fe content through ICP-MS calculated for [Fe2(META)Cl2]Cl2: 13.27 %, found: 13.25 %. M: [Fe2(META)*]2+ (Scheme S.1); FT-ICR-MS: Calculated m/z 350.15254, Found m/z 350.15230 ((M/2), 100%).LC-Orbitrap-MS: m/z 350.15132 ((M/2), 100%) (Figure S.10).
[Fe2(PARA)Cl2]Cl2.
Complex was synthesized by using ferrous chloride tetrahydrate and the product was isolated as a yellow solid (0.22 mg, 51%). Fe content through ICP-MS calculated for Fe content through ICP-MS calculated for [Fe2(PARA)Cl2]Cl2: 13.27 %, found: 13.25 %. M: [Fe2(PARA)*]2+ (Scheme S.1); FT-ICR-MS: Calculated m/z 350.15254 Found m/z 350.15249 ((M/2), 100%) (Figure S.11).
[Fe2(DIP)Cl2]Cl2.
The complex was synthesized using ferrous chloride tetrahydrate. Product isolated as a yellow solid (0.27 mg, 53%). Fe content through ICP-MS calculated for Fe content through ICP-MS calculated for [Fe2(DIP)Cl2]Cl2: 12.17 %, found: 11.31 %. M: [Fe2(DIP)*]2+ (Scheme S.1); FT-ICR-MS: Calculated m/z 388.16819, Found m/z 388.16809 ((M/2), 100%) (Figure S.12).
Supplementary Material
Acknowledgements.
J.R.M. acknowledges the NSF (STTR-11951127) for support. JAS is partially supported by Roswell Park’s NIH P30 grant (CA016056). The authors would like to thank the Chemistry Instrument Center (CIC), University at Buffalo. This work utilized ICP-MS and FTMS that was purchased with funding from a NSF Major Research Instrumentation Program (NSF CHE-0959565) and National Institutes of Health (S10 RR029517). We thank Dr. Eric Snyder for the aqueous complexation studies and Dr. Patrick Burns for relaxivity measurements. We thank Dr. Dinesh Sukumaran for consultation on 17O‐NMR experiments, Eric Jensen for running FT‐ICR‐MS experiments, and Dr. Valerie Frerichs for the assistance with ICP‐MS and LC-Orbitrap-MS experiments and method development.
Footnotes
JRM is a co-founder of Ferric Contrast, Inc. which develops iron-based MRI contrast agents.
References
- 1.Caravan P; Ellison JJ; McMurry TJ; Lauffer RB, Gadolinium (III) chelates as MRI contrast agents: structure, dynamics, and applications. Chemv Rev 1999, 99 (9), 2293–2352. [DOI] [PubMed] [Google Scholar]
- 2.Li H; Meade TJ, Molecular magnetic resonance imaging with Gd (III)-based contrast agents: challenges and key advances. J. Am. Chem. Soc 2019, 141 (43), 17025–17041. [DOI] [PMC free article] [PubMed] [Google Scholar]
- 3.Xiao Y-D; Paudel R; Liu J; Ma C; Zhang Z-S; Zhou S-K, MRI contrast agents: Classification and application. Int. J. Mol. Med 2016, 38 (5), 1319–1326. [DOI] [PubMed] [Google Scholar]
- 4.Wahsner J; Gale EM; Rodríguez-Rodríguez A; Caravan P, Chemistry of MRI contrast agents: current challenges and new frontiers. Chem. Rev 2018, 119 (2), 957–1057. [DOI] [PMC free article] [PubMed] [Google Scholar]
- 5.Aime S; Botta M; Esteban-Gómez D; Platas-Iglesias C, Characterisation of magnetic resonance imaging (MRI) contrast agents using NMR relaxometry. Mol. Phys 2019, 117 (7–8), 898–909. [Google Scholar]
- 6.Runge VM, Safety of the Gadolinium-Based Contrast Agents for Magnetic Resonance Imaging, Focusing in Part on Their Accumulation in the Brain and Especially the Dentate Nucleus. Invest Radiol 2016, 51 (5), 273–9. [DOI] [PubMed] [Google Scholar]
- 7.Damme NM; Fernandez DP; Wang LM; Wu Q; Kirk RA; Towner RA; McNally JS; Hoffman JM; Morton KA, Analysis of retention of gadolinium by brain, bone, and blood following linear gadolinium-based contrast agent administration in rats with experimental sepsis. Magn Reson Med 2020, 83 (6), 1930–1939. [DOI] [PubMed] [Google Scholar]
- 8.Gupta A; Caravan P; Price WS; Platas-Iglesias C; Gale EM, Applications for transition-metal chemistry in contrast-enhanced magnetic resonance imaging. Inorg. Chem 2020, 59 (10), 6648–6678. [DOI] [PMC free article] [PubMed] [Google Scholar]
- 9.Drahoš B; Lukeš I; Tóth É, Manganese (II) complexes as potential contrast agents for MRI. Eur J Inorg Chem 2012, 2012 (12), 1975–1986. [Google Scholar]
- 10.Pan D; Schmieder AH; Wickline SA; Lanza GM, Manganese-based MRI contrast agents: past, present and future. Tetrahedron 2011, 67 (44), 8431. [DOI] [PMC free article] [PubMed] [Google Scholar]
- 11.Gale EM; Mukherjee S; Liu C; Loving GS; Caravan P, Structure–redox–relaxivity relationships for redox responsive manganese-based magnetic resonance imaging probes. Inorg chem 2014, 53 (19), 10748–10761. [DOI] [PMC free article] [PubMed] [Google Scholar]
- 12.Botár R. r.; Molnár E; Trencsényi G. r.; Kiss J. n; Kálmán FK; Tircsó G, Stable and inert Mn (II)-based and pH-responsive contrast agents. J Am Chem Soc 2020, 142 (4), 1662–1666. [DOI] [PubMed] [Google Scholar]
- 13.Bradshaw JE; Gillogly KA; Wilson LJ; Kumar K; Wan X; Tweedle MF; Hernandez G; Bryant RG, New non-ionic water-soluble porphyrins: evaluation of manganese (III) polyhydroxylamide porphyrins as MRI contrast agents. Inorg Chim Acta 1998, 275, 106–116. [Google Scholar]
- 14.Mouraviev V; Venkatraman TN; Tovmasyan A; Kimura M; Tsivian M; Mouravieva V; Polascik TJ; Wang H; Amrhein TJ; Batinic-Haberle I, Mn porphyrins as novel molecular magnetic resonance imaging contrast agents. J Endourol 2012, 26 (11), 1420–1424. [DOI] [PMC free article] [PubMed] [Google Scholar]
- 15.Pinto SM; Calvete MJ; Ghica ME; Soler S; Gallardo I; Pallier A; Laranjo MB; Cardoso AM; Castro MMC; Brett CM, A biocompatible redox MRI probe based on a Mn (II)/Mn (III) porphyrin. Dalton Trans 2019, 48 (10), 3249–3262. [DOI] [PubMed] [Google Scholar]
- 16.Boehm-Sturm P; Haeckel A; Hauptmann R; Mueller S; Kuhl CK; Schellenberger EA, Low-molecular-weight iron chelates may be an alternative to gadolinium-based contrast agents for T1-weighted contrast-enhanced MR imaging. Radiology 2018, 286 (2), 537–546. [DOI] [PubMed] [Google Scholar]
- 17.Kuźnik N; Wyskocka M, Iron (III) contrast agent candidates for MRI: a survey of the structure–effect relationship in the last 15 years of studies. Eur J Inorg Chem 2016, 2016 (4), 445–458. [Google Scholar]
- 18.Hoener BA; Engelstad BL; Ramos EC; Macapinlac HA; Price DC; Johnson TR; White DL, Comparison of Fe‐HBED and Fe‐EHPG as hepatobiliary MR contrast agents. J Magn Reson Imaging 1991, 1 (3), 357–362. [DOI] [PubMed] [Google Scholar]
- 19.Wang H; Wong A; Lewis LC; Nemeth GR; Jordan VC; Bacon JW; Caravan P; Shafaat HS; Gale EM, Rational Ligand Design Enables pH Control over Aqueous Iron Magnetostructural Dynamics and Relaxometric Properties. Inorg Chem 2020, 59 (23), 17712–17721. [DOI] [PMC free article] [PubMed] [Google Scholar]
- 20.Wyskocka-Gajda M; Przypis Ł; Olesiejuk M; Krawczyk T; Kuźnik A; Nawara K; Minoshima M; Sugihara F; Kikuchi K; Kuźnik N, A step towards gadolinium-free bioresponsive MRI contrast agent. Eur J Med Chem 2021, 211, 113086. [DOI] [PubMed] [Google Scholar]
- 21.Maheshwaran D; Nagendraraj T; Balaji TS; Kumaresan G; Kumaran SS; Mayilmurugan R, Smart dual T 1 MRI-optical imaging agent based on a rhodamine appended Fe (iii)-catecholate complex. Dalton Trans 2020, 49 (41), 14680–14689. [DOI] [PubMed] [Google Scholar]
- 22.Schwert DD; Richardson N; Ji G; Radüchel B; Ebert W; Heffner PE; Keck R; Davies JA, Synthesis of two 3, 5-disubstituted sulfonamide catechol ligands and evaluation of their iron (III) complexes for use as MRI contrast agents. J Med Chem 2005, 48 (23), 7482–7485. [DOI] [PubMed] [Google Scholar]
- 23.Weisser JT; Nilges MJ; Sever MJ; Wilker JJ, EPR Investigation and Spectral Simulations of Iron− Catecholate Complexes and Iron− Peptide Models of Marine Adhesive Cross-Links. Inorg Chem 2006, 45 (19), 7736–7747. [DOI] [PubMed] [Google Scholar]
- 24.Botta M, Second coordination sphere water molecules and relaxivity of gadolinium (III) complexes: implications for MRI contrast agents. Eur J Inorg Chem 2000, 2000 (3), 399–407. [Google Scholar]
- 25.Laus S; Ruloff R; Tóth É; Merbach AE, GdIII complexes with fast water exchange and high thermodynamic stability: potential building blocks for high‐relaxivity MRI contrast agents. Chem Eur J 2003, 9 (15), 3555–3566. [DOI] [PubMed] [Google Scholar]
- 26.Leone L; Esteban-Gómez D; Platas-Iglesias C; Milanesio M; Tei L, Accelerating water exchange in Gd III–DO3A-derivatives by favouring the dissociative mechanism through hydrogen bonding. Chem Comm 2019, 55 (4), 513–516. [DOI] [PubMed] [Google Scholar]
- 27.Pujales-Paradela R; Carniato F; Esteban-Gómez D; Botta M; Platas-Iglesias C, Controlling water exchange rates in potential Mn 2+-based MRI agents derived from NO2A 2−. Dalton Trans 2019, 48 (12), 3962–3972. [DOI] [PubMed] [Google Scholar]
- 28.Aime S; Botta M; Fasano M; Terreno E, Prototropic and water-exchange processes in aqueous solutions of Gd (III) chelates. Acc Chem Res 1999, 32 (11), 941–949. [Google Scholar]
- 29.Bonnet CS; Fries PH; Crouzy S; Delangle P, Outer-sphere investigation of MRI relaxation contrast agents. Example of a cyclodecapeptide gadolinium complex with second-sphere water. J Phys Chem B 2010, 114 (26), 8770–8781. [DOI] [PubMed] [Google Scholar]
- 30.Schneppensieper T; Seibig S; Zahl A; Tregloan P; van Eldik R, Influence of chelate effects on the water-exchange mechanism of polyaminecarboxylate complexes of iron (III). Inorg Chem 2001, 40 (15), 3670–3676. [DOI] [PubMed] [Google Scholar]
- 31.Schneppensieper T; Zahl A; van Eldik R, Water Exchange Controls the Complex‐ Formation Mechanism of Water‐Soluble Iron (III) Porphyrins: Conclusive Evidence for Dissociative Water Exchange from a High‐Pressure 17O NMR Study. Angew Chem Int Ed 2001, 40 (9), 1678–1680. [PubMed] [Google Scholar]
- 32.Wang H; Jordan VC; Ramsay IA; Sojoodi M; Fuchs BC; Tanabe KK; Caravan P; Gale EM, Molecular magnetic resonance imaging using a redox-active iron complex. J Am Chem Soc 2019, 141 (14), 5916–5925. [DOI] [PMC free article] [PubMed] [Google Scholar]
- 33.Xie J; Haeckel A; Hauptmann R; Ray IP; Limberg C; Kulak N; Hamm B; Schellenberger E, Iron (III)‐t CDTA derivatives as MRI contrast agents: Increased T1 relaxivities at higher magnetic field strength and pH sensing. Magn Reson Med 2021. [DOI] [PubMed]
- 34.Bales BC; Grimmond B; Johnson BF; Luttrell MT; Meyer DE; Polyanskaya T; Rishel MJ; Roberts J, Fe-HBED analogs: a promising class of iron-chelate contrast agents for magnetic resonance imaging. Contrast Media Mol Imaging 2019, 2019. [DOI] [PMC free article] [PubMed]
- 35.Larsen SK; Jenkins BG; Memon NG; Lauffer RB, Structure-affinity relationships in the binding of unsubstituted iron phenolate complexes to human serum albumin. Molecular structure of iron (III) N, N’-bis (2-hydroxybenzyl) ethylenediamine-N, N’-diacetate. Inorg Chem 1990, 29 (6), 1147–1152. [Google Scholar]
- 36.Aime S; Botta M; Frullano L; Geninatti Crich S; Giovenzana G; Pagliarin R; Palmisano G; Sirtori FR; Sisti M, [GdPCP2A (H2O) 2]-: A paramagnetic contrast agent designed for improved applications in magnetic resonance imaging. J Med Chem 2000, 43 (21), 4017–4024. [DOI] [PubMed] [Google Scholar]
- 37.Caravan P; Esteban-Gómez D; Rodríguez-Rodríguez A; Platas-Iglesias C, Water exchange in lanthanide complexes for MRI applications. Lessons learned over the last 25 years. Dalton Trans 2019, 48 (30), 11161–11180. [DOI] [PubMed] [Google Scholar]
- 38.Asik D; Smolinski R; Abozeid SM; Mitchell TB; Turowski SG; Spernyak JA; Morrow JR, Modulating the properties of Fe (III) macrocyclic MRI contrast agents by appending sulfonate or hydroxyl groups. Molecules 2020, 25 (10), 2291. [DOI] [PMC free article] [PubMed] [Google Scholar]
- 39.Patel A; Asik D; Snyder EM; Delillo AE; Cullen PJ; Morrow JR, Binding and release of Fe (III) complexes from glucan particles for delivery of T1 MRI contrast agents. ChemMedChem 2020. [DOI] [PubMed]
- 40.Snyder EM; Asik D; Abozeid SM; Burgio A; Bateman G; Turowski SG; Spernyak JA; Morrow JR, A Class of FeIII Macrocyclic Complexes with Alcohol Donor Groups as Effective T1 MRI Contrast Agents. Angew Chem. Int. Ed 2020, 132 (6), 2435–2440. [DOI] [PMC free article] [PubMed] [Google Scholar]
- 41.Caravan P, Strategies for increasing the sensitivity of gadolinium based MRI contrast agents. Chem Soc Rev 2006, 35 (6), 512–523. [DOI] [PubMed] [Google Scholar]
- 42.Gale EM; Atanasova IP; Blasi F; Ay I; Caravan P, A manganese alternative to gadolinium for MRI contrast. J Am Chem Soc 2015, 137 (49), 15548–15557. [DOI] [PMC free article] [PubMed] [Google Scholar]
- 43.Gugliotta G; Botta M; Tei L, AAZTA-based bifunctional chelating agents for the synthesis of multimeric/dendrimeric MRI contrast agents. Org Biomol Chem 2010, 8 (20), 4569–4574. [DOI] [PubMed] [Google Scholar]
- 44.Major JL; Meade TJ, Bioresponsive, cell-penetrating, and multimeric MR contrast agents. Acc Chem Res 2009, 42 (7), 893–903. [DOI] [PMC free article] [PubMed] [Google Scholar]
- 45.Song Y; Kohlmeir EK; Meade TJ, Synthesis of multimeric MR contrast agents for cellular imaging. J Am Chem Soc 2008, 130 (21), 6662–6663. [DOI] [PMC free article] [PubMed] [Google Scholar]
- 46.Rodríguez E; Gich M; Roig A; Molins E; Nedelko N; Ślawska-Waniewska A; Szewczyk A, Investigations of the stability of {[(tacn) 6Fe8 (μ3-O) 2 (μ2-OH) 12] Br7 (H2O)} Brꞏ 8H2O (Fe8) cluster in aqueous solution by spectroscopic and magnetic methods. Polyhedron 2006, 25 (1), 113–118. [Google Scholar]
- 47.Rodríguez E; Roig A; Molins E; Arús C; Quintero MR; Cabañas ME; Cerdán S; Lopez‐Larrubia P; Sanfeliu C, In vitro characterization of an Fe8 cluster as potential MRI contrast agent. NMR Biomed 2005, 18 (5), 300–307. [DOI] [PubMed] [Google Scholar]
- 48.Caravan P; Farrar CT; Frullano L; Uppal R, Influence of molecular parameters and increasing magnetic field strength on relaxivity of gadolinium‐and manganese‐based T1 contrast agents. Contrast Media Mol Imaging 2009, 4 (2), 89–100. [DOI] [PMC free article] [PubMed] [Google Scholar]
- 49.Koenig SH; Brown III RD, Relaxation of solvent protons by paramagnetic ions and its dependence on magnetic field and chemical environment: implications for NMR imaging. Magnetic Reson Med 1984, 1 (4), 478–495. [DOI] [PubMed] [Google Scholar]
- 50.Koenig SH; Brown III RD; Spiller M, The anomalous relaxivity of Mn3+ (TPPS4). Magn Reson Med 1987, 4 (3), 252–260. [DOI] [PubMed] [Google Scholar]
- 51.Lancelot E; Raynaud J-S; Desché P, Current and future MR contrast agents: seeking a better chemical stability and relaxivity for optimal safety and efficacy. Invest Radiol 2020, 55 (9), 578–588. [DOI] [PubMed] [Google Scholar]
- 52.Pujales-Paradela R; Regueiro-Figueroa M; Esteban-Gómez D; Platas-Iglesias C, Transition Metal-based T1 Contrast Agents. In Contrast Agents for MRI, 2017; pp 448–478.
- 53.Atkins TJ, Tricyclic Trisaminomethanes. J. Am. Chem. Soc 1980, 102, 6364–6365. [Google Scholar]
- 54.Haidar R; Ipek M; DasGupta B; Yousaf M; Zompa LJ, Copper(II) Complexes of Bis(1,4,7-triazacyclononane) Ligands with Polymethylene Bridging Groups: An Equilibrium and Structural Study. Inorg Chem 1997, 36 (14), 3125–3132. [DOI] [PubMed] [Google Scholar]
- 55.Graham B; Fallon GD; Hearn MTW; Hockless DCR; Lazarev G; Spiccia L, Coordination modes of a series of xylylene-bridged bis(1,4,7-triazacyclonon-1-yl) ligands: Synthesis, structure, and properties of nickel(II) and copper(II) complexes. Inorg Chem 1997, 36 (27), 6366–6373. [Google Scholar]
- 56.Iranzo O; Elmer T; Richard JP; Morrow JR, Cooperativity between metal ions in the cleavage of phosphate diesters and RNA by dinuclear Zn(II) catalysts. Inorg Chem 2003, 42 (24), 7737–46. [DOI] [PubMed] [Google Scholar]
- 57.Wu G; Mei F; Gao Q; Han F; Lan S; Zhang J; Li D, Syntheses, structures and properties of a series of non-heme alkoxide-Fe(III) complexes of a benzimidazolyl-rich ligand as models for lipoxygenase. Dalton Trans 2011, 40 (24), 6433–9. [DOI] [PubMed] [Google Scholar]
- 58.Pierre V.r. C. ; Allen MJ; Royal Society of Chemistry (Great Britain), Contrast agents for MRI : experimental methods. Royal Society of Chemistry: Cambridge, 2018; p xiv, 597 pages.
- 59.Swift TJ; Connick RE, Nmr-Relaxation Mechanisms of 017 in Aqueous Solutions of Paramagnetic Cations and Lifetime of Water Molecules in First Coordination Sphere. J Chem Phys 1962, 37 (2), 307-&. [Google Scholar]
- 60.Abozeid SM; Asik D; Sokolow GE; Lovell JF; Nazarenko AY; Morrow JR, CoII Complexes as Liposomal CEST Agents. Angew Chem Int Ed 2020, 132 (29), 12191–12195. [DOI] [PMC free article] [PubMed] [Google Scholar]
- 61.Brausam A; Maigut J; Meier R; Szilágyi PA; Buschmann H.-J. r.; Massa W; Homonnay Z; van Eldik R, Detailed spectroscopic, thermodynamic, and kinetic studies on the protolytic equilibria of FeIIIcydta and the activation of hydrogen peroxide. Inorg Chem 2009, 48 (16), 7864–7884. [DOI] [PubMed] [Google Scholar]
- 62.Rohrer M; Bauer H; Mintorovitch J; Requardt M; Weinmann HJ, Comparison of magnetic properties of MRI contrast media solutions at different magnetic field strengths. Invest Radiol 2005, 40 (11), 715–724. [DOI] [PubMed] [Google Scholar]
- 63.Dumas S; Jacques V; Sun WC; Troughton JS; Welch JT; Chasse JM; Schmitt-Willich H; Caravan P, High Relaxivity Magnetic Resonance Imaging Contrast Agents Part 1 Impact of Single Donor Atom Substitution on Relaxivity of Serum Albumin-Bound Gadolinium Complexes. Invest Radiol 2010, 45 (10), 600–612. [DOI] [PMC free article] [PubMed] [Google Scholar]
- 64.Shannon RD, Revised effective ionic radii and systematic studies of interatomic distances in halides and chalcogenides. Acta Cryst Section A 1976, 32 (5), 751–767. [Google Scholar]
- 65.Abozeid SM; Snyder EM; Tittiris TY; Steuerwald CM; Nazarenko AY; Morrow JR, Inner-sphere and outer-sphere water interactions in Co(II) paraCEST agents. Inorganic Chem 2018, 57 (4), 2085–2095. [DOI] [PubMed] [Google Scholar]
- 66.Bond CJ; Sokolow GE; Crawley MR; Burns PJ; Cox JM; Mayilmurugan R; Morrow JR, Exploring inner-sphere water interactions of Fe(II) and Co(II) complexes of 12-membered macrocycles to develop CEST MRI probes. Inorg Chem 2019, 58 (13), 8710–8719. [DOI] [PubMed] [Google Scholar]
- 67.Djanashvili K; Peters JA, How to determine the number of inner‐sphere water molecules in Lanthanide (III) complexes by 17O NMR spectroscopy. A technical note. Contrast Media Mol Imaging 2007, 2 (2), 67–71. [DOI] [PubMed] [Google Scholar]
- 68.Gale EM; Zhu J; Caravan P, Direct measurement of the mn (II) Hydration state in metal complexes and metalloproteins through 17O NMR line widths. J Am Chem Soc 2013, 135 (49), 18600–18608. [DOI] [PMC free article] [PubMed] [Google Scholar]
- 69.Carnovale IM; Lolli ML; Serra SC; Mingo AF; Napolitano R; Boi V; Guidolin N; Lattuada L; Tedoldi F; Baranyai Z, Exploring the intramolecular catalysis of the proton exchange process to modulate the relaxivity of Gd (iii)-complexes of HP-DO3A-like ligands. Chem Comm 2018, 54 (72), 10056–10059. [DOI] [PubMed] [Google Scholar]
- 70.Aime S; Baroni S; Delli Castelli D; Brücher E; Fábián I; Serra SC; Fringuello Mingo A; Napolitano R; Lattuada L; Tedoldi F, Exploiting the Proton Exchange as an Additional Route to Enhance the Relaxivity of Paramagnetic MRI Contrast Agents. Inorg Chem 2018, 57 (9), 5567–5574. [DOI] [PubMed] [Google Scholar]
- 71.Lattuada L; Horváth D; Serra SC; Mingo AF; Minazzi P; Bényei A; Forgács A; Fedeli F; Gianolio E; Aime S, Enhanced relaxivity of Gd III-complexes with HP-DO3A-like ligands upon the activation of the intramolecular catalysis of the prototropic exchange. Inorg Chem Front 2021.
- 72.Patel A; Asik D; Spernyak JA; Cullen PJ; Morrow JR, MRI and fluorescence studies of Saccharomyces cerevisiae loaded with a bimodal Fe (III) T1 contrast agent. J Inorg Biochem 2019, 201, 110832. [DOI] [PMC free article] [PubMed] [Google Scholar]
- 73.Toth E; Helm L; Merbach AE, Relaxivity of gadolinium (III) complexes: theory and mechanism, “The chemistry of contrast agents in medical magnetic resonance imaging” in The Chemistry of Contrast Agents in Medical Magnetic Resonance Imaging, Wiley; 2013: West Sussex, UK, chapter 2. [Google Scholar]
- 74.Caravan P; Cloutier NJ; Greenfield MT; McDermid SA; Dunham SU; Bulte JW; Amedio JC; Looby RJ; Supkowski RM; Horrocks WD, The interaction of MS-325 with human serum albumin and its effect on proton relaxation rates. J Am Chem Soc 2002, 124 (12), 3152–3162. [DOI] [PubMed] [Google Scholar]
- 75.Caravan P; Parigi G; Chasse JM; Cloutier NJ; Ellison JJ; Lauffer RB; Luchinat C; McDermid SA; Spiller M; McMurry TJ, Albumin binding, relaxivity, and water exchange kinetics of the diastereoisomers of MS-325, a gadolinium (III)-based magnetic resonance angiography contrast agent. Inorg Chem 2007, 46 (16), 6632–6639. [DOI] [PubMed] [Google Scholar]
- 76.Forgács A; Tei L; Baranyai Z; Esteban-Gómez D; Platas-Iglesias C; Botta M, Optimising the relaxivities of Mn 2+ complexes by targeting human serum albumin (HSA). Dalton Trans 2017, 46 (26), 8494–8504. [DOI] [PubMed] [Google Scholar]
- 77.Wang J; Wang H; Ramsay IA; Erstad DJ; Fuchs BC; Tanabe KK; Caravan P; Gale EM, Manganese-based contrast agents for magnetic resonance imaging of liver tumors: structure–activity relationships and lead candidate evaluation. J Med Chem 2018, 61 (19), 8811–8824. [DOI] [PMC free article] [PubMed] [Google Scholar]
- 78.Yousefi R; Jamshidi M; Shahsavani MB; Nabavizadeh SM; Haghighi MG; Rashidi M; Taheri-Kafrani A; Niazi A; Keshavarz F; Alavinamehr MM, Study on the interaction of three structurally related cationic Pt (II) complexes with human serum albumin: importance of binding affinity and denaturing properties. J Iran Chem Soc 2016, 13 (4), 617–630. [Google Scholar]
- 79.Nilsen J; Bern M; Sand KMK; Grevys A; Dalhus B; Sandlie I; Andersen JT, Human and mouse albumin bind their respective neonatal Fc receptors differently. Sci Rep 2018, 8 (1), 14648. [DOI] [PMC free article] [PubMed] [Google Scholar]
- 80.Sur SK; Bryant RG, Nuclear-and electron-spin relaxation rates in symmetrical iron, manganese, and gadolinium ions. J Phys Chem 1995, 99 (17), 6301–6308. [Google Scholar]
- 81.Li Y; Xie Y; Wang Z; Zang N; Carniato F; Huang Y; Andolina CM; Parent LR; Ditri TB; Walter ED, Structure and function of iron-loaded synthetic melanin. ACS nano 2016, 10 (11), 10186–10194. [DOI] [PMC free article] [PubMed] [Google Scholar]
- 82.Evans D, 400. The determination of the paramagnetic susceptibility of substances in solution by nuclear magnetic resonance. J Chem Soc 1959, 2003–2005.
- 83.Schubert EM, Utilizing the Evans method with a superconducting NMR spectrometer in the undergraduate laboratory. J Chem Ed 1992, 69 (1), 62. [Google Scholar]
- 84.Carney CE; MacRenaris KW; Meade TJ, Water-soluble lipophilic MR contrast agents for cell membrane labeling. J Biol Inorg Chem 2015, 20 (6), 971–977. [DOI] [PMC free article] [PubMed] [Google Scholar]
- 85.Moriggi L; Yaseen MA; Helm L; Caravan P, Serum Albumin Targeted, pH‐ Dependent Magnetic Resonance Relaxation Agents. Chem Eur J 2012, 18 (12), 3675–3686. [DOI] [PMC free article] [PubMed] [Google Scholar]
Associated Data
This section collects any data citations, data availability statements, or supplementary materials included in this article.