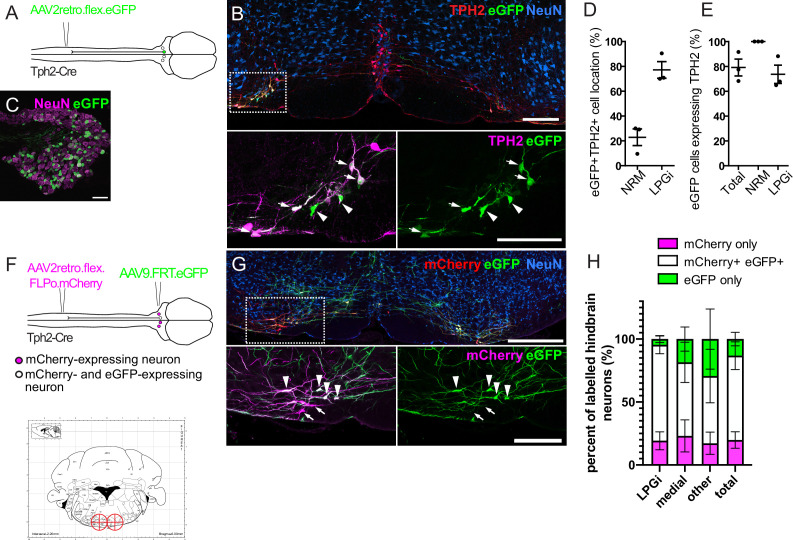
Figure 2. Labeling of spinally projecting neurons in the Tph2-Cre mouse with AAV2retro vectors.
(A). Injection scheme for labeling spinally projecting Tph2-Cre neurons. (B). An example of a hindbrain section containing neurons labeled with eGFP (scale bar = 200 μm). Inset is an enlargement of the area indicated in the dashed box, with many eGFP-labeled cells found to express detectable TPH2 that are indicated with arrows. Cells that were labelled with eGFP not containing detectable TPH2 are indicated with arrowheads (scale bar = 200 μm). (C). Image of an ipsilateral DRG from a Tph2-Cre mouse that received a spinal injection of AAV2retro.flex.eGFP, showing many eGFP-expressing neurons (scale bar = 100 μm). (D). Quantification of the location of eGFP-labeled cells in the hindbrain. (E). Quantification of the hindbrain neurons labeled with eGFP that also contain TPH2. For D. and E. each datapoint is a count per animal (n=3 animals). (F). Injection scheme for the intersectional labeling of spinally projecting Tph2-Cre neurons. Brain injection coordinates (−6,+/-0.5, 5.9) from bregma, for the labeling of spinally projecting Tph2-Cre neurons in the LPGi, according to the mouse brain atlas. Target injection sites are indicated in red crosshairs. (G). Example of a hindbrain section from a Tph2-Cre mouse that received the injections illustrated in F (scale bar = 500 μm). Inset is an enlargement of the boxed area and highlights neurons that were captured with the brain injection and express eGFP (arrowheads) as well as neurons that were directly labeled from the spinal cord injection (mCherry+) that were not transduced from the hindbrain injection (arrows),(scale bar = 200 μm). H. Quantification of the mCherry-expressing cells that are labeled with eGFP, which indicated that they were captured with the hindbrain injection. The percentages of mCherry-only and eGFP-only cells are also quantified for each hindbrain area that contains serotonergic neurons, and areas that could not be assigned as either medial or LPGi were classified as ‘other’ (n=4 animals).

