Abstract
Three fluorescent probes A, B, and C that function in the near-infrared wavelengths and utilize pseudo xanthene platforms with an oxygen atom at the 10-position replaced by a [Me-N]2− group have been created to identify hypoxia via nitroreductase determinations at the 0.04, 0.10, and 0.19 ng/mL levels. Theoretical calculations suggest that the probes are not planar due to steric interactions. Absorptions of photons result in the transition of electron density from the indoline moieties to delocalized orbitals on the anthranilic section, ending up on the nitro groups of the electron-poor (i.e., nonreduced) probes (i.e., A, B, and C), whereas those for the more electron-rich (i.e., reduced) probes consisted of movement from the indoline groups to the right side of the anthranilic sections, resulting in a shift in absorption.
Keywords: fluorescent probes, nitroreductase, tunable sensitivity, hypoxia, ultrasensitivity
Graphical Abstract
1. INTRODUCTION
Hypoxia, an inadequate oxygen level in tissues and cells, is often present with many illnesses. Tumors metastasize and deteriorate because vascular growth factors from tumor cells result in abnormal blood vessels under hypoxic conditions.1-3 Therefore, it is important to accurately determine hypoxia with noninvasive, specific, and timely quantitative approaches.1,2,4 Optical fluorescence imaging fulfilled these criteria by visualizing the detailed morphology of cells and tissues with subcellular resolution and high sensitivity.1-3 There have been recent reports of fluorescent probes functioning in the near-infrared region for hypoxic identification as these possess advantages of minimum interference from water Raman peaks, deep-tissue penetration, and low autofluorescence from the cells and tissues.1,2,4,5 As the level of hypoxia is closely associated with the concentration of reductive enzymes, such as nitroreductase, many fluorescent probes have been reported that can detect hypoxia by measuring nitroreductase. This is accomplished by introducing a nitro moiety to different fluorophores as photoinduced electron transfer acceptors or as a part of the fluorophores, allowing for the quantitative reduction of the nitro moiety and thus the detection of nitroreductase.1-3 These fluorescent probes display a low fluorescence background because of an electron-withdrawing feature of the nitro moiety.6 The enzyme nitroreductase transforms the nitro group into an amine and significantly turns on the probes’ fluorescence.7,8 However, with some probes, the enzyme reaction can take a few minutes or up to an hour for the fluorescent probes to be reduced by nitroreductase.1,2
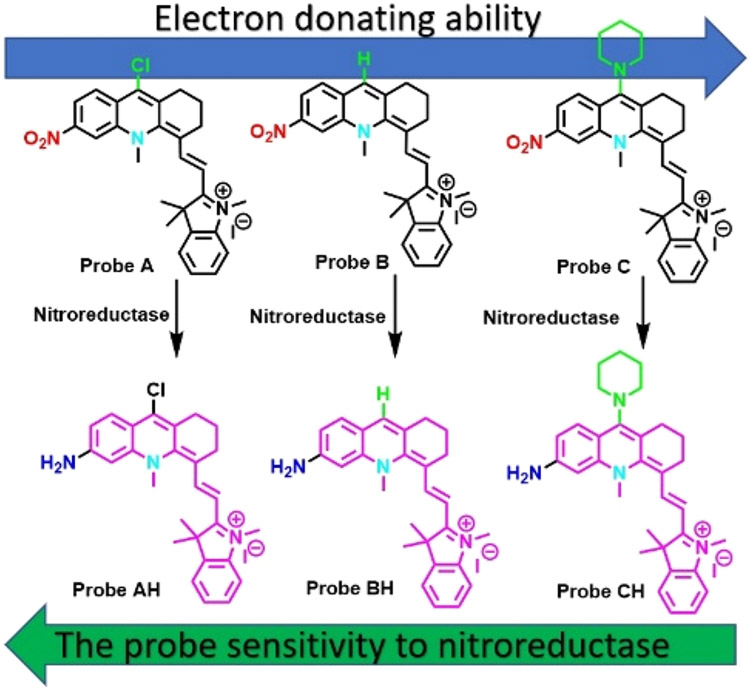
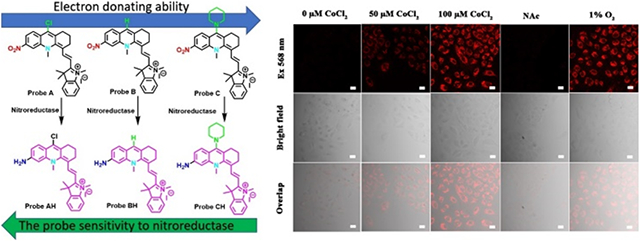
Herein, three fluorescent probes A–C that are capable of signaling hypoxia in the near-infrared region and incorporating nitro groups into new pseudo xanthene platforms, where the oxygen atoms at the 10-position are replaced by [Me-N]2− groups, are detailed (Scheme 1).9 As expected, these probes show extremely weak fluorescence since the nitro group quenches the fluorescence of the fluorophores. The effect of electron-withdrawing (i.e., Cl−) or electron-donating (i.e., piperidine) groups attached to the 9 position on the fluorescent probes on the response time to nitroreductase was also determined. Probe A, bearing the electron-with-drawing chloro group, exhibits the fastest response to nitroreductase in less than 1 min, presumably because the electron-withdrawing chloro group facilitates reduction of the nitro group by nitroreductase, while probe C, bearing an electron-donating piperidine moiety, has the slowest response to nitroreductase. Probe B, containing a neutral H atom at the 9-position, shows a slower response to nitroreductase than probe A but is faster than probe C. The probes have been used to visualize hypoxia in cells caused by treatment of different concentrations of CoCl2 and to detect nitroreductase activity in first-instar larvae of Drosophila melanogaster.
Scheme 1.
Chemical and Structural Changes of the Probes in the Responses to Nitroreductase
2. EXPERIMENTAL SECTION
2.1. Chemicals and Reagents.
2.1.1. 9-Chloro-6-nitro-1,2,3,4-tetrahydroacridine (Compound 3).
2-Amino-4-nitrobenzoic acid (364 mg, 2 mmol) and POCl3 (6 mL) were mixed with cyclohexanone (500 mg, 2.46 mmol). The mixed solution was heated at 105 °C, stirred for 12 h under an argon atmosphere, cooled to ambient temperature, and dumped into to 200 mL of ice-cold water. The pH was adjusted to 7.0 by adding saturated NaHCO3. Dichloromethane (2 × 100 mL) was used to extract the mixture which was further subjected to a saturated NaCl solution. Following collection and removal of the organic layer, the resulting yellow solid was chromatographed on a silica gel packed column (dimension, 0.063–0.2 mm Merck) through gradient elution with ethyl acetate and dichloromethane using ratios from 1:1 to 1:0 to yield compound 3 as a pale-yellow solid (419 mg, 80%). 1H NMR (400 MHz, CDCl3) δ 8.78 (d, J = 7.9 Hz, 1H), 8.30–8.15 (m, 2H), 3.11 (d, J = 5.9 Hz, 2H), 3.07–2.82 (d, J = 5.9 Hz, 2H), 1.92 (s, 6H). 13C NMR (101 MHz, CDCl3) δ 22.57, 28.12, 34.73, 119.88, 125.09, 125.72, 128.67, 132.65, 141.42, 145.59, 148.00, 162.64.
2.1.2. Synthesis of compound 4
Methyl trifluoromethanesulfonate (3.12 g, 19 mmol) was placed into a solution of compound 3 (1 g, 3.8 mmol) dissolved into 6 mL of chloroform. This mixture was stirred at 60 °C with stirring for 10 h. Following removal of the solvent, the concentrate was washed with diethyl ether (2 × 50 mL) yielding compound 4 as a yellow solid.
2.1.3. Synthesis of Probe A.
Fisher’s aldehyde (5) (0.56 mmol, 112 mg) and compound 4 (0.56 mmol, 200 mg) were placed into acetic anhydride (6 mL). This was heated and stirred at 50 °C for 2 h. The solvent was removed and the residue components were separated through chromatography on a column of nature and size similar to the one used in the procedure in section 2.1.1 under gradient elution with dichloromethane and MeOH from a 100:1 ratio to 30:1 and finally 20:1, yielding probe A as blue crystals (138 mg, 60%). 1H NMR (400 MHz, CD3OD) δ 8.69 (s, 1H), 8.35 (s, 1H), 7.75 (d, J = 13.9 Hz, 1H), 7.47 (d, J = 7.7 Hz, 1H), 7.39 (d, J = 7.3 Hz, 1H), 7.33 (d, J = 8.2 Hz, 1H), 7.29–7.23 (m, 2H), 6.20 (d, J = 13.9 Hz, 1H), 4.25 (s, 3H), 3.67 (s, 3H), 3.03 (t, J = 6.0 Hz, 2H), 2.85 (t, J = 6.1 Hz, 2H), 1.99 (t, J = 6.0 Hz, 2H), 1.65 (s, 6H). 13C NMR (101 MHz, CD3OD) δ19.87, 27.55, 27.80, 29.10, 30.75, 46.18, 49.45, 99.57, 102.29, 110.93, 113.77, 117.31, 119.74, 122.07, 125.30, 126.58, 127.14, 128.54, 137.79, 141.48, 142.87, 143.37, 148.68, 149.24, 157.71, 174.53. MS (ESI): calcd for [C27H27ClN3O2]+ 460.9815, found 460.1779.
2.1.4. Synthesis of Probe B.
Hydrazine 60% (43 mg, 0.86 mmol) and probe A (200 mg, 0.43 mmol) were placed into 6 mL dimethylformamide (DMF) and then stirred at 50 °C for 4 h. A separatory funnel containing 100 mL of dichloromethane was mixed with this solution, and 50 mL of saturated saline solution was used thrice to remove ionic materials. The organic layers were then obtained and dried using anhydrous Na2SO4. The solvents were obtained by filtration and then evaporated. The residue components were separated on an aforementioned column under gradient elution with dichloromethane and MeOH from a 70:1 ratio to 20:1, affording probe B as blue crystals (128 mg, 70%). 1H NMR (400 MHz, CDCl3) δ 8.69 (s, 1H), 8.23 (q, J = 9.1 Hz, 2H), 7.24 (d, J = 10.1 Hz, 3H), 7.04 (t, J = 7.4 Hz, 1H), 6.92 (d, J = 7.8 Hz, 1H), 5.67 (d, J = 12.9 Hz, 1H), 4.32 (s, 3H), 3.43 (s, 7H), 2.76–2.80 (m, 4H), 1.91–1.95 (m, 2h), 1.77 (s, 6H), 1.55 (s, 6H). 13C NMR (101 MHz, CDCl3) δ21.37, 24.28, 27.04, 27.98, 29.22, 29.52, 45.75, 48.12, 53.67, 109.04, 114.85, 118.88, 119.63, 122.17, 123.42, 127.84, 127.99, 128.46, 131.80, 141.64, 142.75, 148.77, 153.68, 161.69, 169.05. MS (ESI): calcd for [C32H37N4O2]+ 509.2911, found 509.2913.
2.1.5. Synthesis of Probe C.
Piperidine (55 mg, 0.65 mmol) and probe A (200 mg, 0.43 mmol) were placed into 6 mL of dimethylformamide (DMF) and stirred at 50 °C for 2 h and then placed into a separatory funnel with 100 mL of dichloromethane used to clean out the reaction flash. This solution was thrice washed with 50 mL of a saturated saline mixture. The relevant layers were collected and dried by anhydrous Na2SO4, filtered followed by evaporation to dryness. The dried solids were purified on a column (described above) under gradient elution of CH2Cl2 and MeOH at a 70:1 ratio to 25:1, affording probe C as blue crystals (175 mg, 80%). 1H NMR (400 MHz, CD3OD) δ 8.29 (s, 1H), 7.89 (dd, J = 8.6, 2.0 Hz, 1H), 7.59 (d, J = 8.6 Hz, 1H), 7.52 (s, 1H), 7.25–7.18 (m, 1H), 6.97 (t, J = 7.7 Hz, 2H), 6.86–6.75 (m, 2h), 5.56 (d, J = 13.6 Hz, 1H), 3.92 (s, 3H), 3.20 (s, 3H), 2.44–2.48 (m, 2H), 2.38–2.42 (m, 2H), 1.53–1.58 (m, 2H), 1.23 (s, 5H). 13C NMR (101 MHz, CDCl3/DMSO = 1:1) δ 20.40, 27.82, 28.93, 29.50, 31.24, 45.93, 48.84, 97.85, 110.43, 113.82, 116.42, 120.20, 122.03, 124.92, 128.57, 129.21, 129.45, 132.89, 140.10, 140.55, 142.48, 147.38, 148.40, 157.95, 172.61. MS (ESI): calcd for [C27H28N3O2]+ 426.5395, found 426.2182.
2.1.6. Synthesis of Probe AH.
SnCl2 (163 mg, 0.86 mmol) was mixed with 6 mL of ethanol containing probe A (200 mg, 0.43 mmol) and stirred at 80 °C for 6 h. The solvents were removed and the residue components were separated by chromatography (using the same type of column mentioned above) with solutions of dichloromethane and MeOH in ratios of 30:1 to 10:1, yielding AH as blue crystals (111 mg, 60%). 1H NMR (400 MHz, CDCl3) δ 7.87 (d, J = 9.1 Hz, 1H), 7.77 (s, 1H), 7.24 (d, J = 1.2 Hz, 1H), 7.21–7.18 (m, 1H), 7.13–7.09 (m, 1H), 7.08 (s, 1H), 7.01–6.95 (m, 1H), 6.81 (d, J = 7.9 Hz, 1H), 5.47 (d, J = 12.8 Hz, 1H), 4.24 (s, 3H), 3.30 (s, 3H), 2.85 (t, J = 6.5 Hz, 2H), 2.70 (t, J = 6.5 Hz, 2H), 1.93–1.85 (m, 2H), 1.51 (s, 6H). 13C NMR (101 MHz, CDCl3) δ 12.45, 21.63, 27.47, 27.95, 29.83, 30.18, 42.27, 45.45, 47.43, 53.92, 93.10, 98.66, 108.13, 116.67, 117.03, 119.62, 122.20, 122.63, 126.89, 127.26, 128.33, 139.73, 143.59, 143.94, 155.28, 156.74, 166.60. MS (ESI): calcd for [C27H29ClN3]+ 430.9995, found 430.2043.
2.2. General Procedure to Detect Nitroreductase.
All absorption and fluorescence spectra were conducted in a mixture of 0.05 M PBS buffer (pH 7.4) containing 1.0% DMSO. Twenty microliters of a solution containing 1 mM probe A, B, or C was added to 1 mL of PBS buffer in separate 2 mL test tubes, and 500 μM of NADH was prepared by adding NADH to these solutions. Nitroreductase was added to this solution followed by more PBS buffer to attain a final volume of 2 mL with nitroreductase concentrations of 0.4 ng/mL for probe A, 0.7 ng/mL for B, and 1.75 ng/mL for C. Once solutions were mixed completely, optical measurements were conducted by transferring the solution to a quartz cuvette while maintaining the temperature at 37 °C.
2.3. Cell Culture.
The A549 material was purchased from ATCC. A549 material were cultured in Dulbecco’s modified Eagle’s medium (DMEM) in the presence of 10% fetal bovine serum at 37 °C under a 5% CO2 atmosphere for the normoxic circumstance (20% O2), while the cells were cultivated for 5.5 h at 37 °C under a hypoxic condition with 1% O2 and 5% CO2 concentrations.
2.4. Confocal Fluorescence Imaging for Living Cells.
A549 cells were cultured for 12 h with initially 1 × 10⁵ cells in each 35 mm confocal dish (MatTek). The cells were scrubbed with 0.05 M pH 7.04 PBS buffer and further subjected to 5 μM of probe A, B, or C in 0.05 M pH 7.4 PBS buffer containing 1.0% DMSO for 10 min at 37 °C. For experiments (i.e., of the colocalization variety), A549 cells were subjected to 5 μM MitoView blue and 5 μM of compound A, B, or C in DMEM cell culture media in the presence of 1% DMSO for 10 min, and then scrubbed with PBS buffer thrice before fluorescence imaging using an Olympus IX 81 confocal fluorescence microscope. Fluorescence with samples containing MitoView Blue was obtained from 425 to 475 nm at 405 nm excitation, while that for the near-infrared fluorescence of the probes was obtained in the range 625 to 675 nm at 559 nm excitation. An FV10-ASW 3.1 viewer (Olympus) equipped with Photoshop and ImageJ software was employed to differentiate the pictures.
2.5. Theoretical Calculations.
Optimization and frequency calculations (no imaginary frequencies observed) were done at the APFD/6-31+G(d) level with Gaussian 1610 and GausView11 following previously described procedures.12 Excited states (ten) were computed using TD-DFT optimizations13 in water employing the Polarizable Continuum Model (PCM).14 Data for the probes are in Supporting Information.
3. RESULTS AND DISCUSSION
3.1. Synthetic Approach and Characterization.
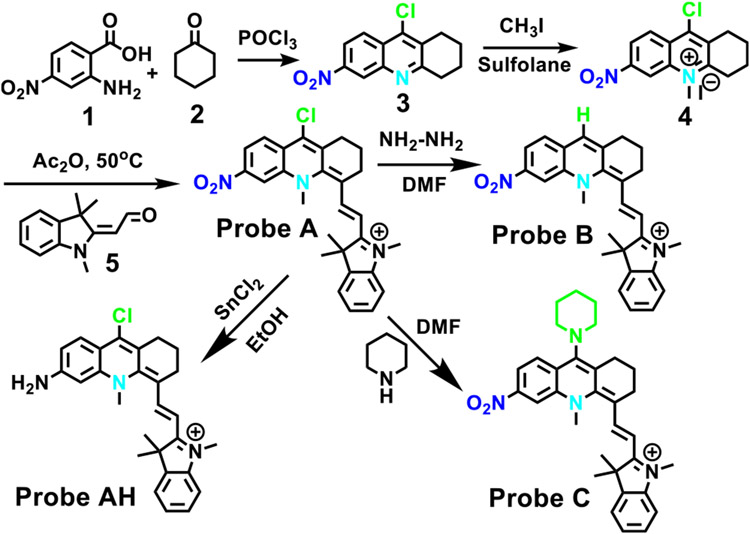
Herein we detail the development of nitroreductase-based hypoxia probes as hypoxia can result in the overexpression of reductase enzymes.1,5 We introduced a nitro group to near-infrared fluorophores based on the pseudo xanthene platform, 10-methyl-1,2,3,4-tetrahydro-10–4-acridine, at the 6-position (Scheme 1).9 This was accomplished by conducting a condensation reaction of 4-nitroanthranilic acid, 1, with cyclohexanone, 2, in fresh phosphorus(V) oxychloride at high heat,16-18 yielding 9-chloro-6-nitro-1,2,3,4-tetrahydroacridine, 3, (Scheme 2). We then converted 3 into 9-chloro-10-methyl-6-nitro-1,2,3,4-tetrahydroacridin-10-ium iodide, 4, by a methylation reaction on compound 3 (Scheme 2). Probe A was synthesized by reacting compound 4 with Fisher’s aldehyde (5) through a condensation reaction. In order to assess the effect of different electron-withdrawing or electron-donating groups on the probe’s sensitivity to nitroreductase, we replaced the chlorine atom on A with a hydrogen atom (i.e., B) and a nitrogen atom (i.e., in piperidine, C). Probe B was synthesized by reacting probe A with hydrazine in dimethylformamide, while probe C was synthesized by a substitution reaction of probe A with piperidine. The reduction product (probe AH) of probe A was obtained by mixing probe A with tin(II) chloride in dichloromethane (Scheme 2).
Scheme 2.
Synthetic Approach for the Probes
3.2. Optical Responses of the Probes to Nitroreductase.
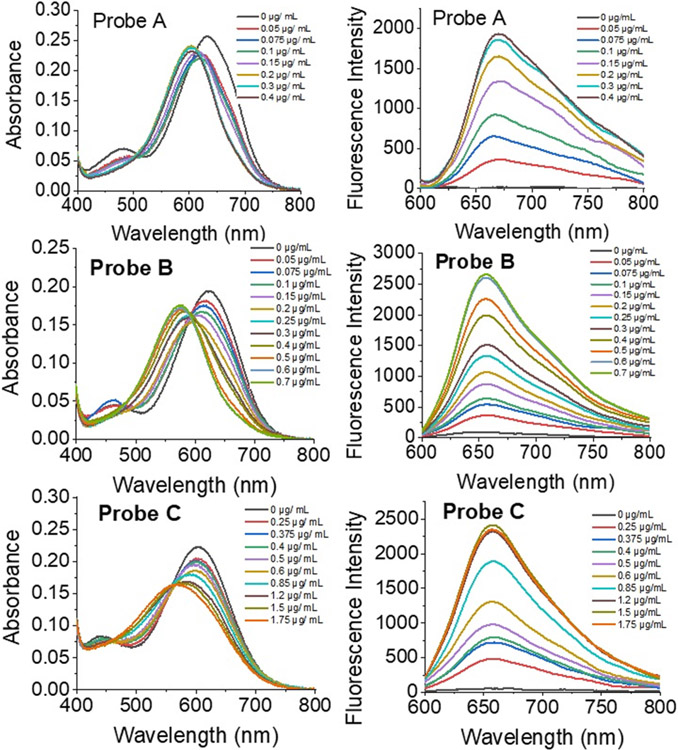
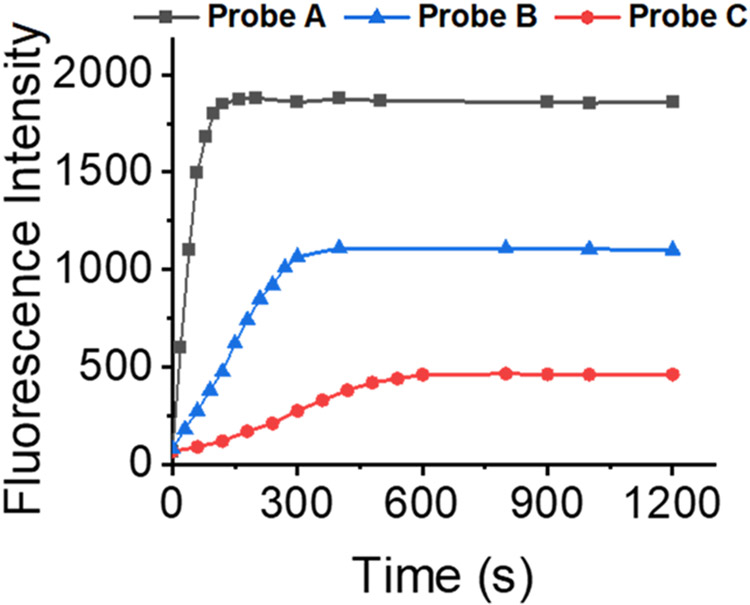
The responses of the probes verified by spectroscopy to nitroreductase in pH 7.4 PBS buffer containing 1% DMSO solution (Figure 1) were examined. Probes A, B, and C absorbed at 633, 623, and 603 nm in the absence of nitroreductase, respectively (Figure 1). In the presence of nitroreductase (0.4 ng/mL for probe A, 0.7 ng/mL for B, and 1.75 ng/mL for C), they were blue-shifted by 30, 36, and 49 nm in their absorption spectra, and they exhibited absorptions at 603, 567, and 574 nm, respectively. The shifts in the probes’ absorption to the blue spectral region arose from changes in the electron delocalization in the HOMO due to an electron-donating amine group formed through the reduction of the nitro group on the compounds by the enzyme. Solutions of the probes did not generate fluoresce due to quenching presumably from the nitro group. However, the fluorescence intensities of the probes significantly increased upon the gradual addition of nitroreductase with significantly enhanced fluorescence peaks at 666, 655, and 656 nm for probes A, B, and C, respectively. The detection limit was calculated by eq 3σ/S. All three probes show good linearity within a stated range of nitroreductase concentrations. For example, probe A (Figure S18) exhibits a good linear fluorescence relationship in the 0.04–0.2 μg range with added nitroreductase resulting in the equation of F = 8.00[nitroreductase] (μg) + 0.00895 (R2 = 0.98363), where F signifies the intensity of the reaction solution. Probe A showed the fastest response to nitroreductase in less than one minute and has a limit of detection of 0.04 ng/mL. This is presumably because the electron-withdrawing chlorine atom at the 9-position facilitates the reduction of the nitro group by nitroreductase. Probe C, bearing the electron-donating piperidine moiety at the 9-position of the xanthene platform, displayed the slowest response to nitroreductase and required 10 min and can detect down to 0.19ng/mL (Figure 2). Probe B, bearing an H atom at the 9-position of the xanthene platform, exhibited a slower response to nitroreductase than probe A, but faster than probe C (Scheme 1 and Figure 2). Probe B possesses a 0.10 ng/mL limit of detection. Temperature increases from 25 to 37.5 °C also resulted in a slight fluorescence enhancement. However, a further increase in temperature to 40 °C resulted in a slight fluorescence decrease.
Figure 1.
Absorption and fluorescence spectra for 10 μM probes –-C in pH 7.4 0.05 M tris buffers with 1.0% DMSO containing different concentrations of nitroreductase and 500 μM NADH under 580 nm excitation and 3 min incubation time for probe A, 5 min for probe B, and 10 min for probe C, respectively.
Figure 2.
Time-dependent fluorescence intensities at 655 nm for 10 μM probe A, at 655 nm for 10 μM probe B, and at 656 nm for 10 μM probe C in pH 7.4 0.05 M. The solution consisted of tris buffer and 1% DMSO with 0.2 μg/mL nitroreductase and 500 μM NADH under 580 nm excitation.
3.3. Theoretical Calculations of the Probes.
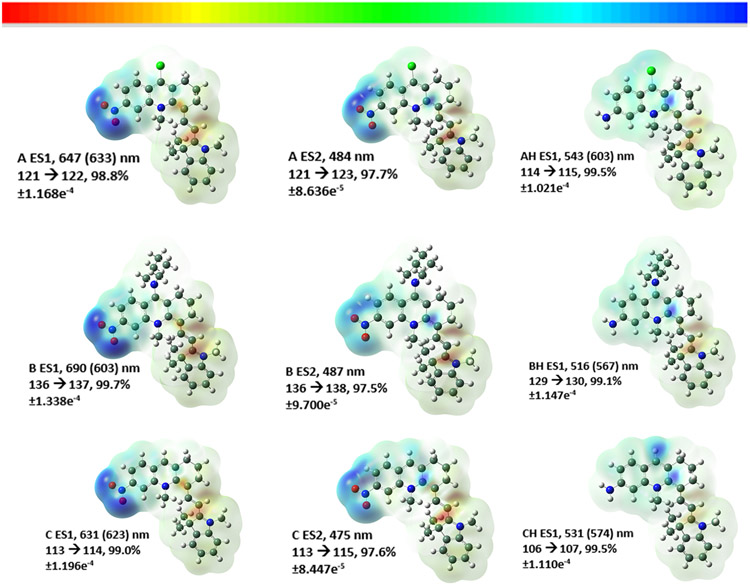
The geometries of the probe and their electronic transitions were estimated via theoretical calculations. Current density diagrams for the probes and their reduced forms are displayed in Figure 3. The probes are not planar and contain interplanar angles between the 1,3,3-trimethyl-2-(prop-1-en-1-yl)indoline and the anthranilic moieties of 42.8°, A; 42.9°, AH; 40.5°, B; 41.6°, BH, 47.4°, C; and 43.3°, CH. This is presumably due to the reduction of steric interactions between the methyl group attached to the anthranilic N atom and the two methyl groups attached to the indoline five-membered ring. The calculated absorption values compared to those obtained experimentally are within the theorized values of 0.20–0.25 eV (i.e., A 0.04, AH 0.23, B 0.26, BH 0.22, C 0.03, CH 0.17 eV), except for probe B.15 This suggests that the level of theory at APFD/6-31+G(d) was useful in calculating the absorption spectra. The spectra for probes A, B, and C consisted of two main absorptions in the visible region arising from HOMO to LUMO and HOMO to LUMO+1, as shown in Figure 3. Both of these consisted of a movement of electron density from the indoline moieties to largely delocalized orbitals over the anthranilic section and localized onto the nitro groups. In contrast, absorptions for the reduced probes consisted of transitions from the indoline groups to the right side of the anthranilic moieties, and this is the reason for the absorption shift upon reduction of probes A–C.
Figure 3.
Diagrams of the electron density variance as 3D surface representations of the probes A (top row), B (middle), and C (bottom) for two excited states (ES) and the reduced forms in the column to the right, respectively. The Supporting Information contains diagrams of the numbered MOs.
3.4. Determination of the Probe Product by a Mass Spectrometer.
To confirm that probe AH is produced from the action of nitroreductase on probe A, we conducted high-resolution electrospray mass spectrometric analysis on the product. A peak at m/z of 430.20427 in the electrospray mass spectrum corresponding to probe AH ([M+] = 430.21) was observed (Figure S14). Furthermore, the fluorescence spectra of the enzyme-catalyzed product and that of synthesized probe AH exhibit similar characteristics (Figure S22A). These results confirm that nitroreductase effectively reduces probe A to probe AH.
3.5. Study Sensing Mechanism of Probe A to Nitroreductase.
We chose probe A to study the probe response function to nitroreductase by fluorescence spectroscopy. Probe A shows weak fluorescence in the presence of 500 μM NADH, indicating that NADH is unable to reduce probe A (Figure S22B). Probe A exhibits fluorescence increases with both 0.4 μg/mL nitroreductase and 500 μM NADH at 37 °C (Figure S22B). An enzyme inhibition reaction established that this increased fluorescence response resulted from the enzyme-catalyzed reduction. When probe A was treated with either 1 mM or 2 mM of dicoumarin (DM) followed by addition of nitroreductase, the probe fluorescence intensities reduced significantly compared to those observed without added dicoumarin (Figure S22B).7 This suggests that dicoumarin effectively inhibits the enzyme activities and hinders the reduction of the probe. Enzyme inhibition was also observed at 4 °C, as we observed a very weak fluorescence when probe A and nitroreductase were mixed at that temperature (Figure S22B).7 These enzyme inhibition results convincingly demonstrated that the enhanced fluorescence responses result from enzyme-facilitated reduction reactions.7 Measurements of solutions, using high-resolution ESI mass spectrometry, also confirmed the enzyme-reduced product, probe AH (Figures S14 and S15).
3.6. Probe Selectivity to Nitroreductase.
The probes are selective and reactive to nitroreductase over CoCl2, CaCl2, glucose, vitamin C, hydrogen peroxide, tyrosine, glycine, glutamate, BSA, and KO2 (Figure S19). The probes showed low cytotoxicity and biocompatibility through MTT assays, and cell viability was higher than 84% with probe concentrations up to 20 μM (Figure S23), indicating that the probes can be useful potential imaging agents for nitroreductase detection without cytotoxic effects.
3.7. Fluorescence Cellular Imaging Applications of the Probes.
The probes can selectively stain mitochondria by electrostatically interacting with the negatively charged mitochondrial membrane.16 This was confirmed in a colocalization experiment, where A549 cells were incubated with mitochondria-specific Mitoview blue and one of either probe A, B, or C under a 1% O2 level for 5.5 h, respectively. A correlation coefficient of 0.948 (i.e., Pearson coefficient) for probe A and Mitoview demonstrated that A specifically targets mitochondria. Further, probes B and C also have similar specificities to mitochondria in live cells (Figures S24-S26).
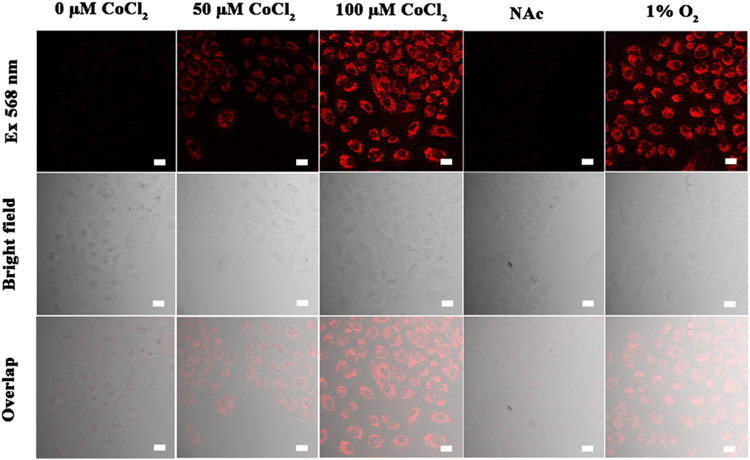
To investigate the result of a hypoxic condition for enzyme capability, we visualized the spectroscopic reactions of probes A-C in live A549 cells under normoxia and hypoxia conditions. Hypoxia conditions can be achieved either by reducing oxygen levels to 1% or by chemical treatment with varying concentrations of Co2+ ions for 6 h.6,17 Induced hypoxia via Co2+ treatment is easily accomplished in the laboratory and is a well-known effective strategy in the biology realm. It is known that the Hypoxia Inducible Factor-1 (HIF-1) can be induced by adding Co2+ ions as this inhibits the enzyme prolyl hydrolase which regulates HIF.6,17 A549 cells under hypoxic conditions through cobalt chloride treatment displayed a much stronger cellular fluorescence with increased cobalt chloride concentrations from 50 to 100 μM, while the cells under normoxia conditions without chemical treatment showed no fluorescence (Figure 4). We find that the strong fluorescence signal in A549 cells after treatment with cobalt chloride, can be reduced significantly by pretreatment of the cells with N-acetyl cysteine (NAC). This is known to reverse cell damage by consuming ROS species resulting in increases in GSH levels and protecting the H9c2 cardiomyocytes from injuries caused by chemical hypoxia.18 These results persuasively validate that the probes can be employed to indirectly measure hypoxic levels in cells (Figure 4 and Figures S27 and S28).
Figure 4.
Confocal fluorescence microscopy pictures of A549 cells subjected to 5 μM probe A with various hypoxic conditions for 10 min. From left to right: (1) control cells without treatment of CoCl2. (2) The cells were treated with 50 μM CoCl2 for 6 h, and further incubated with 5 μM probe A for 10 min. (3) The cells were treated with 100 μM CoCl2 for 6 h, and further incubated with 5 μM probe A for 10 min. (4) The cells were pretreated with N-acetyl cysteine (1.5 mM) for 1 h, further treated with 100 μM CoCl2 for 6 h, and finally incubated with 5 μM probe A for 10 min. (5) The cells were cultured under a hypoxic condition with 1% oxygen level for 6 h, and then further incubated with 5 μM probe A for 10 min. The images were obtained in the ranges detailed in the Experimental Section. Scale bar = 20 μm.
3.8. Fluorescence Imaging of Drosophila melanogaster First-Instar Larvae.
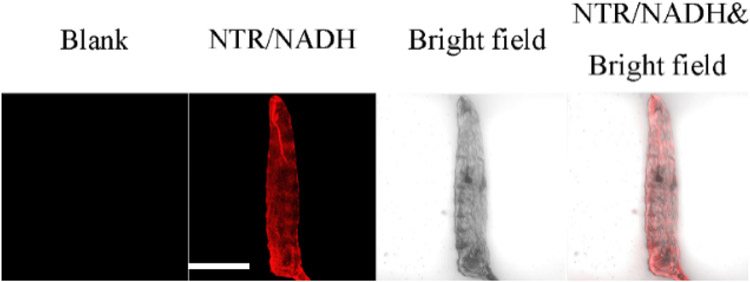
Probes A–C can be used to detect nitroreductase in D. melanogaster first-instar larvae. As is evident in Figure 5 for probe A and Figure S29 for probes B and C (all labeled blank), larvae do not fluoresce if incubated with these probes. However, there is strong fluorescence of the larvae after they were hatched with the probes and then further treated with nitroreductase (Figure 5 and Figure S29), suggesting that the probes can be employed to image nitroreductase.
Figure 5.
Images of D. melanogaster first-instar larvae subjected to incubation with 10 μM probe A for 2 h, and further incubation with 10 μg/mL NTR, and 500 μM NADH at 37 °C for 120 min. Scale bar: 200 μm. (650 ± 30 nm, λex = 580 nm semiconductor laser).
4. CONCLUSIONS
We have successfully synthesized amine-incorporated pseudo xanthene platforms that can be used to identify hypoxia in live cells. The probes have many advantages, including NIR emission, fast reaction times, and determinative fluorescence responses to nitroreductase.
Supplementary Material
ACKNOWLEDGMENTS
A high-performance computing infrastructure at Michigan Technological University was employed for the computational determinations. We acknowledge grant support for this research work by the National Institute of General Medical Sciences of the National Institutes of Health under Award Numbers R15GM114751, 2R15GM114751-02 and R15 GM146206-01 (to H.Y.L.).
Footnotes
Supporting Information
The Supporting Information is available free of charge at https://pubs.acs.org/doi/10.1021/acsabm.2c00493.
NMR, mass, absorption, and fluorescence spectra; computation results; MTT assays of the probes, their fluorescence cellular imaging, and fluorescence imaging of D. melanogaster first-instar larvae (PDF)
The authors declare no competing financial interest.
Contributor Information
Shulin Wan, Department of Chemistry, Michigan Technological University, Houghton, Michigan 49931, United States.
Tara Vohs, Department of Chemistry, Michigan Technological University, Houghton, Michigan 49931, United States.
Tessa E. Steenwinkel, Department of Biological Sciences, Michigan Technological University, Houghton, Michigan 49931, United States
Walter Reynolds White, Department of Chemistry, Michigan Technological University, Houghton, Michigan 49931, United States.
Adrian Lara-Ramirez, Department of Chemistry, Michigan Technological University, Houghton, Michigan 49931, United States.
Rudy L. Luck, Department of Chemistry, Michigan Technological University, Houghton, Michigan 49931, United States.
Thomas Werner, Department of Biological Sciences, Michigan Technological University, Houghton, Michigan 49931, United States.
Marina Tanasova, Department of Chemistry, Michigan Technological University, Houghton, Michigan 49931, United States.
Haiying Liu, Department of Chemistry, Michigan Technological University, Houghton, Michigan 49931, United States.
REFERENCES
- (1).Liu JN; Bu WB; Shi JL Chemical Design and Synthesis of Functionalized Probes for Imaging and Treating Tumor Hypoxia. Chem. Rev 2017, 117 (9), 6160–6224. [DOI] [PubMed] [Google Scholar]
- (2).Thambi T; Park JH; Lee DS Hypoxia-responsive nanocarriers for cancer imaging and therapy: recent approaches and future perspectives. Chem. Commun 2016, 52 (55), 8492–8500. [DOI] [PubMed] [Google Scholar]; Qi YL; Guo L; Chen LL; Li H; Yang YS; Jiang AQ; Zhu HL Recent progress in the design principles, sensing mechanisms, and applications of small-molecule probes for nitroreductases. Coord. Chem. Rev 2020, 421, 213460. [Google Scholar]; Yin JL; Huang L; Wu LL; Li JF; James TD; Lin WY Small molecule based fluorescent chemosensors for imaging the microenvironment within specific cellular regions. Chem. Soc. Rev 2021, 50 (21), 12098–12150. [DOI] [PubMed] [Google Scholar]
- (3).Mei J; Leung NLC; Kwok RTK; Lam JWY; Tang BZ Aggregation-Induced Emission: Together We Shine, United We Soar! Chem. Rev 2015, 115 (21), 11718–11940. [DOI] [PubMed] [Google Scholar]
- (4).Sarkar S; Lee H; Ryu HG; Singha S; Lee YM; Reo YJ; Jun YW; Kim KH; Kim WJ; Ahn KH A Study on Hypoxia Susceptibility of Organ Tissues by Fluorescence Imaging with a Ratiometric Nitroreductase Probe. ACS Sensors 2021, 6 (1), 148–155. [DOI] [PubMed] [Google Scholar]
- (5).Sun W; Guo SG; Hu C; Fan JL; Peng XJ Recent Development of Chemosensors Based on Cyanine Platforms. Chem. Rev 2016, 116 (14), 7768–7817. [DOI] [PubMed] [Google Scholar]
- (6).Fan YS; Lu M; Yu XA; He ML; Zhang Y; Ma XN; Kou JP; Yu BY; Tian JW Targeted Myocardial Hypoxia Imaging Using a Nitroreductase-Activatable Near-Infrared Fluorescent Nanoprobe. Anal. Chem 2019, 91 (10), 6585–6592. [DOI] [PubMed] [Google Scholar]
- (7).Li YH; Sun Y; Li JC; Su QQ; Yuan W; Dai Y; Han CM; Wang QH; Feng W; Li FY Ultrasensitive Near-Infrared Fluorescence-Enhanced Probe for in Vivo Nitroreductase Imaging. J. Am. Chem. Soc 2015, 137 (19), 6407–6416. [DOI] [PubMed] [Google Scholar]
- (8).Li Z; Li XH; Gao XH; Zhang YY; Shi W; Ma HM Nitroreductase Detection and Hypoxic Tumor Cell Imaging by a Designed Sensitive and Selective Fluorescent Probe, 7- (5-Nitrofuran-2-yl)methoxy −3H-phenoxazin-3-one. Anal. Chem 2013, 85 (8), 3926–3932. [DOI] [PubMed] [Google Scholar]
- (9).Wan SL; Xia S; Medford J; Durocher E; Steenwinkel TE; Rule L; Zhang YB; Luck RL; Werner T; Liu HY A ratiometric near-infrared fluorescent probe based on a novel reactive cyanine platform for mitochondrial pH detection. J. Mater. Chem. B 2021, 9 (25), 5150–5161. [DOI] [PMC free article] [PubMed] [Google Scholar]
- (10).Frisch MJ; Trucks GW; Schlegel HB; Scuseria GE; Robb MA; Cheeseman JR; Scalmani G; Barone V; Petersson GA; Nakatsuji H; 7et al. Gaussian 16, Revision A.03; Gaussian, Inc.: Wallingford CT, 2016. [Google Scholar]
- (11).Dennington R; Keith TA; Millam JM GaussView 6; Semichem Inc.: Shawnee Mission, KS, 2016. [Google Scholar]
- (12).Zhang Y; Bi J; Xia S; Mazi W; Wan S; Mikesell L; Luck RL; Liu H A near-infrared fluorescent probe based on a FRET rhodamine donor linked to a cyanine acceptor for sensitive detection of intracellular pH alternations. Molecules 2018, 23 (10), 2679. [DOI] [PMC free article] [PubMed] [Google Scholar]
- (13).Casida ME; Jamorski C; Casida KC; Salahub DR Molecular excitation energies to high-lying bound states from time-dependent density-functional response theory: Characterization and correction of the time-dependent local density approximation ionization threshold. J. Chem. Phys 1998, 108, 4439–4449. [Google Scholar]
- (14).Cancès E; Mennucci B; Tomasi J A new integral equation formalism for the polarizable continuum model: Theoretical background and applications to isotropic and anistropic dielectrics,. J. Chem. Phys 1997, 107, 3032–3041. [Google Scholar]
- (15).Adamo C; Jacquemin D The calculations of excited-state properties with Time-Dependent Density Functional Theory. Chem. Soc. Rev 2013, 42 (3), 845–856. [DOI] [PubMed] [Google Scholar]
- (16).Zhang YB; Xia S; Wan SL; Steenwinkel TE; Vohs T; Luck RL; Werner T; Liu HY Ratiometric Detection of Glutathione Based on Disulfide Linkage Rupture between a FRET Coumarin Donor and a Rhodamine Acceptor. Chembiochem 2021, 22 (13), 2282–2291. [DOI] [PMC free article] [PubMed] [Google Scholar]; Zhang YB; Xia S; Mikesell L; Whisman N; Fang MX; Steenwinkel TE; Chen K; Luck RL; Werner T; Liu HY Near-Infrared Hybrid Rhodol Dyes with Spiropyran Switches for Sensitive Ratiometric Sensing of pH Changes in Mitochondria and Drosophila melanogaster First-Instar Larvae. ACS Appl. Bio Mater 2019, 2 (11), 4986–4997. [DOI] [PMC free article] [PubMed] [Google Scholar]
- (17).Yoon SA; Chun J; Kang C; Lee MH Self-Calibrating Bipartite Fluorescent Sensor for Nitroreductase Activity and Its Application to Cancer and Hypoxic Cells. ACS Appl. Bio Mater 2021, 4 (3), 2052–2057. [DOI] [PubMed] [Google Scholar]
- (18).Singh H; Tiwari K; Tiwari R; Pramanik SK; Das A Small Molecule as Fluorescent Probes for Monitoring Intracellular Enzymatic Transformations. Chem. Rev 2019, 119 (22), 11718–11760. [DOI] [PubMed] [Google Scholar]
Associated Data
This section collects any data citations, data availability statements, or supplementary materials included in this article.


