

Abstract
Background:
Type 2 diabetes mellitus (T2DM) is the most common metabolic disorder. The aim of the present investigation was to identify gene signature specific to T2DM.
Methods:
The next generation sequencing (NGS) dataset GSE81608 was retrieved from the gene expression omnibus (GEO) database and analyzed to identify the differentially expressed genes (DEGs) between T2DM and normal controls. Then, Gene Ontology (GO) and pathway enrichment analysis, protein-protein interaction (PPI) network, modules, miRNA (micro RNA)-hub gene regulatory network construction and TF (transcription factor)-hub gene regulatory network construction, and topological analysis were performed. Receiver operating characteristic curve (ROC) analysis was also performed to verify the prognostic value of hub genes.
Results:
A total of 927 DEGs (461 were up regulated and 466 down regulated genes) were identified in T2DM. GO and REACTOME results showed that DEGs mainly enriched in protein metabolic process, establishment of localization, metabolism of proteins, and metabolism. The top centrality hub genes APP, MYH9, TCTN2, USP7, SYNPO, GRB2, HSP90AB1, UBC, HSPA5, and SQSTM1 were screened out as the critical genes. ROC analysis provides prognostic value of hub genes.
Conclusion:
The potential crucial genes, especially APP, MYH9, TCTN2, USP7, SYNPO, GRB2, HSP90AB1, UBC, HSPA5, and SQSTM1, might be linked with risk of T2DM. Our study provided novel insights of T2DM into genetics, molecular pathogenesis, and novel therapeutic targets.
Keywords: bioinformatics analysis, differentially expressed genes, hub genes, Type 2 diabetes mellitus, pathway enrichment analysis
Introduction
Type 2 diabetes mellitus (T2DM) is a complex metabolic disorder and is characterized primarily by a decrease in insulin secretion, typically accompanied by insulin resistance.1 Globally, it is predicted that 25 million adults (20-79 years) have diabetes, projected to reach 629 million by 2045 and is the ninth leading cause of death.2,3 T2DM is mainly associated with macrovascular complications include stroke, coronary artery disease and peripheral arterial disease, and microvascular complications include diabetic retinopathy, diabetic nephropathy, and diabetic neuropathy, and non-vascular diabetes complications include nonalcoholic fatty liver disease, psychiatric disease, obesity, cancer, cognitive impairment, infections, and disability.4 There are several important risk factors for T2DM, such as age, sex, family history of diabetes, hypertension, obesity, abdominal obesity, stress in the workplace or home, a sedentary lifestyle, smoking, insufficient fruit and vegetable consumption, physical activity, genetic, and environmental causes.5 Our understanding of the occurrence and development mechanism of T2DM has been greatly improved; however, the cause and potential molecular mechanism of T2DM are still unclear.6 Therefore, it is necessary to identify key genes and pathways for understanding the molecular mechanism and discovering potential biomarkers for T2DM.
In recent decades, more and more researchers have devoted themselves to exploring the potential mechanisms for progression of T2DM. Recent investigation have shown that key biomarkers, such as HHEX, CDKN2A/B, and IGF2BP2,7 CDKAL1 and HHEX/IDE,8 ADIPOQ, PPAR-γ, and RXR-α,9 ABCC8 and KCNJ11,10 TCF7L2, SLC30A8, PCSK1, and PCSK211 were involved in the T2DM. Recent studies have shown that signaling pathway, including PI3K/AKT-and AMPK signaling pathway,12 mTOR signaling pathway,13 insulin signaling pathway,14 AGE/RAGE/JNK, STAT3/SCOS3, and RAS signaling pathway,15 and ERK signaling pathway16 were involved in progression of T2DM. Therefore, it is of great practical significance to explore the genes and signaling pathways of T2DM on islet cells.
RNA sequencing technology can rapidly detect gene expression on a global basis and are particularly useful in screening for differentially expressed genes (DEGs) in diseases.17 RNA sequencing technology allows the investigation of gene expression in a high throughput manner with high sensitivity, specificity and repeatability. Significant amounts of data have been produced via the use of RNA sequencing and the majority of such data has been uploaded and stored in public databases. Indeed, some researchers found key genes and pathways in T2DM by integrated bioinformatics analysis.18-23 However, the comparative analysis of DEGs across a range of independent investigation might yield only a relatively limited amount of useful data with regard to T2DM advancement. The disadvantages of these single investigations might be overcome by NGS analysis, as this approach would make it possible to analyze the signaling pathways and interaction networks linked with the identified DEGs. This knowledge might help in elucidating the molecular mechanisms underlying T2DM and its associated complications.
In the present investigation, next generation sequencing (NGS) dataset was downloaded from the Gene Expression Omnibus (GEO) (GEO, http://www.ncbi.nlm.nih.gov/geo/)24: GSE81608.25 DEGs were identified in T2DM. We then carried out gene ontology (GO), REACTOME pathway enrichment analysis, protein-protein interaction (PPI) network analysis, module analysis, miRNA-hub gene regulatory network, and TF-hub gene regulatory network analysis to elucidate the underlying molecular mechanisms. Finally, hub genes were validated by receiver operating characteristic curve (ROC). Collectively, the findings of the present investigation highlighted crucial genes and signaling pathways that might contribute to the pathology of T2DM and associated complications. The research flowchart of this investigation was shown in Figure 1. These may provide a basis for the advancement of future diagnostic, prognostic and therapeutic tools for T2DM.
Figure 1.
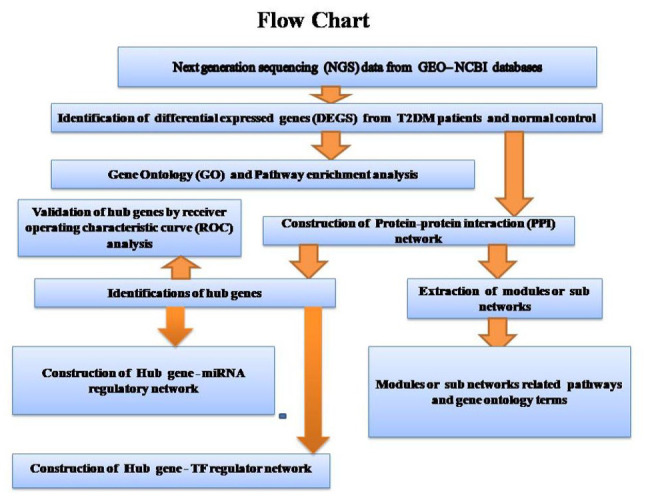
Research design flow chart.
Materials and Methods
Data resources
NGS dataset GSE8160825 was downloaded from the GEO database. The platform used for NGS data was the GPL16791 Illumina HiSeq 2500 (Homo sapiens). The GSE81608 dataset contained data from 1600 samples, including 949 T2DM samples (single human islet cells), and 651 healthy control samples (single human islet cells).
Identification of DEGs
Limma package in R software26 is a tool to identify DEGs by comparing samples from GEO series. Limma package in R software was used to search for in messenger RNAs (mRNAs; DEGs) that were differentially expressed between T2DM and healthy control samples. The cutoff criteria were an adjusted P-value of <.05, whereas the logFC value were >0.181 for up regulated genes and <−0.27 for down regulated genes. DEG of this dataset was visualized with volcano map and hierarchical clustering heat map. The volcano plot was drawn using ggplot2 package in R software. Hierarchical clustering heat maps of DEG expression (up regulated genes and down regulated genes) were visualized with gplots package in R software.
GO and REACTOME pathway enrichment analysis of DEGs
GO enrichment analysis (http://geneontology.org/)27 implements the annotation of biological processes (BP), cellular components (CC) and molecular functions (MF) of DEGs. REACTOME (https://reactome.org/)28 is a database that stores large amounts of data on genomics, biological pathways, signaling pathways, diseases, drugs, and chemicals. The present investigation used Database for g:Profiler (http://biit.cs.ut.ee/gprofiler/)29 to perform GO and REACTOME pathway enrichment analysis. P < .05 was considered to indicate a statistically significant difference.
Construction of the PPI network and module analysis
The IID interactome database (http://iid.ophid.utoronto.ca/) may be searched for associations between known and predicted proteins, and is commonly used to predict PPI information in molecular biology.30 Cytoscape 3.8.2 (http://www.cytoscape.org/)31 was used to visualize the results from the PPI network In this investigation, node degree,32 betweenness centrality,33 stress centrality,34 and closeness centrality,35 which constitutes a fundamental parameter in network theory, was adopted to evaluate the nodes in a network. The node degree betweenness centrality, stress centrality and closeness centrality methods were calculated using Cytoscape plugin Network Analyzer. Module analysis on the PPI network results was performed using the PEWCC136 clustering algorithm that comes with Cytoscape. Module analysis might be used to find out more connected gene groups. In addition, the module analysis were further analyzed for GO and pathway enrichment analysis.
MiRNA-hub gene regulatory network construction
Prediction of miRNA-hub genes was performed by miRNet database (https://www.mirnet.ca/).37 According to the regulatory interaction, miRNA-hub gene regulatory network was constructed based on miRNet by Cytoscape 3.8.2 software.31
TF-hub gene regulatory network construction
Prediction of TF-hub genes was performed by NetworkAnalyst database (https://www.networkanalyst.ca/).38 According to the regulatory interaction, TF-hub gene regulatory network was constructed based on NetworkAnalyst by Cytoscape 3.8.2 software.31
Validation of hub genes by receiver operating characteristic curve (ROC) analysis
ROC curve analysis was performed to evaluate the sensitivity and specificity of the hub genes for T2DM diagnosis using the R package “pROC.”39 An area under the curve (AUC) value was determined and used to label the ROC effect. GEO datasets were used in ROC analysis. AUC > 0.8 indicated that the model had a good fitting effect.40
Results
Identification of DEGs
A total of 927 genes were identified to be differentially expressed between T2DM and normal control samples with the threshold of adjusted P-value of <.05, and logFC value were >0.181 for up regulated genes and <−0.27 for down regulated genes. Among these DEGs, 461 were up regulated and 466 down regulated genes in T2DM compared with normal control samples and DEGs are listed in Supplemental Table S1. A heat map (Figure 2) and a volcano plot (Figure 3) for the identified DEGs was generated.
Figure 2.

Heat map of differentially expressed genes. Legend on the top left indicate log fold change of genes. (A1-A651 = normal control samples; B1-B949 = T2DM samples).
Figure 3.
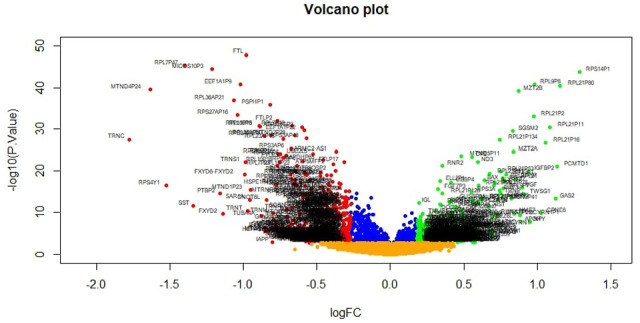
Volcano plot of differentially expressed genes. Genes with a significant change of more than two-fold were selected. Green dot represented up regulated significant genes and red dot represented down regulated significant genes.
GO and REACTOME pathway enrichment analysis of DEGs
To identify the pathways which had the most significant involvement with the genes identified, up regulated and down regulated genes were submitted into g:Profiler for GO terms are listed in Supplemental Table S2 and REACTOME pathway enrichment analysis are listed in Supplemental Table S3. GO enrichment analysis revealed that in BP terms, the up regulated genes were mainly enriched in protein metabolic process and positive regulation of biological process. Down regulated genes were mainly enriched in establishment of localization and cellular metabolic process. In CC terms, up regulated genes were mainly enriched in intracellular anatomical structure and endomembrane system, whereas down regulated genes were mainly enriched in cytoplasm and intracellular anatomical structure. In MF terms, up regulated genes were mainly enriched in heterocyclic compound binding and protein binding, whereas down regulated genes were mainly enriched in catalytic activity and protein binding. REACTOME pathway enrichment analysis demonstrated that up regulated genes were significantly enriched in metabolism of proteins, and NR1H3 and NR1H2 regulate gene expression linked to cholesterol transport and efflux. Down regulated genes were significantly enriched in the metabolism and the citric acid (TCA) cycle and respiratory electron transport.
Construction of the PPI network and module analysis
Following the analysis based on the PPI networks, 4424 nodes and 8670 edges were identified in Cytoscape (Figure 4). The genes with higher scores were the hub genes, as the genes of higher node degree, betweenness centrality, stress centrality, and closeness centrality might be linked with T2DM. The top hub genes include APP, MYH9, TCTN2, USP7, SYNPO, GRB2, HSP90AB1, UBC, HSPA5, and SQSTM1, and topological properties of each hub genes in PPI network is given in Table 1. A total of 2 modules were selected through PEWCC1 analysis, and module 1 had nodes 98 and edges 117 (Figure 5A) and module 2 had nodes 81 and edges 248 (Figure 5B). Enrichment analysis demonstrated that modules 1 and 2 might be linked with RNA polymerase II transcription, intracellular anatomical structure, metabolism of proteins, protein metabolic process, positive regulation of biological process, metabolism, immune system, establishment of localization, cytoplasm, neutrophil degranulation, cellular metabolic process, intracellular anatomical structure, and protein binding.
Figure 4.

PPI network of DEGs. The PPI network of DEGs was constructed using Cytoscap. Up regulated genes are marked in green; down regulated genes are marked in red. Big node represents nod with more number of interactions and small node represents nod with least number of interactions.
Table 1.
Topology table for up and down regulated genes.
| Regulation | Node | Degree | Betweenness | Stress | Closeness |
|---|---|---|---|---|---|
| Up | APP | 674 | 0.277552 | 48 171 576 | 0.396397 |
| Up | MYH9 | 231 | 0.067132 | 12 987 566 | 0.351087 |
| Up | TCTN2 | 203 | 0.074204 | 9 822 804 | 0.31559 |
| Up | USP7 | 156 | 0.048917 | 10 011 292 | 0.341756 |
| Up | SYNPO | 148 | 0.019807 | 5 325 396 | 0.315343 |
| Up | BCL6 | 99 | 0.03129 | 4 924 434 | 0.316788 |
| Up | PRKDC | 97 | 0.02396 | 5 704 444 | 0.339213 |
| Up | U2AF2 | 77 | 0.016653 | 3 792 650 | 0.316448 |
| Up | SKIL | 72 | 0.021529 | 2 766 174 | 0.31763 |
| Up | CTBP1 | 72 | 0.018919 | 3 933 722 | 0.30334 |
| Up | TOP1 | 66 | 0.012706 | 3 485 932 | 0.318522 |
| Up | NDRG1 | 65 | 0.014232 | 2 582 316 | 0.327508 |
| Up | NCOR2 | 62 | 0.014748 | 2 563 224 | 0.327727 |
| Up | ILF3 | 62 | 0.010796 | 3 729 048 | 0.325197 |
| Up | MAPT | 59 | 0.011654 | 2 038 018 | 0.335304 |
| Up | SNRNP70 | 56 | 0.013306 | 2 811 964 | 0.337737 |
| Up | NME7 | 54 | 0.009971 | 2 818 468 | 0.302345 |
| Up | HCFC1 | 54 | 0.011189 | 4 114 590 | 0.285724 |
| Up | SRRM2 | 53 | 0.008517 | 2 842 260 | 0.304719 |
| Up | DDX17 | 48 | 0.010257 | 2 309 956 | 0.34835 |
| Up | RUNX1T1 | 45 | 0.007377 | 1 300 474 | 0.298327 |
| Up | TNRC6B | 44 | 0.005765 | 1 772 074 | 0.294513 |
| Up | RPS3A | 43 | 0.008663 | 1 580 346 | 0.314044 |
| Up | BAX | 43 | 0.010013 | 1 360 956 | 0.305287 |
| Up | ANXA2 | 42 | 0.006725 | 1 415 220 | 0.32746 |
| Up | RAB8A | 38 | 0.009675 | 2 880 488 | 0.28541 |
| Up | ALYREF | 37 | 0.006723 | 3 260 410 | 0.299114 |
| Up | OTUD4 | 36 | 0.009901 | 1 095 992 | 0.306175 |
| Up | TNRC6A | 36 | 0.006285 | 1 066 772 | 0.298629 |
| Up | LMO1 | 36 | 0.007004 | 1 983 992 | 0.281738 |
| Up | NR4A1 | 35 | 0.007386 | 1 366 096 | 0.293516 |
| Up | DNMT1 | 35 | 0.007153 | 1 311 716 | 0.318247 |
| Up | JUNB | 34 | 0.007201 | 2 171 380 | 0.289501 |
| Up | HNRNPH1 | 34 | 0.004039 | 1 126 254 | 0.310822 |
| Up | HNRNPL | 33 | 0.002406 | 639 204 | 0.306684 |
| Up | EEF2 | 32 | 0.00508 | 1 312 314 | 0.31811 |
| Up | RPS2 | 32 | 0.005007 | 944 774 | 0.30743 |
| Up | PGAM5 | 32 | 0.004601 | 1 343 578 | 0.295695 |
| Up | CD44 | 31 | 0.005854 | 812 632 | 0.311523 |
| Up | B2M | 31 | 0.005781 | 1 559 068 | 0.265885 |
| Up | RAD52 | 30 | 0.004293 | 852 988 | 0.296289 |
| Up | ATP2A2 | 30 | 0.007054 | 1 516 120 | 0.312823 |
| Up | SREBF1 | 30 | 0.007025 | 2 186 330 | 0.278526 |
| Up | PAFAH1B1 | 29 | 0.005215 | 2 372 866 | 0.276438 |
| Up | NDN | 29 | 0.007043 | 1 329 464 | 0.296547 |
| Up | SRSF3 | 28 | 0.003437 | 1 013 722 | 0.303174 |
| Up | APLP1 | 27 | 0.006221 | 892 288 | 0.276818 |
| Up | GANAB | 27 | 0.004094 | 990 330 | 0.298347 |
| Up | RPL7 | 26 | 0.003381 | 933 236 | 0.310757 |
| Up | MPRIP | 26 | 0.001472 | 342 632 | 0.295873 |
| Up | INO80E | 25 | 0.005901 | 1 721 260 | 0.272453 |
| Up | CACNA1A | 24 | 0.010596 | 1 171 628 | 0.281863 |
| Up | CHGB | 24 | 0.006952 | 765 394 | 0.299337 |
| Up | RPL28 | 24 | 0.002372 | 585 818 | 0.299074 |
| Up | ITSN2 | 24 | 0.003281 | 939 596 | 0.286093 |
| Up | RPS10 | 23 | 0.004922 | 897 446 | 0.326132 |
| Up | RPL23A | 23 | 0.003289 | 505 840 | 0.311962 |
| Up | PHF1 | 22 | 0.003983 | 1 034 682 | 0.277426 |
| Up | HNRNPAB | 22 | 0.001844 | 495 324 | 0.3108 |
| Up | SH3GL1 | 22 | 0.003033 | 986 094 | 0.270008 |
| Up | HMGB1 | 21 | 0.002117 | 776 702 | 0.290681 |
| Up | PDK3 | 19 | 0.002946 | 742 934 | 0.275937 |
| Up | ARID1B | 19 | 0.004 | 716 712 | 0.264217 |
| Up | ABCA1 | 18 | 0.003966 | 549 762 | 0.275216 |
| Up | ESRRA | 18 | 0.002502 | 368 532 | 0.276023 |
| Up | TRA2A | 18 | 0.001473 | 605 004 | 0.285005 |
| Up | MAGI1 | 18 | 0.00426 | 637 328 | 0.277722 |
| Up | VEGFA | 17 | 0.004134 | 836 256 | 0.248525 |
| Up | ZC3HAV1 | 17 | 0.001292 | 489 318 | 0.274227 |
| Up | HIVEP1 | 16 | 0.001767 | 378 796 | 0.2718 |
| Up | SIPA1L3 | 16 | 0.001056 | 218 866 | 0.285465 |
| Up | MPP6 | 16 | 0.002628 | 324 224 | 0.275972 |
| Up | RPL17 | 16 | 0.001736 | 515 376 | 0.297165 |
| Up | SSR4 | 16 | 0.001986 | 441 016 | 0.283617 |
| Up | RPS27 | 15 | 0.002603 | 522 416 | 0.297905 |
| Up | SON | 15 | 4.63E-04 | 263 370 | 0.282512 |
| Up | PDCD4 | 15 | 0.001508 | 323 916 | 0.276732 |
| Up | TMEM79 | 15 | 0.004325 | 604 778 | 0.229337 |
| Up | MAFG | 14 | 0.002447 | 382 134 | 0.252123 |
| Up | SGSM2 | 14 | 0.002229 | 327 358 | 0.278544 |
| Up | NOL3 | 14 | 6.71E-04 | 214 960 | 0.264091 |
| Up | S100A6 | 14 | 9.74E-04 | 248 722 | 0.280861 |
| Up | MZT2A | 14 | 2.68E-04 | 75 218 | 0.276801 |
| Up | RPL21 | 14 | 0.001091 | 579 282 | 0.289843 |
| Up | MCPH1 | 14 | 8.71E-04 | 244 188 | 0.255857 |
| Up | LUC7L3 | 13 | 0.001174 | 368 838 | 0.272386 |
| Up | DDX18 | 13 | 0.001648 | 394 268 | 0.31722 |
| Up | TLE3 | 13 | 0.002428 | 330 598 | 0.309193 |
| Up | EIF5A | 13 | 0.002018 | 470 016 | 0.279742 |
| Up | LENG8 | 13 | 0.001599 | 412 736 | 0.24473 |
| Up | OCLN | 12 | 0.001253 | 314 884 | 0.263462 |
| Up | PABPN1 | 12 | 0.001338 | 370 074 | 0.285705 |
| Up | BRD1 | 11 | 0.001735 | 432 360 | 0.250156 |
| Up | KRT10 | 11 | 5.29E-04 | 212 650 | 0.28389 |
| Up | RPS26 | 11 | 6.46E-04 | 207 408 | 0.291102 |
| Up | TMEM209 | 11 | 0.002671 | 362 732 | 0.281917 |
| Up | TLK1 | 11 | 0.001007 | 270 716 | 0.252627 |
| Up | NPDC1 | 11 | 7.46E-04 | 230 746 | 0.250595 |
| Up | ST14 | 11 | 0.001157 | 228 876 | 0.261871 |
| Up | UBA6 | 10 | 0.00209 | 401 360 | 0.269055 |
| Up | MAP3K12 | 10 | 0.00226 | 336 206 | 0.272201 |
| Up | MAP2 | 10 | 0.001373 | 254 464 | 0.319327 |
| Up | ITGAV | 10 | 0.00199 | 532 090 | 0.270371 |
| Up | CPE | 10 | 0.001881 | 615 956 | 0.227778 |
| Up | TFAP4 | 10 | 7.77E-04 | 213 056 | 0.26184 |
| Up | MIER1 | 10 | 0.0015 | 272 476 | 0.264123 |
| Up | CPT1A | 9 | 5.45E-04 | 93 620 | 0.276438 |
| Up | RGL2 | 9 | 6.06E-04 | 170 470 | 0.251865 |
| Up | CYB5R3 | 9 | 9.29E-04 | 184 034 | 0.256748 |
| Up | DDR1 | 9 | 0.001327 | 189 372 | 0.266558 |
| Up | ATP1B1 | 9 | 0.001955 | 400 240 | 0.267073 |
| Up | NME3 | 9 | 0.001643 | 194 338 | 0.301808 |
| Up | MZT2B | 9 | 1.10E-04 | 28 768 | 0.258413 |
| Up | ALDH1B1 | 9 | 9.67E-04 | 319 144 | 0.277583 |
| Up | PI4KA | 9 | 7.40E-04 | 268 444 | 0.277879 |
| Up | CSNK1G2 | 9 | 0.001421 | 396 030 | 0.252931 |
| Up | CITED2 | 9 | 0.002327 | 530 770 | 0.263431 |
| Up | RANBP3 | 9 | 0.001499 | 304 686 | 0.236853 |
| Up | NRP1 | 8 | 8.45E-04 | 148 358 | 0.258398 |
| Up | PGRMC2 | 8 | 4.66E-04 | 87 082 | 0.262275 |
| Up | HLA-B | 5 | 0 | 0 | 0.210049 |
| Up | HLA-A | 4 | 7.39E-05 | 16 916 | 0.249408 |
| Up | EIF1AX | 1 | 0 | 0 | 0.28389 |
| Up | ARL4C | 1 | 0 | 0 | 0.28389 |
| Up | RPL41 | 1 | 0 | 0 | 0.28389 |
| Up | UBXN6 | 1 | 0 | 0 | 0.28389 |
| Up | CDK10 | 1 | 0 | 0 | 0.267235 |
| Up | DPH1 | 1 | 0 | 0 | 0.266639 |
| Up | AHDC1 | 1 | 0 | 0 | 0.259871 |
| Up | SEZ6L2 | 1 | 0 | 0 | 0.191166 |
| Up | PDCD2 | 1 | 0 | 0 | 0.222239 |
| Up | PTPN18 | 1 | 0 | 0 | 0.285576 |
| Up | NISCH | 1 | 0 | 0 | 0.285576 |
| Up | RBM33 | 1 | 0 | 0 | 0.285576 |
| Up | WIPF2 | 1 | 0 | 0 | 0.285576 |
| Up | MCU | 1 | 0 | 0 | 0.225479 |
| Up | ZZEF1 | 1 | 0 | 0 | 0.241075 |
| Up | FCGRT | 1 | 0 | 0 | 0.210049 |
| Up | EMC10 | 1 | 0 | 0 | 0.239898 |
| Up | PLD3 | 1 | 0 | 0 | 0.239898 |
| Up | FADS2 | 1 | 0 | 0 | 0.239898 |
| Up | FAM102A | 1 | 0 | 0 | 0.212614 |
| Up | SEMA6A | 1 | 0 | 0 | 0.222463 |
| Up | ZFX | 1 | 0 | 0 | 0.232008 |
| Up | USP27X | 1 | 0 | 0 | 0.21869 |
| Down | GRB2 | 431 | 0.172947 | 23 419 584 | 0.399693 |
| Down | HSP90AB1 | 225 | 0.07414 | 15 655 320 | 0.364663 |
| Down | UBC | 224 | 0.075316 | 15 138 294 | 0.356148 |
| Down | HSPA5 | 144 | 0.05737 | 10 318 564 | 0.363554 |
| Down | SQSTM1 | 123 | 0.036494 | 6 909 982 | 0.339317 |
| Down | XRCC6 | 121 | 0.034438 | 8 751 842 | 0.335228 |
| Down | HSPA8 | 120 | 0.03154 | 6 567 910 | 0.365537 |
| Down | TUBA1C | 91 | 0.023847 | 3 670 590 | 0.328896 |
| Down | TUBG1 | 81 | 0.017666 | 3 231 832 | 0.324267 |
| Down | PSMC5 | 80 | 0.015146 | 3 450 624 | 0.332456 |
| Down | CSNK2B | 77 | 0.019998 | 5 358 078 | 0.32002 |
| Down | CDC23 | 75 | 0.021091 | 6 346 650 | 0.302076 |
| Down | SAT1 | 69 | 0.01963 | 4 672 960 | 0.296746 |
| Down | GAPDH | 63 | 0.012495 | 2 722 934 | 0.342046 |
| Down | GABARAP | 62 | 0.01438 | 2 298 584 | 0.299175 |
| Down | RAD23A | 56 | 0.009202 | 1 854 168 | 0.312778 |
| Down | PKM | 51 | 0.009281 | 2 445 062 | 0.320972 |
| Down | DNAJA1 | 51 | 0.008274 | 2 322 170 | 0.320763 |
| Down | PSMB3 | 50 | 0.005865 | 1 322 226 | 0.308051 |
| Down | EXOSC1 | 50 | 0.01119 | 2 195 338 | 0.294709 |
| Down | DDIT3 | 48 | 0.01172 | 2 529 152 | 0.297345 |
| Down | NDUFA9 | 47 | 0.013121 | 3 147 348 | 0.291102 |
| Down | CANX | 46 | 0.01141 | 2 049 224 | 0.314089 |
| Down | IBTK | 45 | 0.008641 | 1 736 696 | 0.290891 |
| Down | SCNM1 | 45 | 0.006692 | 2 252 600 | 0.281594 |
| Down | PSMC4 | 42 | 0.003699 | 829 472 | 0.31331 |
| Down | NDUFA12 | 42 | 0.004926 | 813 880 | 0.250837 |
| Down | MBIP | 42 | 0.01045 | 2 311 340 | 0.274601 |
| Down | PSMD7 | 41 | 0.002834 | 722 504 | 0.302179 |
| Down | USP22 | 41 | 0.011629 | 3 407 576 | 0.279884 |
| Down | PSMD6 | 40 | 0.001629 | 559 916 | 0.281863 |
| Down | CLU | 40 | 0.00841 | 1 216 580 | 0.309431 |
| Down | AIFM1 | 39 | 0.005419 | 1 729 814 | 0.299966 |
| Down | MORF4L2 | 39 | 0.011082 | 2 538 970 | 0.275662 |
| Down | PRDX1 | 38 | 0.005407 | 1 341 464 | 0.312403 |
| Down | ARL6IP1 | 37 | 0.012555 | 1 641 598 | 0.244635 |
| Down | CAPZB | 36 | 0.004358 | 1 050 292 | 0.311742 |
| Down | PSMD12 | 34 | 0.001447 | 422 448 | 0.305161 |
| Down | PSMB7 | 34 | 0.001154 | 364 868 | 0.289577 |
| Down | BCAP31 | 34 | 0.013785 | 1 768 344 | 0.327824 |
| Down | PSMB5 | 34 | 0.003403 | 666 674 | 0.313199 |
| Down | NR0B2 | 34 | 0.005798 | 1 517 314 | 0.302138 |
| Down | TUBA4A | 33 | 0.005178 | 1 530 624 | 0.307217 |
| Down | RNF6 | 33 | 0.003643 | 1 333 208 | 0.262166 |
| Down | MPP1 | 32 | 0.007264 | 815 422 | 0.302924 |
| Down | CAMK2D | 32 | 0.008412 | 1 997 208 | 0.289805 |
| Down | PSMF1 | 32 | 0.006012 | 1 557 236 | 0.280594 |
| Down | ALDOA | 31 | 0.004458 | 960 392 | 0.311391 |
| Down | PSMA4 | 30 | 0.002283 | 522 348 | 0.297505 |
| Down | PSMB2 | 30 | 0.003431 | 769 210 | 0.296309 |
| Down | UCHL1 | 28 | 0.00501 | 791 348 | 0.328067 |
| Down | TXN2 | 28 | 0.00596 | 1 364 924 | 0.272084 |
| Down | ORC3 | 28 | 0.005692 | 1 623 144 | 0.284273 |
| Down | CLIC1 | 27 | 0.004327 | 824 568 | 0.304447 |
| Down | UBE2L6 | 27 | 0.006391 | 1 958 890 | 0.274499 |
| Down | GBA | 26 | 0.004796 | 875 116 | 0.282061 |
| Down | ENO1 | 26 | 0.00367 | 1 143 078 | 0.306876 |
| Down | RPL14 | 26 | 0.004161 | 1 610 674 | 0.298569 |
| Down | FTH1 | 24 | 0.004084 | 777 832 | 0.276783 |
| Down | TXN | 24 | 0.003003 | 482 510 | 0.302717 |
| Down | GSTP1 | 24 | 0.004232 | 1 080 546 | 0.295201 |
| Down | REEP5 | 24 | 0.005234 | 1 041 918 | 0.267817 |
| Down | TOX4 | 23 | 0.005025 | 1 370 332 | 0.276058 |
| Down | TTR | 23 | 0.003317 | 617 718 | 0.272823 |
| Down | CORO1C | 23 | 0.001258 | 341 072 | 0.296269 |
| Down | GTF2B | 22 | 0.004837 | 1 919 700 | 0.246228 |
| Down | PPIB | 21 | 0.002633 | 702 460 | 0.286557 |
| Down | UFD1 | 20 | 0.00202 | 299 278 | 0.298952 |
| Down | GLUL | 20 | 0.003636 | 572 524 | 0.266767 |
| Down | SCAMP3 | 19 | 0.002153 | 497 590 | 0.274738 |
| Down | FTL | 19 | 0.004867 | 440 140 | 0.298006 |
| Down | SLC25A5 | 19 | 0.001986 | 352 068 | 0.310844 |
| Down | UBE2B | 19 | 0.002118 | 572 844 | 0.260713 |
| Down | ZNF326 | 19 | 0.002394 | 916 478 | 0.295359 |
| Down | LAMTOR1 | 19 | 0.004398 | 814 628 | 0.252454 |
| Down | ZNF410 | 18 | 0.004751 | 566 192 | 0.302386 |
| Down | PRDX6 | 18 | 0.002313 | 594 114 | 0.280327 |
| Down | DRG1 | 18 | 0.002816 | 810 156 | 0.295122 |
| Down | ATP6V1B2 | 18 | 0.002914 | 816 976 | 0.270388 |
| Down | ZNF165 | 18 | 0.003519 | 739 876 | 0.262493 |
| Down | NDUFV3 | 18 | 0.001755 | 335 550 | 0.259292 |
| Down | EIF3K | 18 | 0.004959 | 1 105 612 | 0.27343 |
| Down | NSFL1C | 17 | 0.003491 | 339 954 | 0.287189 |
| Down | ARCN1 | 17 | 0.002733 | 778 374 | 0.290204 |
| Down | TPI1 | 17 | 0.001365 | 553 820 | 0.293848 |
| Down | ARRDC3 | 17 | 0.001321 | 468 292 | 0.265518 |
| Down | NDUFB8 | 16 | 0.001576 | 271 076 | 0.25175 |
| Down | PRDX5 | 15 | 0.00314 | 356 484 | 0.304824 |
| Down | RPS28 | 15 | 0.00171 | 509 708 | 0.276317 |
| Down | TCEAL4 | 15 | 0.002744 | 249 400 | 0.281451 |
| Down | VAMP8 | 15 | 0.003131 | 687 744 | 0.270437 |
| Down | TRAPPC2L | 14 | 0.004206 | 559 988 | 0.293516 |
| Down | CNOT6L | 14 | 0.002421 | 339 456 | 0.257721 |
| Down | ATP6V1D | 14 | 0.002838 | 320 770 | 0.28589 |
| Down | DYNLRB1 | 14 | 0.001865 | 358 956 | 0.26184 |
| Down | EDARADD | 13 | 0.001601 | 322 314 | 0.258051 |
| Down | PEF1 | 13 | 0.001577 | 414 800 | 0.268957 |
| Down | FARSA | 13 | 0.001697 | 508 804 | 0.2652 |
| Down | POLE3 | 12 | 0.004074 | 517 276 | 0.286019 |
| Down | COX4I1 | 12 | 0.002449 | 321 508 | 0.261561 |
| Down | ETV5 | 12 | 0.003438 | 1 053 244 | 0.236334 |
| Down | NAPA | 12 | 0.002141 | 556 788 | 0.283217 |
| Down | VPS25 | 12 | 0.002068 | 519 502 | 0.245014 |
| Down | BEX1 | 12 | 0.001246 | 267 736 | 0.267979 |
| Down | XPOT | 11 | 0.001347 | 381 778 | 0.281774 |
| Down | MT2A | 11 | 0.001882 | 359 724 | 0.241562 |
| Down | NDUFB7 | 11 | 0.001 | 155 788 | 0.238231 |
| Down | MRPS35 | 11 | 0.00194 | 415 706 | 0.264107 |
| Down | MRPS15 | 11 | 0.001587 | 179 036 | 0.276058 |
| Down | PLEKHB2 | 11 | 0.001437 | 374 900 | 0.236057 |
| Down | NSMCE2 | 11 | 0.001999 | 798 156 | 0.237464 |
| Down | CTNNAL1 | 11 | 0.001959 | 302 074 | 0.253119 |
| Down | PPIL1 | 11 | 0.001172 | 393 624 | 0.278019 |
| Down | PRPS2 | 10 | 0.001596 | 384 080 | 0.259383 |
| Down | COX6B1 | 10 | 5.69E-04 | 148 866 | 0.236765 |
| Down | ETV6 | 10 | 0.002363 | 207 722 | 0.296408 |
| Down | CAP1 | 10 | 5.76E-04 | 164 992 | 0.273972 |
| Down | SPCS2 | 10 | 0.001427 | 294 448 | 0.282801 |
| Down | GRAMD2B | 10 | 0.002536 | 387 376 | 0.231425 |
| Down | CDC42BPA | 10 | 0.001848 | 460 620 | 0.252858 |
| Down | ATP6V1E1 | 2 | 1.68E-05 | 7358 | 0.256421 |
| Down | MPC1 | 1 | 0 | 0 | 0.230293 |
| Down | TRUB1 | 1 | 0 | 0 | 0.28389 |
| Down | NANS | 1 | 0 | 0 | 0.267235 |
| Down | MDH1 | 1 | 0 | 0 | 0.267235 |
| Down | GHITM | 1 | 0 | 0 | 0.266639 |
| Down | COA3 | 1 | 0 | 0 | 0.207341 |
| Down | NEU1 | 1 | 0 | 0 | 0.224518 |
| Down | UQCC2 | 1 | 0 | 0 | 0.285576 |
| Down | RBP4 | 1 | 0 | 0 | 0.214355 |
| Down | CUTA | 1 | 0 | 0 | 0.226925 |
| Down | GPX2 | 1 | 0 | 0 | 0.228591 |
| Down | PXK | 1 | 0 | 0 | 0.230257 |
| Down | TSPYL5 | 1 | 0 | 0 | 0.254722 |
| Down | ALG3 | 1 | 0 | 0 | 0.239898 |
| Down | ZMPSTE24 | 1 | 0 | 0 | 0.239898 |
| Down | SCD | 1 | 0 | 0 | 0.239898 |
| Down | UQCRH | 1 | 0 | 0 | 0.200544 |
| Down | EIF5A2 | 1 | 0 | 0 | 0.232008 |
| Down | ATXN7L3B | 1 | 0 | 0 | 0.21869 |
Figure 5.

Modules of isolated form PPI of DEGs: (A) the most significant module was obtained from PPI network with 98 nodes and 117 edges for up regulated genes and (B) the most significant module was obtained from PPI network with 81 nodes and 248 edges for down regulated genes. Up regulated genes are marked in green; down regulated genes are marked in red.
MiRNA-hub gene regulatory network construction
The hub genes of the DEGs in T2DM were performed by online databases miRNet. Based on the miRNAs, a miRNA-hub gene regulatory network was constructed with 2630 nodes (miRNA: 2345 and hub gene: 285) and 20 765 interaction pairs (Figure 6). PRKDC was the gene targets of 163 miRNAs (eg, hsa-mir-142-5p), MYH9 was the gene targets of 126 miRNAs (eg, hsa-mir-181b-3p), APP was the gene targets of 125 miRNAs (eg, hsa-mir-216b-5p), ILF3 was the gene targets of 107 miRNAs (eg, hsa-mir-3157-3p), SKIL was the gene targets 91 of miRNAs (eg, hsa-mir-1294), HSPA8 was the gene targets of 116 of miRNAs (eg, hsa-mir-3661), HSP90AB1 was the gene targets of 103 of miRNAs (eg, hsa-mir-200a-3p), SQSTM1 was the gene targets of 94 of miRNAs (eg, hsa-mir-520d-5p), HSPA5 was the gene targets of 88 of miRNAs (eg, hsa-mir-573), and GRB2 was the gene targets of 65 of miRNAs (eg, hsa-mir-1291), and topological properties of each hub genes and miRNAs in miRNA-hub gene regulatory network are listed in Table 2.
Figure 6.

MiRNA-hub gene regulatory network. The purple color diamond nodes represent the key miRNAs; up regulated genes are marked in green; down regulated genes are marked in orange.
Table 2.
miRNA-target gene and TF-target gene interaction.
| Regulation | Target genes | Degree | MicroRNA | Regulation | Target genes | Degree | TF |
|---|---|---|---|---|---|---|---|
| Up | PRKDC | 163 | hsa-mir-142-5p | Up | BCL6 | 60 | NOTCH1 |
| Up | MYH9 | 126 | hsa-mir-181b-3p | Up | MYH9 | 53 | PPARD |
| Up | APP | 125 | hsa-mir-216b-5p | Up | NCOR2 | 50 | HIF1A |
| Up | ILF3 | 107 | hsa-mir-3157-3p | Up | APP | 45 | SMARCA4 |
| Up | SKIL | 91 | hsa-mir-1294 | Up | NDRG1 | 44 | SUZ12 |
| Up | NCOR2 | 81 | hsa-mir-4708-3p | Up | TOP1 | 41 | CREM |
| Up | U2AF2 | 65 | hsa-mir-196a-5p | Up | ILF3 | 41 | DACH1 |
| Up | NDRG1 | 60 | hsa-mir-374a-5p | Up | MAPT | 38 | YAP1 |
| Up | TOP1 | 45 | hsa-mir-424-5p | Up | SKIL | 37 | GATA2 |
| Up | CTBP1 | 45 | hsa-mir-944 | Up | PRKDC | 36 | NUCKS1 |
| Up | BCL6 | 35 | hsa-mir-4701-3p | Up | CTBP1 | 35 | ELF1 |
| Up | USP7 | 34 | hsa-mir-93-5p | Up | U2AF2 | 34 | KDM6A |
| Up | MAPT | 23 | hsa-mir-2278 | Up | SYNPO | 28 | SMAD4 |
| Up | SYNPO | 15 | hsa-mir-138-5p | Up | USP7 | 27 | NANOG |
| Up | TCTN2 | 9 | hsa-mir-34a-5p | Up | TCTN2 | 10 | SRF |
| Down | HSPA8 | 116 | hsa-mir-3661 | Down | UBC | 64 | TAF7L |
| Down | HSP90AB1 | 103 | hsa-mir-200a-3p | Down | HSP90AB1 | 49 | RUNX2 |
| Down | SQSTM1 | 94 | hsa-mir-520d-5p | Down | TUBA1C | 47 | MITF |
| Down | HSPA5 | 88 | hsa-mir-573 | Down | HSPA5 | 44 | YAP1 |
| Down | GRB2 | 65 | hsa-mir-1291 | Down | HSPA8 | 39 | E2F1 |
| Down | SAT1 | 56 | hsa-mir-301b-3p | Down | GAPDH | 38 | SOX11 |
| Down | UBC | 55 | hsa-mir-9-5p | Down | GABARAP | 38 | HOXB4 |
| Down | GAPDH | 54 | hsa-mir-5690 | Down | GRB2 | 37 | TFAP2A |
| Down | TUBA1C | 53 | hsa-mir-603 | Down | CSNK2B | 35 | THAP11 |
| Down | CDC23 | 51 | hsa-mir-376a-5p | Down | PSMC5 | 33 | STAT4 |
| Down | TUBG1 | 32 | hsa-mir-182-5p | Down | SQSTM1 | 30 | EP300 |
| Down | XRCC6 | 31 | hsa-mir-618 | Down | CDC23 | 27 | TEAD4 |
| Down | GABARAP | 26 | hsa-mir-34b-3p | Down | SAT1 | 25 | SALL4 |
| Down | PSMC5 | 10 | hsa-mir-452-5p | Down | XRCC6 | 23 | YY1 |
| Down | CSNK2B | 9 | hsa-mir-149-3p | Down | TUBG1 | 22 | SOX2 |
TF-hub gene regulatory network construction
The hub genes of the DEGs in T2DM were performed by online databases NetworkAnalyst. Based on the TFs, a TF-hub gene regulatory network was constructed with 477 nodes (TF: 192 and hub gene: 285) and 8507 interaction pairs (Figure 7). BCL6 was the gene targets of 60 TFs (eg, NOTCH1), MYH9 was the gene targets of 53 TFs (eg, PPARD), NCOR2 was the gene targets of 50 TFs (eg, HIF1A), APP was the gene targets of 45 TFs (eg, SMARCA4), NDRG1 was the gene targets of 44 TFs (eg, SUZ12), UBC was the gene targets of 64 TFs (eg, TAF7L), HSP90AB1 was the gene targets of 49 TFs (eg, RUNX2), TUBA1C was the gene targets of 47 TFs (eg, MITF), HSPA5 was the gene targets of 44 TFs (eg, YAP1), and HSPA8 was the gene targets of 39 TFs (eg, E2F1), and topological properties of each hub genes and TFs in TF-hub gene regulatory network are listed in Table 2.
Figure 7.

TF-hub gene regulatory network. The blue color triangle nodes represent the key TFs; up regulated genes are marked in green; down regulated genes are marked in red.
Validation of hub genes by receiver operating characteristic curve (ROC) analysis
Validated by ROC curves, we found that 10 hub genes had high sensitivity and specificity, including APP (AUC = 0.853), MYH9 (AUC = 0.852), TCTN2 (AUC = 0.881), USP7 (AUC = 0.862), SYNPO (AUC = 0.893), GRB2 (AUC = 0.850), HSP90AB1 (AUC = 0.870), UBC (AUC = 0.865), HSPA5 (AUC = 0.902), and SQSTM1 (AUC = 0.875) (Figure 8). The hub genes might be biomarkers of T2DM and have positive implications for early medical intervention of the disease.
Figure 8.

ROC curve validated the sensitivity, specificity of hub genes as a predictive biomarker for T2DM: (A) APP, (B) MYH9, (C) TCTN2, (D) USP7, (E) SYNPO, (F) GRB2, (G) HSP90AB1, (H) UBC, (I) HSPA5, and (J) SQSTM1.
Discussion
Although there are various investigations on T2DM that have been conducted, the mortality of T2DM is still high. This might be due to the lack of valid biomarkers for detection of early stage T2DM and of valid treatment for T2DM. Therefore, molecular mechanisms of T2DM are necessary for scientists to find the treat and diagnosis method of T2DM. Because of the fast advancement of NGS technology, it is more convenient to find out the genetic modification of development of diseases. NGS facilitates us to examine the gene, the genetic modification in T2DM, which had been proved to be a better approach to find novel biomarkers in other metabolic diseases.
In the present investigation, we observed whether there were more beneficial genes which could be better biomarkers for the diagnosis, prognosis and therapeutic for T2DM. In order to find out the significant gene of T2DM, we analyzed the NGS data GSE81608 in Limma, where a total number of 927 DEGs were obtained between T2DM and normal control, comprising was 461 up regulated and 466 down regulated genes. CTBP141 and TRNC42 are involved in the pathogenesis of T2DM. A previous study has demonstrated that SST (somatostatin) serves an essential role in obesity.43 Therefore, the data suggest that the identified DEGs might participant in the development of T2DM and associated complications and contribute to T2DM treatment.
Then, databases including GO and REACTOME were selected to do gene enrichment analysis. Metabolism of proteins,44 metabolism,45 the citric acid (TCA) cycle and respiratory electron transport,46 gluconeogenesis,47 immune system,48 heterocyclic compound binding,49 protein binding,50 establishment of localization,51 cellular metabolic process,52 cytoplasm,53 and catalytic activity54 were the GO terms and signaling pathways responsible for the advancement of T2DM. A previous study showed that IGFBP2,55 APOH (apolipoprotein H),56 ANXA2,57 BAX (BCL2 associated X, apoptosis regulator),58 PCSK1N,59 PDK4,60 CPE (carboxypeptidase E),61 OCLN (occludin),62 CD44,63 NDN (necdin, MAGE family member),64 MLXIPL (MLX interacting protein like),65 CD36,66 SREBF1,67 NR4A1,68 PCSK2,69 CHGB (chromogranin B),70 PDK3,71 PDCD4,72 EIF5A,73 NRP1,74 ABCA1,75 DNMT1,76 MYH9,77 HMGB1,78 B4GALT5,79 B2M,80 MAP3K12,81 KSR2,82 NPY (neuropeptide Y),83 CHGA (chromogranin A),84 CD47,85 DLK1,86 PDK4,87 CPE (carboxypeptidase E),61 OCLN (occludin),62 CXXC4,88 PEMT (phosphatidylethanolamine N-methyltransferase),89 FADS2,90 RREB1,91 HNRNPAB (heterogeneous nuclear ribonucleoprotein A/B),92 CPT1A,93 ALDH1B1, 94 ESRRA (estrogen related receptor alpha),95 NISCH (nischarin),96 SSTR3,97 ND1,98 NCOR2,99 RBP4,100 GSTP1,101 CYB5A,102 G6PC2,103 DNAJC15,104 TMED6,105 PSMD6,106 CLU (clusterin),107 TTR (transthyretin),108 TXN (thioredoxin),109 LAMTOR1,110 GLUL (glutamate-ammonia ligase),111 NEU1,112 HSPA8,113 AP3S2,114 COX4I1,115 MT2A116 MTCH2,117 ESD (esterase D),118 UBE2L6,119 SCD (stearoyl-CoA desaturase),120 MGST3,121 NQO1,122 NSMCE2,123 and PRSS1124 played an important role in T2DM. Quintela et al,125 Yuan et al,126 Cacace et al,127 Hao et al,128 Beckelman et al,129 Liu et al,130 Sekiguchi et al,131 Castillon et al,132 O’Donnell-Luria et al,133 Coupland et al,134 Koufaris et al,135 Qvist et al,136 Richter et al,137 Torres et al,138 Jeong et al,139 Bermejo-Bescós et al,140 Ramon-Duaso et al,141 Guilarte,142 Mukaetova-Ladinska et al,143 Fazeli et al,144 Butler et al,145 Nackenoff et al,146 Konyukh et al,147 Hu et al,148 Kaur et al,149 Nakamura et al,150 Liu et al,151 Obara et al,152 Herrmann et al,153 Ozgen et al,154 Masciullo et al,155 Perrone et al,156 Su et al,157 Zhao et al,158 Iqbal et al,159 Gal et al,160 Wang et al,161 Stefanović et al,162 Zahola et al,163 Bik-Multanowski et al,164 Mata et al,165 Li et al,166 Payton et al,167 and Chai et al168 indicated that UBA6, TIA1, DPP6, USP7, EEF2, ITM2B, DPH1, PAK3, KMT2E, MAPT (microtubule associated protein tau), HCFC1, BRD1, TAOK2, PHF1, STMN2, APP (amyloid beta precursor protein), MBNL2, APLP1, MAP2, SRRM2 CST3, SRRM2, CST3, PLD3, SEZ6L2, DOC2A, PI4KA, GNAO1, TRA2A, MIDN (midnolin), HOOK3, MCPH1, SACS (sacsin molecular chaperone), TUBA4A, ASAH1, ATP6V1B2, SVBP (small vasohibin binding protein), AIFM1, UBC (ubiquitin C), IFI30, SCGN (secretagogin, EF-hand calcium binding protein), MTRNR2L12, GBA (glucosylceramidase beta), TXN2, NQO2, and PPIL1 were involved in the development and progression of cognitive impairment. RPS3A,169 PGAM5,170 RPL7,171 TLK1,172 DDR1,173 ILF3,174 TNRC6A,175 GGCX (gamma-glutamyl carboxylase),176 S100A6,177 LSAMP (limbic system associated membrane protein),178 KCNA5,179 LUC7L3,180 ATAD3C,181 SRSF3,182 MCU (mitochondrial calcium uniporter),183 ATP2A2,184 GAA (glucosidase alpha, acid),185 MAGI1,186 WIPF2,187 VAMP8,188 UCHL1,189 CLIC1,190 PSMB5,191 GRB2,192 MPSTE24,193 COX6B1,194 SQSTM1195, COTL1196, CD63197, NDUFB7198, BEX1199 and MTRNR2L8 200 plays a major role in mediating cardiovascular diseases progression. HLA-A,201 VEGFA (vascular endothelial growth factor A),202 RPS26,203 BMP6,204 HLA-B,205 IER3IP1,206 MT1E,207 ACADM (acyl-CoA dehydrogenase medium chain),208 and GAPDH (glyceraldehyde-3-phosphate dehydrogenase)209 are associated with progression of Type 1 diabetes mellitus. PEMT (phosphatidylethanolamine N-methyltransferase),210 INSM1,211 BCL6,212 RUNX1T1,213 PGRMC2,214 ARID1B,215 CITED2,216 KLF13,217 PPT1,218 ARRDC3,219 HSPA5,220 MDH2,221 and COA3,222 have been previously reported to be a key biomarkers for the early detection of obesity. A previous study demonstrated that IGFBP5,223 PRDX6,224 PKM (pyruvate kinase M1/2),225 PRDX1,226 and USP22227 were more highly expressed in diabetic nephropathy. Durgin et al,228 Zhang et al,229 Hamada et al,230 Gong et al,231 Li et al,232 Lin et al,233 and Schweigert et al234 suggested that CYB5R3, CACNA1A, GLCCI1, CAP1, HSP90AB1, BLVRA (biliverdinreductase A), and CRIP1 were involved in the progression of hypertension. These results suggested that these, cognitive impairment, cardiovascular diseases, obesity, diabetic nephropathy and hypertension responsible genes might influence the development of T2DM through the altered expression. Therefore, these genes might involve in these GO terms and pathways are most likely to be important in the development of T2DM and T2DM associated complications.
By PPI network and module analysis, we identified the hub genes that might affect the origin or advancement of T2DM. TCTN2, SYNPO (synaptopodin), PSMD12, PSMC4, TUBA1C, PSMC5, PSMD7, and RAD23A might serve as a novel target for early diagnosis and specific therapy of T2DM and T2DM associated complications, and the related mechanisms need to be further investigation.
In addition, miRNA-hub gene regulatory network construction and TF-hub gene regulatory network were constructed. In addition, miRNA-mRNA networks were constructed. The roles of hub genes, miRNA and TF in the pathogenesis of T2DM are discussed. Hsa-mir-142-5p,235 hsa-mir-1291,236 NOTCH1,237 PPARD (peroxisome proliferator-activated receptor delta),238 HIF1A,239 RUNX2,240 and E2F1241 levels are correlated with disease severity in patients with T2DM. Previous studies have demonstrated that hsa-mir-216b-5p242 and hsa-mir-200a-3p243 appears to be expressed in Type 1 diabetes. Hsa-mir-1294,244 SUZ12,245 and YAP1246 were responsible for progression of cognitive impairment. Hsa-mir-573247 and SMARCA4248 were linked with progression of hypertension. Therefore, cognitive impairment and hypertension responsible biomarkers might be used as a diagnostic biomarker because of its essential role in the pathogenesis in early T2DM. Our study also suggests that PRKDC (protein kinase, DNA-activated, catalytic subunit), SKIL (SKI like proto-oncogene), NDRG1, hsa-mir-181b-3p, hsa-mir-3157-3p, hsa-mir-3661, hsa-mir-520d-5p, TAF7L, and MITF (Microphthalmia-associated transcription factor) are the novel biomarkers of the entire process of T2DM and T2DM associated complications development and might be used as the novel diagnostic biomarker for T2DM and T2DM associated complications.
The conduct of updating methods was calculated the classification work in which collected a higher score in efficiency, AUC, specificity, and sensitivity. As a result, 10 hub genes with AUC > 0.80 showed excellent diagnostic value for T2DM, and thus were considered as hub genes of T2DM, including APP, MYH9, TCTN2, USP7, SYNPO, GRB2, HSP90AB1, UBC, HSPA5, and SQSTM1. Through these analyses, we expect to provide novel insights into the molecular pathogenesis of T2DM and its associated complications and provide a more detailed molecular mechanism for the development of T2DM treatment. Although bioinformatics analysis has been performed in these present investigations, some limitations exist. Lacking of experimental validation of hub genes is a limitation of the study. In addition, we do not conduct in vitro and in vivo experiments of hub genes in T2DM. Corresponding experiments will be performed to verify in our future investigation, thus conversely testifying in bioinformatics analysis.
In conclusion, the present study identified 10 hub genes (APP, MYH9, TCTN2, USP7, SYNPO, GRB2, HSP90AB1, UBC, HSPA5, and SQSTM1) with crucial role in progression of T2DM; our results suggested these genes could add a new dimension to our understanding of the T2DM and might be served as potential biomarkers that will be assisting endocrinologist in developing novel therapeutic strategies for T2DM patients. However, there are some limitations in this study. Further larger clinical sample size and in-depth clinical experiments are needed to clarify the clear mechanism and warrant the prognostic value of these DEGs in T2DM.
Supplemental Material
Supplemental material, sj-docx-1-end-10.1177_11795514231155635 for Bioinformatics Analysis of Next Generation Sequencing Data Identifies Molecular Biomarkers Associated With Type 2 Diabetes Mellitus by Varun Alur, Varshita Raju, Basavaraj Vastrad, Chanabasayya Vastrad, Satish Kavatagimath and Shivakumar Kotturshetti in Clinical Medicine Insights: Endocrinology and Diabetes
Supplemental material, sj-docx-2-end-10.1177_11795514231155635 for Bioinformatics Analysis of Next Generation Sequencing Data Identifies Molecular Biomarkers Associated With Type 2 Diabetes Mellitus by Varun Alur, Varshita Raju, Basavaraj Vastrad, Chanabasayya Vastrad, Satish Kavatagimath and Shivakumar Kotturshetti in Clinical Medicine Insights: Endocrinology and Diabetes
Supplemental material, sj-docx-3-end-10.1177_11795514231155635 for Bioinformatics Analysis of Next Generation Sequencing Data Identifies Molecular Biomarkers Associated With Type 2 Diabetes Mellitus by Varun Alur, Varshita Raju, Basavaraj Vastrad, Chanabasayya Vastrad, Satish Kavatagimath and Shivakumar Kotturshetti in Clinical Medicine Insights: Endocrinology and Diabetes
Acknowledgments
I thank Yurong Xin, Regeneron Pharmaceuticals, Inc., Tarrytown, New York, USA, very much, the author who deposited their NGS dataset GSE81608, into the public GEO database.
Footnotes
ORCID iD: Chanabasayya Vastrad  https://orcid.org/0000-0003-3615-4450
Informed consent: No informed consent because this study does not contain human or animals participants.
Ethics approval: Not applicable.
Trial registration: Not applicable.
Supplemental material: Supplemental material for this article is available online.
Declarations
Funding: The author(s) received no financial support for the research, authorship, and/or publication of this article.
The author declared no potential conflicts of interest with respect to the research, authorship, and/or publication of this article.
Ethics approval and consent to participate: This article does not contain any studies with human participants or animals performed by any of the authors.
Consent for publication: Not applicable.
Author contributions: Varun Alur: Methodology; Validation. Varshita Raju: Formal analysis; Validation. Basavaraj Vastrad: Writing – original draft; Writing – review & editing. Chanabasayya Vastrad: Investigation; Software. Satish Kavatagimath: Formal analysis; Resources. Shivakumar Kotturshetti: Resources; Supervision.
Availability of data and materials: The datasets supporting the conclusions of this article are available in the GEO (Gene Expression Omnibus) (https://www.ncbi.nlm.nih.gov/geo/) repository [(GSE81608) (https://www.ncbi.nlm.nih.gov/geo/query/acc.cgi?acc=GSE81608)].
References
- 1. Caruso R, Magon A, Baroni I, et al. Health literacy in type 2 diabetes patients: a systematic review of systematic reviews. Acta Diabetol. 2018;55:1-12. [DOI] [PubMed] [Google Scholar]
- 2. Gruss SM, Nhim K, Gregg E, Bell M, Luman E, Albright A. Public health approaches to Type 2 diabetes prevention: the US National Diabetes Prevention Program and Beyond. Curr Diab Rep. 2019;19:78. [DOI] [PMC free article] [PubMed] [Google Scholar]
- 3. Khan MAB, Hashim MJ, King JK, Govender RD, Mustafa H, Al Kaabi J. Epidemiology of type 2 diabetes - global burden of disease and forecasted trends. J Epidemiol Glob Health. 2020;10:107-111. [DOI] [PMC free article] [PubMed] [Google Scholar]
- 4. Magliano DJ, Sacre JW, Harding JL, Gregg EW, Zimmet PZ, Shaw JE. Young-onset type 2 diabetes mellitus - implications for morbidity and mortality. Nat Rev Endocrinol. 2020;16:321-331. [DOI] [PubMed] [Google Scholar]
- 5. Borzouei S, Soltanian AR. Application of an artificial neural network model for diagnosing type 2 diabetes mellitus and determining the relative importance of risk factors. Epidemiol Health. 2018;40:e2018007. [DOI] [PMC free article] [PubMed] [Google Scholar]
- 6. Rojas J, Bermudez V, Palmar J, et al. Pancreatic beta cell death: novel potential mechanisms in diabetes therapy. J Diabetes Res. 2018;2018:9601801. [DOI] [PMC free article] [PubMed] [Google Scholar]
- 7. Grarup N, Rose CS, Andersson EA, et al. Studies of association of variants near the HHEX, CDKN2A/B, and IGF2BP2 genes with type 2 diabetes and impaired insulin release in 10,705 Danish subjects: validation and extension of genome-wide association studies. Diabetes. 2007;56:3105-3111. [DOI] [PubMed] [Google Scholar]
- 8. Pascoe L, Tura A, Patel SK, et al. Common variants of the novel type 2 diabetes genes CDKAL1 and HHEX/IDE are associated with decreased pancreatic beta-cell function. Diabetes. 2007;56:3101-3104. [DOI] [PubMed] [Google Scholar]
- 9. Shi H, Lu Y, Du J, et al. Application of back propagation artificial neural network on genetic variants in adiponectin ADIPOQ, peroxisome proliferator-activated receptor-γ, and retinoid X receptor-α genes and type 2 diabetes risk in a Chinese Han population. Diabetes Technol Ther. 2012;14:293-300. [DOI] [PMC free article] [PubMed] [Google Scholar]
- 10. Gloyn AL, Weedon MN, Owen KR, et al. Large-scale association studies of variants in genes encoding the pancreatic beta-cell KATP channel subunits Kir6.2 (KCNJ11) and SUR1 (ABCC8) confirm that the KCNJ11 E23K variant is associated with type 2 diabetes. Diabetes. 2003;52:568-572. [DOI] [PubMed] [Google Scholar]
- 11. Zheng X, Ren W, Zhang S, et al. Association of type 2 diabetes susceptibility genes (TCF7L2, SLC30A8, PCSK1 and PCSK2) and proinsulin conversion in a Chinese population. Mol Biol Rep. 2012;39:17-23. [DOI] [PubMed] [Google Scholar]
- 12. Li Y, Liu Y, Liang J, Wang T, Sun M, Zhang Z. Gymnemic acid ameliorates hyperglycemia through PI3K/AKT- and AMPK-Mediated signaling pathways in Type 2 diabetes mellitus rats. J Agric Food Chem. 2019;67:13051-13060. [DOI] [PubMed] [Google Scholar]
- 13. Suhara T, Baba Y, Shimada BK, Higa JK, Matsui T. The mTOR signaling pathway in myocardial dysfunction in type 2 diabetes mellitus. Curr Diab Rep. 2017;17:38. [DOI] [PMC free article] [PubMed] [Google Scholar]
- 14. Mackenzie RW, Elliott BT. Akt/PKB activation and insulin signaling: a novel insulin signaling pathway in the treatment of type 2 diabetes. Diabetes Metab Syndr Obes. 2014;7:55-64. [DOI] [PMC free article] [PubMed] [Google Scholar]
- 15. Abo El-Nasr NME, Saleh DO, Mahmoud SS, et al. Olmesartan attenuates type 2 diabetes-associated liver injury: cross-talk of AGE/RAGE/JNK, STAT3/SCOS3 and RAS signaling pathways. Eur J Pharmacol. 2020;874:173010. [DOI] [PubMed] [Google Scholar]
- 16. Ozaki KI, Awazu M, Tamiya M, et al. Targeting the ERK signaling pathway as a potential treatment for insulin resistance and type 2 diabetes. Am J Physiol Endocrinol Metab. 2016;310:E643-E651. [DOI] [PubMed] [Google Scholar]
- 17. Mao Y, Shen J, Lu Y, et al. RNA sequencing analyses reveal novel differentially expressed genes and pathways in pancreatic cancer. Oncotarget. 2017;8:42537-42547. [DOI] [PMC free article] [PubMed] [Google Scholar]
- 18. Podder NK, Rana HK, Azam MS, et al. A system biological approach to investigate the genetic profiling and comorbidities of type 2 diabetes. Gene Rep. 2020;21:100830. [Google Scholar]
- 19. Rahman MH, Peng S, Hu X, et al. A network-based bioinformatics approach to identify molecular biomarkers for type 2 diabetes that are linked to the progression of neurological diseases. Int J Environ Res Public Health. 2020;17:1035. [DOI] [PMC free article] [PubMed] [Google Scholar]
- 20. Hasan MI, Hossain MA, Bhuiyan P, Miah MS, Rahman MH. A system biology approach to determine therapeutic targets by identifying molecular mechanisms and key pathways for type 2 diabetes that are linked to the development of tuberculosis and rheumatoid arthritis. Life Sci. 2022;297:120483. [DOI] [PubMed] [Google Scholar]
- 21. Hossain MA, Al Amin M, Hasan MI, et al. Bioinformatics and system biology approaches to identify molecular pathogenesis of polycystic ovarian syndrome, type 2 diabetes, obesity, and cardiovascular disease that are linked to the progression of female infertility. Inform Med Unlocked. 2022;30:100960. [Google Scholar]
- 22. Rahman MH, Peng S, Hu X, et al. Bioinformatics methodologies to identify interactions between type 2 diabetes and neurological comorbidities. IEEE Access. 2019;7:183948-183970. [Google Scholar]
- 23. Prashanth G, Vastrad B, Tengli A, Vastrad C, Kotturshetti I. Investigation of candidate genes and mechanisms underlying obesity associated type 2 diabetes mellitus using bioinformatics analysis and screening of small drug molecules. BMC Endocr Disord. 2021;21:80. [DOI] [PMC free article] [PubMed] [Google Scholar]
- 24. Clough E, Barrett T. The gene expression omnibus database. Methods Mol Biol. 2016;1418:93-110. [DOI] [PMC free article] [PubMed] [Google Scholar]
- 25. Xin Y, Kim J, Okamoto H, et al. RNA sequencing of single human islet cells reveals type 2 diabetes genes. Cell Metab. 2016;24:608-615. [DOI] [PubMed] [Google Scholar]
- 26. Ritchie ME, Phipson B, Wu D, et al. Limma powers differential expression analyses for RNA-sequencing and microarray studies. Nucleic Acids Res. 2015;43:e47. [DOI] [PMC free article] [PubMed] [Google Scholar]
- 27. Thomas PD. The gene ontology and the meaning of biological function. Methods Mol Biol. 2017;1446:15-24. [DOI] [PMC free article] [PubMed] [Google Scholar]
- 28. Fabregat A, Jupe S, Matthews L, et al. The reactome pathway knowledgebase. Nucleic Acids Res. 2018;46:D649-D655. [DOI] [PMC free article] [PubMed] [Google Scholar]
- 29. Reimand J, Kull M, Peterson H, Hansen J, Vilo J. g:Profiler–a web-based toolset for functional profiling of gene lists from large-scale experiments. Nucleic Acids Res. 2007;35:W193-W200. [DOI] [PMC free article] [PubMed] [Google Scholar]
- 30. Kotlyar M, Pastrello C, Malik Z, Jurisica I. IID 2018 update: context-specific physical protein-protein interactions in human, model organisms and domesticated species. Nucleic Acids Res. 2019;47:D581-D589. [DOI] [PMC free article] [PubMed] [Google Scholar]
- 31. Shannon P, Markiel A, Ozier O, et al. Cytoscape: a software environment for integrated models of biomolecular interaction networks. Genome Res. 2003;13:2498-2504. [DOI] [PMC free article] [PubMed] [Google Scholar]
- 32. Pržulj N, Wigle DA, Jurisica I. Functional topology in a network of protein interactions. Bioinformatics. 2004;20:340-348. [DOI] [PubMed] [Google Scholar]
- 33. Nguyen TP, Liu WC, Jordán F. Inferring pleiotropy by network analysis: linked diseases in the human PPI network. BMC Syst Biol. 2011;5:179. [DOI] [PMC free article] [PubMed] [Google Scholar]
- 34. Shi Z, Zhang B. Fast network centrality analysis using GPUs. BMC Bioinform. 2011;12:149. [DOI] [PMC free article] [PubMed] [Google Scholar]
- 35. Fadhal E, Gamieldien J, Mwambene EC. Protein interaction networks as metric spaces: a novel perspective on distribution of hubs. BMC Syst Biol. 2014;8:6. [DOI] [PMC free article] [PubMed] [Google Scholar]
- 36. Zaki N, Efimov D, Berengueres J. Protein complex detection using interaction reliability assessment and weighted clustering coefficient. BMC Bioinform. 2013;14:163. [DOI] [PMC free article] [PubMed] [Google Scholar]
- 37. Fan Y, Xia J. miRNet-functional analysis and visual exploration of miRNA-target interactions in a network context. Methods Mol Biol. 2018;1819:215-233. [DOI] [PubMed] [Google Scholar]
- 38. Zhou G, Soufan O, Ewald J, Hancock REW, Basu N, Xia J. NetworkAnalyst 3.0: a visual analytics platform for comprehensive gene expression profiling and meta-analysis. Nucleic Acids Res. 2019;47:W234-W241. [DOI] [PMC free article] [PubMed] [Google Scholar]
- 39. Robin X, Turck N, Hainard A, et al. pROC: an open-source package for R and S+ to analyze and compare ROC curves. BMC Bioinform. 2011;12:77. [DOI] [PMC free article] [PubMed] [Google Scholar]
- 40. Ren C, Li M, Du W, et al. Comprehensive bioinformatics analysis reveals hub genes and inflammation state of rheumatoid arthritis. Biomed Res Int. 2020;2020:1-13. [DOI] [PMC free article] [PubMed] [Google Scholar]
- 41. Erfanian Omidvar M, Ghaedi H, Kazerouni F, et al. Clinical significance of long noncoding RNA VIM-AS1 and CTBP1-AS2 expression in type 2 diabetes. J Cell Biochem. 2019;120:9315-9323. [DOI] [PubMed] [Google Scholar]
- 42. Duraisamy P, Elango S, Vishwanandha VP, Balamurugan R. Prevalence of mitochondrial tRNA gene mutations and their association with specific clinical phenotypes in patients with type 2 diabetes mellitus of Coimbatore. Genet Test Mol Biomarkers. 2010;14:49-55. [DOI] [PubMed] [Google Scholar]
- 43. Kumar U, Singh S. Role of somatostatin in the regulation of central and peripheral factors of Satiety and obesity. Int J Mol Sci. 2020;21:2568. [DOI] [PMC free article] [PubMed] [Google Scholar]
- 44. Gougeon R, Marliss EB, Jones PJ, Pencharz PB, Morais JA. Effect of exogenous insulin on protein metabolism with differing nonprotein energy intakes in type 2 diabetes mellitus. Int J Obes Relat Metab Disord. 1998;22:250-261. [DOI] [PubMed] [Google Scholar]
- 45. Yao K, Zeng L, He Q, Wang W, Lei J, Zou X. Effect of probiotics on glucose and lipid metabolism in type 2 diabetes mellitus: a meta-analysis of 12 randomized controlled trials. Med Sci Monit. 2017;23:3044-3053. [DOI] [PMC free article] [PubMed] [Google Scholar]
- 46. Gaster M, Nehlin JO, Minet AD. Impaired TCA cycle flux in mitochondria in skeletal muscle from type 2 diabetic subjects: marker or maker of the diabetic phenotype? Arch Physiol Biochem. 2012;118:156-189. [DOI] [PubMed] [Google Scholar]
- 47. Chung ST, Hsia DS, Chacko SK, Rodriguez LM, Haymond MW. Increased gluconeogenesis in youth with newly diagnosed type 2 diabetes. Diabetologia. 2015;58:596-603. [DOI] [PMC free article] [PubMed] [Google Scholar]
- 48. Daryabor G, Atashzar MR, Kabelitz D, Meri S, Kalantar K. The effects of type 2 diabetes mellitus on organ metabolism and the immune system. Front Immunol. 2020;11:1582. [DOI] [PMC free article] [PubMed] [Google Scholar]
- 49. Wu WL, Hao J, Domalski M, et al. Discovery of novel tricyclic heterocycles as potent and selective DPP-4 inhibitors for the treatment of type 2 diabetes. ACS Med Chem Lett. 2016;7:498-501. [DOI] [PMC free article] [PubMed] [Google Scholar]
- 50. Shoukry A, Bdeer SEL-A, El-Sokkary RH. Urinary monocyte chemoattractant protein-1 and vitamin D-binding protein as biomarkers for early detection of diabetic nephropathy in type 2 diabetes mellitus. Mol Cell Biochem. 2015;408:25-35. [DOI] [PubMed] [Google Scholar]
- 51. Hearn T, Spalluto C, Phillips VJ, et al. Subcellular localization of ALMS1 supports involvement of centrosome and basal body dysfunction in the pathogenesis of obesity, insulin resistance, and type 2 diabetes. Diabetes. 2005;54:1581-1587. [DOI] [PubMed] [Google Scholar]
- 52. Bouché C, Serdy S, Kahn CR, Goldfine AB. The cellular fate of glucose and its relevance in type 2 diabetes. Endocr Rev. 2004;25:807-830. [DOI] [PubMed] [Google Scholar]
- 53. Turner R, Stratton I, Horton V, et al. UKPDS 25: autoantibodies to islet-cell cytoplasm and glutamic acid decarboxylase for prediction of insulin requirement in type 2 diabetes. UK prospective Diabetes Study Group. Lancet. 1997;350:1288-1293. [DOI] [PubMed] [Google Scholar]
- 54. Cheung A, Kusari J, Jansen D, Bandyopadhyay D, Kusari A, Bryer-Ash M. Marked impairment of protein tyrosine phosphatase 1B activity in adipose tissue of obese subjects with and without type 2 diabetes mellitus. J Lab Clin Med. 1999;134:115-123. [DOI] [PubMed] [Google Scholar]
- 55. Wittenbecher C, Ouni M, Kuxhaus O, et al. Insulin-like growth factor binding protein 2 (IGFBP-2) and the risk of developing type 2 diabetes. Diabetes. 2019;68:188-197. [DOI] [PubMed] [Google Scholar]
- 56. Castro A, Lázaro I, Selva DM, et al. APOH is increased in the plasma and liver of type 2 diabetic patients with metabolic syndrome. Atherosclerosis. 2010;209:201-205. [DOI] [PubMed] [Google Scholar]
- 57. Caron D, Boutchueng-Djidjou M, Tanguay RM, Faure RL. Annexin A2 is SUMOylated on its N-terminal domain: regulation by insulin. FEBS Lett. 2015;589:985-991. [DOI] [PubMed] [Google Scholar]
- 58. Podestà F, Romeo G, Liu WH, et al. Bax is increased in the retina of diabetic subjects and is associated with pericyte apoptosis in vivo and in vitro. Am J Pathol. 2000;156:1025-1032. [DOI] [PMC free article] [PubMed] [Google Scholar]
- 59. Liu T, Zhao Y, Tang N, et al. Pax6 directly down-regulates pcsk1n expression thereby regulating PC1/3 dependent proinsulin processing. PLoS One. 2012;7:e46934. [DOI] [PMC free article] [PubMed] [Google Scholar]
- 60. Kim YI, Lee FN, Choi WS, Lee S, Youn JH. Insulin regulation of skeletal muscle PDK4 mRNA expression is impaired in acute insulin-resistant states. Diabetes. 2006;55:2311-2317. [DOI] [PubMed] [Google Scholar]
- 61. Alsters SIM, Goldstone AP, Buxton JL, et al. Truncating homozygous mutation of carboxypeptidase E (CPE) in a morbidly obese female with type 2 diabetes mellitus, intellectual disability and hypogonadotrophic hypogonadism. PLoS One. 2015;10:e0131417. [DOI] [PMC free article] [PubMed] [Google Scholar]
- 62. Yu T, Lu XJ, Li JY, et al. Overexpression of miR-429 impairs intestinal barrier function in diabetic mice by down-regulating occludin expression. Cell Tissue Res. 2016;366:341-352. [DOI] [PubMed] [Google Scholar]
- 63. Kodama K, Horikoshi M, Toda K, et al. Expression-based genome-wide association study links the receptor CD44 in adipose tissue with type 2 diabetes. Proc Natl Acad Sci U S A. 2012;109:7049-7054. [DOI] [PMC free article] [PubMed] [Google Scholar]
- 64. Goldfine AB, Crunkhorn S, Costello M, et al. Necdin and E2F4 are modulated by rosiglitazone therapy in diabetic human adipose and muscle tissue. Diabetes. 2006;55:640-650. [DOI] [PubMed] [Google Scholar]
- 65. Mtiraoui N, Turki A, Nemr R, et al. Contribution of common variants of ENPP1, IGF2BP2, KCNJ11, MLXIPL, PPARγ, SLC30A8 and TCF7L2 to the risk of type 2 diabetes in Lebanese and Tunisian Arabs. Diabetes Metab. 2012;38:444-449. [DOI] [PubMed] [Google Scholar]
- 66. Castelblanco E, Sanjurjo L, Falguera M, et al. Circulating soluble CD36 is similar in type 1 and Type 2 diabetes mellitus versus non-diabetic subjects. J Clin Med. 2019;8:710. [DOI] [PMC free article] [PubMed] [Google Scholar]
- 67. Krause C, Sievert H, Geißler C, et al. Critical evaluation of the DNA-methylation markers ABCG1 and SREBF1 for type 2 diabetes stratification. Epigenomics. 2019;11:885-897. [DOI] [PubMed] [Google Scholar]
- 68. Huang Q, Xue J, Zou R, et al. NR4A1 is associated with chronic low-grade inflammation in patients with type 2 diabetes. Exp Ther Med. 2014;8:1648-1654. [DOI] [PMC free article] [PubMed] [Google Scholar]
- 69. Chang TJ, Chiu YF, Sheu WHH, et al. Genetic polymorphisms of PCSK2 are associated with glucose homeostasis and progression to type 2 diabetes in a Chinese population. Sci Rep. 2015;5:14380. [DOI] [PMC free article] [PubMed] [Google Scholar]
- 70. Herold Z, Herold M, Rosta K, Doleschall M, Somogyi A. Lower serum chromogranin B level is associated with type 1 diabetes and with type 2 diabetes patients with intensive conservative insulin treatment. Diabetol Metab Syndr. 2020;12:61. [DOI] [PMC free article] [PubMed] [Google Scholar]
- 71. Mayer AE, Löffler MC, Loza Valdés AE, et al. The kinase PKD3 provides negative feedback on cholesterol and triglyceride synthesis by suppressing insulin signaling. Sci Signal. 2019;12:eaav9150. [DOI] [PMC free article] [PubMed] [Google Scholar]
- 72. Zhang J, Zhang M, Yang Z, et al. PDCD4 deficiency ameliorates left ventricular remodeling and insulin resistance in a rat model of type 2 diabetic cardiomyopathy. BMJ Open Diabetes Res Care. 2020;8:e001081. [DOI] [PMC free article] [PubMed] [Google Scholar]
- 73. Mastracci TL, Colvin SC, Padgett LR, Mirmira RG. Hypusinated eIF5A is expressed in the pancreas and spleen of individuals with type 1 and type 2 diabetes. PLoS One. 2020;15:e0230627. [DOI] [PMC free article] [PubMed] [Google Scholar]
- 74. Hoseini-Aghdam M, Sheikh V, Eftekharian MM, Rezaeepoor M, Behzad M. Enhanced expression of TIGIT but not neuropilin-1 in patients with type 2 diabetes mellitus. Immunol Lett. 2020;225:1-8. [DOI] [PubMed] [Google Scholar]
- 75. Yoon HY, Lee MH, Song Y, Yee J, Song G, Gwak HS. ABCA1 69C>T polymorphism and the risk of type 2 diabetes mellitus: a systematic review and updated meta-analysis. Front Endocrinol. 2021;12:639524. [DOI] [PMC free article] [PubMed] [Google Scholar]
- 76. Chen YT, Lin WD, Liao WL, Tsai YC, Liao JW, Tsai FJ. NT5C2 methylation regulatory interplay between DNMT1 and insulin receptor in type 2 diabetes. Sci Rep. 2020;10:16087. [DOI] [PMC free article] [PubMed] [Google Scholar]
- 77. Zhao H, Ma L, Yan M, et al. Association betweenMYH9andAPOL1gene polymorphisms and the risk of diabetic kidney disease in patients with type 2 diabetes in a Chinese Han population. J Diabetes Res. 2018;2018:1-6. [DOI] [PMC free article] [PubMed] [Google Scholar]
- 78. Huang J, Zeng T, Tian Y, et al. Clinical significance of high-mobility group box-1 (HMGB1) in subjects with type 2 diabetes mellitus (T2DM) combined with chronic obstructive pulmonary disease (COPD). J Clin Lab Anal. 2019;33:e22910. [DOI] [PMC free article] [PubMed] [Google Scholar]
- 79. Li SF, Zhu CS, Wang YM, et al. Downregulation of β1,4-galactosyltransferase 5 improves insulin resistance by promoting adipocyte commitment and reducing inflammation. Cell Death Dis. 2018;9:196. [DOI] [PMC free article] [PubMed] [Google Scholar]
- 80. Kim MK, Yun KJ, Chun HJ, et al. Clinical utility of serum beta-2-microglobulin as a predictor of diabetic complications in patients with type 2 diabetes without renal impairment. Diabetes Metab. 2014;40:459-465. [DOI] [PubMed] [Google Scholar]
- 81. Ye M, Li D, Yang J, et al. MicroRNA-130a targets MAP3K12 to modulate diabetic endothelial progenitor cell function. Cell Physiol Biochem. 2015;36:712-726. [DOI] [PubMed] [Google Scholar]
- 82. Pearce LR, Atanassova N, Banton MC, et al. KSR2 mutations are associated with obesity, insulin resistance, and impaired cellular fuel oxidation. Cell. 2013;155:765-777. [DOI] [PMC free article] [PubMed] [Google Scholar]
- 83. Nakhate KT, Yedke SU, Bharne AP, Subhedar NK, Kokare DM. Evidence for the involvement of neuropeptide Y in the antidepressant effect of imipramine in type 2 diabetes. Brain Res. 2016;1646:1-11. [DOI] [PubMed] [Google Scholar]
- 84. Kogawa EM, Grisi DC, Falcão DP, et al. Impact of glycemic control on oral health status in type 2 diabetes individuals and its association with salivary and plasma levels of chromogranin A. Arch Oral Biol. 2016;62:10-19. [DOI] [PubMed] [Google Scholar]
- 85. Bitar MS. Diabetes impairs angiogenesis and induces endothelial cell senescence by up-regulating thrombospondin-CD47-dependent signaling. Int J Mol Sci. 2019;20:673. [DOI] [PMC free article] [PubMed] [Google Scholar]
- 86. Kameswaran V, Golson ML, Ramos-Rodríguez M, et al. The dysregulation of the DLK1-MEG3 locus in islets from patients with type 2 diabetes is mimicked by targeted epimutation of its promoter with TALE-DNMT constructs. Diabetes. 2018;67:1807-1815. [DOI] [PMC free article] [PubMed] [Google Scholar]
- 87. Mori J, Alrob OA, Wagg CS, Harris RA, Lopaschuk GD, Oudit GY. ANG II causes insulin resistance and induces cardiac metabolic switch and inefficiency: a critical role of PDK4. Am J Physiol Heart Circ Physiol. 2013;304:H1103-H1113. [DOI] [PubMed] [Google Scholar]
- 88. Guan B, Zhan Z, Wang L, Wang L, Liu L. CXXC4 mediates glucose-induced β-cell proliferation. Acta Diabetol. 2020;57:1101-1109. [DOI] [PubMed] [Google Scholar]
- 89. Hartz CS, Nieman KM, Jacobs RL, Vance DE, Schalinske KL. Hepatic phosphatidylethanolamine N-methyltransferase expression is increased in diabetic rats. J Nutr. 2006;136:3005-3009. [DOI] [PubMed] [Google Scholar]
- 90. Mazoochian L, Mohammad Sadeghi HM, Pourfarzam M. The effect of FADS2 gene rs174583 polymorphism on desaturase activities, fatty acid profile, insulin resistance, biochemical indices, and incidence of type 2 diabetes. J Res Med Sci. 2018;23:47. [DOI] [PMC free article] [PubMed] [Google Scholar]
- 91. Bonomo JA, Guan M, Ng MC, et al. The ras responsive transcription factor RREB1 is a novel candidate gene for type 2 diabetes associated end-stage kidney disease. Hum Mol Genet. 2014;23:6441-6447. [DOI] [PMC free article] [PubMed] [Google Scholar]
- 92. Ghosh A, Abdo S, Zhao S, et al. Insulin inhibits nrf2 gene expression via heterogeneous nuclear ribonucleoprotein F/K in diabetic mice. Endocrinology. 2017;158:903-919. [DOI] [PMC free article] [PubMed] [Google Scholar]
- 93. Hirota Y, Ohara T, Zenibayashi M, et al. Lack of association of CPT1A polymorphisms or haplotypes on hepatic lipid content or insulin resistance in Japanese individuals with type 2 diabetes mellitus. Metabolism. 2007;56:656-661. [DOI] [PubMed] [Google Scholar]
- 94. Singh S, Chen Y, Matsumoto A, et al. ALDH1B1 links alcohol consumption and diabetes. Biochem Biophys Res Commun. 2015;463:768-773. [DOI] [PMC free article] [PubMed] [Google Scholar]
- 95. Larsen LH, Rose CS, Sparsø T, et al. Genetic analysis of the estrogen-related receptor alpha and studies of association with obesity and type 2 diabetes. Int J Obes. 2007;31:365-370. [DOI] [PubMed] [Google Scholar]
- 96. Dong S, Blüher M, Zhang Y, Wu H, Alahari SK. Development of insulin resistance in nischarin mutant female mice. Int J Obes. 2019;43:1046-1057. [DOI] [PubMed] [Google Scholar]
- 97. Shah SK, He S, Guo L, et al. Discovery of MK-1421, a potent, selective sstr3 antagonist, as a development candidate for type 2 diabetes. ACS Med Chem Lett. 2015;6:513-517. [DOI] [PMC free article] [PubMed] [Google Scholar]
- 98. Hattori Y, Nakajima K, Eizawa T, et al. Heteroplasmic mitochondrial DNA 3310 mutation in NADH dehydrogenase subunit 1 associated with type 2 diabetes, hypertrophic cardiomyopathy, and mental retardation in a single patient. Diabetes Care. 2003;26:952-953. [DOI] [PubMed] [Google Scholar]
- 99. Cividini F, Scott BT, Suarez J, et al. Ncor2/PPARα-dependent upregulation of MCUb in the type 2 diabetic heart impacts cardiac metabolic flexibility and function. Diabetes. 2021;70:665-679. [DOI] [PMC free article] [PubMed] [Google Scholar]
- 100. Zhang L, Cheng YL, Xue S, Xu ZG. The role of circulating RBP4 in the type 2 diabetes patients with kidney diseases: a systematic review and meta-analysis. Dis Markers. 2020;2020:8830471. [DOI] [PMC free article] [PubMed] [Google Scholar]
- 101. Abbas S, Raza ST, S Mir S, Siddiqi Z, Mahdi F. No association of SNP 313A→G in GSTP1 with nephropathy, hypertension and dyslipidemia in type 2 diabetes mellitus. Br J Biomed Sci. 2019;76:153-155. [DOI] [PubMed] [Google Scholar]
- 102. Huang K, Nair AK, Muller YL, et al. Whole exome sequencing identifies variation in CYB5A and RNF10 associated with adiposity and type 2 diabetes. Obesity. 2014;22:984-988. [DOI] [PMC free article] [PubMed] [Google Scholar]
- 103. Shi Y, Li Y, Wang J, et al. Meta-analyses of the association of G6PC2 allele variants with elevated fasting glucose and type 2 diabetes. PLoS One. 2017;12:e0181232. [DOI] [PMC free article] [PubMed] [Google Scholar]
- 104. Minchenko DO, Davydov VV, Budreiko OA, et al. The expression of CCN2, IQSEC, RSPO1, DNAJC15, RIPK2, IL13RA2, IRS1, and IRS2 genes in blood of obese boys with insulin resistance. Fiziol Zh. 2015;61:10-18. [DOI] [PubMed] [Google Scholar]
- 105. Wang X, Yang R, Jadhao SB, et al. Transmembrane emp24 protein transport domain 6 is selectively expressed in pancreatic islets and implicated in insulin secretion and diabetes. Pancreas. 2012;41:10-14. [DOI] [PMC free article] [PubMed] [Google Scholar]
- 106. Chen M, Hu C, Zhang R, et al. A variant of PSMD6 is associated with the therapeutic efficacy of oral antidiabetic drugs in Chinese type 2 diabetes patients. Sci Rep. 2015;5:10701. [DOI] [PMC free article] [PubMed] [Google Scholar]
- 107. Cai R, Han J, Sun J, et al. Plasma clusterin and the CLU gene rs11136000 variant are associated with mild cognitive impairment in type 2 diabetic patients. Front Aging Neurosci. 2016;8:179. [DOI] [PMC free article] [PubMed] [Google Scholar]
- 108. Kwanbunjan K, Panprathip P, Phosat C, et al. Association of retinol binding protein 4 and transthyretin with triglyceride levels and insulin resistance in rural Thais with high type 2 diabetes risk. BMC Endocr Disord. 2018;18:26. [DOI] [PMC free article] [PubMed] [Google Scholar]
- 109. Wondafrash DZ, Nire’a AT, Tafere GG, Desta DM, Berhe DA, Zewdie KA. Thioredoxin-interacting protein as a novel potential therapeutic target in diabetes mellitus and its underlying complications. Diabetes Metab Syndr Obes. 2020;13:43-51. [DOI] [PMC free article] [PubMed] [Google Scholar]
- 110. Ying L, Zhang M, Ma X, et al. Macrophage LAMTOR1 deficiency prevents dietary obesity and insulin resistance through inflammation-induced energy expenditure. Front Cell Dev Biol. 2021;9:672032. [DOI] [PMC free article] [PubMed] [Google Scholar]
- 111. Griffin JWD, Liu Y, Bradshaw PC, Wang K. In silico preliminary association of ammonia metabolism genes GLS, CPS1, and GLUL with risk of Alzheimer’s disease, major depressive disorder, and Type 2 diabetes. J Mol Neurosci. 2018;64:385-396. [DOI] [PubMed] [Google Scholar]
- 112. Fougerat A, Pan X, Smutova V, et al. Neuraminidase 1 activates insulin receptor and reverses insulin resistance in obese mice. Mol Metab. 2018;12:76-88. [DOI] [PMC free article] [PubMed] [Google Scholar]
- 113. Chiva-Blanch G, Peña E, Cubedo J, et al. Molecular mapping of platelet hyperreactivity in diabetes: the stress proteins complex HSPA8/Hsp90/CSK2α and platelet aggregation in diabetic and normal platelets. Transl Res. 2021;235:1-14. [DOI] [PubMed] [Google Scholar]
- 114. Kazakova EV, Zghuang T, Li T, Fang Q, Han J, Qiao H. The gas6 gene rs8191974 and ap3s2 gene rs2028299 are associated with type 2 diabetes in the northern Chinese Han population. Acta Biochim Pol. 2017;64:227-231. [DOI] [PubMed] [Google Scholar]
- 115. Van der Schueren B, Vangoitsenhoven R, Geeraert B, et al. Low cytochrome oxidase 4I1 links mitochondrial dysfunction to obesity and type 2 diabetes in humans and mice. Int J Obes. 2015;39:1254-1263. [DOI] [PubMed] [Google Scholar]
- 116. Haynes V, Connor T, Tchernof A, Vidal H, Dubois S. Metallothionein 2a gene expression is increased in subcutaneous adipose tissue of type 2 diabetic patients. Mol Genet Metab. 2013;108:90-94. [DOI] [PubMed] [Google Scholar]
- 117. Ng MCY, Tam CHT, So WY, et al. Implication of genetic variants near NEGR1, SEC16B, TMEM18, ETV5/DGKG, GNPDA2, LIN7C/BDNF, MTCH2, BCDIN3D/FAIM2, SH2B1, FTO, MC4R, and KCTD15 with obesity and type 2 diabetes in 7705 Chinese. J Clin Endocrinol Metab. 2010;95:2418-2425. [DOI] [PubMed] [Google Scholar]
- 118. Subramanian VS, Krishnaswami CV, Damodaran C. HLA, ESD, GLOI, C3 and HP polymorphisms and juvenile insulin dependent diabetes mellitus in Tamil Nadu (south India). Diabetes Res Clin Pract. 1994;25:51-59. [DOI] [PubMed] [Google Scholar]
- 119. Wei W, Li Y, Li Y, Li D. Adipose-specific knockout of ubiquitin-conjugating enzyme E2L6 (Ube2l6) reduces diet-induced obesity, insulin resistance, and hepatic steatosis. J Pharmacol Sci. 2021;145:327-334. [DOI] [PubMed] [Google Scholar]
- 120. Jacobs S, Schiller K, Jansen EH, Boeing H, Schulze MB, Kröger J. Evaluation of various biomarkers as potential mediators of the association between Δ5 desaturase, Δ6 desaturase, and stearoyl-coa desaturase activity and incident type 2 diabetes in the European prospective investigation into cancer and Nutrition-Potsdam Study. Am J Clin Nutr. 2015;102:155-164. [DOI] [PubMed] [Google Scholar]
- 121. Thameem F, Yang X, Permana PA, Wolford JK, Bogardus C, Prochazka M. Evaluation of the microsomal glutathione S-transferase 3 (MGST3) locus on 1q23 as a Type 2 diabetes susceptibility gene in Pima Indians. Hum Genet. 2003;113:353-358. [DOI] [PubMed] [Google Scholar]
- 122. Ramprasath T, Murugan PS, Kalaiarasan E, Gomathi P, Rathinavel A, Selvam GS. Genetic association of glutathione peroxidase-1 (GPx-1) and NAD(P)H:quinone oxidoreductase 1(NQO1) variants and their association of CAD in patients with type-2 diabetes. Mol Cell Biochem. 2012;361:143-150. [DOI] [PubMed] [Google Scholar]
- 123. Payne F, Colnaghi R, Rocha N, et al. Hypomorphism in human NSMCE2 linked to primordial dwarfism and insulin resistance. J Clin Investig. 2014;124:4028-4038. [DOI] [PMC free article] [PubMed] [Google Scholar]
- 124. Liu QC, Zhuang ZH, Zeng K, Cheng ZJ, Gao F, Wang ZQ. Prevalence of pancreatic diabetes in patients carrying mutations or polymorphisms of the PRSS1 gene in the Han population. Diabetes Technol Ther. 2009;11:799-804. [DOI] [PubMed] [Google Scholar]
- 125. Quintela I, Barros F, Fernandez-Prieto M, et al. Interstitial microdeletions including the chromosome band 4q13.2 and the UBA6 gene as possible causes of intellectual disability and behavior disorder. Am J Med Genet A. 2015;167A:3113-3120. [DOI] [PubMed] [Google Scholar]
- 126. Yuan Z, Jiao B, Hou L, et al. Mutation analysis of the TIA1 gene in Chinese patients with amyotrophic lateral sclerosis and frontotemporal dementia. Neurobiol Aging. 2018;64:160.e9-160.e12. [DOI] [PubMed] [Google Scholar]
- 127. Cacace R, Heeman B, Van Mossevelde S, et al. Loss of DPP6 in neurodegenerative dementia: a genetic player in the dysfunction of neuronal excitability. Acta Neuropathol. 2019;137:901-918. [DOI] [PMC free article] [PubMed] [Google Scholar]
- 128. Hao YH, Fountain M, Fon Tacer K, et al. USP7 acts as a molecular rheostat to promote WASH-dependent endosomal protein recycling and is mutated in a human neurodevelopmental disorder. Mol Cell. 2015;59:956-969. [DOI] [PMC free article] [PubMed] [Google Scholar]
- 129. Beckelman BC, Yang W, Kasica NP, et al. Genetic reduction of eEF2 kinase alleviates pathophysiology in Alzheimer’s disease model mice. J Clin Investig. 2019;129:820-833. [DOI] [PMC free article] [PubMed] [Google Scholar]
- 130. Liu X, Chen KL, Wang Y, et al. A novel ITM2B mutation associated with familial Chinese dementia. J Alzheimers Dis. 2021;81:499-505. [DOI] [PubMed] [Google Scholar]
- 131. Sekiguchi F, Nasiri J, Sedghi M, et al. A novel homozygous DPH1 mutation causes intellectual disability and unique craniofacial features. J Hum Genet. 2018;63:487-491. [DOI] [PubMed] [Google Scholar]
- 132. Castillon C, Gonzalez L, Domenichini F, et al. The intellectual disability PAK3 R67C mutation impacts cognitive functions and adult hippocampal neurogenesis. Hum Mol Genet. 2020;29:1950-1968. [DOI] [PubMed] [Google Scholar]
- 133. O’Donnell-Luria AH, Pais LS, Faundes V, et al. Heterozygous variants in KMT2E cause a spectrum of neurodevelopmental disorders and epilepsy. Am J Hum Genet. 2019;104:1210-1222. [DOI] [PMC free article] [PubMed] [Google Scholar]
- 134. Coupland KG, Kim WS, Halliday GM, Hallupp M, Dobson-Stone C, Kwok JB. Role of the long non-coding RNA MAPT-as1 in regulation of microtubule associated protein Tau (MAPT) expression in Parkinson’s disease. PLoS One. 2016;11:e0157924. [DOI] [PMC free article] [PubMed] [Google Scholar]
- 135. Koufaris C, Alexandrou A, Tanteles GA, Anastasiadou V, Sismani C. A novel HCFC1 variant in male siblings with intellectual disability and microcephaly in the absence of cobalamin disorder. Biomed Rep. 2016;4:215-218. [DOI] [PMC free article] [PubMed] [Google Scholar]
- 136. Qvist P, Rajkumar AP, Redrobe JP, et al. Mice heterozygous for an inactivated allele of the schizophrenia associated brd1 gene display selective cognitive deficits with translational relevance to schizophrenia. Neurobiol Learn Mem. 2017;141:44-52. [DOI] [PubMed] [Google Scholar]
- 137. Richter M, Murtaza N, Scharrenberg R, et al. Altered TAOK2 activity causes autism-related neurodevelopmental and cognitive abnormalities through RhoA signaling. Mol Psychiatry. 2019;24:1329-1350. [DOI] [PMC free article] [PubMed] [Google Scholar]
- 138. Torres AK, Jara C, Olesen MA, Tapia-Rojas C. Pathologically phosphorylated tau at S396/404 (PHF-1) is accumulated inside of hippocampal synaptic mitochondria of aged wild-type mice. Sci Rep. 2021;11:4448. [DOI] [PMC free article] [PubMed] [Google Scholar]
- 139. Jeong BH, Kim HJ, Lee KH, Carp RI, Kim YS. RARB and STMN2 polymorphisms are not associated with sporadic Creutzfeldt–Jakob disease (CJD) in the Korean population. Mol Biol Rep. 2014;41:2389-2395. [DOI] [PubMed] [Google Scholar]
- 140. Bermejo-Bescós P, Martín-Aragón S, Jiménez-Aliaga K, et al. Processing of the platelet amyloid precursor protein in the mild cognitive impairment (MCI). Neurochem Res. 2013;38:1415-1423. [DOI] [PubMed] [Google Scholar]
- 141. Ramon-Duaso C, Gener T, Consegal M, et al. Methylphenidate attenuates the cognitive and mood alterations observed in Mbnl2 knockout mice and reduces microglia overexpression. Cereb Cortex. 2019;29:2978-2997. [DOI] [PMC free article] [PubMed] [Google Scholar]
- 142. Guilarte TR. APLP1, Alzheimer’s-like pathology and neurodegeneration in the frontal cortex of manganese-exposed non-human primates. Neurotoxicol. 2010;31:572-574. [DOI] [PMC free article] [PubMed] [Google Scholar]
- 143. Mukaetova-Ladinska EB, Xuereb JH, Garcia-Sierra F, et al. Lewy body variant of Alzheimer’s disease: selective neocortical loss of t-SNARE proteins and loss of MAP2 and alpha-synuclein in medial temporal lobe. ScientificWorldJournal. 2009;9:1463-1475. [DOI] [PMC free article] [PubMed] [Google Scholar]
- 144. Fazeli S, Motovali-Bashi M, Peymani M, et al. Correction: A compound downregulation of SRRM2 and miR-27a-3p with upregulation of miR-27b-3p in PBMCs of Parkinson’s patients is associated with the early stage onset of disease. PLoS One. 2020;15:e0244776. [DOI] [PMC free article] [PubMed] [Google Scholar]
- 145. Butler JM, Sharif U, Ali M, et al. A missense variant in CST3 exerts a recessive effect on susceptibility to age-related macular degeneration resembling its association with Alzheimer’s disease. Hum Genet. 2015;134:705-715. [DOI] [PMC free article] [PubMed] [Google Scholar]
- 146. Nackenoff AG, Hohman TJ, Neuner SM, et al. PLD3 is a neuronal lysosomal phospholipase D associated with β-amyloid plaques and cognitive function in Alzheimer’s disease. PLoS Genet. 2021;17:e1009406. [DOI] [PMC free article] [PubMed] [Google Scholar]
- 147. Konyukh M, Delorme R, Chaste P, et al. Variations of the candidate SEZ6L2 gene on chromosome 16p11.2 in patients with autism spectrum disorders and in human populations. PLoS One. 2011;6:e17289. [DOI] [PMC free article] [PubMed] [Google Scholar]
- 148. Hu X, Tang J, Lan X, Mi X. Increased expression of DOC2A in human and rat temporal lobe epilepsy. Epilepsy Res. 2019;151:78-84. [DOI] [PubMed] [Google Scholar]
- 149. Kaur H, Jajodia A, Grover S, Baghel R, Jain S, Kukreti R. Synergistic association of PI4KA and GRM3 genetic polymorphisms with poor antipsychotic response in south Indian schizophrenia patients with low severity of illness. Am J Med Genet B Neuropsychiatr Genet. 2014;165B:635-646. [DOI] [PubMed] [Google Scholar]
- 150. Nakamura K, Kodera H, Akita T, et al. De novo mutations in GNAO1, encoding a gαo subunit of heterotrimeric G proteins, cause epileptic encephalopathy. Am J Hum Genet. 2013;93:496-505. [DOI] [PMC free article] [PubMed] [Google Scholar]
- 151. Liu Q, Zhu L, Liu X, et al. TRA2A-induced upregulation of LINC00662 regulates blood-brain barrier permeability by affecting ELK4 mRNA stability in Alzheimer’s microenvironment. RNA Biol. 2020;17:1293-1308. [DOI] [PMC free article] [PubMed] [Google Scholar]
- 152. Obara Y, Imai T, Sato H, Takeda Y, Kato T, Ishii K. Midnolin is a novel regulator of parkin expression and is associated with Parkinson’s disease. Sci Rep. 2017;7:5885. [DOI] [PMC free article] [PubMed] [Google Scholar]
- 153. Herrmann L, Wiegmann C, Arsalan-Werner A, et al. Hook proteins: association with Alzheimer pathology and regulatory role of hook3 in amyloid beta generation. PLoS One. 2015;10:e0119423. [DOI] [PMC free article] [PubMed] [Google Scholar]
- 154. Ozgen HM, van Daalen E, Bolton PF, et al. Copy number changes of the microcephalin 1 gene (MCPH1) in patients with autism spectrum disorders. Clin Genet. 2009;76:348-356. [DOI] [PubMed] [Google Scholar]
- 155. Masciullo M, Modoni A, Fattori F, et al. A novel mutation in the SACS gene associated with a complicated form of spastic ataxia. J Neurol. 2008;255:1429-1431. [DOI] [PubMed] [Google Scholar]
- 156. Perrone F, Nguyen HP, Van Mossevelde S, et al. Investigating the role of ALS genes CHCHD10 and TUBA4A in Belgian FTD-ALS spectrum patients. Neurobiol Aging. 2017;51:177.e9-177.e16. [DOI] [PubMed] [Google Scholar]
- 157. Su Y, Yang L, Li Z, et al. The interaction of ASAH1 and NGF gene involving in neurotrophin signaling pathway contributes to schizophrenia susceptibility and psychopathology. Prog Neuropsychopharmacol Biol Psychiatry. 2021;104:110015. [DOI] [PubMed] [Google Scholar]
- 158. Zhao W, Gao X, Qiu S, et al. A subunit of V-atpases, ATP6V1B2, underlies the pathology of intellectual disability. EBioMedicine. 2019;45:408-421. [DOI] [PMC free article] [PubMed] [Google Scholar]
- 159. Iqbal Z, Tawamie H, Ba W, et al. Loss of function of SVBP leads to autosomal recessive intellectual disability, microcephaly, ataxia, and hypotonia. Genet Med. 2019;21:1790-1796. [DOI] [PubMed] [Google Scholar]
- 160. Gal J, Chen J, Katsumata Y, et al. Detergent insoluble proteins and inclusion body-like structures immunoreactive for PRKDC/DNA-PK/DNA-PKcs, FTL, NNT, and AIFM1 in the amygdala of cognitively impaired elderly persons. J Neuropathol Exp Neurol. 2017;77:21-39. [DOI] [PMC free article] [PubMed] [Google Scholar]
- 161. Wang KK, Yang Z, Sarkis G, Torres I, Raghavan V. Ubiquitin C-terminal hydrolase-L1 (UCH-L1) as a therapeutic and diagnostic target in neurodegeneration, neurotrauma and neuro-injuries. Expert Opin Ther Targets. 2017;21:627-638. [DOI] [PubMed] [Google Scholar]
- 162. Stefanović M, Životić I, Stojković L, Dinčić E, Stanković A, Živković M. The association of genetic variants IL2RA rs2104286, IFI30 rs11554159 and IKZF3 rs12946510 with multiple sclerosis onset and severity in patients from Serbia. J Neuroimmunol. 2020;347:577346. [DOI] [PubMed] [Google Scholar]
- 163. Zahola P, Hanics J, Pintér A, et al. Secretagogin expression in the vertebrate brainstem with focus on the noradrenergic system and implications for Alzheimer’s disease. Brain Struct Funct. 2019;224:2061-2078. [DOI] [PMC free article] [PubMed] [Google Scholar]
- 164. Bik-Multanowski M, Pietrzyk JJ, Midro A. MTRNR2L12: a candidate blood marker of early Alzheimer’s disease-like dementia in adults with down syndrome. J Alzheimers Dis. 2015;46:145-150. [DOI] [PMC free article] [PubMed] [Google Scholar]
- 165. Mata IF, Leverenz JB, Weintraub D, et al. GBA variants are associated with a distinct pattern of cognitive deficits in Parkinson’s disease. Mov Disord. 2016;31:95-102. [DOI] [PMC free article] [PubMed] [Google Scholar]
- 166. Li KY, Xiang XJ, Song L, et al. Mitochondrial TXN2 attenuates amyloidogenesis via selective inhibition of BACE1 expression. J Neurochem. 2021;157:1351-1365. [DOI] [PubMed] [Google Scholar]
- 167. Payton A, Miyajima F, Ollier W, et al. Investigation of a functional quinine oxidoreductase (NQO2) polymorphism and cognitive decline. Neurobiol Aging. 2010;31:351-352. [DOI] [PubMed] [Google Scholar]
- 168. Chai G, Webb A, Li C, et al. Mutations in spliceosomal genes PPIL1 and PRP17 cause neurodegenerative pontocerebellar hypoplasia with microcephaly. Neuron. 2021;109:241-256.e9. [DOI] [PMC free article] [PubMed] [Google Scholar]
- 169. Tang Y, He Y, Li C, et al. RPS3A positively regulates the mitochondrial function of human periaortic adipose tissue and is associated with coronary artery diseases. Cell Discov. 2018;4:52. [DOI] [PMC free article] [PubMed] [Google Scholar]
- 170. Zhou H, Li D, Zhu P, et al. Inhibitory effect of melatonin on necroptosis via repressing the Ripk3-PGAM5-CypD-mptp pathway attenuates cardiac microvascular ischemia-reperfusion injury. J Pineal Res. 2018;65:e12503. [DOI] [PubMed] [Google Scholar]
- 171. Linke AT, Marchant B, Marsh P, Frampton G, Murphy J, Rose ML. Screening of a HUVEC cDNA library with transplant-associated coronary artery disease sera identifies RPL7 as a candidate autoantigen associated with this disease. Clin Exp Immunol. 2001;126:173-179. [DOI] [PMC free article] [PubMed] [Google Scholar]
- 172. Song YF, Zhao L, Wang BC, et al. The circular RNA TLK1 exacerbates myocardial ischemia/reperfusion injury via targeting miR-214/RIPK1 through TNF signaling pathway. Free Radic Biol Med. 2020;155:69-80. [DOI] [PubMed] [Google Scholar]
- 173. Franco C, Hou G, Ahmad PJ, et al. Discoidin domain receptor 1 (ddr1) deletion decreases atherosclerosis by accelerating matrix accumulation and reducing inflammation in low-density lipoprotein receptor-deficient mice. Circ Res. 2008;102:1202-1211. [DOI] [PubMed] [Google Scholar]
- 174. Zhang JY, Yang Z, Fang K, Shi ZL, Ren DH, Sun J. Long noncoding RNA ILF3-AS1 regulates myocardial infarction via the miR-212-3p/SIRT1 axis and PI3K/Akt signaling pathway. Eur Rev Med Pharmacol Sci. 2020;24:2647-2658. [DOI] [PubMed] [Google Scholar]
- 175. Li L, Chen Q, Feng C, Jin Y, Xia S. Aberrant expression of TNRC6a and miR-21 during myocardial infarction. 3 Biotech. 2019;9:285. [DOI] [PMC free article] [PubMed] [Google Scholar]
- 176. Shyu HY, Fong CS, Fu YP, et al. Genotype polymorphisms of GGCX, NQO1, and VKORC1 genes associated with risk susceptibility in patients with large-artery atherosclerotic stroke. Clin Chim Acta. 2010;411:840-845. [DOI] [PubMed] [Google Scholar]
- 177. Mofid A, Newman NS, Lee PJ, et al. Cardiac overexpression of S100A6 attenuates cardiomyocyte apoptosis and reduces infarct size after myocardial ischemia-reperfusion. J Am Heart Assoc. 2017;6:e004738. [DOI] [PMC free article] [PubMed] [Google Scholar]
- 178. Wang L, Hauser ER, Shah SH, et al. Polymorphisms of the tumor suppressor gene LSAMP are associated with left main coronary artery disease. Ann Hum Genet. 2008;72:443-453. [DOI] [PMC free article] [PubMed] [Google Scholar]
- 179. Christophersen IE, Olesen MS, Liang B, et al. Genetic variation in KCNA5: impact on the atrial-specific potassium current IKur in patients with lone atrial fibrillation. Eur Heart J. 2013;34:1517-1525. [DOI] [PubMed] [Google Scholar]
- 180. Gao G, Dudley SC., Jr. RBM25/LUC7L3 function in cardiac sodium channel splicing regulation of human heart failure. Trends Cardiovasc Med. 2013;23:5-8. [DOI] [PMC free article] [PubMed] [Google Scholar]
- 181. Frazier AE, Compton AG, Kishita Y, et al. Fatal perinatal mitochondrial cardiac failure caused by recurrent de novo duplications in the ATAD3 locus. Med (N Y). 2021;2:49-73.e10. [DOI] [PMC free article] [PubMed] [Google Scholar]
- 182. Ortiz-Sánchez P, Villalba-Orero M, López-Olañeta MM, et al. Loss of SRSF3 in cardiomyocytes leads to decapping of contraction-related mRNAs and severe systolic dysfunction. Circ Res. 2019;125:170-183. [DOI] [PMC free article] [PubMed] [Google Scholar]
- 183. Zaglia T, Ceriotti P, Campo A, et al. Content of mitochondrial calcium uniporter (MCU) in cardiomyocytes is regulated by microRNA-1 in physiologic and pathologic hypertrophy. Proc Natl Acad Sci U S A. 2017;114:E9006-E9015. [DOI] [PMC free article] [PubMed] [Google Scholar]
- 184. Angrisano T, Schiattarella GG, Keller S, et al. Epigenetic switch at atp2a2 and myh7 gene promoters in pressure overload-induced heart failure. PLoS One. 2014;9:e106024. [DOI] [PMC free article] [PubMed] [Google Scholar]
- 185. Zhang J, Ma L, Zhang J, et al. Altered expression of lysosomal hydrolase, acid α-glucosidase, gene in coronary artery disease. Coron Artery Dis. 2016;27:104-108. [DOI] [PubMed] [Google Scholar]
- 186. Zhang Q, Wang F, Wang F, Wu N. Long noncoding RNA MAGI1-IT1 regulates cardiac hypertrophy by modulating miR-302e/DKK1/Wnt/beta-catenin signaling pathway. J Cell Physiol. 2020;235:245-253. [DOI] [PubMed] [Google Scholar]
- 187. Tao Z, Cao Z, Wang X, Pan D, Jia Q. Long noncoding RNA SNHG14 regulates ox-LDL-induced atherosclerosis cell proliferation and apoptosis by targeting miR-186-5p/WIPF2 axis. Hum Exp Toxicol. 2021;40:47-59. [DOI] [PubMed] [Google Scholar]
- 188. Akao H, Polisecki E, Kajinami K, et al. KIF6, LPA, TAS2R50, and VAMP8 genetic variation, low density lipoprotein cholesterol lowering response to pravastatin, and heart disease risk reduction in the elderly. Atherosclerosis. 2012;220:456-462. [DOI] [PubMed] [Google Scholar]
- 189. Gong Z, Ye Q, Wu JW, Zhou JL, Kong XY, Ma LK. UCHL1 inhibition attenuates cardiac fibrosis via modulation of nuclear factor-κB signaling in fibroblasts. Eur J Pharmacol. 2021;900:174045. [DOI] [PubMed] [Google Scholar]
- 190. Zhu J, Xu Y, Ren G, et al. Tanshinone IIA sodium sulfonate regulates antioxidant system, inflammation, and endothelial dysfunction in atherosclerosis by downregulation of CLIC1. Eur J Pharmacol. 2017;815:427-436. [DOI] [PubMed] [Google Scholar]
- 191. Cai Y, Yu SS, He Y, et al. EGCG inhibits pressure overload-induced cardiac hypertrophy via the PSMB5/Nmnat2/SIRT6-dependent signalling pathways. Acta Physiol. 2021;231:e13602. [DOI] [PubMed] [Google Scholar]
- 192. Ye M, Guo XJ, Kan KJ, et al. Loss of GRB2 associated binding protein 1 in arteriosclerosis obliterans promotes host autophagy. Chin Med J. 2020;134:73-80. [DOI] [PMC free article] [PubMed] [Google Scholar]
- 193. Galant D, Gaborit B, Desgrouas C, et al. A heterozygous ZMPSTE24 mutation associated with severe metabolic syndrome, ectopic fat accumulation, and dilated cardiomyopathy. Cells. 2016;5:21. [DOI] [PMC free article] [PubMed] [Google Scholar]
- 194. Abdulhag UN, Soiferman D, Schueler-Furman O, et al. Mitochondrial complex IV deficiency, caused by mutated COX6B1, is associated with encephalomyopathy, hydrocephalus and cardiomyopathy. Eur J Hum Genet. 2015;23:159-164. [DOI] [PMC free article] [PubMed] [Google Scholar]
- 195. Jeong SJ, Zhang X, Rodriguez-Velez A, Evans TD, Razani B. p62/SQSTM1 and selective autophagy in cardiometabolic diseases. Antioxid Redox Signal. 2019;31:458-471. [DOI] [PMC free article] [PubMed] [Google Scholar]
- 196. Tan DX, Chen XX, Bai TZ, Zhang J, Li ZF. Sevoflurane up-regulates microRNA-204 to ameliorate myocardial ischemia/reperfusion injury in mice by suppressing Cotl1. Life Sci. 2020;259:118162. [DOI] [PubMed] [Google Scholar]
- 197. Murakami T, Komiyama Y, Masuda M, et al. Flow cytometric analysis of platelet activation markers CD62P and CD63 in patients with coronary artery disease. Eur J Clin Invest. 1996;26:996-1003. [DOI] [PubMed] [Google Scholar]
- 198. Correia SP, Moedas MF, Naess K, et al. Severe congenital lactic acidosis and hypertrophic cardiomyopathy caused by an intronic variant in NDUFB7. Hum Mutat. 2021;42:378-384. [DOI] [PubMed] [Google Scholar]
- 199. Accornero F, Schips TG, Petrosino JM, et al. BEX1 is an RNA-dependent mediator of cardiomyopathy. Nat Commun. 2017;8:1875. [DOI] [PMC free article] [PubMed] [Google Scholar]
- 200. Shen Y, Peng C, Bai Q, et al. Epigenome-wide association study indicates hypomethylation of MTRNR2L8 in large-artery atherosclerosis stroke. Stroke. 2019;50:1330-1338. [DOI] [PubMed] [Google Scholar]
- 201. Howson JM, Walker NM, Clayton D, Todd JA. Confirmation of HLA class II independent type 1 diabetes associations in the major histocompatibility complex including HLA-B and HLA-A. Diabetes Obes Metab. 2009;11(Suppl 1):31-45. [DOI] [PMC free article] [PubMed] [Google Scholar]
- 202. Bus P, Scharpfenecker M, Van Der Wilk P, Wolterbeek R, Bruijn JA, Baelde HJ. The VEGF-A inhibitor sFLT-1 improves renal function by reducing endothelial activation and inflammation in a mouse model of type 1 diabetes. Diabetologia. 2017;60:1813-1821. [DOI] [PMC free article] [PubMed] [Google Scholar]
- 203. Plagnol V, Smyth DJ, Todd JA, Clayton DG. Statistical independence of the colocalized association signals for type 1 diabetes and RPS26 gene expression on chromosome 12q13. Biostatistics. 2009;10:327-334. [DOI] [PMC free article] [PubMed] [Google Scholar]
- 204. Westerweel PE, van Velthoven CT, Nguyen TQ, et al. Modulation of TGF-β/BMP-6 expression and increased levels of circulating smooth muscle progenitor cells in a type I diabetes mouse model. Cardiovasc Diabetol. 2010;9:55. [DOI] [PMC free article] [PubMed] [Google Scholar]
- 205. Mikk ML, Kiviniemi M, Laine AP, et al. The HLA-B*39 allele increases type 1 diabetes risk conferred by HLA-DRB1*04:04-DQB1*03:02 and HLA-DRB1*08-DQB1*04 class II haplotypes. Hum Immunol. 2014;75:65-70. [DOI] [PubMed] [Google Scholar]
- 206. Shalev SA, Tenenbaum-Rakover Y, Horovitz Y, et al. Microcephaly, epilepsy, and neonatal diabetes due to compound heterozygous mutations in IER3IP1: insights into the natural history of a rare disorder. Pediatr Diabetes. 2014;15:252-256. [DOI] [PMC free article] [PubMed] [Google Scholar]
- 207. Guo M, Zhang T, Dong X, et al. Using hESCs to probe the interaction of the diabetes-associated genes CDKAL1 and MT1E. Cell Rep. 2017;19:1512-1521. [DOI] [PubMed] [Google Scholar]
- 208. Afreh-Mensah D, Agwu JC. Coexistence of medium chain acyl-coa dehydrogenase deficiency (MCADD) and type 1 diabetes (T1D): a management challenge. BMJ Case Rep. 2021;14:e239325. [DOI] [PMC free article] [PubMed] [Google Scholar]
- 209. Blatnik M, Thorpe SR, Baynes JW. Succination of proteins by fumarate: mechanism of inactivation of glyceraldehyde-3-phosphate dehydrogenase in diabetes. Ann N Y Acad Sci. 2008;1126:272-275. [DOI] [PMC free article] [PubMed] [Google Scholar]
- 210. Gao X, van der Veen JN, Zhu L, et al. Vagus nerve contributes to the development of steatohepatitis and obesity in phosphatidylethanolamine N-methyltransferase deficient mice. J Hepatol. 2015;62:913-920. [DOI] [PubMed] [Google Scholar]
- 211. Khan R, Raza SHA, Junjvlieke Z, et al. Function and transcriptional regulation of bovine TORC2 gene in adipocytes: roles of C/EBP, XBP1, INSM1 and ZNF263. Int J Mol Sci. 2019;20:4338. [DOI] [PMC free article] [PubMed] [Google Scholar]
- 212. Senagolage MD, Sommars MA, Ramachandran K, et al. Loss of transcriptional repression by BCL6 confers insulin sensitivity in the setting of obesity. Cell Rep. 2018;25:3283-3298.e6. [DOI] [PMC free article] [PubMed] [Google Scholar]
- 213. Zhou Y, Hambly BD, Simmons D, McLachlan CS. RUNX1T1 rs34269950 is associated with obesity and metabolic syndrome. QJM. 2021;114:553-558. [DOI] [PubMed] [Google Scholar]
- 214. Galmozzi A, Kok BP, Kim AS, et al. PGRMC2 is an intracellular haem chaperone critical for adipocyte function. Nature. 2019;576:138-142. [DOI] [PMC free article] [PubMed] [Google Scholar]
- 215. Sonmez FM, Uctepe E, Gunduz M, et al. Coffin-Siris syndrome with café-au-lait spots, obesity and hyperinsulinism caused by a mutation in the ARID1B gene. Intractable Rare Dis Res. 2016;5:222-226. [DOI] [PMC free article] [PubMed] [Google Scholar]
- 216. Jia G, Sowers JR. Targeting CITED2 for angiogenesis in obesity and insulin resistance. Diabetes. 2016;65:3535-3536. [DOI] [PMC free article] [PubMed] [Google Scholar]
- 217. Koh IU, Lee HJ, Hwang JY, Choi NH, Lee S. Obesity-related cpg methylation (cg07814318) of Kruppel-like factor-13 (KLF13) gene with childhood obesity and its cis-Methylation quantitative loci. Sci Rep. 2017;7:45368. [DOI] [PMC free article] [PubMed] [Google Scholar]
- 218. Liu Y, Zhao W, Gu G, et al. Palmitoyl-protein thioesterase 1 (PPT1): an obesity-induced rat testicular marker of reduced fertility. Mol Reprod Dev. 2014;81:55-65. [DOI] [PubMed] [Google Scholar]
- 219. Patwari P, Emilsson V, Schadt EE, et al. The arrestin domain-containing 3 protein regulates body mass and energy expenditure. Cell Metab. 2011;14:671-683. [DOI] [PMC free article] [PubMed] [Google Scholar]
- 220. Xiang R, Fan LL, Huang H, et al. Increased Reticulon 3 (RTN3) leads to obesity and hypertriglyceridemia by interacting with heat shock protein family A (Hsp70) member 5 (HSPA5). Circulation. 2018;138:1828-1838. [DOI] [PMC free article] [PubMed] [Google Scholar]
- 221. Kim EY, Han BS, Kim WK, Lee SC, Bae KH. Acceleration of adipogenic differentiation via acetylation of malate dehydrogenase 2. Biochem Biophys Res Commun. 2013;441:77-82. [DOI] [PubMed] [Google Scholar]
- 222. Ostergaard E, Weraarpachai W, Ravn K, et al. Mutations in COA3 cause isolated complex IV deficiency associated with neuropathy, exercise intolerance, obesity, and short stature. J Med Genet. 2015;52:203-207. [DOI] [PubMed] [Google Scholar]
- 223. Simon CM, Rauskolb S, Gunnersen JM, et al. Dysregulated IGFBP5 expression causes axon degeneration and motoneuron loss in diabetic neuropathy. Acta Neuropathol. 2015;130:373-387. [DOI] [PMC free article] [PubMed] [Google Scholar]
- 224. Zhang Q, Hu Y, Hu JE, et al. Sp1-mediated upregulation of prdx6 expression prevents podocyte injury in diabetic nephropathy via mitigation of oxidative stress and ferroptosis. Life Sci. 2021;278:119529. [DOI] [PubMed] [Google Scholar]
- 225. Qi W, Keenan HA, Li Q, et al. Pyruvate kinase M2 activation may protect against the progression of diabetic glomerular pathology and mitochondrial dysfunction. Nat Med. 2017;23:753-762. [DOI] [PMC free article] [PubMed] [Google Scholar]
- 226. Jia C, Ke-Hong C, Fei X, et al. Decoy receptor 2 mediation of the senescent phenotype of tubular cells by interacting with peroxiredoxin 1 presents a novel mechanism of renal fibrosis in diabetic nephropathy. Kidney Int. 2020;98:645-662. [DOI] [PubMed] [Google Scholar]
- 227. Mao R, Shen J, Hu X. RETRACTED: BMSCs-derived exosomal microRNA-let-7a plays a protective role in diabetic nephropathy via inhibition of USP22 expression. Life Sci. 2021;268:118937. [DOI] [PubMed] [Google Scholar]
- 228. Durgin BG, Hahn SA, Schmidt HM, et al. Loss of smooth muscle CYB5R3 amplifies angiotensin II-induced hypertension by increasing sGC heme oxidation. JCI Insight. 2019;4:e129183. [DOI] [PMC free article] [PubMed] [Google Scholar]
- 229. Zhang L, Sun Y, Zhang X, et al. Three novel genetic variants in the FAM110D, CACNA1A and NLRP12 genes are associated with susceptibility to hypertension among Dai people. Am J Hypertens. 2021;34:874-879. [DOI] [PubMed] [Google Scholar]
- 230. Hamada AM, Yamamoto I, Nakada Y, et al. Association between GLCCI1 promoter polymorphism (Rs37972) and post-transplant hypertension in renal transplant recipients. Kidney Blood Press Res. 2017;42:1155-1163. [DOI] [PubMed] [Google Scholar]
- 231. Gong Y, Yu M, Yang J, et al. The Cap1-claudin-4 regulatory pathway is important for renal chloride reabsorption and blood pressure regulation. Proc Natl Acad Sci U S A. 2014;111:E3766-E3774. [DOI] [PMC free article] [PubMed] [Google Scholar]
- 232. Li M, Mulkey F, Jiang C, et al. Identification of a genomic region between SLC29A1 and HSP90AB1 associated with risk of bevacizumab-induced hypertension: CALGB 80405 (Alliance). Clin Cancer Res. 2018;24:4734-4744. [DOI] [PMC free article] [PubMed] [Google Scholar]
- 233. Lin R, Wang X, Zhou W, et al. Association of a BLVRA common polymorphism with essential hypertension and blood pressure in Kazaks. Clin Exp Hypertens. 2011;33:294-298. [DOI] [PubMed] [Google Scholar]
- 234. Schweigert O, Adler J, Längst N, et al. CRIP1 expression in monocytes related to hypertension. Clin Sci. 2021;135:911-924. [DOI] [PubMed] [Google Scholar]
- 235. Collares CV, Evangelista AF, Xavier DJ, et al. Identifying common and specific microRNAs expressed in peripheral blood mononuclear cell of type 1, type 2, and gestational diabetes mellitus patients. BMC Res Notes. 2013;6:491. [DOI] [PMC free article] [PubMed] [Google Scholar]
- 236. Catanzaro G, Besharat ZM, Chiacchiarini M, et al. Circulating MicroRNAs in elderly type 2 diabetic patients. Int J Endocrinol. 2018;2018:6872635. [DOI] [PMC free article] [PubMed] [Google Scholar]
- 237. El-Sawaf ES, Saleh S, Abdallah DM, Ahmed KA, El-Abhar HS. Vitamin D and rosuvastatin obliterate peripheral neuropathy in a type-2 diabetes model through modulating notch1, Wnt-10α, TGF-β and NRF-1 crosstalk. Life Sci. 2021;279:119697. [DOI] [PubMed] [Google Scholar]
- 238. Villegas R, Williams S, Gao Y, et al. Peroxisome proliferator-activated receptor delta (PPARD) genetic variation and type 2 diabetes in middle-aged Chinese women. Ann Hum Genet. 2011;75:621-629. [DOI] [PMC free article] [PubMed] [Google Scholar]
- 239. Huang Y, Jin L, Yu H, et al. SNPs in PRKCA-HIF1A-GLUT1 are associated with diabetic kidney disease in a Chinese Han population with type 2 diabetes. Eur J Clin Invest. 2020;50:e13264. [DOI] [PubMed] [Google Scholar]
- 240. Zhang G, Li H, Zhao W, et al. miR-205 regulates bone turnover in elderly female patients with type 2 diabetes mellitus through targeted inhibition of Runx2. Exp Ther Med. 2020;20:1557-1565. [DOI] [PMC free article] [PubMed] [Google Scholar]
- 241. Ali Beg MM, Verma AK, Saleem M, et al. Role and significance of circulating biomarkers: miRNA and E2F1 mRNA expression and their association with type-2 diabetic complications. Int J Endocrinol. 2020;2020:6279168. [DOI] [PMC free article] [PubMed] [Google Scholar]
- 242. Tesovnik T, Kovač J, Pohar K, et al. Extracellular vesicles derived Human-miRNAs modulate the immune system in type 1 diabetes. Front Cell Dev Biol. 2020;8:202. [DOI] [PMC free article] [PubMed] [Google Scholar]
- 243. Assmann TS, Recamonde-Mendoza M, Puñales M, Tschiedel B, Canani LH, Crispim D. MicroRNA expression profile in plasma from type 1 diabetic patients: case-control study and bioinformatic analysis. Diabetes Res Clin Pract. 2018;141:35-46. [DOI] [PubMed] [Google Scholar]
- 244. Groen K, Maltby VE, Lea RA, et al. Erythrocyte microRNA sequencing reveals differential expression in relapsing-remitting multiple sclerosis. BMC Med Genomics. 2018;11:48. [DOI] [PMC free article] [PubMed] [Google Scholar]
- 245. Chen Y, Zhang Y, Ye G, Sheng C, Kong L, Yuan L. Knockdown of lncRNA PCAI protects against cognitive decline induced by hippocampal neuroinflammation via regulating SUZ12. Life Sci. 2020;253:117626. [DOI] [PubMed] [Google Scholar]
- 246. Sun W, Zhao J, Li C. Dexmedetomidine provides protection against hippocampal neuron apoptosis and cognitive impairment in mice with Alzheimer’s disease by mediating the miR-129/YAP1/JAG1 axis. Mol Neurobiol. 2020;57:5044-5055. [DOI] [PubMed] [Google Scholar]
- 247. Wang P, Zhang C, Li J, et al. Adipose-derived mesenchymal stromal cells improve hemodynamic function in pulmonary arterial hypertension: identification of microRNAs implicated in modulating endothelial function. Cytotherapy. 2019;21:416-427. [DOI] [PubMed] [Google Scholar]
- 248. Ma H, He Y, Bai M, et al. The genetic polymorphisms of ZC3HC1 and SMARCA4 are associated with hypertension risk. Mol Genet Genomic Med. 2019;7:e942. [DOI] [PMC free article] [PubMed] [Google Scholar]
Associated Data
This section collects any data citations, data availability statements, or supplementary materials included in this article.
Supplementary Materials
Supplemental material, sj-docx-1-end-10.1177_11795514231155635 for Bioinformatics Analysis of Next Generation Sequencing Data Identifies Molecular Biomarkers Associated With Type 2 Diabetes Mellitus by Varun Alur, Varshita Raju, Basavaraj Vastrad, Chanabasayya Vastrad, Satish Kavatagimath and Shivakumar Kotturshetti in Clinical Medicine Insights: Endocrinology and Diabetes
Supplemental material, sj-docx-2-end-10.1177_11795514231155635 for Bioinformatics Analysis of Next Generation Sequencing Data Identifies Molecular Biomarkers Associated With Type 2 Diabetes Mellitus by Varun Alur, Varshita Raju, Basavaraj Vastrad, Chanabasayya Vastrad, Satish Kavatagimath and Shivakumar Kotturshetti in Clinical Medicine Insights: Endocrinology and Diabetes
Supplemental material, sj-docx-3-end-10.1177_11795514231155635 for Bioinformatics Analysis of Next Generation Sequencing Data Identifies Molecular Biomarkers Associated With Type 2 Diabetes Mellitus by Varun Alur, Varshita Raju, Basavaraj Vastrad, Chanabasayya Vastrad, Satish Kavatagimath and Shivakumar Kotturshetti in Clinical Medicine Insights: Endocrinology and Diabetes