

Abstract
Background:
There is growing interest in identifying factors associated with healthy aging. This cross-sectional study evaluated associations of psychological resilience with factors associated with aging in older adults with type 2 diabetes mellitus (T2DM).
Methods:
Participants were 3199 adults (72.2 ± 6.2 years of age, 61% female, 61% White, body mass index [BMI] = 34.2 ± 8.2 kg/m2) with T2DM enrolled in Look AHEAD (a multi-site randomized clinical trial comparing an intensive lifestyle intervention for weight loss to diabetes education and support). Participants were followed observationally after the 10-year intervention was discontinued. The following items were assessed approximately 14.4 years post-randomization in a cross-sectional analysis: Brief Resilience Scale; overnight hospitalizations in past year; physical functioning measured objectively (gait speed, grip strength) and via self-report (Pepper Assessment Tool for Disability; physical quality of life [QOL; SF-36]); a measure of phenotypic frailty based on having ≥3 of unintentional weight loss, low energy, slow gait, reduced grip strength, and physical inactivity. Depressive symptoms (PHQ-9) and mental QOL (SF-36) were also measured. Logistic/linear/multinomial regression was used to evaluate the association of variables with resilience adjusted for age, race/ethnicity, and gender.
Results:
Greater psychological resilience was associated with lower BMI, fewer hospitalizations, better physical functioning (i.e., lower self-reported disability, better physical QOL, faster gait speed, greater grip strength, lower likelihood of frailty), fewer depressive symptoms, and greater mental QOL (all p < 0.05). Psychological resilience moderated the relationship of number of hospitalizations in the past year with self-reported disability and grip strength.
Conclusions:
Psychological resilience is associated with better physical function and QOL among older adults. Results should be interpreted cautiously given cross-sectional nature of analyses. Exploring the clinical benefits of resilience is consistent with efforts to shift the narrative on aging beyond “loss and decline” to highlight opportunities to facilitate healthy aging.
Keywords: aging, disability, frailty, healthy aging, quality of life
INTRODUCTION
With the U.S. population aging,1 there is increased urgency to identify contributors to healthy aging. Investigators have focused on identifying markers of risk and/or deficits, with which to direct clinical intervention development and resource allocation.2 More recent research aims to identify factors protective of healthy aging3,4 and resilience (an individual’s ability to “bounce back” after adversity5) is a construct of interest.6 In the context of aging, resilience is often focused on physical resilience—characterized by maintenance or recovery of physical functioning following biomedical/physiological challenge.7 Yet the challenges of aging are not exclusively physical. Psychological resilience (i.e., attitudes and behaviors that promote adaptive functioning in the face of stress) may also be relevant for healthy aging.8
Among older adults, higher psychological resilience has been linked to well-being, healthy lifestyle, and reduced risk of mortality.9,10 It is especially pertinent to understand psychological resilience in older adults with type 2 diabetes mellitus (T2DM) given the well-known biopsychosocial challenges of managing this chronic condition. This includes risk for multimorbidity,11 as well as accelerated decline in cognitive12 and physical functioning.13 Existing literature suggests greater psychological resilience may protect against onset of diabetes14 and improve management of T2DM (e.g., lower HbA1c levels15). However much of this literature excludes older adults.15 Therefore, psychological resilience remains understudied in older adults with T2DM.
Given the significant variability across older adults in nearly all metrics of aging,4 studying psychological resilience may help clarify opportunities to promote healthy aging. The current study used a cross-sectional design and evaluated psychological resilience in a cohort of older adults with T2DM from the Look AHEAD Trial.16 The aims were to (1) evaluate psychological resilience, (2) assess the relationship of resilience to demographic factors and T2DM management (e.g., HbA1c), (3) evaluate the association of resilience with variables implicated in aging-related health (physical function, emotional well-being, hospitalization, and frailty), and (4) evaluate resilience as a moderator of the association between hospitalization and aging-related health as hospitalization is a known risk factor for decline and common among older adults with T2DM.17
METHODS
Study participants were older adults in the observational phase of the Look AHEAD Trial. Look AHEAD was designed to evaluate the effect of an intensive lifestyle intervention (ILI) compared to diabetes support and education (DSE) on risk for cardiovascular morbidity and mortality in adults with T2DM and overweight or obesity.16 Men and women who were 45–76 years old, with a body mass index (BMI) ≥ 25 kg/m2, and a confirmed diagnosis of T2DM, were randomly assigned to ILI or DSE (beginning in 2001). The design and primary results of Look AHEAD are published.16,18,19 After a median follow-up of 9.6 years, the trial transitioned to an observational cohort study. Data for the current cross-sectional analysis were collected approximately 14.4 (SD: 0.9; Range: 12–16.4) years post-randomization during the observational phase. Individuals from DSE and ILI were eligible for inclusion.
Measures
Research staff masked to intervention assignment collected the following measures at a face-to-face visit.
Demographic information.
Participants self-reported age, gender, and race/ethnicity.
Weight/height.
Weight was measured using a digital scale and height was measured using a wall-mounted stadiometer. BMI (kg/m2) was also calculated with these data. Total percent weight change was calculated from baseline to the time of data collection for the current analysis using weight data from the baseline assessment.
Diabetes status.
Diabetes status was characterized using HbA1c (assayed from fasting blood samples).
Number of hospitalizations.
Participants reported hospitalizations during the 12 months prior to the assessment. The final metric was a count of total overnight admissions. Based on the non-linear distribution of these data, hospitalizations were categorized for analysis (0, 1, 2+ hospitalizations).
Resilience was measured using the Brief Resilience Scale (BRS8), a psychological operationalization of resilience. It is a 6-item self-report scale of perceived ability to adapt and to avoid negative outcomes associated with stress (e.g., I tend to bounce back quickly after hard times). Items are rated on a 5-item Likert scale (1 = strongly disagree, 5 = strongly agree). Higher values reflect greater resilience. The BRS has been used across diverse populations, and it has demonstrated strong reliability and validity independently and when compared to the psychometrics of other resilience measures.20 In the current sample, the BRS had good internal reliability (Cronbach’s alpha = 0.85).
Quality of life was assessed with the Medical Outcomes Survey, Short Form-36 (SF-3621). It is a 36-item self-report measure of health-related quality of life. T-scores are generated to create two composite values: the mental component summary (MCS) score and the physical component summary (PCS) score. Cronbach’s alphas ranged from 0.77 to 0.95 for the subscales in the current sample.
Depressive symptoms were assessed using the Patient Health Questionnaire-9 (PHQ-922), a 9-item self-report measure assessing symptoms of major depressive disorder. Higher scores reflect greater severity of symptoms. The PHQ-9 has demonstrated validity in adults and older adults.23,24 Internal reliability in the current sample was adequate (Cronbach’s alpha = 0.78).
Disability was assessed using the Pepper Assessment Tool for Disability (PAT-D25). This 18-item self-report questionnaire evaluates general disability in older adults related to activities of daily living. Participants use 5-point Likert scales (1 = Usually did with no difficulty, 5 = Unable to do) to indicate how capable they were in completing several tasks (e.g., dressing oneself) over the previous month. Higher scores reflect greater disability. The current sample exhibited strong internal reliability (Cronbach’s alpha = 0.91).
Objective physical function was operationalized and assessed using gait speed and grip strength. Both tasks were monitored by trained research staff. For gait speed, participants were instructed to walk 4 meters at their normal pace two times. The faster of the two was used to calculate gait speed in meters per second. Grip strength was measured twice in each hand using an isometric Hydraulic Hand Dynamometer (Jamar, Bolingbrook, IL). Maximum force from two trials was recorded in kilograms, and the value for the dominant hand was used for analysis.
Frailty was operationalized using a modified Fried’s phenotype.26 Participants met criteria for frailty (dichotomous; yes or no) if three or more of the following criteria were present: (1) unintentional weight loss in the past year, (2) low energy, (3) slow gait, (4) low grip strength, and/or (5) low physical activity. Because Look AHEAD originally was a weight loss trial, frailty was also calculated excluding the weight loss variable to account for the potential confound of treatment condition (frailty was then defined as having three out of four symptoms).
Analytic plan
Descriptive statistics were used to describe demographics of the sample and to introduce the key variables. Linear regression (for continuous correlates) and logistic regression (for categorical correlates) models were used to evaluate the association between BRS and all aging-related metrics of interest. Multinomial regression was used to evaluate the relationship between BRS and number of hospitalizations (categorized into three levels [i.e., 0, 1, 2+]). Odds ratios (OR) and 95% confidence intervals (CI) are presented for logistic regression and multinomial regression. Models were adjusted for race/ethnicity, gender, and age.
A joint test of both the main effect of hospitalizations and interaction with BRS was conducted to test the moderating effect of BRS on the relationship between number of hospitalizations in the prior year and aging-related metrics of interest. Linear and logistic regression models were built with number of hospitalizations predicting each aging-related metric, with models adjusted for demographic covariates (age, race/ethnicity, gender), BRS score, and an interaction variable (BRS score by categorized number of hospitalizations). For all analyses, a p-value of <0.05 was considered statistically significant. No adjustments for multiple tests were made.
RESULTS
Of the 5145 participants who were randomized in the Look AHEAD Trial, n = 3199 participated in the follow-up assessment for the current study, provided complete data for the BRS, and thus were eligible for inclusion in the current analysis. Descriptive data are presented in Table 1. BRS was not associated with treatment (DSE: 3.8 ± 0.8; ILI: 3.8 ± 0.7, p = 0.85) or age (r = 0.01, p = 0.69) but did vary based on gender (Male: 3.9 ± 0.7; Female: 3.7 ± 0.8, p < 0.01) and race/ethnicity (White: 3.8 ± 0.8; Black: 3.9 ± 0.7; Hispanic: 3.7 ± 0.8; Other/mixed: 3.6 ± 0.7, p < 0.01). Adjusted analyses evaluating association of BRS with aging-related metrics are presented in Table 2.
TABLE 1.
Characteristics of study participants and descriptive data for key study variables assessed on average 14.4 years after randomization
| Number of participants with dataa | Mean ± standard deviation or N (%) | |
|---|---|---|
| Randomization assignment | ||
| DSE | 3199 | 1562 (48.8%) |
| ILI | 1637 (51.2%) | |
|
| ||
| Age (years) | 3199 | 72.2 ± 6.2 |
|
| ||
| Gender | ||
| Male | 3199 | 1226 (38.3%) |
| Female | 1973 (61.7%) | |
|
| ||
| Race/ethnicity | ||
| White | 3199 | 1953 (61.0%) |
| Black | 517 (16.2%) | |
| Hispanic | 440 (13.8%) | |
| Other/mixed | 289 (9.0%) | |
|
| ||
| BMI | 2962 | 34.2 ± 8.2 |
|
| ||
| HbA1c (%) | 2922 | 7.5 ± 1.4 |
|
| ||
| Weight change (%) from baseline | 2981 | −7.0 ± 14.0 |
|
| ||
| Number of hospitalizations in prior year | ||
| 0 | 3195 | 2624 (82.1%) |
| 1 | 410 (12.8%) | |
| 2+ | 161 (5.0%) | |
|
| ||
| PAT-D score | 3110 | 1.5 ± 0.5 |
|
| ||
| Brief resilience score | 3199 | 3.8 ± 0.7 |
|
| ||
| Frailty (weight included) | ||
| Frail | 2235 | 392 (17.5%) |
| Non-frail | 1843 (82.5%) | |
|
| ||
| Frailty (weight excluded) | ||
| Frail | 2235 | 328 (14.7%) |
| Non-frail | 1907 (85.3%) | |
|
| ||
| SF 36 physical component summary | 3189 | 41.9 ± 10.3 |
|
| ||
| SF 36 mental component summary | 3189 | 53.1 ± 10.0 |
|
| ||
| Gait speed (meters/second) | 2911 | 0.9 ± 0.2 |
|
| ||
| Grip strength (kilograms) | 2681 | 23.9 ± 9.4 |
|
| ||
| PHQ-9 total score | 3027 | 2.7 ± 3.3 |
Abbreviations: BMI, body mass index (kilograms/meters2); DSE, diabetes support and education; HbA1c, hemoglobin A1c; ILI, intensive lifestyle intervention; PAT-D, Pepper Assessment Tool for Disability; PHQ-9, Patient Health Questionnaire-9; SF 36, Medical Outcomes Survey, Short Form-36.
Sample size with complete data varies across several measures. This primarily resulted from two factors: (1) data collection completed by phone for a subset of individuals precluded participation in objective physical function testing, and (2) omission of objective physical function testing due to current health status (e.g., arthritis or recent surgery preventing completion of grip test.) As a result of these circumstances, frailty data were only available for participants with no missing data on the measures used to create the frailty phenotype score (n = 2235).
TABLE 2.
Association of psychological resilience measured using the Brief Resilience Scale (BRS) with continuous aging-related markers of functioning using linear regression analysis
| Resilience |
||
|---|---|---|
| Outcome | Estimate (95% confidence interval) | p-value |
| HbA1c (%) | −0.10 (−0.17, −0.03) | 0.007 |
|
| ||
| BMI (kilograms/meter2) | −0.50 (−0.90, −0.11) | 0.012 |
|
| ||
| PAT-D score | −0.20 (−0.22, −0.18) | <0.001 |
|
| ||
| SF 36 physical component score | 3.44 (2.99, 3.90) | <0.001 |
|
| ||
| SF 36 mental component score | 7.41 (7.02, 7.80) | <0.001 |
|
| ||
| Gait speed (meters/second) | 0.05 (0.04, 0.06) | <0.001 |
|
| ||
| Grip strength (kilograms) | 1.16 (0.809, 1.506) | <0.001 |
|
| ||
| PHQ-9 total score | −2.02 (−2.16, −1.87) | <0.001 |
|
| ||
| Frailty (two levels) | ||
| Frail versus non-frail (weight included) | 0.38 (0.33, 0.45) | <0.001 |
| Frail versus non-frail (weight excluded) | 0.39 (0.33, 0.46) | <0.001 |
|
| ||
| Number of hospitalizations in prior yeara | ||
| 1 versus 0 | 0.92 (0.80, 1.06) | 0.052 |
| 2+ versus 0 | 0.79 (0.64, 0.97) | |
Note: Estimates presented in this table reflect the change in the continuous variable associated with a one-point increase in BRS score (e.g., a one-point BRS score increase is associated with a decrease in HbA1c% of 0.10). With adjustment for age, race/ethnicity, and gender indicated, higher BRS was associated with lower BMI, less disability in activities of daily living (PAT-D), greater grip strength, and gait speed. Resilience was also positively associated with physical and mental quality of life (SF 36 physical and mental component scores) and fewer depressive symptoms (PHQ-9). Psychological resilience is associated with lower likelihood of meeting criteria for frailty (i.e., an Odds Ratio that is less than one indicates that as BRS scores increase by one point, there is a reduced likelihood of meeting frailty criteria.) All models are adjusted for age, race/ethnicity, and gender. Odds ratios are estimated using logistic regression models.
Abbreviations: BMI, body mass index; HbA1c, hemoglobin A1c; PAT-D, Pepper Assessment Tool for Disability; PHQ-9, Patient Health Questionnaire-9; SF 36, Medical Outcomes Survey, Short Form-36.
For number of hospitalizations in the prior year, Odds ratios are estimated using a multinomial regression model.
More frequent hospitalization in the previous year was associated with lower physical (p < 0.001) and mental quality of life (p = 0.001), greater depressive symptoms (p = 0.001), greater disability (p < 0.001), lower gait speed (p < 0.001), lower grip strength (p = 0.005), and increased odds of frailty status (p < 0.01, defined with/without weight loss). However, only the associations of hospitalizations in the past year with disability (p = 0.02; see Figure 1A) and grip strength (p = 0.05; see Figure 1B) were moderated by BRS (interaction effects in all other models were ns, p > 0.05).
FIGURE 1.
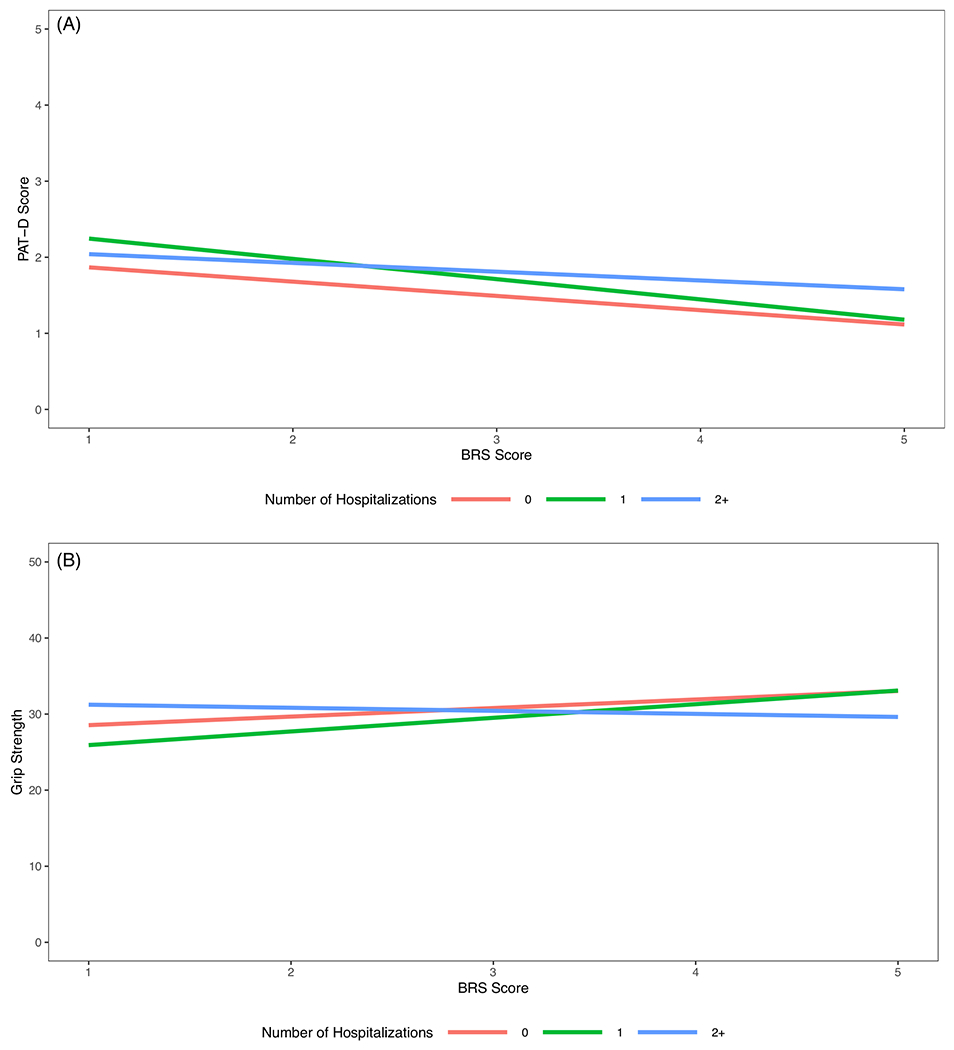
(A) Adjusted estimates for disability assessed with the Pepper Assessment Tool for Disability (PAT-D) by Brief Resilience Scale (BRS) score and number of hospitalizations in the past year. To provide a visual representation of the interaction of hospitalizations with resilience (BRS) in the association with disability (PAT-D), this figure depicts the model results for the following demographic values; average age, White, and male. Patterns remain similar when alternative demographic values are selected. As depicted above, hospitalization was associated with greater disability regardless of level of resilience. However, in comparing those with one hospitalization versus none in the past year, greater resilience was associated with a more modest increase in disability relative to those lower in resilience. Among those with two or more hospitalizations, the association of resilience with disability appears to be attenuated. (B) Adjusted estimates for grip strength scores by Brief Resilience Scale (BRS) scores and number of hospitalizations in the past year. To provide a visual representation of the interaction effect, this figure depicts the model results for the following demographic values: average age, White, and male. Patterns remain similar when alternative demographic values are selected. As depicted above, the estimated grip strength was similar between those with one and no hospitalizations in the last year for those with higher resilience. However, for those with lower resilience, having one hospitalization was associated with lower grip strength as compared to those with no hospitalizations. For those with two or more hospitalizations, the association of resilience with grip strength is attenuated, as evidenced by the lower grip strength associated with higher resilience as compared to those with no hospitalizations
DISCUSSION
In a cohort of older individuals with T2DM, greater psychological resilience was associated with less frequent hospitalization in the past year, better physical functioning, lower self-reported disability, better mental quality of life, and lower likelihood of frailty. Resilience also moderated the relationship of the number of hospitalizations with self-reported disability and grip strength. Among individuals with zero or one hospitalization, greater resilience was associated with less disability and greater grip strength. This association was attenuated following 2+ hospitalizations suggesting a threshold effect with resilience having a protective effect only in the context of fewer hospitalizations. Because resilience varied by race/ethnicity, post hoc analyses were conducted to explore the association of resilience with aging-related variables stratified by race/ethnicity (see Table S1). Findings highlight several distinctions that warrant future investigation.
Strengths of the current study include a standardized assessment of multiple health-related variables and a large and diverse sample from across the United States. Limitations include cross-sectional data which prohibit causal conclusions and do not clarify the direction of the relationship between these variables. Multiple analyses increase the possibility of type 1 error (particularly for the interaction models where several were conducted and only two emerged as significant). The BRS is brief, commonly used, and has strong psychometric properties in older adults. However, this one-time assessment is consistent with operationalizing resilience as an enduring personality trait. Increasingly, resilience is believed to be dynamic and to vary over time.27 The current study does not include all sociocultural factors (e.g., socioeconomic status) that may be relevant for resilience and some important aspects of aging were not assessed (e.g., cognitive function).
Although causality cannot be inferred, multiple hypotheses can be proposed from the current findings to guide future work. For example, resilience may exert a protective effect in the face of medical challenge (e.g., resilient individuals are protected against potential adverse events following hospitalization) or individuals may perceive themselves as more resilient in response to navigating a medical challenge (e.g., recent hospitalization may influence individual perception of resilience). Longitudinal data with comprehensive assessments that integrate physical and psychological aspects of resilience and more detailed information about the adverse events individuals encounter (e.g., types and frequency) will provide insight into how these attitudes and events are related prospectively. Additionally, understanding the boundaries of the therapeutic benefits of resilience (e.g., for whom, when, and to what extent) is important as the current study suggests variability based on several factors such as hospitalization history and race/ethnicity. Such foundational work will pave the way for future investigations to determine if psychological resilience can be targeted with intervention to improve aging.
The association of psychological resilience with diverse metrics of aging-related function, including objective measures, in the current study is aligned with a more wholistic perspective on aging-related health. Distinguishing between psychological and physical resilience has precedent in the literature and can be pragmatic for conceptualizing and measuring these constructs. However, these demarcations are likely artificial as aging is a biopsychosocial phenomenon. In the short term, incorporating measures of psychological resilience into the study of aging is consistent with calls to advance the dialogue about aging beyond the discussion of loss and decline and to define healthy aging as more than simply the absence of health-related issues.
Supplementary Material
Table S1. Association of resilience measured using the Brief Resilience Scale (BRS) and aging-related variables stratified by race/ethnicity.
Appendix S1. Look AHEAD Research Group at End of Intervention.
Key points
In a cohort of older individuals with a history of type 2 diabetes mellitus, greater psychological resilience was associated with less frequent hospitalization in the past year, better physical functioning, lower self-reported disability, better mental quality of life, and lower likelihood of frailty.
The association of resilience with some metrics (grip strength, self-reported disability) varied based on recent hospitalization history and exploratory post hoc analyses suggest that some associations may differ based on race/ethnicity.
The cross-sectional design and posthospitalization timing of the resilience assessment highlight the importance of further work exploring psychological resilience with methodology that can advance understanding of the direction and nature of these associations.
Why does this paper matter?
With growing interest in fostering a positive and healthy aging experience, a more comprehensive understanding of the potential clinical benefits of psychological resilience in aging may highlight new opportunities to enhance the later years of life.
ACKNOWLEDGMENTS
This work was supported by the National Institute of Diabetes and Digestive and Kidney Diseases (K23 DK124578). The Look AHEAD study was funded by several sponsors which can be reviewed in Appendix S1.
SPONSOR’S ROLE
Funding sources did not participate in the preparation of this manuscript.
CONFLICT OF INTEREST
Dr. Medha Munshi is a consultant for Sanofi. Dr. Thomas Wadden serves on scientific advisory boards for Novo Nordisk and WW (formerly Weight Watchers) and has received grant support, on behalf of the University of Pennsylvania, from Novo Nordisk and Epitomee Medical Ltd. Dr. Rena Wing is on the Scientific Advisory Board of NOOM. The other authors report no conflicts.
Footnotes
The Look AHEAD Research Group names and affiliations are listed in Appendix S1.
This work was also presented as a poster presentation at the Gerontological Society of America Annual meeting (2021).
SUPPORTING INFORMATION
Additional supporting information can be found online in the Supporting Information section at the end of this article.
REFERENCES
- 1.US Department of Health and Human Services. A Profile of Older Americans: 2010. http://www.aoa.gov/aoaroot/aging_statistics/Profile/2010/docs/2010profile.pdf. Accessed November 17, 2011.
- 2.Dent E, Kowal P, Hoogendijk EO. Frailty measurement in research and clinical practice: a review. Eur J Intern Med. 2016;31:3–10. [DOI] [PubMed] [Google Scholar]
- 3.Lekan DA. Aging, frailty, and resilience. J Psychosoc Nurs Ment Health Serv. 2018;56(7):2–4. [DOI] [PubMed] [Google Scholar]
- 4.Diehl M, Smyer MA, Mehrotra CM. Optimizing aging: a call for a new narrative. Am Psychol. 2020;75(4):577–589. doi: 10.1037/amp0000598 [DOI] [PMC free article] [PubMed] [Google Scholar]
- 5.Liu JJ, Ein N, Gervasio J, et al. Comprehensive meta-analysis of resilience interventions. Clin Psychol Rev. 2020;82:101919. [DOI] [PubMed] [Google Scholar]
- 6.Lavretsky H Resilience and Aging: Research and Practice. JHU Press; 2014. [Google Scholar]
- 7.Whitson HE, Duan-Porter W, Schmader KE, et al. Physical resilience in older adults: systematic review and development of an emerging construct. J Gerontol B Psychol Sci Soc Sci. 2016;71(4):489–495. [DOI] [PMC free article] [PubMed] [Google Scholar]
- 8.Smith BW, Dalen J, Wiggins K, Tooley E, Christopher P, Bernard J. The brief resilience scale: assessing the ability to bounce back. Int J Behav Med. 2008;15(3):194–200. [DOI] [PubMed] [Google Scholar]
- 9.Shen K, Zeng Y. The association between resilience and survival among Chinese elderly. Resilience in Aging. Springer; 2011:217–229. [DOI] [PMC free article] [PubMed] [Google Scholar]
- 10.Resnick B Resilience in older adults: what it is and how to strengthen it. Resilience and Aging. Springer; 2020:15–30. [Google Scholar]
- 11.Chiang JL, Jani BD, Mair FS, et al. Associations between multimorbidity, all-cause mortality and glycaemia in people with T2DM: a systematic review. PLoS One. 2018;13(12):e0209585. [DOI] [PMC free article] [PubMed] [Google Scholar]
- 12.Marseglia A, Fratiglioni L, Kalpouzos G, Wang R, Bäckman L, Xu W. Prediabetes and diabetes accelerate cognitive decline and predict microvascular lesions: a population-based cohort study. Alzheimers Dement. 2019;15(1):25–33. [DOI] [PubMed] [Google Scholar]
- 13.Shang Y, Fratiglioni L, Vetrano DL, Dove A, Welmer AK, Xu W. Not only diabetes but also prediabetes leads to functional decline and disability in older adults. Diabetes Care. 2021;44(3):690–698. [DOI] [PMC free article] [PubMed] [Google Scholar]
- 14.Crump C, Sundquist J, Winkleby MA, Sundquist K. Stress resilience and subsequent risk of T2DM in 1.5 million young men. Diabetologia. 2016;59(4):728–733. [DOI] [PMC free article] [PubMed] [Google Scholar]
- 15.Pesantes MA, Lazo-Porras M, Ávila-Ramírez JR, et al. Resilience in vulnerable populations with T2DM mellitus and hypertension: a systematic review and meta-analysis. Can J Cardiol. 2015;31(9):1180–1188. [DOI] [PMC free article] [PubMed] [Google Scholar]
- 16.Look AHEAD Research Group, Wadden TA, West DS, et al. The look AHEAD study: a description of the lifestyle intervention and the evidence supporting it. Obesity. 2006;14(5):737–752. [DOI] [PMC free article] [PubMed] [Google Scholar]
- 17.Fu H, Curtis BH, Xie W, Festa A, Schuster DP, Kendall DM. Frequency and causes of hospitalization in older compared to younger adults with T2DM in the United States: a retrospective, claims-based analysis. J Diabetes Complicat. 2014;28(4):477–481. [DOI] [PubMed] [Google Scholar]
- 18.Espeland M Reduction in weight and cardiovascular disease risk factors in individuals with T2DM: one-year results of the Look AHEAD Trial. Diabetes Care. 2007;30(6):1374–1383. [DOI] [PMC free article] [PubMed] [Google Scholar]
- 19.Look AHEAD Research Group. Cardiovascular effects of intensive lifestyle intervention in T2DM. N Engl J Med. 2013;369(2):145–154. [DOI] [PMC free article] [PubMed] [Google Scholar]
- 20.Windle G, Bennett KM, Noyes J. A methodological review of resilience measurement scales. Health Qual Life Outcomes. 2011;9(1):8. [DOI] [PMC free article] [PubMed] [Google Scholar]
- 21.Ware JE Jr, Sherbourne CD. The MOS 36-item short-form health survey (SF-36): I. conceptual framework and item selection. Med Care. 1992;30:473–483. [PubMed] [Google Scholar]
- 22.Kroenke K, Spitzer RL. The PHQ-9: a new depression diagnostic and severity measure. Psychiatr Ann. 2002;32(9):509–515. [Google Scholar]
- 23.Lowe B, Unutzer J, Callahan CM, et al. Monitoring depression treatment outcomes with the Patient Health Questionnaire-9. Med Care. 2004;42:1194–1201. doi: 10.1097/00005650-200412000-00006 [DOI] [PubMed] [Google Scholar]
- 24.Phelan E, Williams B, Meeker K, et al. A study of the diagnostic accuracy of the PHQ-9 in primary care elderly. BMC Fam Pract. 2010;11(1):63. [DOI] [PMC free article] [PubMed] [Google Scholar]
- 25.Rejeski WJ, Ettinger WH Jr, Schumaker S, James P, Burns R, Elam JT. Assessing performance-related disability in patients with knee osteoarthritis. Osteoarthr Cartil. 1995;3(3):157–167. [DOI] [PubMed] [Google Scholar]
- 26.Fried LP, Tangen CM, Walston J, et al. Frailty in older adults: evidence for a phenotype. J Gerontol B Psychol Sci Soc Sci. 2001;56(3):M146–M157. [DOI] [PubMed] [Google Scholar]
- 27.Allen RS, Dorman HR, Henkin H, et al. Definition of resilience. Resilience in Aging. Springer; 2018:1–15. [Google Scholar]
Associated Data
This section collects any data citations, data availability statements, or supplementary materials included in this article.
Supplementary Materials
Table S1. Association of resilience measured using the Brief Resilience Scale (BRS) and aging-related variables stratified by race/ethnicity.
Appendix S1. Look AHEAD Research Group at End of Intervention.