

Key Points
Question
Are APOE amino acid–altering variants, other than the common APOE alleles ε2 and ε4, associated with Alzheimer disease (AD) risk in individuals of African ancestry?
Findings
In this exploratory case-control analysis that included 31 929 participants of African ancestry, stratified analyses demonstrated that the APOE ε3[R145C] missense variant was associated with an increased risk of AD among individuals with the ε3/ε4 genotype in a discovery cohort (odds ratio, 3.01), a replication cohort (odds ratio, 2.20), and an external validation cohort (odds ratio, 1.90).
Meaning
These findings, with additional external validation, may inform AD genetic risk assessment in individuals of African ancestry.
Abstract
Importance
Numerous studies have established the association of the common APOE ε2 and APOE ε4 alleles with Alzheimer disease (AD) risk across ancestries. Studies of the interaction of these alleles with other amino acid changes on APOE in non-European ancestries are lacking and may improve ancestry-specific risk prediction.
Objective
To determine whether APOE amino acid changes specific to individuals of African ancestry modulate AD risk.
Design, Setting, and Participants
Case-control study including 31 929 participants and using a sequenced discovery sample (Alzheimer Disease Sequencing Project; stage 1) followed by 2 microarray imputed data sets derived from the Alzheimer Disease Genetic Consortium (stage 2, internal replication) and the Million Veteran Program (stage 3, external validation). This study combined case-control, family-based, population-based, and longitudinal AD cohorts, which recruited participants (1991-2022) in primarily US-based studies with 1 US/Nigerian study. Across all stages, individuals included in this study were of African ancestry.
Exposures
Two APOE missense variants (R145C and R150H) were assessed, stratified by APOE genotype.
Main Outcomes and Measures
The primary outcome was AD case-control status, and secondary outcomes included age at AD onset.
Results
Stage 1 included 2888 cases (median age, 77 [IQR, 71-83] years; 31.3% male) and 4957 controls (median age, 77 [IQR, 71-83] years; 28.0% male). In stage 2, across multiple cohorts, 1201 cases (median age, 75 [IQR, 69-81] years; 30.8% male) and 2744 controls (median age, 80 [IQR, 75-84] years; 31.4% male) were included. In stage 3, 733 cases (median age, 79.4 [IQR, 73.8-86.5] years; 97.0% male) and 19 406 controls (median age, 71.9 [IQR, 68.4-75.8] years; 94.5% male) were included. In ε3/ε4-stratified analyses of stage 1, R145C was present in 52 individuals with AD (4.8%) and 19 controls (1.5%); R145C was associated with an increased risk of AD (odds ratio [OR], 3.01; 95% CI, 1.87-4.85; P = 6.0 × 10⁻⁶) and was associated with a reported younger age at AD onset (β, −5.87 years; 95% CI, −8.35 to −3.4 years; P = 3.4 × 10⁻⁶). Association with increased AD risk was replicated in stage 2 (R145C was present in 23 individuals with AD [4.7%] and 21 controls [2.7%]; OR, 2.20; 95% CI, 1.04-4.65; P = .04) and was concordant in stage 3 (R145C was present in 11 individuals with AD [3.8%] and 149 controls [2.7%]; OR, 1.90; 95% CI, 0.99-3.64; P = .051). Association with earlier AD onset was replicated in stage 2 (β, −5.23 years; 95% CI, −9.58 to −0.87 years; P = .02) and stage 3 (β, −10.15 years; 95% CI, −15.66 to −4.64 years; P = 4.0 × 10⁻⁴). No significant associations were observed in other APOE strata for R145C or in any APOE strata for R150H.
Conclusions and Relevance
In this exploratory analysis, the APOE ε3[R145C] missense variant was associated with an increased risk of AD among individuals of African ancestry with the ε3/ε4 genotype. With additional external validation, these findings may inform AD genetic risk assessment in individuals of African ancestry.
This exploratory case-control study assesses the association of APOE missense variants with risk of Alzheimer disease among individuals of African ancestry with the APOE ε3/ε4 genotype.
Introduction
The APOE ε4 allele and age are the 2 main risk factors for late-onset Alzheimer disease (AD). The AD risk associated with common APOE alleles ε41and ε22 is well established in European-ancestry individuals but varies considerably across other ancestries (Table 1).3 Other missense variants have been identified on APOE. Some, such as Leu28Pro (L28P), Val236Glu (V236E), and Arg251Gly (R251G), are relatively common in European-ancestry individuals (0.1% to 1% of individuals). V236E and R251G have been associated with reduced AD risk.4,5 Another rare missense variant, Arg136Ser (R136S), has been purported to protect against early-onset AD in a carrier of the PSEN1 variant.6 Additional APOE missense variants have been understudied because they are present mainly in African-ancestry individuals, who are underrepresented in AD genetics studies.
Table 1. Distribution of the Common APOE Genotypes Across Ancestries and Associated Odds Ratiosa.
| APOE genotype | European | African American | Hispanic | Japanese | ||||||||
|---|---|---|---|---|---|---|---|---|---|---|---|---|
| Percentage | Odds ratio (95% CI) | Percentage | Odds ratio (95% CI) | Percentage | Odds ratio (95% CI) | Percentage | Odds ratio (95% CI) | |||||
| Alzheimer disease cases | Cognitively healthy controls | Alzheimer disease cases | Cognitively healthy controls | Alzheimer disease cases | Cognitively healthy controls | Alzheimer disease cases | Cognitively healthy controls | |||||
| No. of individuals | 5107 | 6262 | 235 | 240 | 261 | 267 | 336 | 1977 | ||||
| ε2/ε3 | 4.8 | 12.7 | 0.6 (0.5-0.8) | 9.8 | 12.9 | 0.6 (0.4-1.7) | 9.6 | 12.0 | 0.6 (0.3-1.3) | 3.9 | 6.9 | 0.9 (0.4-2.5) |
| ε3/ε3 | 36.4 | 60.9 | 1 [Reference] | 36.2 | 50.4 | 1 [Reference] | 54.4 | 67.4 | 1 [Reference] | 49.1 | 75.7 | 1 [Reference] |
| ε3/ε4 | 41.1 | 21.3 | 3.2 (2.8-3.8) | 37.9 | 31.8 | 1.1 (0.7-1.8) | 30.7 | 17.6 | 2.2 (1.3-3.4) | 36.9 | 15.5 | 5.6 (3.9-8.0) |
| ε4/ε4 | 14.8 | 1.8 | 14.9 (10.8-20.6) | 12.3 | 2.1 | 5.7 (2.3-14.1) | 2.7 | 1.9 | 2.2 (0.7-6.7) | 8.9 | 0.8 | 33.1 (13.6-80.5) |
Adapted from Farrer et al.3 APOE genotypes are ordered by ascending odds ratios. The APOE ε3/ε3 genotype was used as the reference odds ratio because it is the most common genotype across ancestries.
This study was designed to investigate whether APOE missense variants in African-ancestry individuals were associated with AD risk. Apart from the ε2 and ε4 alleles, the canonical APOE transcript harbored 2 variants with minor allele count above 10 in the discovery sample used in this study. One is common, Arg145Cys (R145C), with a minor allele frequency of approximately 2%, and one is rare, Arg150His (R150H), with a minor allele frequency of approximately 0.1% (eTable 1 in Supplement 1). The R145C (rs769455) and R150H (rs376170967) variants are located within the receptor-binding region of apolipoprotein E (apoE), between the 2 variants, rs7412 (R158C) and rs429358 (C112R), that determine the ε2 and ε4 alleles. Prior studies7,8,9 and Alzheimer Disease Sequencing Project (ADSP) data have shown that R145C is always in phase with ε3 and R150H is always in phase with ε2. More than 4% of individuals of African ancestry carry R145C,7 while it is very rare in people of European ancestry (eTable 1 in Supplement 1). Local ancestry analysis10 has confirmed that this variant is always on an African haplotype (eFigure 1 in Supplement 1) and thus is seen only in individuals with African admixture. The present study sought to determine whether R145C and R150H were associated with AD risk.
Methods
Participants and Source of Data
Participants or their caregivers provided written informed consent in the original studies. The current study protocol was granted an exemption by the Stanford University institutional review board because the analyses were carried out on deidentified data; therefore, additional informed consent was not required. Phenotypic information and genotypes for AD cases and cognitively unimpaired individuals were obtained from publicly released genome-wide association study data sets assembled by the AD Genetics Consortium and derived from whole-exome and whole-genome sequence data generated by the ADSP, with phenotype and genotype ascertainment described elsewhere.11,12,13,14,15 The cohorts’ queried accession numbers, as well as the sequencing technology or single-nucleotide variant genotyping platforms, are described in eTables 2 and 3 in Supplement 1. Inclusion criteria vary across these studies and are provided in eAppendix 1 in Supplement 1, which provides a brief description of each cohort. Carriers of known pathogenic variants on APP, PSEN1, PSEN2, and MAPT were excluded from this analysis (eTable 4 in Supplement 1).
An additional data set was pursued through an external collaboration with the US Department of Veterans Affairs’ Million Veteran Program (MVP).16 The MVP has genotypes available for more than 650 000 US veterans linked to their electronic medical records. The MVP cohort used herein was assembled for an African-ancestry dementia genome-wide association study described by Sherva et al.17 Alzheimer disease in the MVP cohort was based on the presence of 2 or more International Classification of Diseases, Ninth Revision (ICD-9) or International Statistical Classification of Diseases and Related Health Problems, Tenth Revision (ICD-10) diagnosis codes for AD. The controls used for MVP analyses included veterans aged 65 years or older without AD or other dementia ICD codes17 who did not report a parental history of dementia in an MVP health survey taken near the time of MVP enrollment.
Alzheimer Disease Sequencing Project participants who are enrolled in AD research centers across the US had their longitudinal cognitive assessments recorded in the National Alzheimer’s Coordinating Center database, including the Clinical Dementia Rating (CDR) sum-of-boxes (CDR-SB) score.
Quality Control Procedures
Quality control followed standard practices and was performed per cohort-genotyping platform pair and is described in eAppendix 2 in Supplement 1.
Ancestry Determination
For each cohort, we first determined the ancestry of each individual with SNPWeights version 218 using reference populations from the 1000 Genomes Consortium.19 By applying an ancestry percentage cutoff of greater than 75%, the samples were stratified into 5 superpopulations: African, American, East Asian, European, South Asian, and an admixed group composed of individuals not reaching the 75% cutoff in any single ancestry (eTable 5 in Supplement 1) as implemented in previous analyses of European individuals.20,21 Since the APOE missense variants of interest (R145C and R150H) are extremely rare in populations not of African ancestry, we restricted our analysis to individuals identified as African and admixed African. Admixed African individuals included in the main analysis had at least 15% African ancestry, and we performed sensitivity analyses in increments of 30%, including admixed African individuals at 45% and 75% cutoffs, the latter corresponding to the superpopulation threshold. In the MVP, ancestry was assessed based on the genotypically informed Harmonized Ancestry and Race/Ethnicity algorithm.22
Procedures to determine APOE haplotype local ancestry and assess global ancestry among reference African populations are described in eAppendix 2 in Supplement 1.
Imputation
Each cohort-genotyping platform was imputed on the TOPMed23 imputation server per ancestry group to obtain an imputation quality (R2) per ancestry group. For rs769455, R2 was 0.3 or less in all European ancestry cohorts, but was greater than 0.95 in most cohort-genotyping platforms for African and admixed groups. This observation is consistent with the minor allele frequency of greater than 2% in African American individuals10 and approximately 0.007% in European individuals. We retained individuals with an R2 greater than 0.8 at rs769455 (eTable 6 in Supplement 1). As there was no signal for rs376170967 in the discovery sample, we did not evaluate it in the replication data sets. rs769455 was directly genotyped on the MVP Affymetrix Axiom array.
APOE Genotype Ascertainment
We directed specific attention to the genotyping of the single-nucleotide variants determining the main APOE genotype (rs429358 and rs7412), rs769455-T (APOE[R145C]), and rs376170967-A (APOE[R150H]). Details are provided in eAppendix 2, eFigure 2, and eTable 7 in Supplement 1.
Discovery and Replication Samples
Our discovery sample (stage 1) was composed of individuals of African and admixed African ancestry (eFigure 3 in Supplement 1) from the ADSP whole-exome and whole-genome sequencing (Table 2). To build an internal replication sample (stage 2) for R145C, we queried for individuals of African and admixed African ancestry (eFigure 4 in Supplement 1) in all of the publicly available single-nucleotide variant microarray genetic data sets accessible at the time of the study in July 2021 (Figure 1; eTables 2 and 5 in Supplement 1). eTable 8 in Supplement 1 presents the demographics of the remaining AD cases and cognitively unimpaired controls. Additionally, after stages 1 and 2, an external replication was pursued in the MVP population-based cohort (stage 3) to replicate the main finding.
Table 2. Demographic Characteristics by APOE Genotype in the 3 Study Stage Samples.
| Characteristics | ADSP discovery (stage 1) | ADGC replication (stage 2) | MVP validation (stage 3) | |||
|---|---|---|---|---|---|---|
| Alzheimer disease cases | Cognitively healthy controls | Alzheimer disease cases | Cognitively healthy controls | Alzheimer disease cases | Cognitively healthy controls | |
| No. of individuals | 2888 | 4957 | 1201 | 2744 | 733 | 19 406 |
| Sex, No. (%) | ||||||
| Female | 1984 (68.7) | 3570 (72.0) | 831 (69.2) | 1882 (68.6) | 22 (3.0) | 1074 (5.5) |
| Male | 904 (31.3) | 1387 (28.0) | 370 (30.8) | 862 (31.4) | 711 (97.0) | 18 331 (94.5) |
| Age, median (IQR), y | 77.0 (71.0-83.0) | 77.0 (71.0-83.0) | 75.0 (69.0-81.0) | 80.0 (75.0-84.0) | 79.4 (73.8-86.5) | 71.9 (68.4-75.8) |
| APOE ε2/ε2 genotype | ||||||
| No. (%) | 11 (0.4) | 41 (0.8) | 5 (0.4) | 26 (0.9) | 1 (0.013) | 231 (1.2) |
| Age, median (IQR), y | 81.0 (78.0-85.5) | 78.0 (72.0-85.0) | 79.0 (73.0-80.0) | 82.5 (80.0-85.0) | 84.8 (84.3-84.83) | 71.6 (68.2-75.6) |
| APOE ε2/ε3 genotype | ||||||
| No. (%) | 225 (7.8) | 709 (14.3) | 76 (6.3) | 377 (13.7) | 60 (8.2) | 2935 (15.1) |
| Age, median (IQR), y | 81.0 (75.0-86.0) | 78.0 (71.0-85.0) | 79.0 (72.5-83.0) | 81.0 (77.0-85.0) | 79.0 (73.5-85.8) | 72.1 (68.6-76.4) |
| APOE ε3/ε3 genotype | ||||||
| No. (%) | 1145 (39.6) | 2622 (52.9) | 430 (35.8) | 1318 (48.0) | 247 (33.7) | 9335 (48.1) |
| Age, median (IQR), y | 79.0 (73.0-84.0) | 77.0 (71.0-84.0) | 77.0 (70.25-83.0) | 80.0 (74.0-84.0) | 81.4 (74.4-87.9) | 71.9 (68.4-76.0) |
| APOE ε2/ε4 genotype | ||||||
| No. (%) | 111 (3.8) | 179 (3.6) | 42 (3.5) | 120 (4.4) | 37 (5.0) | 803 (4.1) |
| Age, median (IQR), y | 78.0 (72.0-85.0) | 75.0 (69.0-82.25) | 77.0 (72.0-82.75) | 81.0 (76.0-85.0) | 80.26 (74.9-87.2) | 71.6 (68.6-75.3) |
| APOE ε3/ε4 genotype | ||||||
| No. (%) | 1093 (37.8) | 1288 (26.0) | 491 (40.9) | 786 (28.6) | 289 (39.4) | 5422 (27.9) |
| Age, median (IQR), y | 76.0 (70.0-81.0) | 76.0 (70.0-82.0) | 75.0 (69.0-80.0) | 80.0 (74.0-84.0) | 79.3 (73.4-86.2) | 71.7 (68.5-75.4) |
| APOE ε4/ε4 genotype | ||||||
| No. (%) | 303 (10.5) | 118 (2.4) | 157 (13.1) | 117 (4.3) | 99 (13.5) | 679 (3.5) |
| Age, median (IQR), y | 71.0 (65.0-76.0) | 73.0 (67.0-78.0) | 71.0 (66.0-77.0) | 78.0 (71.0-83.0) | 77.5 (72.7-82.9) | 71.1 (67.8-74.1) |
Abbreviations: ADGC, Alzheimer Disease Genetic Consortium; ADSP, Alzheimer Disease Sequencing Project; MVP, Million Veteran Program.
Figure 1. Individuals Included in the Discovery (Stage 1) and Internal Replication (Stage 2) Samples.
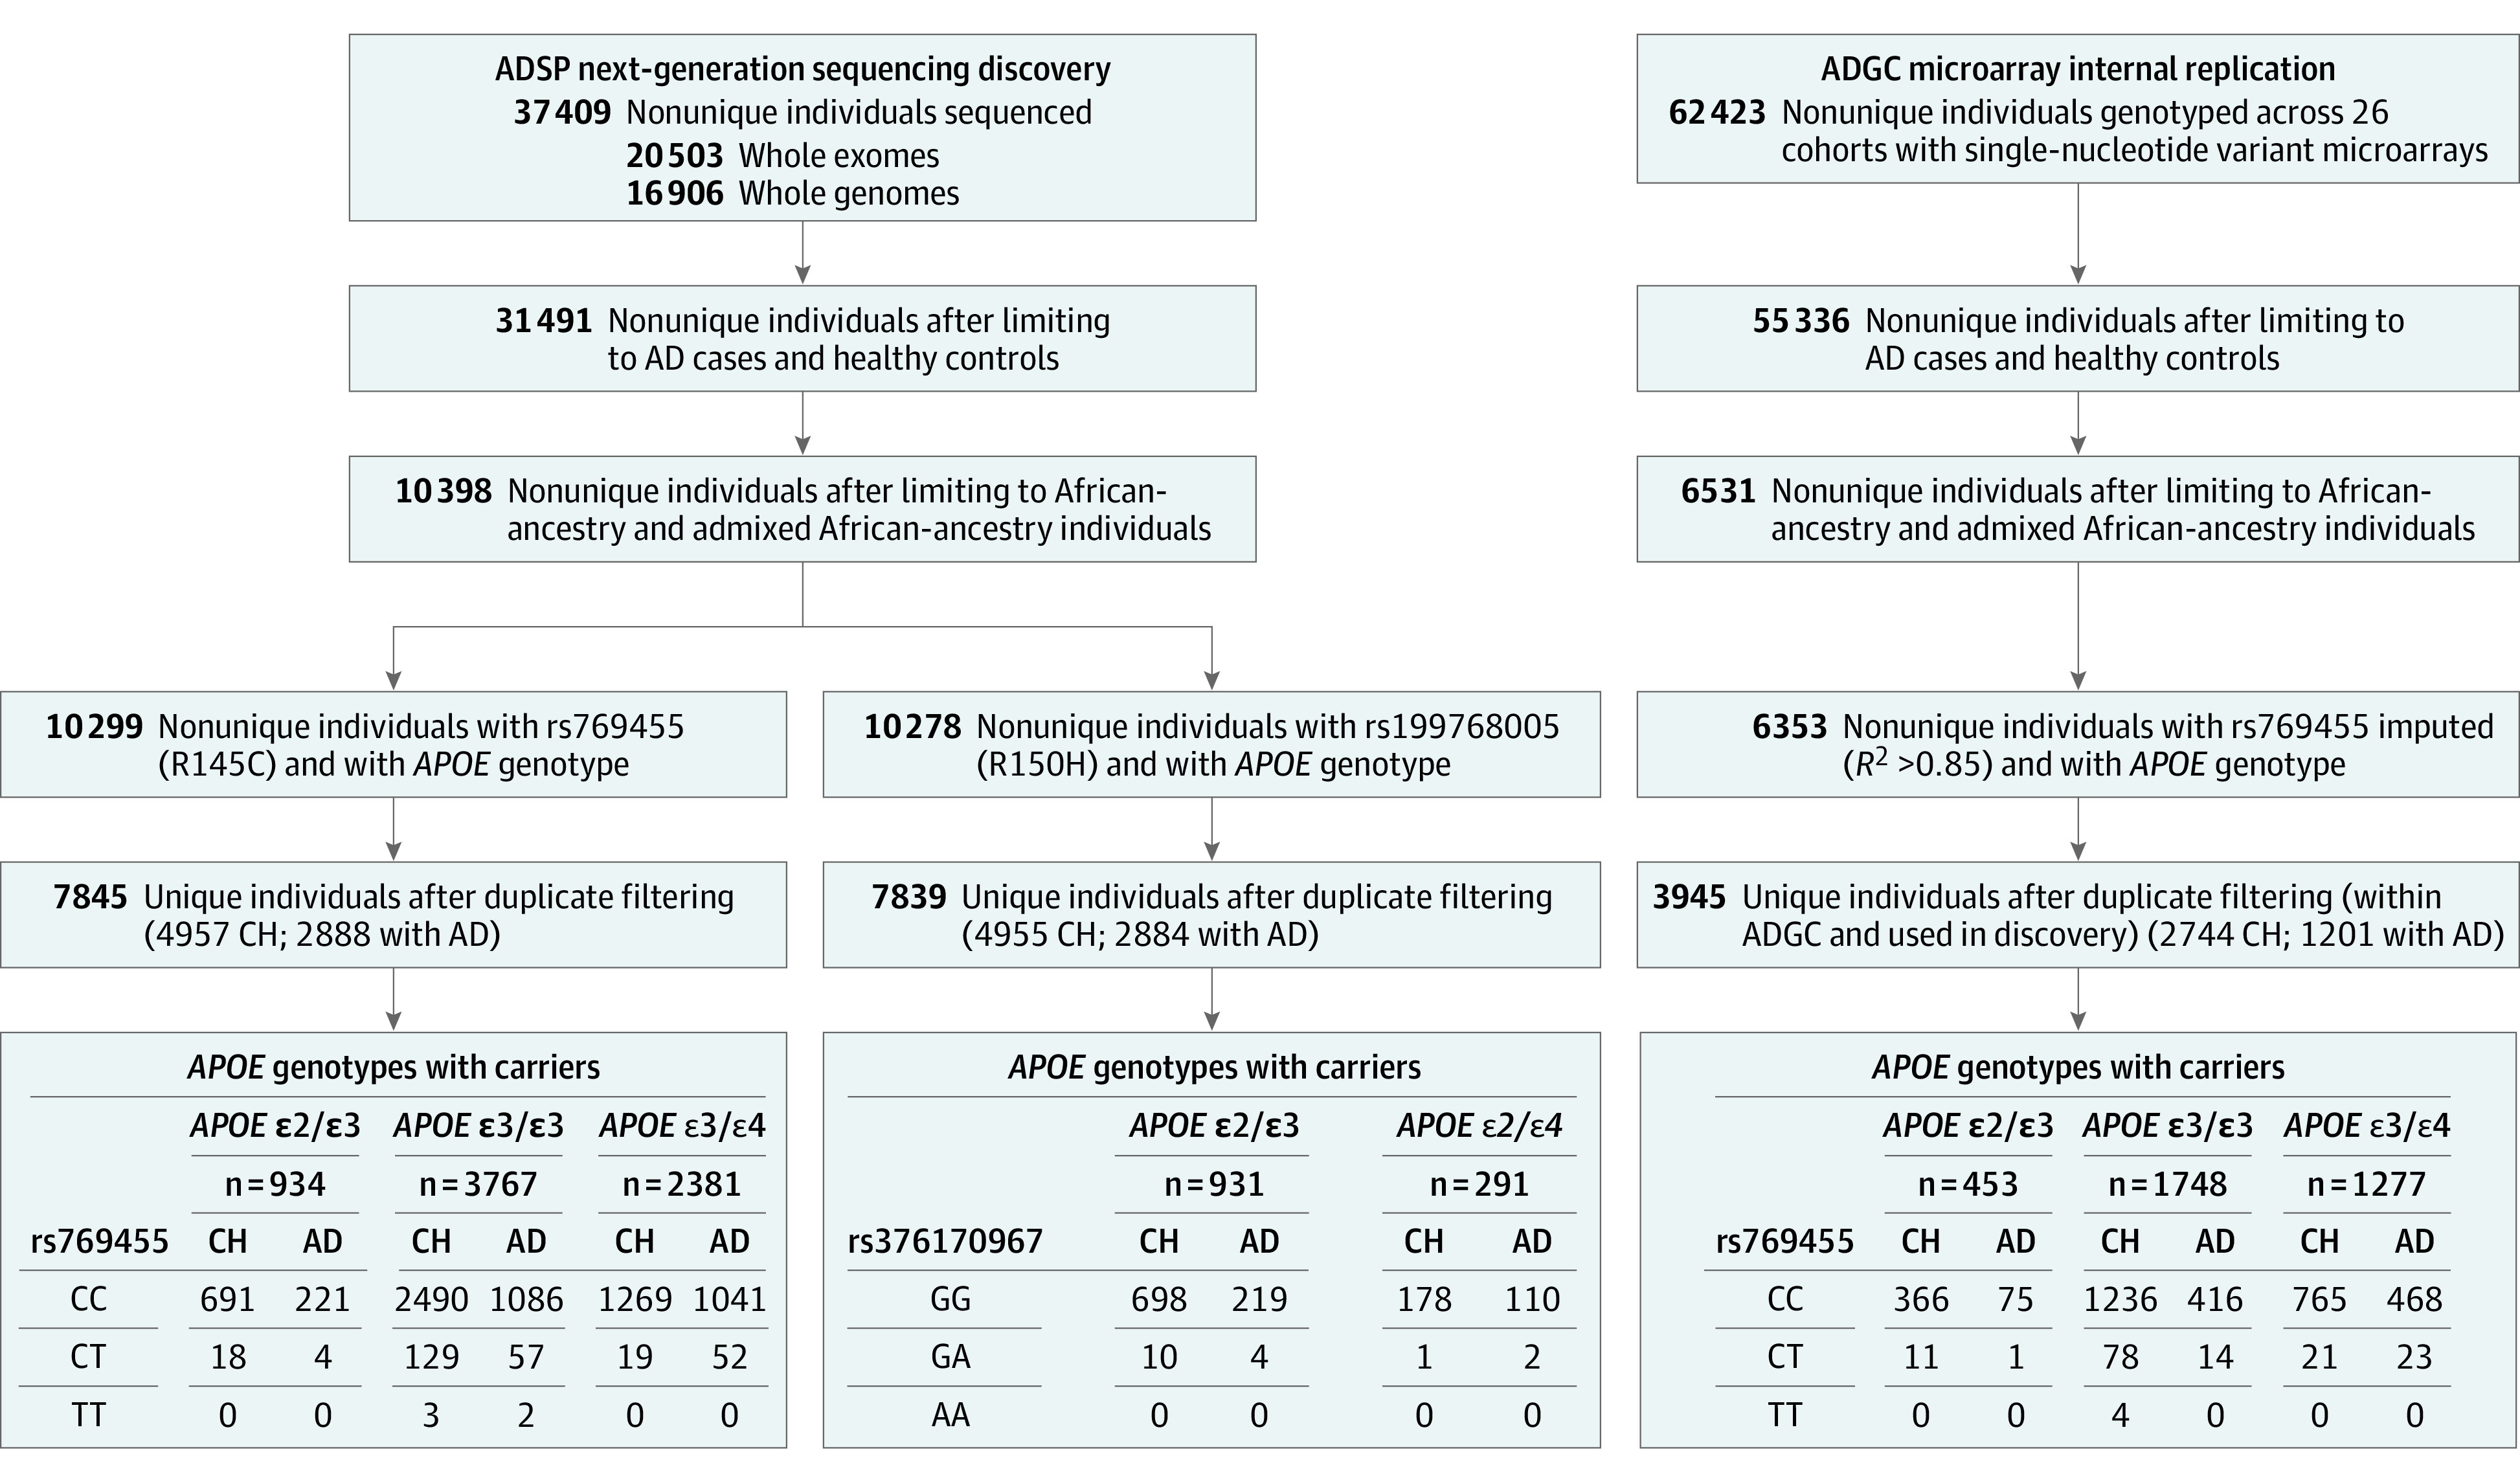
AD indicates Alzheimer disease; ADGC, Alzheimer Disease Genetic Consortium; ADSP, Alzheimer Disease Sequencing Project; and CH, cognitively healthy. In the bottom boxes, CC denotes homozygous for rs769455 reference allele; CT, heterozygous for rs769455; TT, homozygous for rs769455 alternate allele; GG, homozygous for rs376170967 reference allele; GA, heterozygous for rs376170967; and AA, homozygous for rs376170967 alternate allele.
Outcomes
The primary outcome was AD case-control status, distinguishing AD cases from cognitively unimpaired individuals. Secondary outcomes were age at AD onset in AD cases for whom this metric was reported and CDR-SB score in cases and controls with longitudinal data in the National Alzheimer’s Coordinating Center database. The CDR-SB score ranges from 0 to 18, with 0 indicating no impairment across 6 domains (memory, orientation, judgment and problem solving, community affairs, home and hobbies, and personal care) and 18 indicating maximal impairment across all 6 domains. Two recent studies have suggested that the minimum clinically important difference over 1 year is in the range of 1 to 2 points.24,25
Statistical Analyses
All statistical analyses were performed in R version 4.0.2 (R Foundation), and P values throughout the manuscript are reported for 2-tailed tests. Recent work has suggested that when examining variants at the APOE locus, APOE-stratified analyses may provide better statistical power than standard APOE-adjusted models.26 In addition, ε4-stratified analyses obviate concerns about appropriate modeling of the interaction term (eg, linear vs multiplicative).27 Given that the 2 variants of interest are at the APOE locus and that each is only seen on a unique APOE common haplotype, R145C on ε3 and R150H on ε2, we used an APOE-stratified approach in our primary analysis and included standard nonstratified analyses adjusted for ε2 and ε4 dosages in secondary analyses. In primary analyses, we estimated the AD risk associated with R145C and R150H using a linear mixed-model regression analysis on case/control diagnosis in each APOE stratum. In secondary analyses, we estimated the association of R145C with age at AD onset using linear mixed-model regression on age at AD onset in AD cases. Secondary analyses were not conducted for R150H, as this variant showed no association in the primary analysis.
In primary analyses, case-control status, modeled as a binomial outcome, was used as a phenotype in a generalized linear mixed-effects model, as implemented in the GENESIS package, version 3.12,28 using the penalized quasi-likelihood approximation. The same approach was used in the secondary analysis with age at AD onset as a phenotype. All statistical analyses were adjusted for sex and 3 genetic principal components estimated with the PC-air method29 implemented in GENESIS. Linear mixed-model analyses were additionally covaried by a sparse genetic relationship matrix estimated with the PC-Relate method30 implemented in GENESIS. Case-control analyses were not adjusted for age given that controls were older than cases in some APOE ε3 genotype strata (Table 2). Correcting for age when cases are younger than controls leads the model to incorrectly infer the age effect on AD risk, resulting in statistical power loss.20
The discovery analyses were considered significant if they reached a Bonferroni-corrected P value threshold of .0125 (≈ .05/4), which accounts for the analysis of R145C in 3 APOE strata (ε2/ε3, ε3/ε3, and ε3/ε4) and R150H in ε2/ε3. R150H was also seen in ε2/ε4 but in only 3 carriers, so this stratum was not considered for analysis (Figure 1). There were no R150H carriers in the ε2/ε2 stratum. Only the R145C ε3/ε4-stratified analyses were significant in the discovery; thus, replications were considered significant at P < .05 with a concordant direction. Prior studies7,8,9 have shown that R145C is always co-inherited with ε3 (eTable 9 in Supplement 1), while R150H is always co-inherited with ε2.7 Thus, to assess the association of R145C independently of ε2 and ε4, we performed stratified analyses on the 3 main APOE genotypes that include R145C carriers: ε2/ε3, ε3/ε3, and ε3/ε4, and similarly for R150H carriers in ε2/ε3. By inclusion criteria, all participants had no missing data, ie, they had both AD diagnosis (case or control) and genotype information available. As described in eAppendix 2 in Supplement 1, stage 1 included ADSP whole-exome sequencing individuals with lower confidence in their APOE and R145C genotypes; thus, we also performed sensitivity analyses restricted to ADSP whole-exome sequencing individuals who had direct calls at all APOE variants. Main analyses were meta-analyses of stages 1 and 2 results performed using a fixed-effect inverse variance–weighted design implemented in the R “metafor” package, version 3.8.31 Additionally, to account for the related individuals across stages 1 and 2, we reran these analyses using a mega-analysis design, merging the stage 1 discovery and stage 2 replication samples, as opposed to analyzing these separately and meta-analyzing their results. Linear mixed models (that account for relatedness) to test the association with AD diagnosis and age at AD onset were also used in this mega-analysis.
To compare our study with a previous genome-wide association study in African-ancestry individuals,15 we tested the R145C association with AD diagnosis using a standard linear mixed-model regression analysis, adjusting for ε2 and ε4 dosages, considering all individuals in Table 2. Given our main finding, with the R145C association restricted to APOE ε3/ε4 carriers, we also tested for an R145C ε4 interaction in this standard model.
In the MVP (stage 3), solely the replication of R145C association with case-control status and age at AD onset in ε3/ε4-stratified analyses were tested. These analyses were adjusted for sex, 3 principal components accounting for population stratification, and age at last examination, since the MVP is a population-based data set.20
To help place the findings in a clinical context, an odds ratio (OR) was estimated in comparison with the ε3/ε3 reference group (ie, the OR of individuals with ε3/ε3 is 1). Thus, we estimated the OR per APOE genotype group, using individuals with ε3/ε3, noncarriers of R145C, as the reference group. In that case, we used the same analytical approach as the primary analysis described above except that the genotype was encoded as follows: 0 for ε3/ε3 and 1 for the non-ε3/ε3 group being compared (for example, individuals with ε3[R145C]/ε4 vs individuals with ε3/ε3).
Mixed-effects regression models were used to investigate the association of R145C, and its interaction with APOE ε4, on longitudinal change in the CDR-SB score. Models included intercept and age grouped by participant as random effects, which allow individual participants’ baseline levels and slopes to vary randomly around the mean intercept and slope defined by the fixed-effects model. Models included fixed effects of age at baseline, CDR-SB score at baseline, age at each time point, sex, years of education, and interaction of R145C with age in the stratified ε3/ε4 analysis. In the nonstratified model, we additionally included fixed effects of ε2 and ε4 dosages, ε4 interaction with age, ε4 interaction with R145C, and combined interaction of all 3: R145C, ε4, and age. Mixed-effects regression was implemented with the “lmer” function in the R “lme4” package, version 1.1.32
APOE Haplotype Local Ancestry Estimation
Local ancestry estimation procedure is described in eAppendix 2 in Supplement 1. In sensitivity analyses, we reanalyzed the discovery sample data solely including individuals with African local ancestry at both APOE haplotypes.
Functional Assays
ApoE3 and apoE3-R145C production and purification and heparin-binding affinity assessment are described in eAppendix 2 in Supplement 1. These analyses were performed to assess the differential heparin-binding affinity between apoE3 and apoE3-R145C, since heparan sulfate proteoglycans have been shown to regulate cellular uptake of tau.33
Results
The stage 1 discovery included 2888 AD cases (median age, 77 [IQR, 71-83] years; range, 50-96 years) and 4957 cognitively healthy controls (median age, 77 [IQR, 71-83] years; range, 50-106 years), with 2291 males (29.2%) and 5554 females (70.8%). The stage 2 internal replication included 1201 AD cases (median age, 75 [IQR, 69-81] years; range, 50-102 years) and 2744 controls (median age, 80 [IQR, 75-84] years; range, 50-111 years) with 1232 males (31.2%) and 2713 females (68.8%) not duplicated in stage 1 (Table 2; eTable 8 in Supplement 1). The stage 3 population-based external validation included 733 AD cases (median age, 79.4 [IQR, 73.8-86.5] years; range, 62.0-99.7 years) and 19 406 controls (median age, 71.9 [IQR, 68.4-75.8] years; range, 65-104.2 years) with 19 042 males (94.6%) and 1096 females (5.4%). The R150H variant (rs376170967-A) was relatively rare in the data, seen in only 14 ε2/ε3 carriers, 4 cases (1.8%) and 10 controls (1.4%), and was not significantly associated with AD risk in the primary analysis (OR, 1.08; 95% CI, 0.33-3.55; P = .90). As such, it was not investigated further.
In the stage 1 discovery focused on individuals with ε3/ε4, the R145C variant (rs769455-T) was present in 52 cases (4.8%) and 19 controls (1.5%) and was associated with an increased risk of AD compared with individuals with ε3/ε4 lacking the R145C variant (OR, 3.01; 95% CI, 1.87-4.8; P = 6.0 × 10⁻⁶) (Table 3). This association was significant in the stage 2 internal replication (R145C was present in 23 cases [4.7%] and 21 controls [2.7%]; OR, 2.20; 95% CI, 1.04-4.65; P = .04), and concordant in the stage 3 external replication (R145C was present in 11 cases [3.8%] and 149 controls [2.7%]; OR, 1.90; 95% CI, 0.99-3.64; P = .051). Among patients with ε3/ε4 and AD, those carrying the R145C variant also had a younger age at AD onset than noncarriers (eFigure 5 in Supplement 1) in stage 1 (β, −5.87 years; 95% CI, −8.35 to −3.4; P = 3.4 × 10⁻⁶) and in both stage 2 (β, −5.23 years; 95% CI, −9.58 to −0.87; P = .02) and stage 3 (β, −10.15 years; 95% CI, −15.66 to −4.64; P = 4.0 × 10⁻⁴). The R145C variant was not significantly associated with AD risk in individuals with the ε2/ε3 or ε3/ε3 genotype (Table 3; eFigure 6 in Supplement 1).
Table 3. R145C Association With Alzheimer Disease Risk and Age at Onseta.
| Study stage | Regression analysis | |||||||
|---|---|---|---|---|---|---|---|---|
| Case-control | Age at onset | |||||||
| No. of individuals | Minor allele count | Odds ratio (95% CI) | P value | No. of individuals | Minor allele count | β (95% CI)b | P value | |
| APOE ε2/ε3 genotype | ||||||||
| Discovery (stage 1)c,d | 934 | 22 | 0.73 (0.26-2.04) | .55 | 222 | 4 | −6.96 (−15.56 to 1.64) | .11 |
| Replication (stage 2)c,d | 453 | 12 | 0.78 (0.11-5.35) | .80 | 53 | 1 | −18.42 (−39.23 to 2.38) | .08 |
| Meta-analysis (stages 1 and 2) | 1387 | 34 | 0.74 (0.3-1.84) | .52 | 275 | 5 | −8.63 (−16.58 to −0.69) | .03 |
| APOE ε3/ε3 genotype | ||||||||
| Discovery (stage 1)c,d | 3767 | 196 | 1.06 (0.78-1.46) | .71 | 1108 | 58 | −1.68 (−3.87 to 0.5) | .13 |
| Replication (stage 2)c,d | 1748 | 100 | 0.85 (0.48-1.53) | .60 | 347 | 8 | −1.36 (−8.29 to 5.58) | .70 |
| Meta-analysis (stages 1 and 2) | 5515 | 296 | 1.01 (0.77-1.34) | .94 | 1455 | 66 | −1.65 (−3.74 to 0.43) | .12 |
| APOE ε3/ε4 genotype | ||||||||
| Discovery (stage 1)c,d | 2381 | 71 | 3.01 (1.87-4.85) | 6.0 × 10⁻⁶ | 1063 | 51 | −5.87 (−8.35 to −3.4) | 3.4 × 10⁻⁶ |
| Replication (stage 2)c,d | 1277 | 44 | 2.20 (1.04-4.65) | .04 | 421 | 21 | −5.23 (−9.58 to −0.87) | .02 |
| Meta-analysis (stages 1 and 2) | 3658 | 115 | 2.75 (1.84-4.11) | 8.3 × 10⁻⁷ | 1484 | 72 | −5.72 (−7.87 to −3.56) | 2.0 × 10⁻⁷ |
| MVP replication (stage 3)c,e | 5703 | 160 | 1.90 (0.99-3.64) | .051 | 289 | 11 | −10.15 (−15.66 to −4.64) | 4.0 × 10⁻⁴ |
Because R145C is in phase with APOE ε3, stratified analyses were limited to ε2/ε3, ε3/ε3, and ε3/ε4 genotypes. The discovery sample is composed of next-generation sequencing data, while the replication sample included imputed microarray data. Individuals with ε3[R145C]/ε4 have significantly higher Alzheimer disease risk, younger onset, and higher risk of conversion from healthy aging to Alzheimer disease than individuals with ε3/ε4.
The β is the parameter estimate in the regression.
Adjusted for sex and 3 genetic principal components.
Stage 1 and stage 2 analyses were additionally covaried by a sparse genetic relationship matrix.
Stage 3 case-control primary analysis was additionally covaried by age at last visit in the electronic health record of the Million Veteran Program.
Results of sensitivity analyses evaluating different African-ancestry cutoffs are shown in eTable 10 in Supplement 1. Briefly, the results remained unchanged when selecting admixed-ancestry individuals with at least 45% African ancestry or when restricting the analysis to African-ancestry individuals (75% cutoff). The point estimates for the OR increased with the African-ancestry cutoff. For example, using an ancestry cutoff at 75% in the stage 1 discovery yielded an OR of 3.40 (95% CI, 1.95-5.90; P = 1.50 × 10⁻⁵), compared with an OR of 3.01 using a cutoff of 15%. The results remained statistically significant independent of this cutoff. Additionally, restricting our ε3/ε4-stratified analyses to individuals with African local ancestry at both APOE haplotypes led to similar point estimates (OR, 3.10; 95% CI, 1.68-5.70; P = 2.80 × 10⁻⁴) with larger P values, compared with the unrestricted discovery sample, due to reduced sample sizes (eTable 11 in Supplement 1). Results in the mega-analysis of stages 1 and 2 were similar compared with the meta-analysis design, and in the ε3/ε4 group, the association with AD risk reached genome-wide significance (R145C was present in 75 cases [4.7%] and 40 controls [1.9%]; OR, 2.93; 95% CI, 1.99-4.31; P = 4.80 × 10⁻⁸) (eTable 12 in Supplement 1). Sensitivity analyses evaluating the exclusion of ADSP whole-exome sequencing individuals missing direct calls at all variants yielded similar results in terms of the point estimates and statistical significance of the findings (eTable 13 in Supplement 1).
To compare the current study with earlier genome-wide association studies, we conducted a standard (nonstratified) mixed-model regression analysis, adjusting for ε2 and ε4 dosages. In the non–APOE-stratified analysis of stages 1 and 2, R145C was present in 151 cases (3.69%) and 283 controls (3.67%). Given the specificity of the main association in participants with the APOE ε3/ε4 genotype, the OR of AD among those with the R145C variant was smaller than in the ε3/ε4-stratified analysis (OR, 1.36; 95% CI, 1.08-1.69; P = .0075) (eTable 14 in Supplement 1). This association was concordant in the MVP (OR, 1.49; 95% CI, 0.96-2.29; P = .066), with 30 cases (4.09%) and 703 controls (3.64%) carrying R145C. We formally tested this interaction and found a significant association (OR, 2.66; 95% CI, 1.68-4.23; P = 3.4 × 10⁻⁵) (eTable 15 in Supplement 1) in the meta-analysis of stages 1 and 2, supporting the main finding of R145C being significantly associated with increased risk only in individuals with APOE ε3/ε4. This interaction was not significant in stage 3 external validation (P = .98) (eTable 15 in Supplement 1).
When compared with the ε3/ε3 reference group, the 95% CI around the OR estimate for AD among individuals with ε3/ε4 carrying the R145C missense variant overlapped with the OR estimate among individuals homozygous for ε4/ε4 in both the discovery (Figure 2A) and replication (Figure 2B) data sets (eTable 16 in Supplement 1). Sensitivity analyses using the 45% and 75% ancestry cutoffs led to the same conclusion (eFigure 7 in Supplement 1), suggesting that the significance of the results is independent of the African-ancestry cutoffs and not due to population stratification.
Figure 2. Risk of Alzheimer Disease by APOE Genotype Including APOE ε3[R145C] Subtypes.

Alzheimer disease risk by APOE genotype compared with the ε3/ε3 reference group (ie, odds ratio for ε3/ε3 = 1) in (A) the stage 1 discovery composed of next-generation sequencing data from the Alzheimer Disease Sequencing Project data set and in (B) the stage 2 internal replication composed of imputed microarray data. Whiskers indicate 95% CIs. Orange data markers indicate the APOE genotype corresponding to the main novel result. See eTable 16 in Supplement 1 for underlying data.
In the ε3/ε4-stratified analysis of the association of R145C with longitudinal change in the CDR-SB score, 535 participants were considered, with a mean of 4.7 time points (range, 1-15; 2500 total); R145C was significantly associated with worsening CDR-SB scores over time (β, 0.19 increase in CDR-SB score per year; 95% CI, 0.09-0.29; P = 1.1 × 10⁻⁴) (eTable 17 in Supplement 1). Similarly, in the nonstratified analysis, 1563 participants were considered, with a mean of 5.1 time points (range, 1-16; 7927 total); R145C interaction with ε4 was significantly associated with worsening CDR-SB scores over time (β, 0.17 increase in CDR-SB score per year; 95% CI, 0.08-0.25; P = 1.2 × 10⁻⁴) (eTable 18 in Supplement 1).
As an initial step toward functional validation of the variant, we examined the relative heparin-binding affinities of apoE3-R145C and apoE3 produced by human embryonic kidney cells using heparin affinity chromatography. ApoE3-R145C was eluted from the column at a significantly lower concentration of sodium chloride than apoE3 (0.36 M NaCl vs 0.49 M NaCl; n = 3 repeats; paired t test: P = .026) (eFigure 8 in Supplement 1).
Discussion
In this exploratory analysis, the APOE ε3[R145C] missense variant was associated with increased AD risk in African-ancestry individuals with the ε3/ε4 genotype. The main result was supported by secondary analyses demonstrating that among individuals with the ε3/ε4 genotype, the APOE ε3[R145C] variant was associated with an earlier age at AD onset and more rapid decline on a commonly used cognitive measure. The findings persisted in sensitivity analyses examining different degrees of African ancestry and when restricting the analysis to individuals with African local ancestry at the APOE locus, suggesting that these findings were not confounded by differences in local ancestry and that R145C is the causal variant.
In a non–APOE-stratified analysis, the association of R145C with increased AD risk was weaker, while nominally significant, and it was driven by the association in the ε3/ε4 subgroup. Of note, Kunkle et al15 reported a similar OR in their nonstratified analysis (OR, 1.38; 95% CI, 0.98-1.94; P = .056) conducted on a slightly smaller subset of samples than used here. Kunkle et al15 did not, however, test the interaction of R145C with ε4 for association with AD status.
The R145C variant is found in roughly 4% of African American individuals, and the subset of African American individuals with the ε3/ε4 genotype and this variant is about 1% (eTable 9 in Supplement 1). As clinical trials begin to be stratified by APOE genotype34 or designed to target ε4 carriers exclusively, it will be important to weigh the substantial increase in risk associated with compound heterozygous ε3[R145C] and ε4 status. Similarly, in the age of direct-to-consumer genetic testing in which, increasingly, patients approach physicians with their APOE genotype in hand, clinicians will need to understand AD risk according to specific ancestral backgrounds in order to provide optimized counseling.
The increased risk of AD associated with R145C was observed only on an ε3/ε4 background. Although the risk among individuals with ε3[R145C]/ε4 appeared similar to that of ε4/ε4 carriers (Figure 2), there was no signal of increased risk with R145C among individuals with ε3/ε3. This result suggests a compound heterozygous effect in individuals with ε3[R145C]/ε4. Although the sample size was too small to draw conclusions about an association in individuals with ε3[R145C]/ε3[R145C] (eTable 9 in Supplement 1), the age at AD onset was reduced in this group (eFigure 5 in Supplement 1). The fact that this variant is associated with increased risk when paired with ε4 on the other chromosome has mechanistic implications. This suggests that apoE3-R145C does not lead to a gain of deleterious function since it does not increase AD risk in the absence of ε4. It hints, instead, at apoE3-R145C lacking a biochemical property of apoE3 that normally mitigates the increased AD risk due to apoE4.
The potential mechanisms driving this compound heterozygous effect are myriad. The primary function of apoE is to deliver lipids to different cells via interaction with metabolic lipoprotein receptors such as the low-density lipoprotein receptor (LDLR) and LDLR-related protein 1 (LRP1). The pathogenicity of APOE variants may relate to their differential binding to these lipoprotein receptors, which are thought to help glial cells engulf and degrade pathogenic proteins like amyloid and tau. ApoE also binds to signaling receptors expressed on neurons such as the very low density lipoprotein receptor (VLDLR) and apoE receptor 2.35 Binding of apoE to these receptors can affect synaptic function-related signaling and tau phosphorylation. A third class of protein that apoE also binds to is the heparan sulfate proteoglycans, cell-surface receptors that can shuttle β-amyloid toward LRP1 for subsequent destruction by glial cells or transport across the blood-brain barrier.
The R145C variant is located within apoE’s receptor-binding region at amino acid residues 136 to 150 in the N-terminal domain. Compared with apoE3, apoE3-R145C has been shown to have reduced binding affinity to all 3 classes of protein-binding partners described above. Other groups have demonstrated R145C’s reduced binding to LDLR (Figure 1 in the study by Rall et al 8) and VLDLR (Figure 7 in the study by Ruiz et al36). The present study used human cells to produce apoE in order to replicate a prior finding (that used rat cells to produce apoE), showing that apoE3-R145C binds less avidly to heparan sulfate proteoglycans (eFigure 8 in Supplement 1). While there are other possible mechanisms—R145C could, for example, affect apoE’s capacity to dimerize37,38—the reduced binding affinity of R145C across the 3 different classes of apoE receptors may relate to its AD pathogenicity.
Limitations
This study has several limitations. First, the lack of definitive functional validation stands as the main limitation of this study. More detailed mechanistic studies using AD-relevant cell types are needed to understand the role of R145C in AD pathogenesis. However, while further functional assays testing the hypotheses proposed above are needed, this study’s main finding is supported by 2 independent replications and concordant secondary analyses. Second, another question that remains unanswered is the effect of the rare ε3[R145C]/ε3[R145C] genotype on AD risk, which will require larger sample sizes to be addressed. Third, R145C is known to increase risk for type 3 hyperlipidemia,7,8,9,39 which could lead to a greater degree of vascular pathology and should be evaluated in future studies.
Conclusions
In this exploratory analysis, the APOE ε3[R145C] missense variant was associated with an increased risk of AD among individuals of African ancestry with the ε3/ε4 genotype. With additional external validation, the findings may inform AD genetic risk assessment in individuals of African ancestry.
eAppendix 1. ADSP Cohort Descriptions
eAppendix 2. Supplemental Methods
eAppendix 3. Additional Acknowledgments
eFigure 1. Local Ancestry Inference at rs769455 in Admixed American Participants in gnomAD
eFigure 2. Flowchart Describing the APOE Alleles and R145C Genotyping Among African and Admixed-African Individuals Included in the Discovery Analysis
eFigure 3. Principal Ancestry Components Computed on the Merge of the ADSP (Discovery) African Ancestry Participants and African Participants in 1000 Genomes Project and Human Genome Diversity Project
eFigure 4. Principal Ancestry Components Computed on the Merge of the ADGC (Replication) African Ancestry Participants and African Participants in 1000 Genomes Project and Human Genome Diversity Project
eFigure 5. Age-at-AD-Onset Distribution Across APOE Genotype Groups in the ADSP Discovery and ADGC Replication in Function of R145C Allele
eFigure 6. R145C Association With Alzheimer Disease Risk and Age-at-AD-Onset
eFigure 7. APOE ε3[R145C]/ε4 Individuals Have an Alzheimer Disease Risk Comparable to APOE ε4/ε4 Individuals Regardless of the African Ancestry Cutoff
eFigure 8. ApoE3-R145C Shows Significantly Reduced Heparin Binding Compared to apoE3
eTable 1. Missense Mutations on APOE Canonical Transcript
eTable 2. Cohorts Overview
eTable 3. Overview of Alzheimer’s Disease Sequencing Project Studies
eTable 4. Pathogenic Variants Identified on APP, PSEN1, PSEN2, MAPT in ADSP WES and WGS
eTable 5. Demographics of All the Queried Cohorts
eTable 6. R145C Per Cohort, Diagnosis and APOE Genotypes
eTable 7. APOE Variants Genotype Call in the Data Released by NIAGADS
eTable 8. Demographics Per Cohort After Ancestry Selection, Quality Control and Duplicates Removal
eTable 9. APOE R145C (rs769455) Allelic Breakdown by APOE Genotype
eTable 10. African Ancestry Cutoff Sensitivity Analyses
eTable 11. African Ancestry Cutoff Sensitivity Analyses Restricted to Individuals With African Local Ancestry at Both of Their APOE Haplotypes
eTable 12. Mega-analysis of the Discovery and Replication Samples
eTable 13. African Ancestry Cutoff Sensitivity Analyses Only Including Individuals Directly Genotyped in the ADSP WES Data Distributed by NIAGADS
eTable 14. Primary and Secondary Analyses Considering Standard Model (Non-stratified by APOE Genotype) and Adjusting for ε2 and ε4 Dosages
eTable 15. Interaction Between R145C*ε4 for Association With Alzheimer Disease Risk, Considering Standard Model (Non-stratified by APOE Genotype) and Adjusting for ε2 and ε4 Dosages
eTable 16. Risk of Alzheimer Disease by APOE Genotype Including APOE ε3[R145C] Subtypes
eTable 17. Association of R145C With CDR-SOB Changes With Age in ε3/ε4 Stratified Analysis
eTable 18. Association of R145C*ε4 With CDR-SOB Changes With Age in Unstratified Analysis
eReferences
Data Sharing Statement
References
- 1.Corder EH, Saunders AM, Strittmatter WJ, et al. Gene dose of apolipoprotein E type 4 allele and the risk of Alzheimer’s disease in late onset families. Science. 1993;261(5123):921-923. doi: 10.1126/science.8346443 [DOI] [PubMed] [Google Scholar]
- 2.Corder EH, Saunders AM, Risch NJ, et al. Protective effect of apolipoprotein E type 2 allele for late onset Alzheimer disease. Nat Genet. 1994;7(2):180-184. doi: 10.1038/ng0694-180 [DOI] [PubMed] [Google Scholar]
- 3.Farrer LA, Cupples LA, Haines JL, et al. ; APOE and Alzheimer Disease Meta Analysis Consortium . Effects of age, sex, and ethnicity on the association between apolipoprotein E genotype and Alzheimer disease: a meta-analysis. JAMA. 1997;278(16):1349-1356. doi: 10.1001/jama.1997.03550160069041 [DOI] [PubMed] [Google Scholar]
- 4.Medway CW, Abdul-Hay S, Mims T, et al. ApoE variant p.V236E is associated with markedly reduced risk of Alzheimer’s disease. Mol Neurodegener. 2014;9(1):11. doi: 10.1186/1750-1326-9-11 [DOI] [PMC free article] [PubMed] [Google Scholar]
- 5.Le Guen Y, Belloy ME, Grenier-Boley B, et al. ; EADB, GR@ACE, DEGESCO, DemGene, GERAD, and EADI Groups . Association of rare APOE missense variants V236E and R251G with risk of Alzheimer disease. JAMA Neurol. 2022;79(7):652-663. doi: 10.1001/jamaneurol.2022.1166 [DOI] [PMC free article] [PubMed] [Google Scholar]
- 6.Arboleda-Velasquez JF, Lopera F, O’Hare M, et al. Resistance to autosomal dominant Alzheimer’s disease in an APOE3 Christchurch homozygote: a case report. Nat Med. 2019;25(11):1680-1683. doi: 10.1038/s41591-019-0611-3 [DOI] [PMC free article] [PubMed] [Google Scholar]
- 7.Abou Ziki MD, Strulovici-Barel Y, Hackett NR, et al. Prevalence of the apolipoprotein E Arg145Cys dyslipidemia at-risk polymorphism in African-derived populations. Am J Cardiol. 2014;113(2):302-308. doi: 10.1016/j.amjcard.2013.09.021 [DOI] [PMC free article] [PubMed] [Google Scholar]
- 8.Rall SC Jr, Weisgraber KH, Innerarity TL, Mahley RW. Structural basis for receptor binding heterogeneity of apolipoprotein E from type III hyperlipoproteinemic subjects. Proc Natl Acad Sci U S A. 1982;79(15):4696-4700. doi: 10.1073/pnas.79.15.4696 [DOI] [PMC free article] [PubMed] [Google Scholar]
- 9.de Villiers WJ, van der Westhuyzen DR, Coetzee GA, Henderson HE, Marais AD. The apolipoprotein E2 (Arg145Cys) mutation causes autosomal dominant type III hyperlipoproteinemia with incomplete penetrance. Arterioscler Thromb Vasc Biol. 1997;17(5):865-872. doi: 10.1161/01.ATV.17.5.865 [DOI] [PubMed] [Google Scholar]
- 10.Karczewski KJ, Francioli LC, Tiao G, et al. ; Genome Aggregation Database Consortium . The mutational constraint spectrum quantified from variation in 141,456 humans. Nature. 2020;581(7809):434-443. doi: 10.1038/s41586-020-2308-7 [DOI] [PMC free article] [PubMed] [Google Scholar]
- 11.Beecham GW, Bis JC, Martin ER, et al. The Alzheimer’s Disease Sequencing Project: study design and sample selection. Neurol Genet. 2017;3(5):e194. doi: 10.1212/NXG.0000000000000194 [DOI] [PMC free article] [PubMed] [Google Scholar]
- 12.Weiner MW, Aisen PS, Jack CR Jr, et al. ; Alzheimer’s Disease Neuroimaging Initiative . The Alzheimer’s disease Neuroimaging Initiative: progress report and future plans. Alzheimers Dement. 2010;6(3):202-211. doi: 10.1016/j.jalz.2010.03.007 [DOI] [PMC free article] [PubMed] [Google Scholar]
- 13.Bennett DA, Schneider JA, Buchman AS, Barnes LL, Boyle PA, Wilson RS. Overview and findings from the Rush Memory and Aging Project. Curr Alzheimer Res. 2012;9(6):646-663. doi: 10.2174/156720512801322663 [DOI] [PMC free article] [PubMed] [Google Scholar]
- 14.Kunkle BW, Grenier-Boley B, Sims R, et al. ; Alzheimer Disease Genetics Consortium; European Alzheimer’s Disease Initiative; Cohorts for Heart and Aging Research in Genomic Epidemiology Consortium; Genetic and Environmental Risk in AD/Defining Genetic, Polygenic and Environmental Risk for Alzheimer’s Disease Consortium . Genetic meta-analysis of diagnosed Alzheimer’s disease identifies new risk loci and implicates Aβ, tau, immunity and lipid processing. Nat Genet. 2019;51(3):414-430. doi: 10.1038/s41588-019-0358-2 [DOI] [PMC free article] [PubMed] [Google Scholar]
- 15.Kunkle BW, Schmidt M, Klein HU, et al. ; Writing Group for the Alzheimer’s Disease Genetics Consortium . Novel Alzheimer disease risk loci and pathways in African American individuals using the African Genome Resources Panel: a meta-analysis. JAMA Neurol. 2021;78(1):102-113. doi: 10.1001/jamaneurol.2020.3536 [DOI] [PMC free article] [PubMed] [Google Scholar]
- 16.Gaziano JM, Concato J, Brophy M, et al. Million Veteran Program: a mega-biobank to study genetic influences on health and disease. J Clin Epidemiol. 2016;70:214-223. doi: 10.1016/j.jclinepi.2015.09.016 [DOI] [PubMed] [Google Scholar]
- 17.Sherva R, Zhang R, Sahelijo N, et al. African ancestry GWAS of dementia in a large military cohort identifies significant risk loci. Published online December 22, 2022. doi: 10.1038/s41380-022-01890-3 [DOI] [PMC free article] [PubMed] [Google Scholar]
- 18.Chen CY, Pollack S, Hunter DJ, Hirschhorn JN, Kraft P, Price AL. Improved ancestry inference using weights from external reference panels. Bioinformatics. 2013;29(11):1399-1406. doi: 10.1093/bioinformatics/btt144 [DOI] [PMC free article] [PubMed] [Google Scholar]
- 19.Auton A, Brooks LD, Durbin RM, et al. ; 1000 Genomes Project Consortium . A global reference for human genetic variation. Nature. 2015;526(7571):68-74. doi: 10.1038/nature15393 [DOI] [PMC free article] [PubMed] [Google Scholar]
- 20.Le Guen Y, Belloy ME, Napolioni V, et al. ; Alzheimer’s Disease Neuroimaging Initiative . A novel age-informed approach for genetic association analysis in Alzheimer’s disease. Alzheimers Res Ther. 2021;13(1):72. doi: 10.1186/s13195-021-00808-5 [DOI] [PMC free article] [PubMed] [Google Scholar]
- 21.Le Guen Y, Napolioni V, Belloy ME, et al. Common X-chromosome variants are associated with Parkinson disease risk. Ann Neurol. 2021;90(1):22-34. doi: 10.1002/ana.26051 [DOI] [PMC free article] [PubMed] [Google Scholar]
- 22.Fang H, Hui Q, Lynch J, et al. ; VA Million Veteran Program . Harmonizing genetic ancestry and self-identified race/ethnicity in genome-wide association studies. Am J Hum Genet. 2019;105(4):763-772. doi: 10.1016/j.ajhg.2019.08.012 [DOI] [PMC free article] [PubMed] [Google Scholar]
- 23.Taliun D, Harris DN, Kessler MD, et al. ; NHLBI Trans-Omics for Precision Medicine (TOPMed) Consortium . Sequencing of 53,831 diverse genomes from the NHLBI TOPMed Program. Nature. 2021;590(7845):290-299. doi: 10.1038/s41586-021-03205-y [DOI] [PMC free article] [PubMed] [Google Scholar]
- 24.Andrews JS, Desai U, Kirson NY, Zichlin ML, Ball DE, Matthews BR. Disease severity and minimal clinically important differences in clinical outcome assessments for Alzheimer’s disease clinical trials. Alzheimers Dement (N Y). 2019;5:354-363. doi: 10.1016/j.trci.2019.06.005 [DOI] [PMC free article] [PubMed] [Google Scholar]
- 25.Wessels AM, Rentz DM, Case M, Lauzon S, Sims JR. Integrated Alzheimer’s Disease Rating Scale: clinically meaningful change estimates. Alzheimers Dement (N Y). 2022;8(1):e12312. doi: 10.1002/trc2.12312 [DOI] [PMC free article] [PubMed] [Google Scholar]
- 26.Jun G, Ibrahim-Verbaas CA, Vronskaya M, et al. ; IGAP Consortium . A novel Alzheimer disease locus located near the gene encoding tau protein. Mol Psychiatry. 2016;21(1):108-117. doi: 10.1038/mp.2015.23 [DOI] [PMC free article] [PubMed] [Google Scholar]
- 27.Blumenthal DB, Baumbach J, Hoffmann M, Kacprowski T, List M. A framework for modeling epistatic interaction. Bioinformatics. 2021;37(12):1708-1716. doi: 10.1093/bioinformatics/btaa990 [DOI] [PubMed] [Google Scholar]
- 28.Gogarten SM, Sofer T, Chen H, et al. Genetic association testing using the GENESIS R/Bioconductor package. Bioinformatics. 2019;35(24):5346-5348. doi: 10.1093/bioinformatics/btz567 [DOI] [PMC free article] [PubMed] [Google Scholar]
- 29.Conomos MP, Miller MB, Thornton TA. Robust inference of population structure for ancestry prediction and correction of stratification in the presence of relatedness. Genet Epidemiol. 2015;39(4):276-293. doi: 10.1002/gepi.21896 [DOI] [PMC free article] [PubMed] [Google Scholar]
- 30.Conomos MP, Laurie CA, Stilp AM, et al. Genetic diversity and association studies in US Hispanic/Latino populations: applications in the Hispanic Community Health Study/Study of Latinos. Am J Hum Genet. 2016;98(1):165-184. doi: 10.1016/j.ajhg.2015.12.001 [DOI] [PMC free article] [PubMed] [Google Scholar]
- 31.Viechtbauer W. Conducting meta-analyses in R with the metafor package. J Stat Softw. 2010;36(3):1-48. doi: 10.18637/jss.v036.i0320808728 [DOI] [Google Scholar]
- 32.Bates D, Mächler M, Bolker B, Walker S. Fitting linear mixed-effects models using lme4. J Stat Softw. 2015;67:1-48. doi: 10.18637/jss.v067.i01 [DOI] [Google Scholar]
- 33.Rauch JN, Chen JJ, Sorum AW, et al. Tau internalization is regulated by 6-O sulfation on heparan sulfate proteoglycans (HSPGs). Sci Rep. 2018;8(1):6382. doi: 10.1038/s41598-018-24904-z [DOI] [PMC free article] [PubMed] [Google Scholar]
- 34.Lopez Lopez C, Tariot PN, Caputo A, et al. The Alzheimer’s Prevention Initiative Generation Program: study design of two randomized controlled trials for individuals at risk for clinical onset of Alzheimer’s disease. Alzheimers Dement (N Y). 2019;5:216-227. doi: 10.1016/j.trci.2019.02.005 [DOI] [PMC free article] [PubMed] [Google Scholar]
- 35.Holtzman DM, Herz J, Bu G. Apolipoprotein E and apolipoprotein E receptors: normal biology and roles in Alzheimer disease. Cold Spring Harb Perspect Med. 2012;2(3):a006312. doi: 10.1101/cshperspect.a006312 [DOI] [PMC free article] [PubMed] [Google Scholar]
- 36.Ruiz J, Kouiavskaia D, Migliorini M, et al. The apoE isoform binding properties of the VLDL receptor reveal marked differences from LRP and the LDL receptor. J Lipid Res. 2005;46(8):1721-1731. doi: 10.1194/jlr.M500114-JLR200 [DOI] [PubMed] [Google Scholar]
- 37.Elliott DA, Halliday GM, Garner B. Apolipoprotein-E forms dimers in human frontal cortex and hippocampus. BMC Neurosci. 2010;11:23. doi: 10.1186/1471-2202-11-23 [DOI] [PMC free article] [PubMed] [Google Scholar]
- 38.Minagawa H, Gong JS, Jung CG, et al. Mechanism underlying apolipoprotein E (ApoE) isoform-dependent lipid efflux from neural cells in culture. J Neurosci Res. 2009;87(11):2498-2508. doi: 10.1002/jnr.22073 [DOI] [PMC free article] [PubMed] [Google Scholar]
- 39.Mahley RW, Huang Y, Rall SC Jr. Pathogenesis of type III hyperlipoproteinemia (dysbetalipoproteinemia): questions, quandaries, and paradoxes. J Lipid Res. 1999;40(11):1933-1949. doi: 10.1016/S0022-2275(20)32417-2 [DOI] [PubMed] [Google Scholar]
Associated Data
This section collects any data citations, data availability statements, or supplementary materials included in this article.
Supplementary Materials
eAppendix 1. ADSP Cohort Descriptions
eAppendix 2. Supplemental Methods
eAppendix 3. Additional Acknowledgments
eFigure 1. Local Ancestry Inference at rs769455 in Admixed American Participants in gnomAD
eFigure 2. Flowchart Describing the APOE Alleles and R145C Genotyping Among African and Admixed-African Individuals Included in the Discovery Analysis
eFigure 3. Principal Ancestry Components Computed on the Merge of the ADSP (Discovery) African Ancestry Participants and African Participants in 1000 Genomes Project and Human Genome Diversity Project
eFigure 4. Principal Ancestry Components Computed on the Merge of the ADGC (Replication) African Ancestry Participants and African Participants in 1000 Genomes Project and Human Genome Diversity Project
eFigure 5. Age-at-AD-Onset Distribution Across APOE Genotype Groups in the ADSP Discovery and ADGC Replication in Function of R145C Allele
eFigure 6. R145C Association With Alzheimer Disease Risk and Age-at-AD-Onset
eFigure 7. APOE ε3[R145C]/ε4 Individuals Have an Alzheimer Disease Risk Comparable to APOE ε4/ε4 Individuals Regardless of the African Ancestry Cutoff
eFigure 8. ApoE3-R145C Shows Significantly Reduced Heparin Binding Compared to apoE3
eTable 1. Missense Mutations on APOE Canonical Transcript
eTable 2. Cohorts Overview
eTable 3. Overview of Alzheimer’s Disease Sequencing Project Studies
eTable 4. Pathogenic Variants Identified on APP, PSEN1, PSEN2, MAPT in ADSP WES and WGS
eTable 5. Demographics of All the Queried Cohorts
eTable 6. R145C Per Cohort, Diagnosis and APOE Genotypes
eTable 7. APOE Variants Genotype Call in the Data Released by NIAGADS
eTable 8. Demographics Per Cohort After Ancestry Selection, Quality Control and Duplicates Removal
eTable 9. APOE R145C (rs769455) Allelic Breakdown by APOE Genotype
eTable 10. African Ancestry Cutoff Sensitivity Analyses
eTable 11. African Ancestry Cutoff Sensitivity Analyses Restricted to Individuals With African Local Ancestry at Both of Their APOE Haplotypes
eTable 12. Mega-analysis of the Discovery and Replication Samples
eTable 13. African Ancestry Cutoff Sensitivity Analyses Only Including Individuals Directly Genotyped in the ADSP WES Data Distributed by NIAGADS
eTable 14. Primary and Secondary Analyses Considering Standard Model (Non-stratified by APOE Genotype) and Adjusting for ε2 and ε4 Dosages
eTable 15. Interaction Between R145C*ε4 for Association With Alzheimer Disease Risk, Considering Standard Model (Non-stratified by APOE Genotype) and Adjusting for ε2 and ε4 Dosages
eTable 16. Risk of Alzheimer Disease by APOE Genotype Including APOE ε3[R145C] Subtypes
eTable 17. Association of R145C With CDR-SOB Changes With Age in ε3/ε4 Stratified Analysis
eTable 18. Association of R145C*ε4 With CDR-SOB Changes With Age in Unstratified Analysis
eReferences
Data Sharing Statement