

Abstract
Fragility of trabecular bone (Tb) microstructure is increased in osteoporosis, which is associated with rapid bone loss and enhanced fracture-risk. Accurate assessment of Tb strength using in vivo imaging available in clinical settings will be significant for management of osteoporosis and understanding its pathogenesis. Emerging CT technology, featured with high image resolution, fast scan-speed, and wide clinical access, is a promising alternative for in vivo Tb imaging. However, variation in image resolution among different CT scanners pose a major hurdle in CT-based bone studies. This paper presents nonlinear continuum finite element (FE) methods for computation of Tb strength from in vivo CT imaging and evaluates their generalizability between two scanners with different image resolution. Continuum FE-based measures of Tb strength under different loading conditions were found to be highly reproducible (ICC ≥ 0.93) using ankle images of twenty healthy volunteers acquired on low- and high-resolution CT scanners 44.6 ± 2.7 days apart. FE stress propagation was mostly confined to Tb micro-network (2.3 ± 1.7 MPa) with nominal leakages over the marrow space (0.4 ± 0.5 MPa) complying with the fundamental principle of mechanics at in vivo imaging. In summary, nonlinear continuum FE-based Tb strength measures are reproducible among different CT scanners and suitable for multi-site longitudinal human studies.
Keywords: osteoporosis, trabecular bone, micro-structure, nonlinear FE modelling, bone strength, multiscanner generalizability
1. Introduction
Osteoporosis is an age-related degenerative bone disease characterized by reduced bone mineral density (BMD) and associated with increased fracture-risk (Watts et al 2010). One in every four men and every two women suffers at least one osteoporotic fragility fracture in their lifetime (National Osteoporosis Foundation 2017). Dual-energy x-ray absorptiometry (DXA)-measured areal BMD is clinically used to detect osteoporosis (Seeman and Delmas 2006). However, BMD explains only 60%–70% of the bone’s mechanical competence (Wehrli et al 2002), and the remainder is contributed by various factors including trabecular bone (Tb) microstructural basis (Parfitt et al 1983, Kleerekoper et al 1985, Legrand et al 2000, Van Ruijven et al 2007, Boutroy et al 2008, Liu et al 2010). Different Tb microstructural measures (Bouxsein et al 2010, Chen et al 2018) have been widely investigated with the overall goal being able to predict Tb strength, fragility, and fracture-risk.
Finite element (FE) analysis (FEA) computationally simulates a mechanical loading condition on a target object, and it has been popularly applied to compute bone strength. FEA has been applied to assess femoral strength using CT (Keyak et al 2005, Keyak et al 2013, Rayudu et al 2020). However, these methods were implemented using significantly larger mesh elements compared to the average human Tb thickness and were primarily aimed at deriving mechanical properties based on bone geometry and macro-distribution of bone density. Early applications of FEA to compute bone microstructural strength were based on micro-CT imaging of Tb bone specimens (Ulrich et al 1998, Chevalier et al 2007, Van Ruijven et al 2007, Rajapakse et al 2010). It has been observed that micro-CT derived FEA measures closely agree with mechanical experimental finding, and, often, micro-CT derived FEA measures are considered as the gold standard. FEA was later adopted for high-resolution (HR) peripheral quantitative computed tomography (HR-pQCT) (MacNeil and Boyd 2007, Nishiyama et al 2013) and magnetic resonance imaging (MRI) (Rajapakse et al 2010, Zhang et al 2013) for in vivo assessment of Tb microstructural strength. Previously reported HR-pQCT and MRI-based FEA methods required segmentation and separation between the marrow space and Tb micro-network.
Recently, emerging whole-body CT scanners have drawn interest as an alternative to HR-pQCT and MRI for in vivo bone micro-imaging at peripheral sites due to their widespread availability in clinical setting, high-resolution, fast scan-speed, and ultra-low radiation (Chen et al 2018). In an ex vivo study, (Bauer et al 2014) computed failure loads of small cadaveric Tb specimens using CT-based FEA, where bone voxels were separated from marrow by thresholding and a constant Young’s modulus was used for bone voxels in an oriented brick mesh model (Guha et al 2022) established a nonlinear continuum FEA method for in vivo ankle CT scans that computes Tb microstructural strength without requiring separation of Tb micro-network from marrow space, while capturing the impacts of micro-distribution of bone mineral on strength. Relaxation of the segmentation of Tb microstructure by Guha et al’s method allows FEA-based study of bone strength at relatively low-resolution (LR) imaging frequently available in routine clinical scans, while accounting for bone micro-distribution at the level of Tb network. A major challenge with CT-based FEA methods emerges due to the wide variation in spatial resolution and other imaging and reconstruction features among different CT scanners along with rapid upgrades in technology causing inconsistency in Tb micro-morphometric measures in multi-site and longitudinal bone studies (Chen et al 2018). Although, the paper by (Guha et al 2022) demonstrated that their method offers reliable measures of Tb microstructural strength at in vivo peripheral CT imaging, variability of their measures derived from muti-scanner CT images with varying spatial resolution has not yet been established. This paper is aimed to examine the multi-scanner variability of Guha et al’s Tb FEA measures in an in vivo study. Specifically, we evaluate the reproducibility of Tb FEA measures derived from in vivo ankle CT scans of human participants on low- and high-resolution clinical CT scanners.
2. Methodology
In this section, we describe the CT-based nonlinear continuum FEA for computing Tb Young’s modulus, as well as the experimental plans to examine the reproducibility of the method.
2.1. Human subjects and in vivo imaging
Twenty healthy volunteers (age (mean±standard deviation (std)): 26.2 ± 4.5 years; 11 males and 9 females) were recruited, and distal tibias of their left legs were scanned on both LR Siemens FLASH and HR Siemens FORCE scanners at an interval of 44.6 ± 2.7 days. This study was approved by The University of Iowa Institutional Review Board (IRB ID # 201505701), and written informed consents were obtained from participants. This study was conducted in accordance with the Declaration of Helsinki.
2.1.1. Siemens FLASH CT imaging
Spiral CT scans were acquired using single x-ray source at 120 kV and 200 effective mAs with 1 sec rotation speed and pitch factor of 1.0. Total effective dose was equivalent to 170 μSv ≈ 20 days of environmental radiation. Vendor-provided special U70u kernel was used to reconstruct CT images at 200 μm slice spacing and 176 μm pixel-size.
2.1.2. Siemens FORCE CT imaging
Spiral CT scans were acquired using single x-ray source at 120 kV and 100 effective mAs with 1 sec rotation speed and pitch factor of 1.0. Total effective dose equivalent was 50 μSv ≈ 5 days of environmental radiation. Vendor-provided special Ur77u kernel with Edge Technology was used to reconstruct CT images at 200 μm slice-spacing and 176 μm pixel-size.
For both scanners, Siemens z-UHR scan mode was applied, enabling Siemens double z-sampling technology achieving high structural resolution. The Siemens FORCE scanner used StellarInfinity detectors with anti-scatter collimator, which improved signal detectability and reduced noise producing similar image quality and signal-to-noise ratio as LR scans at a reduced radiation dose. Therefore, lower radiation dose was used for the Siemens FORCE scanner. A Gammex RMI 467 Tissue Characterization Phantom (Gammex RMI, Middleton, WI) was scanned on LR and HR scanners using the matching CT imaging and reconstruction protocol to calibrate CT Hounsfield numbers (HU) into BMD (mg/cc) values.
2.2. Image pre-processing
Image processing was applied to each CT image to — (1) align the tibial bone axes with the image coordinate axes and extract volume of interest (VOI) and (2) compute the calcium hydroxyapatite (CHA) density (g/cc) using the calibration phantom scan.
2.2.1. Bone alignment and voi selection
The bone alignment and VOI selection process is described in figure 1. First, the tibial bone was segmented from each CT scan using a previously validated algorithm (Li et al 2015). Forty percent in-plane peeling was applied to the tibial bone, and the peeled bone proximal to the 8% tibial site from the reference distal end plateau was used to compute the tibial bone axis; see (a). Subsequently, the tibial bone axis was aligned with the image z-axis (see (b)), while the x-axis was aligned with the tibiofibular direction. Simultaneously, the image was interpolated at 150 μm isotropic voxel resolution using the windowed sync method (Meijering et al 1999). These transformations were combined to reduce the image resolution loss during interpolation. The bone alignment was necessary to align longitudinal trabeculae with the compressive loading direction. An axial VOI was selected in the aligned bone covering 4%–6% tibial length (∼6.75 mm) after 30% peel from the periosteal boundary (see (c)). Tibial bone segmentation and alignment and selection of axial VOI were independently applied to the LR and HR CT scans without registration to assess the generalizability of the entire processing cascade.
Figure 1.
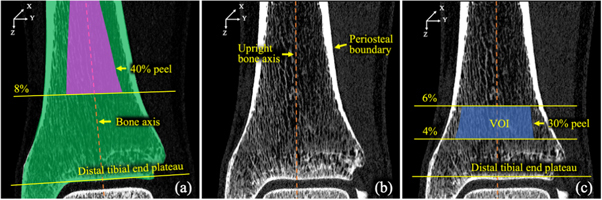
Bone alignment and VOI selection on a distal tibia CT scan for FEA. (a) Segmented tibial bone region (green) on a sagittal image slice and quasi-cylindrical region (magenta) for bone axis computation. (b) A sagittal CT slice after alignment of the tibial bone axis. (c) Selected VOI (blue) for FEA.
2.2.2. CHA and Ash density computation
CT numbers in HU were calibrated into BMD values using CT scans of a calibration phantom; see section 2.1. Next, the BMD value at a voxel was converted to CHA density as follows:
where, (3.18 g cc−1) and (1 g cc−1) are the known densities of CHA and water, respectively. Finally, the CHA density was converted to ash density as follows:
2.3. Nonlinear continuum FE modelling and analysis
Nonlinear FEA was applied to a cubic mesh directly derived from the isotropic voxel grid within the upright quasi-cylindrical VOIs, where each voxel was represented by a cubic mesh element centred at its coordinate location. Each cubic element was represented by eight vertex and twelve edge elements to simulate the voxel geometry. Common edges and vertices of neighbouring mesh elements were used to specify their connectivity. The nonlinear isotropic material properties of each mesh element were derived from the ash-density of the corresponding image voxel.
We use to denote the mesh element corresponding to the image voxel The material behavior of the was modelled using a nonlinear stress-strain relationship (figure 2) similar to (Keyak et al 1996). Elastic modulus (MPa), maximum stress (MPa), and saturation stress (MPa) at were defined from using the equations stated in figure 2. The mixed Swift-Voce isotropic hardening equation (Jang et al 2020) was used to define the stress-strain relationship | in the plastic region as follows:
The parameter values of and were selected to resemble with Keyak et al’s stress-strain relationship. The softening behavior within the plastic phase was simulated using a negative value for For FEA, we used a Poisson’s ratio of 0.3 and imposed boundary conditions to simulate experimental mechanical testing. Specifically, the mesh elements on the bottom surface were fixed in all directions, while a predefined displacement was applied on each mesh node on the top surface. For axial compressive FEA, the displacement was applied along the z-direction, while it was applied along x- (or y-) axis to simulate x- (or y-) shear loading conditions. Movements of top surface nodes along the directions orthogonal to the applied displacement were restricted. Displacements were gradually and uniformly applied in 50 sub-steps to achieve a total strain of 0.1%. After each sub-step, the average von Mises stress (MPa) (Logan 2011) over volume mesh elements on the top surface was computed and the stress-strain value was plotted. Finally, the slope of the linear section of the stress-strain curve was computed to determine the Tb Young’s modulus or simply modulus.
Figure 2.
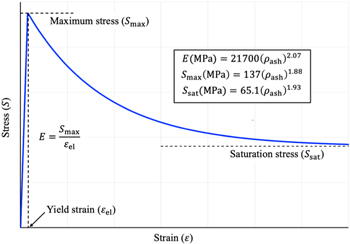
Nonlinear stress-strain relationship used to model bone material properties of voxel mesh elements.
ANSYS (ANSYS Mechanical 2019 R2, Ansys Inc., Southpointe, Pennsylvania, USA) software tool was used to implement our nonlinear FEA algorithm. Cubic mesh elements were modelled using the ANSYS element type: 3-D 8-Node structural solid (SOLID185). ANSYS default values of 0.5% and 5% were used for force and displacement tolerance parameters, respectively. ANSYS NLGEOM mode was adopted, and Newton-Raphson’s method was applied for convergence.
2.4. Experiments and data analysis
Experiments were designed to (1) evaluate the reproducibility of the FEA derived modulus values under different loading conditions; and (2) examine the fundamental principle of structural mechanics at in vivo CT imaging that stress in continuum FEA propagates through Tb microstructure with nominal leakage into the marrow space. Descriptive statistics of means and standard deviation (std) of compressive and shear modulus values for LR and HR CT images were computed, and their linear correlation (r-value) and reproducibility in terms of intra-class correlation coefficient (ICC) were examined. Also, mean and std of different Tb microstructural measures (table 1) from LR and HR CT scans were computed, and their linear correlation and ICC values were examined to facilitate the discussions related to reproducibility of Tb microstructure and modulus measures between LR and HR CT scanners. For the purpose of evaluation in the second experiment, a previously validated algorithm (Chen et al 2016) was used for segmentation of Tb microstructure and marrow regions. Mean and std of stress over the Tb and marrow region were computed for each loading condition, and an unpaired t-test was performed to determine the significance in the difference between stress values over the two regions.
Table 1.
List of CT-derived Tb measures examined in this paper.
| Tb measure (unit) | Description |
|---|---|
| Tb.vBMD (g/cc) | Volumetric Tb mineral density |
| Tb.NA (1/mm) | Average area of Tb micro-network per unit VOI |
| Tb.PW (μm) | Mean Tb plate width computed by VTA (Saha et al 2010). |
| Tb.Th (μm) | Mean Tb thickness computed using star-line and fuzzy distance analysis (Liu et al 2014). |
| Tb.Sp (μm) | Mean Tb spacing, i.e. the space between trabecular microstructures computed using star-line and fuzzy distance analysis (Liu et al 2014). |
VTA: Volumetric topological analysis.
FEA experiments were executed on a Linux machine with 4 × 32 GB Tesla V100-SXM2 GPUs, 64 GB RAM, and 72 × 2.60 GHz Intel(R) Xeon(R) Gold 6240 CPUs. On an average, the Tb VOIs included approximately 277K and 91K edge and volume mesh elements, respectively. The mean±std of runtime of nonlinear FEA for all experiments was 75.1 ± 5.5 min.
3. Results and discussion
Mean and std of different modulus values computed from LR and HR CT images, and their linear and intra-class correlation coefficients are shown in table 2. High linear correlation (r ∈ [0.94 0.96]) was observed between different modulus values from LR and HR scans. Also, high ICC values (ICC ∈ [0.93 0.94]) were observed between the modulus values, demonstrating the reproducibility of the comprehensive analytic process including bone filling, bone alignment, VOI selection, and FEA applied independently on CT images at two different resolutions.
Table 2.
Results of summary statistics (mean±std) and linear and intra-class correlation (ICC) analysis of different FEA-derived moduli from low- and high-resolution CT imaging.
| Modulus (unit) | LR | HR | Pearson correlation (r) | ICC |
|---|---|---|---|---|
| Compressive | 1622.1 ± 341.7 | 1698.9 ± 388.9 | 0.96 | 0.94 |
| X-shear (MPa) | 4050.1 ± 1156.3 | 4059.8 ± 1233.0 | 0.94 | 0.94 |
| Y-shear (MPa) | 3653.5 ± 825.7 | 3650.3 ± 914.6 | 0.94 | 0.93 |
Comparative results of different Tb measures computed from LR and HR CT scans are presented in table 3. It can be seen that, although high linear correlation (r ∈ [0.87 0.99]) was observed between the Tb measures derived from LR and HR scans, the reproducibility of these measures, except Tb.vBMD (ICC = 0.93), was low to moderate (ICC ∈ [0.39 0.85]). As BMD explains only 60%–70% of bone’s mechanical competence, high reproducibility of BMD values alone is not sufficient for assessment of the reproducibility of overall Tb microstructural strength from different CT scans at different resolutions. The nonlinear continuum FE modelling accounts for both BMD, as well as Tb microstructural distribution, and high reproducibility of the modulus measures demonstrates the potential of FEA as a generalizable tool for assessing Tb strength in multi-site and longitudinal studies using different scanners. Further, it is observed in table 3 that the Tb.Th metric has high linear correlation, but an ICC value noticeably smaller than the other four metrics. Tb.Th values (mean±std: 306.03 ± 44.52 μm) derived using LR scans were higher compared to the values obtained from HR scans (237.27 ± 35.08 μm). Observed high values of Tb.Th using LR scans may be attributed to greater partial voxel voluming and loss of thinner trabeculae in LR scans. This artefactual increase in Tb.Th values for LR scans contributed to small between-scanner ICC as compared to other four metrics.
Table 3.
Results of summary statistics (mean±std) and linear and intra-class correlation (ICC) analysis of different Tb microstructural measures from low- and high-resolution CT imaging.
| Tb measure (unit) | LR | HR | Pearson correlation (r) | ICC |
|---|---|---|---|---|
| Tb.vBMD (g/cc) | 1.16 ± 0.03 | 1.15 ± 0.03 | 0.95 | 0.93 |
| Tb.NA (1/mm) | 0.64 ± 0.15 | 0.80 ± 0.17 | 0.87 | 0.58 |
| Tb.PW (μm) | 1206.97 ± 157.67 | 1297.02 ± 112.90 | 0.96 | 0.75 |
| Tb.Th (μm) | 306.03 ± 44.52 | 237.27 ± 35.08 | 0.99 | 0.39 |
| Tb.Sp (μm) | 400.64 ± 85.52 | 366.36 ± 95.16 | 0.92 | 0.85 |
Figure 3 presents the results of application of FEA on LR CT. A volume rendition of the target VOI with the applied loading and boundary conditions for FEA is shown in (a). A color-coded rendition of the CHA density map of (a) is shown in (b). Figures (c)–(e) show the renditions of observed von Mises stress over the VOI for compressive, x- and y-shear loading conditions, respectively. Figures (f)–(h) show the stress distribution over the marrow region at the respective loading conditions. Agreements in high stress lines (red) in (c)–(e) with Tb microstructure (red) in (b) are visible, and low stress values (blue) in (f)–(h) over the marrow region confirm nominal stress leakage under all loading conditions. To examine the difference in loading patterns between compressive and shear loading conditions, voxel-wise differences between normalized stresses under compressive and each of the two shear loading conditions were computed and the difference maps are rendered in (i, j). For a given image and a specific loading condition, von Mises stress values were normalized using a linear mapping function, where the von Mises stresses at and above the 99th percentile were mapped to ‘1’. Thus, in both stress difference images, the values lie in the [−1 1] interval with positive values indicating higher compressive stress. For quantitative analysis, BMD values were mapped to a normalized measure of bone volume fraction (BVF) using a previously validated method (Chen et al 2018). The fraction of loaded bone voxels in a given image under a specific loading condition was computed as where B is the set of Tb voxels and and are the normalized stress and BVF values at individual voxels. The mean±std of the fraction of loaded Tb voxels for compressive, x-shear, and y-shear loading conditions in LR CT images were 0.69 ± 0.06, 0.65 ± 0.09, 0.53 ± 0.08, respectively. Paired t-test between the fraction of loaded Tb voxels for compressive loading and that for each of the two shear loading showed that significantly greater fractions (p < 0.05) of Tb voxels were loaded in compressive loading as compared to x- and y-shear loadings, which is consistent with the stress difference renditions of figures 3(i), (j). Similar results were observed for HR CT images.
Figure 3.

Results of FEA on LR CT under different loading conditions. (a), (b) Illustration of boundary conditions and loading setup for nonlinear FEA (a) and the color-coded volume rendition of CHA density map (b) on a target VOI. (c)–(e) Stress distribution under compressive (c), x-shear (d), and y-shear (e) loading conditions. (f)–(g) Stress leakages over the marrow space for compressive (f), x-shear (g), and y-shear (h) loading. For each loading condition, the overall stress distribution and the stress leakage in marrow space are displayed using the same color-scale. (i,j) Normalized stress differences between compressive and x-shear (i) and between compressive and y-shear (j) loading conditions. Regions appearing in red (or, blue) indicate voxels with higher (respectively, lower) compressive stress compared to shear stress, while region appearing in green, yellow, and cyan represent voxels with similar compressive and shear stresses.
The normalized stress histograms computed over Tb and marrow regions of all LR (n = 20) and HR (n = 20) scans under different loading conditions are separately shown in figure 4. For all loading conditions, the stress histograms computed over marrow region (green) fall rapidly and mean±std of the absorbed stress were 0.4 ± 0.5, 1.1 ± 1.1, and 1.0 ± 1.0 MPa for LR scans at compressive and x- and y-shear loading, respectively, and 0.4 ± 0.5, 0.9 ± 1.0, and 0.9 ± 0.9 MPa for HR scans at respective loading conditions. On the other hand, for both LR and HR scans the modes of the histograms computed over the Tb region (red) were higher than the average stress values of marrow regions under the same loading condition. Mean±std of the stress supported by Tb voxels for compressive and x- and y-shear loading scans were 2.3 ± 1.7, 4.1 ± 3.2, and 4.3 ± 2.9 MPa, respectively, for LR scans and 2.7 ± 1.9, 4.9 ± 3.5, and 5.1 ± 3.2 MPa, respectively, for HR scans. The difference in stress distribution over Tb and marrow regions was also significant (p < 10−12) for LR as well as HR scans at every loading condition. These observations are in line with the fundamental principle of structural mechanics at in vivo CT imaging stating that the majority of stress is absorbed by Tb compared to marrow space. It was observed that, at a matching loading condition, the area under the curve of the HR Tb stress histogram was higher than that of the LR Tb stress histogram. This observation reasserts that greater volume of Tb network was detected in HR scans as compared to LR scans.
Figure 4.

Histograms of Tb and marrow voxel counts at different stress values for LR and HR CT scans under compressive (a), x-shear (b), and y-shear (c) loading conditions.
A limitation of the current study is that the study subjects were young adult and generally-healthy to serve the purpose of the Iowa Bone Development Study (Janz et al 2002, Janz et al 2005) and the findings may not be generalizable to elderly populations with weaker Tb and reduced Tb network area density (Ding and Hvid 2000, Khosla et al 2006). Toward an effort to address this issue, we identified the Tb region in CT scans of the young adult population that represents the Tb network density in an elderly population at the 4%–6% tibial site. Specifically, we selected subjects with preserved lung function (n = 32, 12 Male, mean ± std of age: 64.0 ± 4.7 years) from the elderly samples of an Iowa cohort of the ongoing COPDGene Study (Regan et al 2011), who underwent HR ankle CT scans using the Siemens FORCE CT imaging protocol (see section 2.1). The optimum 2% tibial site in CT scans of the current study subjects representing the 4%–6% tibial site in the elderly population was determined by minimizing the Mahalanobis distance (De Maesschalck et al 2000) of Tb.NA distributions derived from the target 4%–6% tibial site in the elderly subjects and the candidate 2% tibial site in the current study subjects; the optimum 2% tibial site was experimentally observed at 6.2%–8.2% distal tibial location. All experiments were repeated for the simulated ‘elderly VOI,’ and high inter-scanner reproducibility was observed, with ICC values of 0.98, 0.95, and 0.94 for compressive, and X- and Y-shear moduli, respectively. The observed ICC value for the microstructural measure Tb network area density (Tb.NA) was 0.69. Thus, the simulated experiment suggests that the CT-based nonlinear FEA measures in an elderly population may be generalizable across scanners with different resolution features.
4. Conclusion
This paper presents and evaluates a nonlinear continuum FE method for computation of Tb microstructural strength from in vivo CT imaging that does not require binary separation of bone and marrow regions, while accounting for bone micro-distribution at the level of individual trabeculae. High reproducibility of modulus measures was observed experimentally under different loading conditions for young adult as well as simulated elderly Tb VOIs. Also, it was found that stress micro-propagations were primarily confined within the Tb micro-network, with minimal leakages over the marrow space, complying with the basic principle of structural mechanics at the in vivo CT resolution. Overall, our results demonstrate that in vivo CT-based FEA is a viable method for assessment of human bone microstructural strength, and high agreement of strength measures from low- and high-resolution CT scanners justifies its generalizability in multi-site and longitudinal human studies that often must use different scanners over the study period.
Acknowledgments
This work was supported in part by the NIH grant R01 HL142042. Analyses of this work are based in whole or in part upon data obtained at dbGaP phs002203.v1.p1. The study generating the dbGaP data was supported in part by a number of NIH grants to Dr Levy (U01DE028522, R01DE09551, R01DE12101, R03DE023784, R56DE012101, M01RR00059, UL1RR024979, UL1TR000442, and UL1TR001013), as well as funding from the U.S. Centers for Disease and Control and Prevention, Delta Dental of Iowa Foundation, Roy J Carver Charitable Trust, American Academy of Pediatric Dentistry Foundation, American Association of Orthodontists Foundation, American Association for Dental Research, and the University of Iowa.
APPENDIX. : CT-to-bone mineral density (BMD) calibration
Separate CT-to-Bone mineral density (BMD) calibration curves were derived for low- and high-resolution scanners using a Gammex RMI 467 Tissue Characterization Phantom (Gammex RMI, Middleton, WI, USA), which includes sixteen cylinders with known physical densities (mg/cc) (figure A1(a)). Specifically, for each scanner, the Gammex phantom was scanned using the matching CT imaging and reconstruction protocol using for human scans; axial image slices of LR and HR scans of the phantom are shown in figures A1(b), (d). Each of the sixteen cylinders was automatically located, segmented, and labelled in a phantom scan using an automated method developed in our laboratory based on thresholding, connectivity, morphological analysis (figures A1(c), (e)). To eliminate variabilities in CT intensity values due to partial voluming each segmented cylindrical volume was eroded by five voxels, and the average CT value over the eroded region was computed. For each scanner, the average CT intensity values and vendor-provided physical densities of individual cylinders were recorded on a CT-to-physical density plot (figure A2). Finally, the CT-to-BMD calibration curve was computed for each scanner from the corresponding CT-to-physical density plot by fitting a linear equation to the data points of cylinders with physical density less than water density and another linear equation to the data points of remaining cylinders (figure A2).
Figure A1.

CT-to-BMD calibration phantom and scans. (a) A photograph of the Gammex RMI 467 Tissue Characterization Phantom used for CT-to-BMD calibration. (b), (c) An axial image slice from the low-resolution scan of the Gammex phantom on a Siemens FLASH scanner (b) and segmented cylinders for different tissue characterization (c). (d), (e) Same as (b), (c) but for the high-resolution Siemens FORCE scanner.
Figure A2.
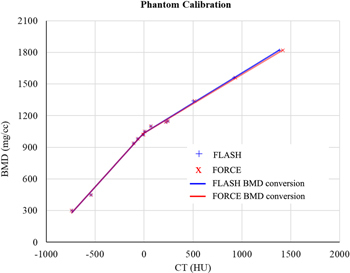
CT-to-BMD calibration curve for the low-resolution FLASH and high-resolution FORCE scanners.
Data availability statement
The data cannot be made publicly available upon publication because they contain sensitive personal information. The data that support the findings of this study are available upon reasonable request from the authors.
References
- Bauer J S, Sidorenko I, Mueller D, Baum T, Issever A S, Eckstein F, Rummeny E J, Link T M, Raeth C W. Prediction of bone strength by μCT and MDCT-based finite-element-models: How much spatial resolution is needed? Eur. J. Radiol. 2014;83:36–42. doi: 10.1016/j.ejrad.2013.10.024. [DOI] [PubMed] [Google Scholar]
- Boutroy S, Van Rietbergen B, Sornay‐Rendu E, Munoz F, Bouxsein M L, Delmas P D. Finite element analysis based on in vivo HR‐pQCT images of the distal radius is associated with wrist fracture in postmenopausal women. J. Bone Miner. Res. 2008;23:392–9. doi: 10.1359/jbmr.071108. [DOI] [PubMed] [Google Scholar]
- Bouxsein M L, Boyd S K, Christiansen B A, Guldberg R E, Jepsen K J, Muller R. Guidelines for assessment of bone microstructure in rodents using micro-computed tomography. J. Bone Miner. Res. 2010;25:1468–86. doi: 10.1002/jbmr.141. [DOI] [PubMed] [Google Scholar]
- Chen C, Jin D, Zhang X, Levy S M, Saha P K. Segmentation of trabecular bone for in vivo CT imaging using a novel approach of computing spatial variation in bone and marrow intensities. Asian Conf. on Computer Vision, Springer, 3–15.2016. [Google Scholar]
- Chen C, Zhang X, Guo J, Jin D, Letuchy E M, Burns T L, Levy S M, Hoffman E A, Saha P K. Quantitative imaging of peripheral trabecular bone microarchitecture using MDCT. Med. Phys. 2018;45:236–49. doi: 10.1002/mp.12632. [DOI] [PMC free article] [PubMed] [Google Scholar]
- Chevalier Y, Pahr D, Allmer H, Charlebois M, Zysset P. Validation of a voxel-based FE method for prediction of the uniaxial apparent modulus of human trabecular bone using macroscopic mechanical tests and nanoindentation. J. Biomech. 2007;40:3333–40. doi: 10.1016/j.jbiomech.2007.05.004. [DOI] [PubMed] [Google Scholar]
- De Maesschalck R, Jouan-Rimbaud D, Massart D L. The mahalanobis distance. Chemometr. Intell. Lab. Syst. 2000;50:1–18. doi: 10.1016/S0169-7439(99)00047-7. [DOI] [Google Scholar]
- Ding M, Hvid I. Quantification of age-related changes in the structure model type and trabecular thickness of human tibial cancellous bone. Bone. 2000;26:291–5. doi: 10.1016/S8756-3282(99)00281-1. [DOI] [PubMed] [Google Scholar]
- Guha I, Zhang X, Rajapakse C S, Chang G, Saha P K. Finite element analysis of trabecular bone microstructure using CT imaging and continuum mechanical modelling. Med. Phys. 2022;49:3886–99. doi: 10.1002/mp.15629. [DOI] [PMC free article] [PubMed] [Google Scholar]
- Jang I, Bae G, Song J, Kim H, Park N. Fracture envelopes on the 3D-DIC and hybrid inverse methods considering loading history. Mater. Des. 2020;194:108934. doi: 10.1016/j.matdes.2020.108934. [DOI] [Google Scholar]
- Janz K F, Burns T L, Levy S M. Tracking of activity and sedentary behaviors in childhood: the Iowa bone development study. American journal of preventive medicine. 2005;29:171–8. doi: 10.1016/j.amepre.2005.06.001. [DOI] [PubMed] [Google Scholar]
- Janz K F, Levy S M, Burns T L, Torner J C, Willing M C, Warren J J. Fatness, physical activity, and television viewing in children during the adiposity rebound period: the Iowa bone development study. Preventive medicine. 2002;35:563–71. doi: 10.1006/pmed.2002.1113. [DOI] [PubMed] [Google Scholar]
- Keyak J, Lee I, Nath D, Skinner H. Postfailure compressive behavior of tibial trabecular bone in three anatomic directions. J. Biomed. Mater. Res. 1996;31:373–8. doi: 10.1002/(SICI)1097-4636(199607)31:3<373::AID-JBM11>3.0.CO;2-K. [DOI] [PubMed] [Google Scholar]
- Keyak J, Sigurdsson S, Karlsdottir G, Oskarsdottir D, Sigmarsdottir A, Kornak J, Harris T, Sigurdsson G, Jonsson B, Siggeirsdottir K. Effect of finite element model loading condition on fracture risk assessment in men and women: the AGES-Reykjavik study. Bone. 2013;57:18–29. doi: 10.1016/j.bone.2013.07.028. [DOI] [PMC free article] [PubMed] [Google Scholar]
- Keyak J H, Kaneko T S, Tehranzadeh J, Skinner H B. Predicting proximal femoral strength using structural engineering models’. Clin. Orthop. Relat. Res. 2005;437:219–28. doi: 10.1097/01.blo.0000164400.37905.22. [DOI] [PubMed] [Google Scholar]
- Khosla S, Riggs B L, Atkinson E J, Oberg A L, McDaniel L J, Holets M, Peterson J M, Melton L J., 3rd Effects of sex and age on bone microstructure at the ultradistal radius: a population-based noninvasive in vivo assessment. J. Bone Miner. Res. 2006;21:124–31. doi: 10.1359/JBMR.050916. [DOI] [PMC free article] [PubMed] [Google Scholar]
- Kleerekoper M, Villanueva A R, Stanciu J, Rao D S, Parfitt A M. The role of three-dimensional trabecular microstructure in the pathogenesis of vertebral compression fractures. Calcified Tissue Int. 1985;37:594–7. doi: 10.1007/BF02554913. [DOI] [PubMed] [Google Scholar]
- Legrand E, Chappard D, Pascaretti C, Duquenne M, Krebs S, Rohmer V, Basle M F, Audran M. Trabecular bone microarchitecture, bone mineral density, and vertebral fractures in male osteoporosis. J. Bone Miner. Res. 2000;15:13–9. doi: 10.1359/jbmr.2000.15.1.13. [DOI] [PubMed] [Google Scholar]
- Li C, Jin D, Chen C, Letuchy E M, Janz K F, Burns T L, Torner J C, Levy S M, Saha P K. Automated cortical bone segmentation for multirow-detector CT imaging with validation and application to human studies. Med. Phys. 2015;42:4553–65. doi: 10.1118/1.4923753. [DOI] [PMC free article] [PubMed] [Google Scholar]
- Liu X S, Zhang X H, Rajapakse C S, Wald M J, Magland J, Sekhon K K, Adam M F, Sajda P, Wehrli F W, Guo X E. Accuracy of high‐resolution in vivo micro magnetic resonance imaging for measurements of microstructural and mechanical properties of human distal tibial bone. J. Bone Miner. Res. 2010;25:2039–50. doi: 10.1002/jbmr.92. [DOI] [PMC free article] [PubMed] [Google Scholar]
- Liu Y, Jin D, Li C, Janz K F, Burns T L, Torner J C, Levy S M, Saha P K. A robust algorithm for thickness computation at low resolution and its application to in vivo trabecular bone CT imaging. IEEE Trans. Biomed. Eng. 2014;61:2057–69. doi: 10.1109/TBME.2014.2313564. [DOI] [PMC free article] [PubMed] [Google Scholar]
- Logan D L. A first course in the finite element method. Boston: Cengage Learning; 2011. [Google Scholar]
- MacNeil J A, Boyd S K. Accuracy of high-resolution peripheral quantitative computed tomography for measurement of bone quality. Med. Eng. Phys. 2007;29:1096–105. doi: 10.1016/j.medengphy.2006.11.002. [DOI] [PubMed] [Google Scholar]
- Meijering E H, Niessen W J, Pluim J P, Viergever M A. Quantitative comparison of sinc-approximating kernels for medical image interpolation, translated by Springer. 1999;1679:210–7. [Google Scholar]
- National Osteoporosis Foundation 2017. Annual Report, [online], available: https://cdn.nof.org/wp-content/uploads/2017_NOF_Annual_report_v6_final.pdf [accessed August 14, 2020]
- Nishiyama K, Macdonald H, Hanley D, Boyd S. Women with previous fragility fractures can be classified based on bone microarchitecture and finite element analysis measured with HR-pQCT. Osteoporosis international. 2013;24:1733–40. doi: 10.1007/s00198-012-2160-1. [DOI] [PubMed] [Google Scholar]
- Parfitt A M, Mathews C H E, Villanueva A R, Kleerekoper M, Frame B, Rao D S. Relationships between surface, volume, and thickness of iliac trabecular bone in aging and in osteoporosis - implications for the microanatomic and cellular mechanisms of bone loss. J. Clin. Invest. 1983;72:1396–409. doi: 10.1172/JCI111096. [DOI] [PMC free article] [PubMed] [Google Scholar]
- Rajapakse C S, Magland J F, Wald M J, Liu X S, Zhang X H, Guo X E, Wehrli F W. Computational biomechanics of the distal tibia from high-resolution MR and micro-CT images. Bone. 2010;47:556–63. doi: 10.1016/j.bone.2010.05.039. [DOI] [PMC free article] [PubMed] [Google Scholar]
- Rayudu N M, Anitha D P, Mei K, Zoffl F, Kopp F K, Sollmann N, Löffler M T, Kirschke J S, Noël P B, Subburaj K. Low-dose and sparse sampling MDCT-based femoral bone strength prediction using finite element analysis. Archives of Osteoporosis. 2020;15:1–9. doi: 10.1007/s11657-020-0708-9. [DOI] [PubMed] [Google Scholar]
- Regan E A, Hokanson J E, Murphy J R, Make B, Lynch D A, Beaty T H, Curran-Everett D, Silverman E K, Crapo J D. Genetic epidemiology of COPD (COPDGene) study design. COPD: Journal of Chronic Obstructive Pulmonary Disease. 2011;7:32–43. doi: 10.3109/15412550903499522. [DOI] [PMC free article] [PubMed] [Google Scholar]
- Van Ruijven L, Mulder L, Van Eijden T. Variations in mineralization affect the stress and strain distributions in cortical and trabecular bone. J. Biomech. 2007;40:1211–8. doi: 10.1016/j.jbiomech.2006.06.004. [DOI] [PubMed] [Google Scholar]
- Saha P K, Xu Y, Duan H, Heiner A, Liang G. Volumetric topological analysis: a novel approach for trabecular bone classification on the continuum between plates and rods. IEEE Trans. Med. Imaging. 2010;29:1821–38. doi: 10.1109/TMI.2010.2050779. [DOI] [PMC free article] [PubMed] [Google Scholar]
- Seeman E, Delmas P D. Bone quality--the material and structural basis of bone strength and fragility. New Engl. J. Med. 2006;354:2250–61. doi: 10.1056/NEJMra053077. [DOI] [PubMed] [Google Scholar]
- Ulrich D, van Rietbergen B, Weinans H, Rüegsegger P. Finite element analysis of trabecular bone structure: a comparison of image-based meshing techniques. J. Biomech. 1998;31:1187–92. doi: 10.1016/S0021-9290(98)00118-3. [DOI] [PubMed] [Google Scholar]
- Watts N B, Bilezikian J P, Camacho P M, Greenspan S L, Harris S T, Hodgson S F, Kleerekoper M, Luckey M M, McClung M R, Pollack R P. American association of clinical endocrinologists medical guidelines for clinical practice for the diagnosis and treatment of postmenopausal osteoporosis. Endocrine practice. 2010;16:1–37. doi: 10.4158/EP.16.S3.1. [DOI] [PMC free article] [PubMed] [Google Scholar]
- Wehrli F W, Saha P K, Gomberg B R, Song H K, Snyder P J, Benito M, Wright A, Weening R. Role of magnetic resonance for assessing structure and function of trabecular bone. Topics in Magnetic Resonance Imaging. 2002;13:335–55. doi: 10.1097/00002142-200210000-00005. [DOI] [PubMed] [Google Scholar]
- Zhang N, Magland J F, Rajapakse C S, Bhagat Y A, Wehrli F W. Potential of in vivo MRI‐based nonlinear finite‐element analysis for the assessment of trabecular bone post‐yield properties. Med. Phys. 2013;40:1–10. doi: 10.1118/1.4802085. [DOI] [PMC free article] [PubMed] [Google Scholar]
Associated Data
This section collects any data citations, data availability statements, or supplementary materials included in this article.
Data Availability Statement
The data cannot be made publicly available upon publication because they contain sensitive personal information. The data that support the findings of this study are available upon reasonable request from the authors.