

Abstract
Breast cancer is the second most common cancer around the world. Triple-negative breast cancer (TNBC) is characterized by the absence of three receptors: progesterone, estrogen, and human epidermal growth factor-2 receptor (HER2). Various synthetic chemotherapies have gained attention but they caused unwanted side effects. Therefore, some secondary therapies are now becoming famous against this disease. For instance, natural compounds have been extensively researched against many diseases. However, enzymatic degradation and low solubility remain a major concern. To combat these issues, various nanoparticles have been synthesized and optimized from time to time, which increases its solubility and hence therapeutic potential of a particular drug increases. In this study, we have synthesized Poly D,L-lactic-co-glycolic acid (PLGA) loaded thymoquinone (TQ) nanoparticle (PLGA-TQ-NPs) and then coated them by chitosan (CS) (PLGA-CS-TQ-NPs), which was characterized by different methods. Size of non-coated NPs was 105 nm with PDI value of 0.3 and the size of coated NPs was 125 nm with PDI value of 0.4. Encapsulation efficiency (EE%) and Drug loading (DL%) was found to be 70.5 ± 2.33 and 3.38 for non-coated and 82.3 ± 3.11 and 2.66 for coated NPs respectively. We have also analysed their cell viability against MDA-MB-231 and SUM-149 TNBC cell lines. The resultant, nanoformulations exhibit anti-cancerous activity in a dose and time-dependent manner for MDA-MB-231 and SUM-149 cell lines with an IC50 value of (10.31 ± 1.15, 15.60 ± 1.25, 28.01 ± 1.24) and (23.54 ± 1.24, 22.37 ± 1.25, 35 ± 1.27) for TQ free, PLGA-TQ-NPs and PLGA-CS-TQ-NPs respectively. For the first time, we have developed a nanoformulations of PLGA loaded TQ coated with CS NPs (PLGA-CS-TQ-NPs) against TNBC which led to their enhanced anti-cancerous effects.
Keywords: thymoquinone, triple negative breast cancer, polymeric nanoparticles, polylactic acid, chitosan, hybrid nanoparticles
Introduction
Breast cancer remains one of the deadliest diseases in women around the globe with 2,261,419 new deaths reported in 2020 (Sung et al., 2021). We can define triple-negative breast cancer (TNBC) as a major type of breast cancer in which estrogen (ER), progesterone (PR) and human epidermal growth factor receptor (HER-2) show negative expression profiles (Wolff et al., 2013). Comparatively, the survival rate is very less and the mortality rate is around 40% within the first 5 years of diagnosis (Dent et al., 2007).
Regarding the treatment options, chemotherapy is an effective treatment for TNBC in which various combination regimes comes out to be a positive approach like taxel/docetaxel + adriamycin + cyclophosphamide (TAC), adriamycin + cyclophosphamide (AC), cyclophosphamide + methotrexate + fluorouracil (CMF), docetaxel + cyclophosphamide (TC) (Yin et al., 2020). But these are synthetic chemo-drugs that impart heavy toxicity in addition to their effectiveness. So, to cope with this situation, the natural compound has been thoroughly searched and then extensively researched for its role against TNBC as they are very less toxic and cost-effective. Moreover, the main drawback with natural compounds is their low solubility which hampers their effectiveness. In the past few decades, nanotechnology has been an emerging field to address these issues, attracting many scientists to utilize them in medicine, especially in cancer treatment (Brigger et al., 2012; Khan et al., 2021). Among many approaches, drug delivery systems (DDS) remain one of the leading approaches for controlled drug delivery and toxicity-related issues (Khan et al., 2020; Adepu and Ramkrishna, 2021).
The vasculature of the tumor has been described as “leaky” due to pore size ranging from 0.2 to 1.2 µm (Yuan et al., 1995; Hobbs et al., 1998). This leaky environment of tumor vasculature promotes an effect known as the “enhanced permeation and retention (EPR) effect, which allows NPs to penetrate tumor vasculature, and thereby enhanced its therapeutic potential (Teicher, 2000; Sledge and Miller, 2003).
Poly-(lactic-co-glycolic acid) (PLGA) is the major polymeric NPs that is used as a drug delivery agent against various types of cancer owing to their biocompatibility and biodegradability (Dahhier et al., 2012; Varypataki et al., 2016). The property of burst release of their contents (Chen et al., 2016; Wang et al., 2018), and very less specific interaction with cells or proteins reduced the drug concentration on target cells (El-Hammadi et al., 2017; Wu et al., 2017). Therefore, they are being modified through various polymers like chitosan which enhances their cellular uptake and effectiveness (Chen et al., 2014; Taghavi et al., 2017). CS is a cationic polymer obtained by the deacetylation of chitin which is a natural polymer found in the cell walls of fungi and an important integral component of the exoskeleton of arthropods (Elieh-Ali-Komi and Hamblin, 2016). It is used as a drug delivery agent due to its amazing biocompatibility and biodegradability (Ali and Ahmed, 2018). Sesamol is an anti-cancer agent and its incorporation into cadmium sulphide (CdS) quantum dots (QDs) modified chitosan (CTS) greatly enhanced the drug loading activity and the anti-cancerous activity of sesamol (Abdelhamid et al., 2019). Chitosan also finds its place in using against cancer therapy, oral drug delivery, transdermal delivery via formation of chitosan hydrogels (Saeedi et al., 2022). Chitosan also finds its place in delivering oligonucleotides in cancer therapy. In this regard, chitosan-modified iron oxide magnetic nanoparticles was synthesized and checked for gene therapy (Dowaidar et al., 2018). Due to their positive nature, they can attach themselves to negatively charged membranes which results in their mucoadhesive property i.e., an important criterion for drug delivery systems. Hence, the coating of CS on PLGA NPs enhances its therapeutic potential.
Thymoquinone (TQ), obtained from seeds of Nigella sativa or black seeds possess many benefits in addition to their anti-cancerous property (Randhawa and Al-Ghamdi, 2002). TQ proved to be an anti-cancerous agent against TNBC through various mechanisms and modulation of the tumor micro-environment (Adinew et al., 2021). Various nanoparticles of TQ has been synthesized to encapsulate it and increase its solubility and effectiveness. e.g., TQ was loaded in lipid nanostructured lipid carrier strikingly enhanced the anticancer activity in 4T1 tumor bearing mice in breast cancer mode (Ong et al., 2018). Similarly, TQ also incorporated in solid lipid nanoparticles (SLNs) and demonstrated antidepressant like property in rats (Alam et al., 2020). TQ also inhibits cervical cancer which was proved by loaded TQ in mesoporous silica nanoparticles which results inhibition by retarding of cell invasion and ROS mediated apoptosis (Goel and Mishra, 2019). So, we have summarized the previous works done using TQ as a therapeutic agent in table. But, none of the literature found that optimized TQ loaded in PLGA NPs and coated with CS, treated with a Triple-negative breast cancer cell line. Activity of TQ nanoformulations on different diseases summarized in Table 1.
TABLE 1.
Illustrates important nanoformulations of TQ and their roles.
| TQ nanoformulations | Activity | References |
|---|---|---|
| TQ- lipid nanostructured nanocarrier | Enhanced activity in 4T1 cancer bearing breast cancer | Ong et al. (2018) |
| TQ- solid lipid nanoparticles | Antidepressant like property in rats | Alam et al. (2020) |
| TQ-mesoporous silica nanoparticles | Enhanced anti-cervical cancer property | Goel and Mishra, (2019) |
In the view of above updates, we have synthesized PLGA-CS-TQ-NPs and then evaluated their therapeutic potential against TNBC. This study will be the first and novel study to find out the effective role of TQ against deadly TNBC.
Materials and methods
Materials
Thymoquinone, PLGA, chitosan and polyvinyl alcohol (PVA), sodium hydroxide were purchased from sigma Aldrich (St. Louis, Missouri, United states), while dimethyl sulphoxide (DMSO), acetonitrile were purchased from Shanghai Fuchen Chemical Industry Limited Company, Qingpu District, Shanghai, China. 3-(4,5-dimethylthiazol-2-yl)-2,5diphenyl-2-H-tetrazolium bromide bromide, 4’,6-diamidino-2-phenylindole (DAPI) (MTT) were procured from Shanghai Lingfeng Chemical Reagent Co., Ltd. China. All other reagents used were purchased from Tianjin Kermel Chemical Reagent Co. (China). SUM 169 and MBD MB-231 triple-negative breast cancer cell lines were obtained from ATCC.
Methods
Synthesis of TQ-loaded PLGA nanoparticles
PLGA CS modified NPs were synthesized by the nanoprecipitation method using the protocol optimized by Lu et al. with little modification. First of all, we synthesized PLGA-TQ-NPs (non-coated NPs) and then we coated CS on these synthesized NPs. Briefly, PLGA (100 mg) and thymoquinone (50 mg) were subsequently mixed with acetone (10 mL) to form the organic first phase. Polyvinyl alcohol (PVA) (50 mg) was slowly poured into the deionized water (200 mL) to form the second phase, the aqueous phase. Following this, both phases at moderate flow rates were pumped into the RPB reactor for the complete mixing of two solutions to form PLGA-NPs. On these NPs coating of CS (30 mg) was done by dissolving CS in 0.5% acetic acid aqueous solution to form (PLGA-CS-TQ-NPs) on a magnetic stirrer at a speed of 1,000 r.p.m (Lu et al., 2019). The non-loaded drug was separated by high-speed centrifugation (15,000 r/min, 15 min). TQ-loaded NPs remained in the pellet after the supernatant was discarded and the nanoparticles were again re-suspended in distilled water after mixing it with 5% glucose for the lyophilization step for a few hours (vacuum freeze-drying machine, Lycodel, China). Further, the characterization and in vitro studies were performed on these re-suspended nanoparticles by following different protocols. Void NPs were also synthesized using the same protocol as above without using TQ.
Characterization of nanoparticles
Hydrodynamic radii, zeta potential, and surface morphology of NPs
The size of NPs was measured using a zeta sizer instrument (Malvern ZS nano) by utilizing the phenomenon of dynamic light scattering. Zeta potential was also measured from the same instrument by just changing the program. The sample’s readings were taken thrice after diluting it with double distilled water. The size of NPs was captured by Transmission electron microscopy (TEM, model number-0000, JEOL, Tokyo, Japan) using uranyl phosphate as a staining agent. Shape and Morphology of nanoparticles was captured with a scanning electron microscope (SEM) by casting a drop of sample onto the coverslip and then it was dried for at least 1 day. This dried sample was then coated with gold using a gold coating sputter (Astete and Sabliov, 2006).
Drug loading and encapsulation efficiency
TQ was quantified by using UV-Vis spectroscopy at a lambda max peak at 254 nm which shows how much drug is entrapped within nanoparticles. For this lyophilized NPs were treated with triton-X-100 (1%) to release the drug from NPs which was quantified spectrophotometrically. For this, standard curve for TQ was plotted by taking a fixed concentration and then increasing that concentration which was plotted on a graph to find the value of the amount of drug loaded in NPs. So, we can say that (EE) is the percentage of the amount of drug loaded in NPs and the weight of the drug initially used during the preparation of NPs. The mathematical formula for calculating EE is as follows:
Encapsulation efficiency (%) = Total drug (mg)—Free drug (mg) X100 Total drug (mg).
And drug loading percentage may be defined as the amount of drug is present in nanoparticles divided by total weight of nanoparticles including drug. The mathematical Formula 1 for calculating LC is as follows:
Drug loading (%) = Weight of drug in NPs (mg) X100%
| (1) |
In vitro release kinetics
Around 50 mg TQ-loaded NPs were redispersed in 5 mL double distilled water and poured into a dialysis membrane bag having a molecular cut-off of 12 kDa. This bag was kept in a phosphate buffer having pH 7.4 and temperature 37°C to understand the rate of release at physiological pH conditions with continuous stirring at room temperature. After predefined intervals, 2.5 mL of water is removed from the beaker and the same amount was filled into the beaker. Same experiment was repeated for cancer microenvironment pH which was around 5.5. The amount of TQ was measured spectrophotometer at 254 nm wavelength using a calibration curve. Experiments were replicated for 20 days and the release content of TQ was plotted against the number of days in which experiments were performed.
Also, we analysed the in vitro drug release data through various kinetic models to describe the release kinetics of nanoparticles. Here, the zero order rate Eq. 2 explains the systems in which the rate of drug release does not depend on its concentration (Dash et al., 2010). Also, the first order rate kinetics were given using Eq. 3 which explains the release from the system in where rate of release of drug is concentration dependent (Costa and Lobo, 2001). Furthermore, Higuchi (Higuchi, 1963) also described the release pattern of drugs from insoluble matrix as a square root of time dependent process which was based on Fickian diffusion as given in Eq. 4. Finally, another model which was described by Korsmeyer et al. (1983) which derived a simple mathematical formula which explained the drug release from a polymeric system as given by Eq. 5.
| (2) |
Where, C is the concentration of drug at time t, t is the time and ko is zero-order rate constant expressed in units of concentration/time.
| (3) |
Where, CO is the initial concentration of drug and k1 is the first order rate constant.
| (4) |
Where, KH is the constant reflecting the variable of the system.
| (5) |
Where, Mt/M∞ is the fraction of drug released at time t, KKP is the rate constant and n is the release exponent.
Cellular uptake studies
How much NP accumulates into TNBC cells is known as the cellular uptake of NPs was examined by observing rhodamine B-filled nanoparticles into SUM-149 cells through a confocal laser scanning microscope (CLSM). TNBC cell lines were grown to 60%–70% population on sterile coverslips for further procedures. Furthermore, cells were treated with different NPs for around 3 h which was followed by PBS buffer washing to remove non-loaded NPs. After this, DAPI fluorescent was used to stain the nucleus for further analysis. Uptake studies of our nano-formulation were then visually observed under CLSM on (CLSM, D-Eclipse C1, Nikon).
MTT assay
The cytotoxicity of free TQ, PLGA-TQ-NPs, and PLGA-CS-TQ-NPs was examined using the MTT on MDA-MBA 231 and SUM-149 cell lines. Around 5 × 10³ cells were plated in 96 well plates and cultured for 24 h at 37°C in 5% CO2 in Dulbecco’s modified eagle medium (DMEM) which also contains 10% fetal bovine serum. After 24 h, cells were treated with different concentrations of free TQ, loaded TQ NPs, DMSO, or blank NPs for around 72 h. About 50 µL of MTT was added following drug and NPs treatment and incubated for another 3 h. Later, MTT was removed and 50 μL of ethanol and 150 μL of isopropyl alcohol (1:2) solution were added into it to solubilize the formed formazan crystals which were analyzed in a micro plate spectrophotometer at a wavelength of 570 nm to calculate half maximum inhibitory drug concentration (IC50) by using Graph Pad Prism software. The cell viability was calculated using the below Eq. 6, where the Abs sample is the absorbance of treated cells and Abs control is the absorbance of untreated cells (Liu et al., 2019).
| (6) |
Statistical analysis
The readings were taken in triplicate and then their differences in average were compared by simple analysis of variance (one-way ANOVA, GraphPad Instat 3) or independent sample t-test (Origin 6.1 USA). The significance of the difference was determined at the 95% confidence limit (α = 0.05).
Results and discussion
Hydrodynamic radii, polydispersity index, zeta potential, and surface morphology of NPs
Previous studies reported that the nano-particles smaller than 10 nm can be excreted from the kidneys, while larger particles (˃300 nm) can be eliminated from the systemic circulation when identified by the reticuloendothelial system (RES) (Fox et al., 2009; Kobayashi et al., 2014). Figure 1 is showing a data from the zeta sizer which showed that nanoparticles had a size range of 80 nm–150 nm which increases upon coating with CS. Further, polydispersity index (PDI) values of coated and non-coated NPs range from 0.2–0.3 also indicating a stable system. It is reported that lower the value of PDI, higher probability of monodisperse system is found (Rao et al., 2011; Mudalige et al., 2019). Similarly, Othman et al. TQ and Ascorbic acid in chitosan also showed particle PDI value of about 3.8 (Othman et al., 2020). Furthermore, non-coated PLGA NPs showed a negative zeta potential (−21.7 ± 2.23) due to the presence of carboxyl groups at the end of the PLGA chain. PLGA-CS-NPs exhibit a positive zeta potential (+35.6 ± 3.22) (Figure 2), due to the presence of amino groups at the surface of CS This transition of potential from negative to positive is a clear indication of the coating of CS on PLGA NPs (Xiao et al., 2016). It may illustrate that this positive potential interact with the negative charge of plasma membrane due to which it gets attached with it thereby enhancing the cellular uptake of tumor cells (Abouelmagd et al., 2015; Shariatinia, 2019). The major characteristics of NPs formed are shown in Table 2.
FIGURE 1.

Shows the size of (A) PLGA-Void-NPs, (B) PLGA-TQ-NPs, and (C) PLGA-CS-TQ-NPs using the principle of dynamic light scattering.
FIGURE 2.

Shows the zeta potential of (A) PLGA-Void-NPs, (B) PLGA-TQ-NPs, and (C) PLGA-CS-TQ-NPs.
TABLE 2.
Major characteristics of NPs formed.
| Nanoparticles | Size (d. nm) Av | Polydispersity index | Zeta potential (mV) |
|---|---|---|---|
| PLGA-NPs | 94.99 ± 1.76 | 0.2 | −16.3 ± 2.45 |
| PLGA-TQ-NPs | 105 ± 2.66 | 0.3 | −21.7 ± 2.23 |
| PLGA-CS-TQ-NPs @ 30% CS. | 122.3 ± 2.54 | 0.3 | +35.6 ± 3.22 |
HR-TEM (Figure 3) images confirmed the spherical shape of NPs and undeviating size distribution. Moreover, the diameter of NPs recorded from HR-TEM is smaller (100–150 nm) than recorded by DLS due to the principle that the former measured the hydrodynamic radii in which coating of water is also present while it is absent in the latter (dried HR-TEM) characterization samples (Hassellöv et al., 2008).
FIGURE 3.

Shows transmission electron microscopy (TEM) of formed (A) PLGA-Void-NPs and (B) chitosan-modified PLGA nanoparticles (PLGA-CS-TQ-NPs).
Fe-SEM (Figure 4) also signified the shape of formed nanoparticles which showed spherical particles with a size range of 100 nm–150 nm. At some places in the photograph, a few nanoparticles collide with each other to form elongated aggregated particles.
FIGURE 4.

Shows field emission scanning electron microscopy (Fe-SEM) of formed (A) PLGA-Void-NPs and (B) chitosan-modified PLGA nanoparticles (PLGA-CS-TQ-NPs).
Encapsulation efficiency of formed nanoparticles
EE of formed PLGA-TQ-NPs was found to be 70.5%. Moreover, the value of EE for CS-modified PLGA-CS-TQ-NPs was 82.3%. TQ is a hydrophobic drug that was encapsulated in PLGA NPs to avoid contact with an aqueous environment. Drug and PLGA dissolve in the organic solvent while the emulsifier is dissolved in water. When these two contacts each other, solvent displacement occur at the interface of two phases. Then, TQ and PLGA formed into NPs at the interface (Fessi et al., 1989; Almoustafa et al., 2017; Rivas et al., 2017). Some molecules of drugs leaked from the nanoparticles resulting in their low EE, while CS decreased the amount of drug coming out from PLGA-NPs (Lu et al., 2019). Hence, coating of CS around NPs was a good strategy to increase the EE of TQ besides several other benefits. EE % and DL % is summarized in Table 3.
TABLE 3.
Represents the type of NP and their encapsulation efficiency (EE%) and Drug loading (DL%).
| Nanoparticle type | Encapsulation efficiency % | Drug loading (DL) |
|---|---|---|
| PLGA-TQ-NPs | 70.5 ± 2.33 | 3.38 |
| PLGA-CS-TQ-NPs | 82.3 ± 3.11 | 2.66 |
In vitro release kinetics
How much of the drug has been released at different pH is determined by in vitro release kinetics. NPs release their drug slowly and in a sustained manner at 7.4 which is our physiological pH. The cumulative release value of PLGA-TQ-NPs and PLGA-CS-TQ-NPs in 15 days at physiological pH was found to be 39.4 ± 2.1% and 29.4 ± 2.01% respectively. The initial burst drug release was most likely due to the release of TQ that loosely bound to the surface of the NPs. Whereas the latter sustained release showed a slow release which might be due to the TQ release from the core of PLGA nanoparticles because of swelling and hydration of NPs matrix. Furthermore, the coating promoted the burst release of drugs from the NPs core by protecting the leaky behaviour pattern of PLGA NPs. Due to this effect drug released at a slower rate in case of CS coated nanoparticles than CS non-coated nanoparticles. Pattern of release kinetics at acidic pH which is about 80.5 ± 2.0 and 68.7 ± 1.9 for PLGA-TQ-NPs and PLGA-CS-TQ-NPs respectively was higher and rapid due to the fact that in acidic environment PLGA was degraded into its monomer which results into faster release from the PLGA NPs. The result was same as obtained in previous studies (Lu et al., 2019). These results showed that TQ was effectively entrapped within the PLGA NPs matrix and released their contents effectively, slowly, and in a sustained manner. The released kinetics at both the pH has shown in Figure 5.
FIGURE 5.
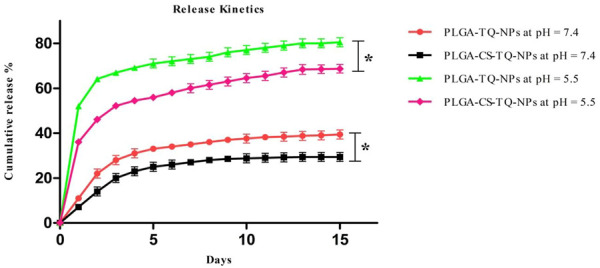
Illustrates the in-vitro release profile of PLGA-TQ-NPs and PLGA-CS-TQ-NPs at pH = 7.4 and pH = 5.5.
Kinetic study plots were plotted for different models: cumulative % drug release vs. time (zero order model), log % drug release vs. time (first order kinetics model), cumulative % drug release vs. square root of time (Higuchi model), log cumulative % drug release vs. log time (Korsmeyer-Peppas model). All the plots of different models were shown in Figure 6 And the results were summarized in Table 4, where R 2 is the correlation value, which indicates best fit (highest correlation value). Different R 2 values indicates how well the data fit the regression model which is also known as goodness of fit. In Table 4, we can see the R 2 value is highest for PLGA-CS-TQ-NPs at pH = 5.5, which is obviously tumor microenvironment. Here we can have concluded that the nanoparticles followed Korsmeyer-Peppas model with a correlation value 9.555, which was highest among all the other groups and was significant with previous reports (Bohrey et al., 2016).
FIGURE 6.

Showed different models of release kinetics (A) zero order kinetics model (B) first order kinetics model (C) Higuchi model (D) Korsmeyer Peppas model plot.
TABLE 4.
Represents the R 2 (correlation value) values obtained from different models.
| Types of nanoparticles and their R 2 | Zero order | First order | Higuchi model | Korsmeyer peppas model |
|---|---|---|---|---|
| PLGA-TQ-NPs (pH = 5.5) | 0.4841 | 0.7339 | 0.7298 | 0.9170 |
| PLGA-CS-TQ-NPs (pH = 5.5) | 0.6274 | 0.7714 | 0.8514 | 0.9558 |
| PLGA-TQ-NPs (pH = 7.4) | 0.6626 | 0.5429 | 0.8668 | 0.8278 |
| PLGA-CS-TQ-NPs (pH = 7.4) | 0.6624 | 0.5286 | 0.8537 | 0.8199 |
Cellular uptake
Cellular uptake of PLGA-CS-TQ-NPs was visualized by CLSM which showed intense red color florescent cytoplasm in nanoparticle-treated SUM-149 cells. Here, the red color indicated that the NPs have been reached in these cancer-affected cells’ cytoplasm. As we have used rhodamine B dye for cellular uptake study, hence this dye emits red color when present in the cytoplasm of cells. In other words, rhodamine binds to the cytoplasm of cells and emits the red color fluorescent signal. A similar observation was seen in the case of DAPI staining which stains the nucleus of cells and gives blue color intensity. Our results, has been supported by the use of DAPI stain that the NPs reached up to the nucleus of SUM-149 cells. In a nutshell, we can say that the formed NPs efficiently internalized in SUM-149 TNBC cell lines and thus proven good drug delivery agent for cancer therapy. It has been illustrated in Figure 6.
Cell proliferation assay (MTT assay)
Cytotoxicity of synthesized NPs was assessed by using two triple-negative breast cancer cell lines: SUM-149 and MDA-MB 231, through cell proliferation assay (MTT assay) that were treated for 72 h. The graph shown in Figure 7 represents the percentage of cell viability versus the concentration of NPs and drugs used. It was found that both formulations showed concentration-dependent cell cytotoxicity against the TNBC cell line. IC50 values of free TQ, PLGA-TQ-NPs and PLGA-CS-TQ-NPs was found to be (10.31 ± 1.15, 15.60 ± 1.25, 28.01 ± 1.24) and (23.54 ± 1.24, 22.37 ± 1.25, 35 ± 1.27) against MDA-MB-231 and SUM-149 cell lines respectively.
FIGURE 7.

Confocal image of cellular uptake studies of TNBC cells after incubating with PLGA-TQ nanoparticles.
As mentioned in the Table 5, and in Figures 8, 9 that both the formulations had a lower cytotoxicity than free TQ which was in consistence with the results provided by (Ibrahim WN) (Ibrahim and Rosli, 2020). This is obvious because drug released from the nanoformulations slower and hence can act on cells at a slower pace than the free drug which is freely available to these cells. Cell takes drug by endocytosis results in increasing their concentration (Cartiera et al., 2009). Furthermore, due to additional controlled released behaviour of chitosan on PLGA (Lu et al., 2019), nanoparticles released their cargo at a slower rate than PLGA nanoparticles, which further decreased their in vitro cytotoxic potential. Moreover, nanoparticles give advantages in vivo systems than in vitro systems by increasing the bioavailability of drugs due to their prolonged circulation, enhancing aqueous solubility and enhanced targeting of nanoparticles towards cancer tissue (Kalyane et al., 2019).
TABLE 5.
Represents the IC50 of PLGA NPs with and without CS coating against MDA-MB 231 and SUM 143 TNBC cell line treated for 72 h.
| Formulation | IC50 (MDA MB 231 cell line) | IC50 (SUM-149 cell line) |
|---|---|---|
| DOX Free | 1.369 ± 1.29 | 2.134 ± 1.384 |
| TQ Free | 10.31 ± 1.15 | 23.54 ± 1.24 |
| PLGA-TQ-NPs | 15.61 ± 1.25 | 22.37 ± 1.26 |
| PLGA-CS-TQ-NPs | 28.01 ± 1.24 | 35.00 ± 1.26 |
FIGURE 8.

(A) Depicts the cell viability of TQ and its nanoformulations on MDA-MB-231 cells. (B) Comparison of inhibition at IC50 value by TQ and its nanoformulations.
FIGURE 9.

(A) Depicts the cell viability of TQ and its nanoformulations on SUM 149 cells. (B) Comparison of inhibition at IC50 value by TQ and its nanoformulations.
Conclusion
In this work, we have synthesized chitosan-coated PLGA-TQ-NPs (PLGA-CS-TQ-NPs). The size of the nanoparticles formed was around 105 and 125 nm which was also verified by TEM images. This small size is a good idea for the EPR effect due to which NPs can be easily passed to the cells and hence increases the bioavailability of drugs to the tumor site. Zeta potential showed a negative potential of PLGA-loaded TQ, in which the charge was changed into a positive value when coated with chitosan. This coating prevents the burst release of drugs from the formed nanoparticles, which is evident from the released profiles at both the pH (normal and cancer tissue microenvironment). Furthermore, it interacts with the negative membrane of plasma membrane which results in adherence and immobilization of NPs around the tumor tissue. Both these effects prevent unwanted drug transfer and therefore lowered toxicity associated with several drugs and increased cytotoxic effects. Although TQ is known to have very less toxicity because it is natural in origin but having less water solubility hampers its efficacy which would increase by encapsulating it in nano-formulations. PLGA is a good choice of nano-formulation, however, its burst release sometimes hampers its normal drug delivery, thence coating it with certain polymers like CS is a good choice for lowering its burst release which increases its therapeutic efficacy. Due to controlled release behaviour, our system releases their cargo in a better way in vivo systems which are an essential feature of drug delivery system.
Funding Statement
The study was funded by the National Natural Science Foundation of China (32150410363, 32172348, 31972205); S&T projects of Guangzhou City (project No. 202102020731, 202102080346); the 111 Project (B17018); The S&T Project of Yangjiang (SDZX20200010); the R&D projects in key areas of Guangdong Province (2019B020212004); Guangzhou City University Alliance Fundamental Research Fund (Fund No. 20210210486), and the S&T projects of China’s Ministry (QN2021163001L). The authors are also thankful for the funding provided by the German Research Foundation (DFG, Deutsche Forschungsgemeinschaft) as part of Germany’s Excellence Strategy—EXC 2050/1—Project ID 390696704—Cluster of Excellence, “Centre for Tactile Internet with Human-in-the Loop” (CeTI) of Technische University Dresden.
Data availability statement
The raw data supporting the conclusion of this article will be made available by the authors, without undue reservation.
Author contributions
JG, SH, and AR designed the study protocol and wrote the manuscript’s first draft. AK, TM, and MF and data management. MA and XX managed the literature searches and analysis. AK and AR edited the manuscript; SH supervised the work. All authors contributed to and have approved the final manuscript.
Conflicts of interest
The authors declare that the research was conducted in the absence of any commercial or financial relationships that could be construed as a potential conflict of interest.
Publisher’s note
All claims expressed in this article are solely those of the authors and do not necessarily represent those of their affiliated organizations, or those of the publisher, the editors and the reviewers. Any product that may be evaluated in this article, or claim that may be made by its manufacturer, is not guaranteed or endorsed by the publisher.
References
- Abdelhamid H. N., El-Bery H. M., Metwally A. A., Elshazly M., Hathout R. M. (2019). Synthesis of CdS-modified chitosan quantum dots for the drug delivery of Sesamol. Carbohydr. Polym. 214, 90–99. 10.1016/j.carbpol.2019.03.024 [DOI] [PubMed] [Google Scholar]
- Abouelmagd S. A., Ku Y. J., Yeo Y. (2015). Low molecular weight chitosan-coated polymeric nanoparticles for sustained and pH-sensitive delivery of paclitaxel. J. drug Target. 23 (7-8), 725–735. 10.3109/1061186x.2015.1054829 [DOI] [PMC free article] [PubMed] [Google Scholar]
- Adepu S., Ramakrishna S. (2021). Controlled drug delivery systems: Current status and future directions. Molecules 26 (19), 5905. 10.3390/molecules26195905 [DOI] [PMC free article] [PubMed] [Google Scholar]
- Adinew G. M., Taka E., Mochona B., Badisa R. B., Mazzio E. A., Elhag R., et al. (2021). Therapeutic potential of thymoquinone in triple-negative breast cancer prevention and progression through the modulation of the tumor microenvironment. Nutrients 14 (1), 79. 10.3390/nu14010079 [DOI] [PMC free article] [PubMed] [Google Scholar]
- Alam M., Zameer S., Najmi A. K., Ahmad F. J., Imam S. S., Akhtar M. (2020). Thymoquinone loaded solid lipid nanoparticles demonstrated antidepressant-like activity in rats via indoleamine 2, 3-dioxygenase pathway. Drug Res. 70 (05), 206–213. 10.1055/a-1131-7793 [DOI] [PubMed] [Google Scholar]
- Ali A., Ahmed S. (2018). A review on chitosan and its nanocomposites in drug delivery. Int. J. Biol. Macromol. 109, 273–286. 10.1016/j.ijbiomac.2017.12.078 [DOI] [PubMed] [Google Scholar]
- Almoustafa H. A., Alshawsh M. A., Chik Z. (2017). Technical aspects of preparing PEG-PLGA nanoparticles as carrier for chemotherapeutic agents by nanoprecipitation method. Int. J. Pharm. 533 (1), 275–284. 10.1016/j.ijpharm.2017.09.054 [DOI] [PubMed] [Google Scholar]
- Astete C. E., Sabliov C. M. (2006). Synthesis and characterization of PLGA nanoparticles. J. biomaterials Sci. Polym. Ed. 17 (3), 247–289. 10.1163/156856206775997322 [DOI] [PubMed] [Google Scholar]
- Bohrey S., Chourasiya V., Pandey A. (2016). Polymeric nanoparticles containing diazepam: Preparation, optimization, characterization, in-vitro drug release and release kinetic study. Nano Converg. 3 (1), 1–7. 10.1186/s40580-016-0061-2 [DOI] [PMC free article] [PubMed] [Google Scholar]
- Brigger I., Dubernet C., Couvreur P. (2012). Nanoparticles in cancer therapy and diagnosis. Adv. drug Deliv. Rev. 64, 24–36. 10.1016/j.addr.2012.09.006 [DOI] [PubMed] [Google Scholar]
- Cartiera M. S., Johnson K. M., Rajendran V., Caplan M. J., Saltzman W. M. (2009). The uptake and intracellular fate of PLGA nanoparticles in epithelial cells. Biomaterials 30 (14), 2790–2798. 10.1016/j.biomaterials.2009.01.057 [DOI] [PMC free article] [PubMed] [Google Scholar]
- Chen H., Xie L. Q., Qin J., Jia Y., Cai X., Nan W., et al. (2016). Surface modification of PLGA nanoparticles with biotinylated chitosan for the sustained in vitro release and the enhanced cytotoxicity of epirubicin. Colloids Surfaces B Biointerfaces. 138, 1–9. 10.1016/j.colsurfb.2015.11.033 [DOI] [PubMed] [Google Scholar]
- Chen H. L., Wang Y. X., Zhou P., Liu R., Nan W. B., Wang Y. S., et al. (2014). Chitosan surface-modified PLGA nanoparticles: Preparation, characterization, and evaluation of their in vitro drug-release behaviors and cytotoxicities. Curr. Nanosci. 10 (2), 255–262. 10.2174/15734137113096660113 [DOI] [Google Scholar]
- Costa P., Lobo J. M. (2001). Modeling and comparison of dissolution profiles. Eur. J. Pharm. Sci. 13 (2), 123–133. 10.1016/s0928-0987(01)00095-1 [DOI] [PubMed] [Google Scholar]
- Danhier F., Ansorena E., Silva J. M., Coco R., Le Breton A., Préat V. (2012). PLGA-Based nanoparticles: An overview of biomedical applications. J. Control. release 161 (2), 505–522. 10.1016/j.jconrel.2012.01.043 [DOI] [PubMed] [Google Scholar]
- Dash S., Murthy P. N., Nath L., Chowdhury P. (2010). Kinetic modeling on drug release from controlled drug delivery systems. Acta Pol. Pharm. 67 (3), 217–223. [PubMed] [Google Scholar]
- Dent R., Trudeau M., Pritchard K. I., Hanna W. M., Kahn H. K., Sawka C. A., et al. (2007). Triple-negative breast cancer: Clinical features and patterns of recurrence. Clin. cancer Res. 13 (15), 4429–4434. 10.1158/1078-0432.ccr-06-3045 [DOI] [PubMed] [Google Scholar]
- Dowaidar M., Nasser Abdelhamid H., Hällbrink M., Langel Ü., Zou X. (2018). Chitosan enhances gene delivery of oligonucleotide complexes with magnetic nanoparticles–cell-penetrating peptide. J. biomaterials Appl. 33 (3), 392–401. 10.1177/0885328218796623 [DOI] [PubMed] [Google Scholar]
- El-Hammadi M. M., Delgado Á. V., Melguizo C., Prados J. C., Arias J. L. (2017). Folic acid-decorated and PEGylated PLGA nanoparticles for improving the antitumour activity of 5-fluorouracil. Int. J. Pharm. 516 (1-2), 61–70. 10.1016/j.ijpharm.2016.11.012 [DOI] [PubMed] [Google Scholar]
- Elieh-Ali-Komi D., Hamblin M. R. (2016). Chitin and chitosan: Production and application of versatile biomedical nanomaterials. Int. J. Adv. Res. 4 (3), 411–427. [PMC free article] [PubMed] [Google Scholar]
- Fessi H. P., Puisieux F., Devissaguet J. P., Ammoury N., Benita S. (1989). Nanocapsule formation by interfacial polymer deposition following solvent displacement. Int. J. Pharm. 55 (1), R1–R4. 10.1016/0378-5173(89)90281-0 [DOI] [Google Scholar]
- Fox M. E., Szoka F. C., Fréchet J. M. (2009). Soluble polymer-carriers for the treatment of cancer: The importance of molecular architecture. Accounts Chem. Res. 42 (8), 1141–1151. 10.1021/ar900035f [DOI] [PMC free article] [PubMed] [Google Scholar]
- Goel S., Mishra P. (2019). Thymoquinone loaded mesoporous silica nanoparticles retard cell invasion and enhance in vitro cytotoxicity due to ROS mediated apoptosis in HeLa and MCF-7 cell lines. Mater. Sci. Eng. C 104, 109881. 10.1016/j.msec.2019.109881 [DOI] [PubMed] [Google Scholar]
- Hassellöv M., Readman J. W., Ranville J. F., Tiede K. (2008). Nanoparticle analysis and characterization methodologies in environmental risk assessment of engineered nanoparticles. Ecotoxicology 17 (5), 344–361. 10.1007/s10646-008-0225-x [DOI] [PubMed] [Google Scholar]
- Higuchi T. (1963). Mechanism of sustained‐action medication. Theoretical analysis of rate of release of solid drugs dispersed in solid matrices. J. Pharm. Sci. 52 (12), 1145–1149. 10.1002/jps.2600521210 [DOI] [PubMed] [Google Scholar]
- Hobbs S. K., Monsky W. L., Yuan F., Roberts W. G., Griffith L., Torchilin V. P., et al. (1998). Regulation of transport pathways in tumor vessels: Role of tumor type and microenvironment. Proc. Natl. Acad. Sci. 95 (8), 4607–4612. 10.1073/pnas.95.8.4607 [DOI] [PMC free article] [PubMed] [Google Scholar]
- Ibrahim W. N., Rosli L. M., Doolaanea A. A. (2020). <p>Formulation, cellular uptake and cytotoxicity of thymoquinone-loaded PLGA nanoparticles in malignant melanoma cancer cells<</p>. Int. J. nanomedicine 15, 8059–8074. 10.2147/ijn.s269340 [DOI] [PMC free article] [PubMed] [Google Scholar]
- Kalyane D., Raval N., Maheshwari R., Tambe V., Kalia K., Tekade R. K. (2019). Employment of enhanced permeability and retention effect (EPR): Nanoparticle-based precision tools for targeting of therapeutic and diagnostic agent in cancer. Mater. Sci. Eng. C 98, 1252–1276. 10.1016/j.msec.2019.01.066 [DOI] [PubMed] [Google Scholar]
- Khan S. H., Alhumaydhi F. A., Khan M. A., Younus H. Therapeutic potential of polyphenols and their nanoformulations in the treatment of colorectal cancer. Anti-cancer agents in medicinal Chemistry (formerly current medicinal chemistry-anti-cancer agents). 2021;21(16):2117–2129. 10.2174/1871520621666201231144007 [DOI] [PubMed] [Google Scholar]
- Khan S. H., Younus H., Allemailem K. S., Almatroudi A., Alrumaihi F., Alruwetei A. M., et al. (2020). <p>Potential of Methylglyoxal-Conjugated Chitosan Nanoparticles in Treatment of Fluconazole-Resistant <em>Candida albicans</em> Infection in a Murine Model</p>. Int. J. Nanomedicine 15, 3681–3693. 10.2147/ijn.s249625 [DOI] [PMC free article] [PubMed] [Google Scholar]
- Kobayashi H., Watanabe R., Choyke P. L. (2014). Improving conventional enhanced permeability and retention (EPR) effects; what is the appropriate target? Theranostics 4 (1), 81–89. 10.7150/thno.7193 [DOI] [PMC free article] [PubMed] [Google Scholar]
- Korsmeyer R. W., Gurny R., Doelker E., Buri P., Peppas N. A. (1983). Mechanisms of solute release from porous hydrophilic polymers. Int. J. Pharm. 15 (1), 25–35. 10.1016/0378-5173(83)90064-9 [DOI] [PubMed] [Google Scholar]
- Liu P., Du R., Yu X. (2019). Ursolic acid exhibits potent anticancer effects in human metastatic melanoma cancer cells (SK-MEL-24) via apoptosis induction, inhibition of cell migration and invasion, cell cycle arrest, and inhibition of mitogen-activated protein kinase (MAPK)/ERK signaling pathway. Med. Sci. Monit. Int. Med. J. Exp. Clin. Res. 25, 1283–1290. 10.12659/msm.913069 [DOI] [PMC free article] [PubMed] [Google Scholar] [Retracted]
- Lu B., Lv X., Le Y. (2019). Chitosan-modified PLGA nanoparticles for control-released drug delivery. Polymers 11 (2), 304. 10.3390/polym11020304 [DOI] [PMC free article] [PubMed] [Google Scholar]
- Mudalige T., Qu H., Van Haute D., Ansar S. M., Paredes A., Ingle T. (2019). Characterization of nanomaterials: Tools and challenges. Nanomater. food Appl., 313–353. [Google Scholar]
- Ong Y. S., Saiful Yazan L., Ng W. K., Abdullah R., Mustapha N. M., Sapuan S., et al. (2018). Thymoquinone loaded in nanostructured lipid carrier showed enhanced anticancer activity in 4T1 tumor-bearing mice. Nanomedicine 13 (13), 1567–1582. 10.2217/nnm-2017-0322 [DOI] [PubMed] [Google Scholar]
- Othman N., Jamil Md.S. N., Masarudin M. J., Abdullah L. C., Daik R., Sarman N. S. (2020). L-Ascorbic acid and thymoquinone dual-loaded palmitoyl-chitosan nanoparticles: Improved preparation method, encapsulation and release efficiency. Processes 8 (9), 1040. 10.3390/pr8091040 [DOI] [Google Scholar]
- Randhawa M. A., Al-Ghamdi M. S. (2002). A review of the pharmaco-therapeutic effects of Nigella sativa. Pak J. Med. Res. 41 (2), 77–83. [Google Scholar]
- Rao S., Song Y., Peddie F., Evans A. M. (2011). Particle size reduction to the nanometer range: A promising approach to improve buccal absorption of poorly water-soluble drugs. Int. J. nanomedicine 6, 1245–1251. 10.2147/ijn.s19151 [DOI] [PMC free article] [PubMed] [Google Scholar]
- Rivas C. J., Tarhini M., Badri W., Miladi K., Greige-Gerges H., Nazari Q. A., et al. (2017). Nanoprecipitation process: From encapsulation to drug delivery. Int. J. Pharm. 532 (1), 66–81. 10.1016/j.ijpharm.2017.08.064 [DOI] [PubMed] [Google Scholar]
- Saeedi M., Vahidi O., Moghbeli M., Ahmadi S., Asadnia M., Akhavan O., et al. (2022). Customizing nano-chitosan for sustainable drug delivery. J. Control. Release 350, 175–192. 10.1016/j.jconrel.2022.07.038 [DOI] [PubMed] [Google Scholar]
- Shariatinia Z. (2019). Pharmaceutical applications of chitosan. Adv. colloid interface Sci. 263, 131–194. 10.1016/j.cis.2018.11.008 [DOI] [PubMed] [Google Scholar]
- Sledge G. W., Jr, Miller K. D. (2003). Exploiting the hallmarks of cancer: The future conquest of breast cancer. Eur. J. Cancer 39 (12), 1668–1675. 10.1016/s0959-8049(03)00273-9 [DOI] [PubMed] [Google Scholar]
- Song X., Wang J., Xu Y., Shao H., Gu J. (2019). Surface-modified PLGA nanoparticles with PEG/LA-chitosan for targeted delivery of arsenic trioxide for liver cancer treatment: Inhibition effects enhanced and side effects reduced. Colloids Surfaces B Biointerfaces 180, 110–117. 10.1016/j.colsurfb.2019.04.036 [DOI] [PubMed] [Google Scholar]
- Sung H., Ferlay J., Siegel R. L., Laversanne M., Soerjomataram I., Jemal A., et al. (2021). Global cancer statistics 2020: GLOBOCAN estimates of incidence and mortality worldwide for 36 cancers in 185 countries. CA a cancer J. Clin. 71 (3), 209–249. 10.3322/caac.21660 [DOI] [PubMed] [Google Scholar]
- Taghavi S., Ramezani M., Alibolandi M., Abnous K., Taghdisi S. M. (2017). Chitosan-modified PLGA nanoparticles tagged with 5TR1 aptamer for in vivo tumor-targeted drug delivery. Cancer Lett. 400, 1–8. 10.1016/j.canlet.2017.04.008 [DOI] [PubMed] [Google Scholar]
- Teicher B. A. (2000). Molecular targets and cancer therapeutics: Discovery, development and clinical validation. Drug Resist. Updat. 3 (2), 67–73. 10.1054/drup.2000.0123 [DOI] [PubMed] [Google Scholar]
- Varypataki E. M., Silva A. L., Barnier-Quer C., Collin N., Ossendorp F., Jiskoot W. (2016). Synthetic long peptide-based vaccine formulations for induction of cell mediated immunity: A comparative study of cationic liposomes and PLGA nanoparticles. J. Control. Release 226, 98–106. 10.1016/j.jconrel.2016.02.018 [DOI] [PubMed] [Google Scholar]
- Wang F., Yuan J., Zhang Q., Yang S., Jiang S., Huang C. (2018). PTX-loaded three-layer PLGA/CS/ALG nanoparticle based on layer-by-layer method for cancer therapy. J. Biomaterials Sci. Polym. Ed. 29 (13), 1566–1578. 10.1080/09205063.2018.1475941 [DOI] [PubMed] [Google Scholar]
- Wolff A. C., Hammond M. E., Hicks D. G., Dowsett M., McShane L. M., Allison K. H., et al. (2013). Recommendations for human epidermal growth factor receptor 2 testing in breast cancer: American society of clinical oncology/college of American pathologists clinical practice guideline update. J. Clin. Oncol. 31 (31), 3997–4013. 10.1200/jco.2013.50.9984 [DOI] [PubMed] [Google Scholar]
- Wu J., Deng C., Meng F., Zhang J., Sun H., Zhong Z. (2017). Hyaluronic acid coated PLGA nanoparticulate docetaxel effectively targets and suppresses orthotopic human lung cancer. J. Control. Release 259, 76–82. 10.1016/j.jconrel.2016.12.024 [DOI] [PubMed] [Google Scholar]
- Xiao X. Y., Zhu Y. X., Bu J. Y., Li G. W., Zhou J. H., Zhou S. P. (2016). Evaluation of the neuroprotective effect of thymoquinone nanoformulation in the rodent cerebral ischemia-reperfusion model. BioMed Res. Int., 2016. [DOI] [PMC free article] [PubMed] [Google Scholar]
- Yin L., Duan J. J., Bian X. W., Yu S. C. (2020). Triple-negative breast cancer molecular subtyping and treatment progress. Breast Cancer Res. 22 (1), 61–63. 10.1186/s13058-020-01296-5 [DOI] [PMC free article] [PubMed] [Google Scholar]
- Yuan F., Dellian M., Fukumura D., Leunig M., Berk D. A., Torchilin V. P., et al. (1995). Vascular permeability in a human tumor xenograft: Molecular size dependence and cutoff size. Cancer Res. 55 (17), 3752–3756. [PubMed] [Google Scholar]
Associated Data
This section collects any data citations, data availability statements, or supplementary materials included in this article.
Data Availability Statement
The raw data supporting the conclusion of this article will be made available by the authors, without undue reservation.