Abstract
Ageing is the largest risk factor for many chronic diseases. Studies of heterochronic parabiosis, substantiated by blood exchange and old plasma dilution, show that old-age-related factors are systemically propagated and have pro-geronic effects in young mice. However, the underlying mechanisms how bloodborne factors promote ageing remain largely unknown. Here, using heterochronic blood exchange in male mice, we show that aged mouse blood induces cell and tissue senescence in young animals after one single exchange. This induction of senescence is abrogated if old animals are treated with senolytic drugs before blood exchange, therefore attenuating the pro-geronic influence of old blood on young mice. Hence, cellular senescence is neither simply a response to stress and damage that increases with age, nor a chronological cell-intrinsic phenomenon. Instead, senescence quickly and robustly spreads to young mice from old blood. Clearing senescence cells that accumulate with age rejuvenates old circulating blood and improves the health of multiple tissues.
Cellular senescence is a response to stress and damage that increases with age1,2. Senescent cells (SnCs) enter a permanent growth arrest2 and release the senescence-associated secretory phenotype (SASP)3. The SASP promotes age-related phenotypes and pathologies in a paracrine manner when cells are damaged with radiation or chemicals before transplantation4,5, but the effects of physiologic SnCs of old mammals are ill defined with respect to their systemic influences.
Heterochronic parabiosis (the surgical joining of young and old mice, in which blood, organs and environments are shared) rejuvenates old tissues while ageing young tissues6–15. Similar phenotypes are observed on direct infusion of plasma, and a few systemic factors have been suggested to be pro-rejuvenative or pro-ageing10–18. In our experiments using heterochronic blood exchange without organ sharing, the negative influence of the aged circulation was as great as, or more than, the benefits of young circulation, particularly for the liver and brain8. While several tissues were studied in blood heterochronicity experiments, an unanswered question is whether and to what extent cellular senescence plays a role in the transfer of physiological ageing phenotypes8. Namely, parabiosis entails a combination of blood sharing, organ sharing (better oxygenation, normalized blood pressure, nutrition and so on) and environmental sharing (exercise by running next to the joined partner, visiting food and water, environmental enrichment and so on). Cell injections are different from systemic influences in many parameters, including cell damage and death from shearing, poor vascularization of the transplanted cells, the niche-cell mismatch in extracellular matrix, tensegrity and so on. Inducing senescence in culture before transplantation (by irradiation and so on) also differs from in vivo induction, which is poorly understood. Here, we explore and comprehensively establish the effects of SnCs that are induced by normal ageing and circulate in old mice on the systemic induction of senescence and ageing in young animals.
Cellular senescence is a response to both extrinsic and intrinsic signals. Senescence inducers include genomic damage, mitochondrial dysfunction, metabolic imbalances and strong mitogenic signals delivered by activated oncogenes2,19. SnCs cease proliferation and develop a multi-faceted SASP3. SnCs increase with age20–22, and so the SASP might contribute to the aged systemic milieu. In addition, SnCs, at least partly through the SASP, can induce secondary senescence5, that is, a senescence response in nearby non-senescent cells, raising the possibility that SnCs in aged animals might transfer senescence to young animals without chronological ageing. To test this idea, we used plasma from humans and mice, and blood transfer from old to young mice, to analyse the effects of SnCs in culture and in vivo.
To determine the pro-ageing effects of aged systemic environments, we cultured non-senescent primary human and mouse cells in the presence of serum from young or old mice or plasma from young or old individuals (Fig. 1a). For the mouse experiments, we used mouse dermal fibroblasts (MDFs) from our recently developed p16-3MR mouse, which features functional domains of Renilla luciferase under control of the senescence-sensitive p16INK4a promoter23. Compared to serum from young mice (4 months old), serum from old mice (32 months old) (1) increased expression of the senescence up-regulated genes Cdkn2a, Cdkn1a and SASP factors Il6 and Mmp3, and decreased expression of the senescence down-regulated gene Lmnb1 (Fig. 1b), (2) up-regulated senescence-associated β-galactosidase (SA-β-gal) (Fig. 1c,d), (3) reduced cell proliferation, as measured by 5-ethynyl-2′-deoxyuridine (EdU) incorporation (Fig. 1c,e), (4) a significant loss of laminB1 and nuclear high-mobility-group box1 (HMGB1) (Fig. 1f,g) and (5) p16INK4a promoter driven luciferase (Fig. 1h) activity in non-senescent MDFs. Notably, the induced senescent phenotypes in MDFs treated with serum from old mice were comparable to those induced by a 50:50 mixture of young and old mouse serum (Extended Data Fig. 1), suggesting that old mouse serum is dominant in this assay. These findings demonstrate that senescent phenotypes can be transferred to non-senescent MDFs by serum from old mice.
Fig. 1 |. Transfer of senescence by the old circulatory milieu in mouse and human cell cultures.
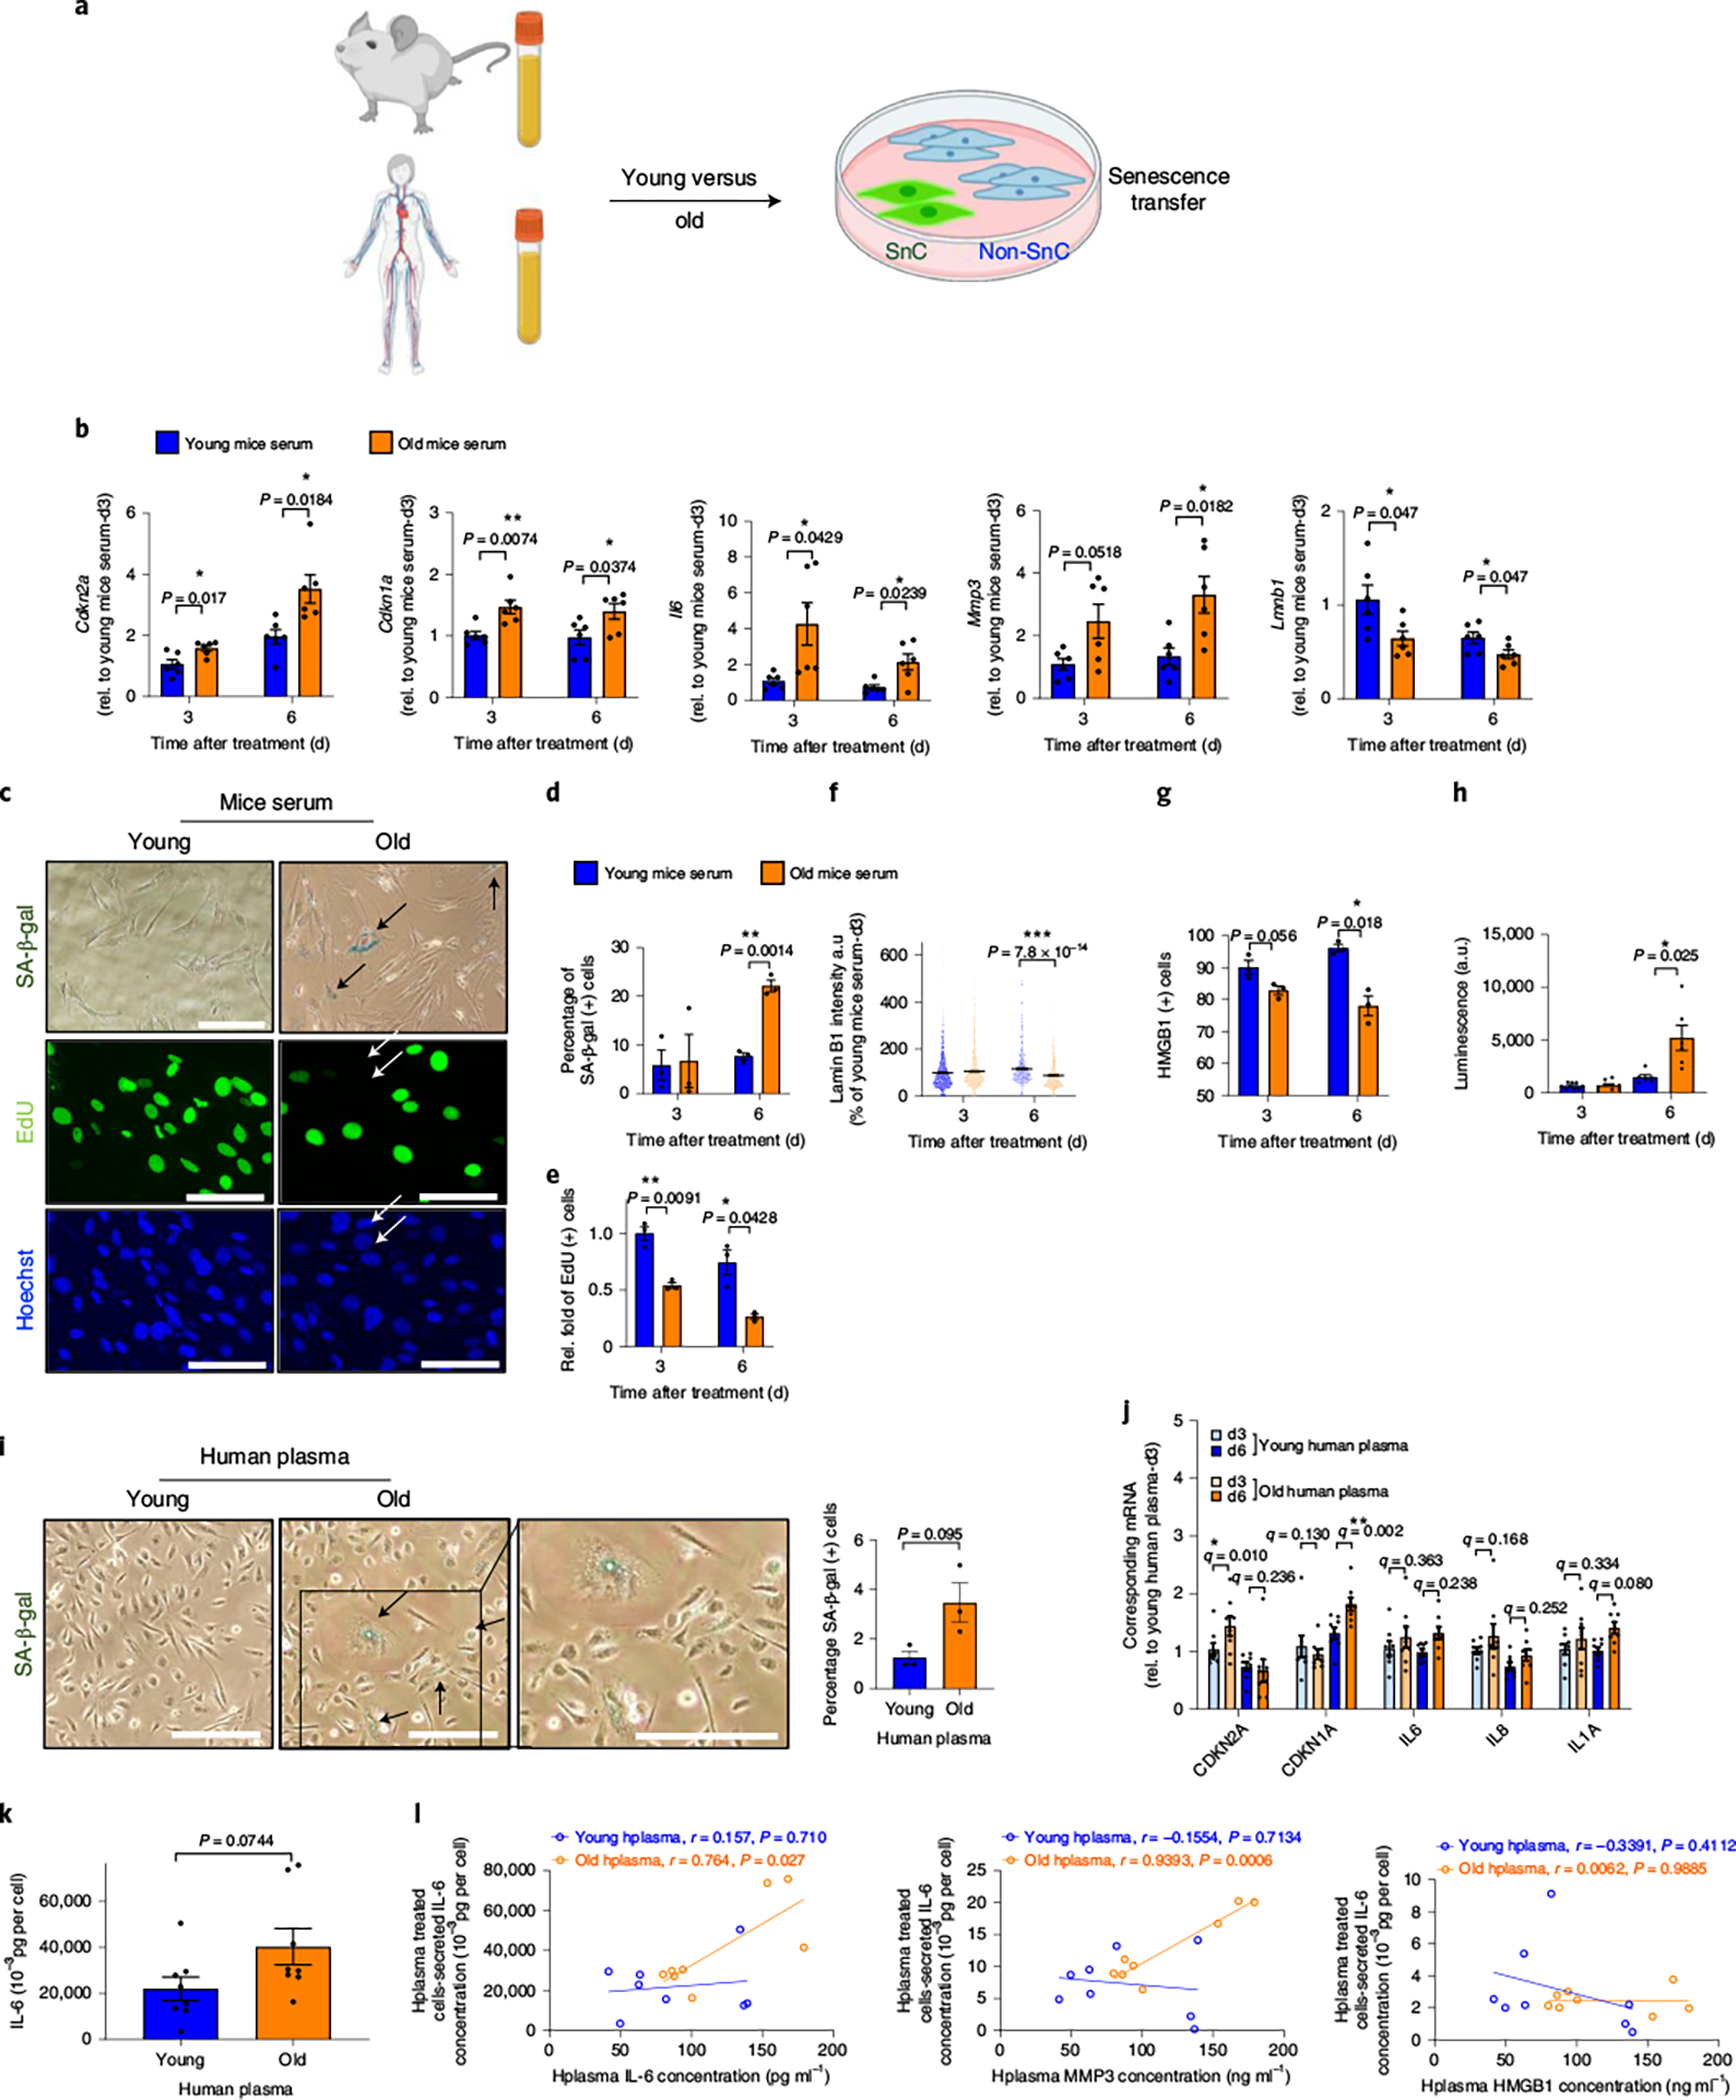
a, Outline of the studies. b, mRNA levels of Cdkn2a, Cdkn1a, Il6, Mmp3 and Lmnb1, normalized to Actb and Tub mRNA (n = 6 for each group). c, Representative SA-β-gal staining (SA-β-gal+ SnCs in arrows; n = 3 per group/three images per n), EdU (green, EdU negative non-proliferating SnCs in arrows; n = 3 for each group/5–6 images per n) and Hoechst labelled nuclei (blue). Scale bar, 100 μm. d–g, Quantification of the percentage of SA-β-gal+ cells (d), EdU+ cells (e), Lamin B1 levels, with around 1,000 cells (f) and HMGB1+ cells (n = 3 per group; at least 100 cells were counted) in MDFs 3 or 6 days after culturing in young or old mouse serum (g). h, Bioluminescence from p16-3MR-expressing cells in non-senescent MDFs cultured in serum from either young or old mice for 3 (n = 9 for each group) or 6 days (n = 6 for each group). i, Representative SA-β-gal staining (left; + cells are marked with arrows; n = 3 for each group/5–6 images per n) and percentage of SA-β-gal+ cells (right). j, Gene expression of senescence and SASP markers in human renal epithelial cells cultured with young or old human plasma for 3 or 6 days (d3 or d6; n = 8 per group). k, IL-6 level secreted by human renal epithelial cells treated with young or old human plasma for 6 days (n = 8 per group). l, Pearson correlation of secreted IL-6 levels by human renal epithelial cells treated with young or old human plasma and IL-6, MMP-3 and HMGB1 levels in human plasma (Pearson correlation coefficient and P are shown in the figures). Data are means ± s.e.m. of biologically independent samples. Statistical significance was calculated using a two-tailed t-test with a Welch’s correction (b,d–i,k) (*P < 0.05; **P < 0.01) and two-way ANOVA followed by two-stage step-up method by Benjamini, Krieger and Yekutieli, FDR < 0.05 (*q < 0.05; ** q < 0.01) (j). Rel, relative. Scale bars, 100 μm.
The transfer of senescence by an aged circulatory milieu also appeared to be conserved between mice and humans but this transfer was cell and tissue-specific as it did not pertain to all cell types (for example, lung fibroblasts or mammary epithelial cells) or all markers (for example, IL-8) (Supplementary Fig. 1). Namely, when human primary renal epithelial cells were cultured with human plasma from either young (20–30 years) or old (60–70 years) individuals, multiple markers of senescence (SA-β-gal activity, CDKN2A, CDKN1A and IL1A messenger RNAs and secreted IL6) were induced, or trended towards induction, within 6 days by plasma from old, but not young, individuals (Fig. 1i–k). We sought to determine the relationship between circulating levels of IL-6, MMP-3 and HMGB1, classic SASP factors in multiple senescent cell types, for ability to induce senescence (Fig. 1l). The IL-6 and MMP-3 levels in aged human plasma correlated with secreted IL-6 levels by human renal epithelial cells treated old human plasma, suggesting that one such circulating SASP factor at least can mediate the transfer of senescence by an aged circulatory milieu.
To determine whether an aged systemic milieu induces a senescence response in trans in vivo, we used our well-controlled small animal blood exchange (homogenous transfusion) procedure8. We performed heterochronic blood exchanges between young (3 months old) p16-3MR and old (22–24 months old) C57BL/6J mice, with control isochronic exchanges performed between young p16-3MR and young C57BL/6J mice (Fig. 2a). We monitored bioluminescence of the p16-3MR reporter to determine whether and when old blood might systemically induce senescence in young p16-3MR mice. Then 14 days after blood exchange, we detected a significant increase in whole-body bioluminescence in young p16-3MR mice that received blood from old C57BL/6J mice (YO cohort), compared to isochronically exchanged young C57BL/6 mice (YY cohort) (Fig. 2b).
Fig. 2 |. An aged systemic milieu induces senescence transfer in multiple young tissues.
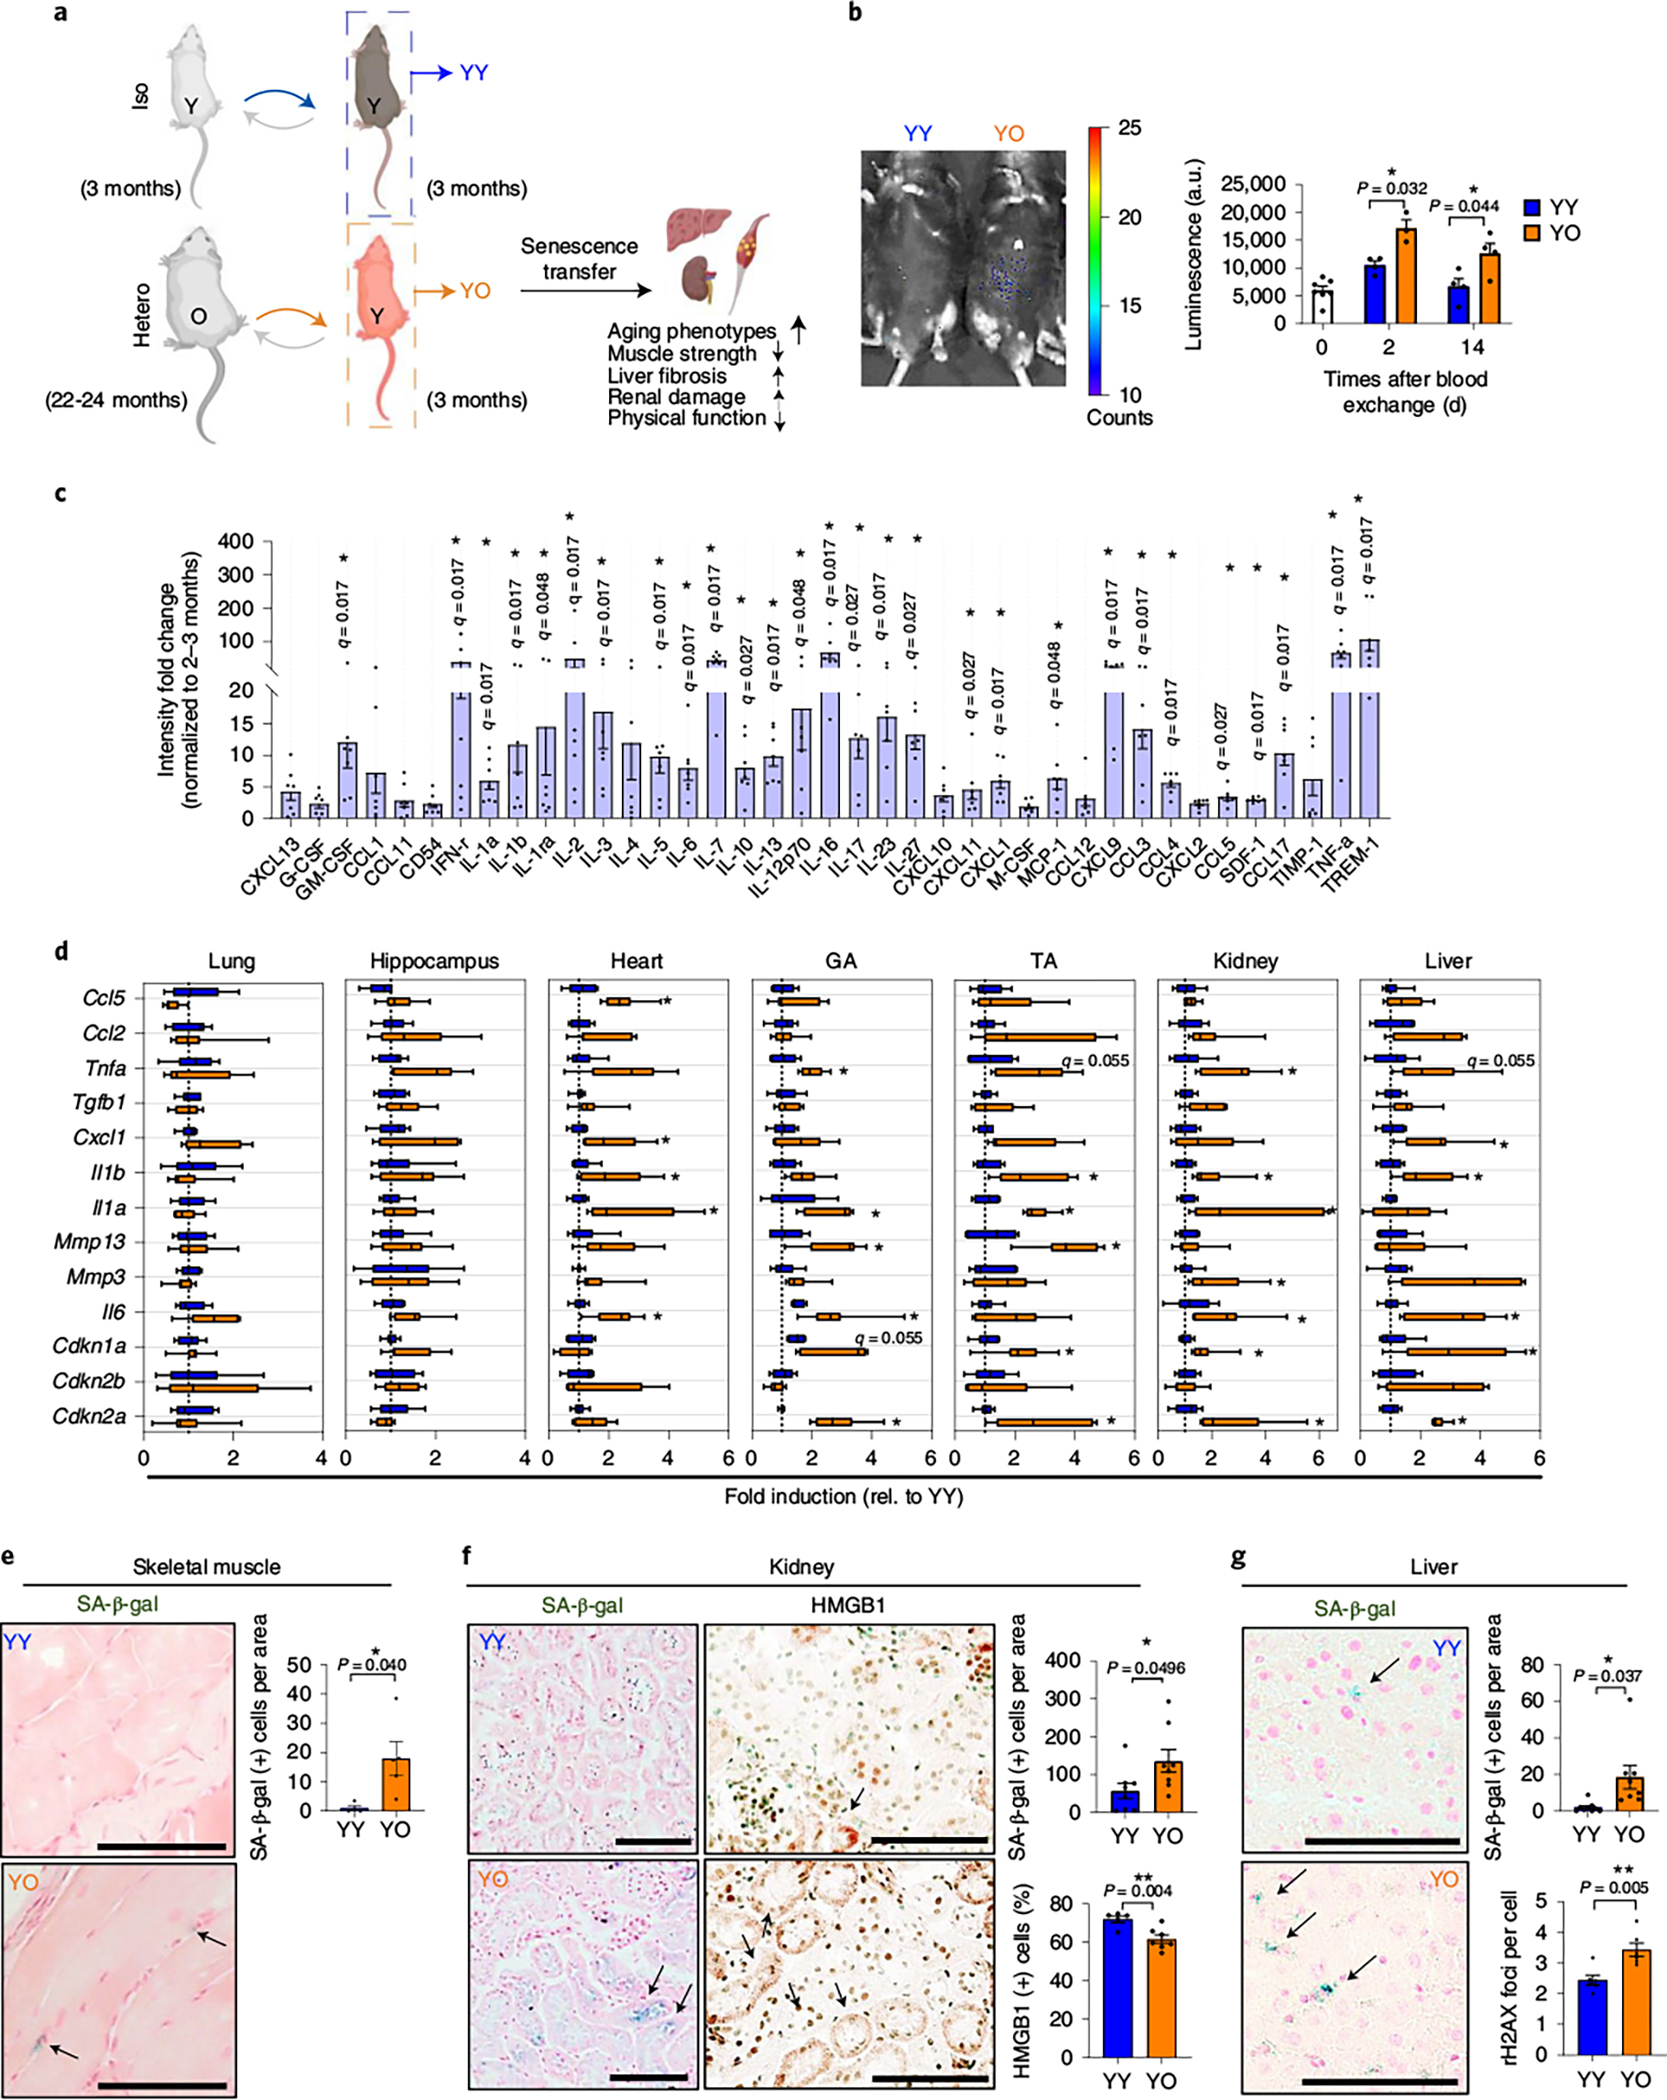
a, Experimental setup for heterochronic blood exchange. b, Luminescence images of young p16-3MR mice receiving young blood from C57BL/6J mice (YY) and young p16-3MR mice receiving old blood from C57BL/6J mice (YO) 14 days after blood exchange (left) and quantification of the luminescence (right) (in arbitrary units, a.u.) (n = 7, 4, 3, 4 or 4 mice). c, Ratio of circulating SASP proteins (>1.5-fold) of old mouse blood (n = 7) normalized to young mouse blood (n = 3) measured by antibody array. d, Gene expression of the senescence and SASP markers in lung, hippocampus, heart, skeletal muscles (gastrocnemius (GA) and tibialis anterior (TA)), kidney and liver (n = 6 for YY; n = 7 for YO). Whisker plots represent the 10th and 90th percentiles and the line corresponds to the median. e, Representative images of SA-β-gal staining in skeletal muscle (n = 4 for YY and n = 5 for YO; 3–6 images per mouse) and quantification of SA-β-gal+ cells per area of YY and YO mice. Scale bar, 50 μm. f, Representative images of SA-β-gal staining (n = 8 mice for each group/7–10 images per mouse) and HMGB1 immunohistochemistry (n = 5 for YY; n = 7 for YO; 6–10 images per mouse) and quantification of SA-β-gal+ cells per area (n = 8 per group) of kidney sections of YY and YO mice. Scale bars, 100 μm. g, Representative SA-β-gal staining in liver (n = 9 for YY; n = 8 for YO; 7–10 images per mouse) and quantification of SA-β-gal+ cells per area in YY and YO mice and γ-H2AX foci in a hepatocyte (n = 6 per group; 5–8 images per mouse). this experiment was performed three independent times. Scale bar, 100 μm. Data are means ± s.e.m. of biologically independent samples. Statistical significance was calculated using a two-tailed t-test with a Welch’s correction (b,e–g) with *P < 0.05; **P < 0.01 and multiple Mann–Whitney tests with a two-stage linear step-up procedure by Benjamini, Krieger and Yekutieli, with Q = 5%, *q < 0.05 (c,d).
We reasoned that circulating SASP factors present in the old systemic milieu could account for the observed induction of senescence in young recipients of old mice blood. Accordingly, many of the SASP-associated factors (IL-1a, IL-6, CCL5, TNF-a and so on) were significantly increased in plasma from old mice compared to plasma from young mice as determined by cytokine array (Fig. 2c). Analysis of multiple tissues by quantitative PCR with reverse transcription (RT–qPCR) showed that levels of Cdkn2a and Cdkn1a and several SASP component mRNAs, for example, Il6, Mmp13, Il1a and Tnfa, in skeletal muscle (gastrocnemius and tibialis anterior), Il6, Mmp3, Il1a, Il1b and Tnfa in kidney, and Il6, Cxcl1 and Il1b in liver increased significantly, but this was not the case in lung, heart or hippocampus, of the YO compared to the YY cohort (Fig. 2d). The induction of other senescence markers in young tissue by an old circulation was confirmed by increases in SA-β-gal-positive cells and γ-H2AX foci, and decreases in nuclear HMGB1, in skeletal muscle, kidney and liver of young mice (Supplementary Fig. 2 and Fig. 2e–g).
Ageing is associated with multiple molecular, histological and functional alterations in tissues that coincide with the increase in SnCs24. In a paracrine manner, SnCs induced by irradiation in culture, then transplanted into young mice, caused premature ageing phenotypes, an effect not seen when non-SnCs were transplanted25. In agreement with previous studies, transplantation of irradiated cells into young mice caused decreased muscle strength (grip strength) and physical endurance (hanging test, rotarod and treadmill running), as compared to non-irradiated cells (Supplementary Fig. 3).
To examine whether the physiologic process of senescence (natural ageing of mice) transmits tissue ageing to young animals through blood circulation, we performed a series of functional tests of muscle strength (plantar flexors including gastrocnemius, plantaris, soleus muscles) in young mice that received blood from old mice (YO) compared to isochronic blood exchange (YY). The YO group showed decreased maximal twitch force and significantly shorter rates of force development and relaxation during contractions (Extended Data Fig. 2a). These results are consistent with the poor performance of YO mice in a four-limb hanging test8. Providing blood from old to young mice by blood exchange (YO) also significantly increased intramuscular lipid, which was shown to accelerate both age-related atrophy and cellular senescence in muscle26; fibrosis was unaffected, as reported8 (Extended Data Fig. 2b,c). There were also negative effects of the old systemic milieu on physical endurance in young mice, as reflected by increased fatigability and shorter treadmill running distance (Extended Data Fig. 2d,e), but a non-significant difference in lower hanging endurance in young mice (Extended Data Fig. 2f). Of note, 7 days after exchange with old blood, young mice had a diminished four-limb hanging test performance8, suggesting some recovery at 14 days.
In the kidney, exchanging old blood into young mice produced no obvious structural changes, including tubular epithelial cell necrosis, interstitial inflammation and glomerular abnormality, which correlated with no change in blood urea nitrogen or creatine levels in serum (Supplementary Fig. 4a,b). However, the YO (but not the YY) cohort showed increased serum and protein levels of neutrophil gelatinase-associated lipocalin and kidney injury molecule-1 (KIM-1), which are biomarkers for renal proximal tubular damage, and decreased Lotus Tetragonolobus Lectins (LTL)-positive tubular brush borders, a marker of healthy renal tubules27 (Supplementary Fig. 4c,d).
As metrics of liver ageing, we assessed hepatic fibrosis by Sirius Red and Masson’s Trichrome staining for collagen deposition, desmin immunochemistry to assess activated hepatic stellate cells (which promote hepatic fibrosis and cirrhosis) and hepatic dysfunction by serum analysis for alanine transaminase (ALT) and bilirubin28. Fibrotic areas in livers were significantly increased in young mice transfused with blood from old mice, as we previously published8, and was accompanied by an increase in desmin-positive hepatic stellate cells and fibrosis-related mRNAs levels of Col1a1, Col3a1, Col4a1 and Col4a2 (Supplementary Fig. 4f,g). Serum analysis for ALT and bilirubin showed that blood from old mice promoted a decline in liver function in young mice (Supplementary Fig. 4h). Thus, blood from old mice compromised muscle, kidney and liver function in young mice, consistent with and expanding our published findings.
We next asked whether eliminating SnCs in old mice using the senolytic drug combination of dasatinib plus quercetin (DQ)29 abrogated the transfer of senescence and ageing phenotypes to young mice (Fig. 3a). Compared with plasma from vehicle-treated old mice, plasma from DQ-treated old mice show a reduction in many of the same SASP-related factors that are up-regulated in old mouse plasma (compared to young mouse plasma), including IL-1a, IL-1b, CXCL1 and CCL5 (Fig. 3b,c and Extended Data Fig. 3a).
Fig. 3 |. Senolytics blunts the ability of the aged circulation to induce senescence transfer in young kidney and liver tissues.
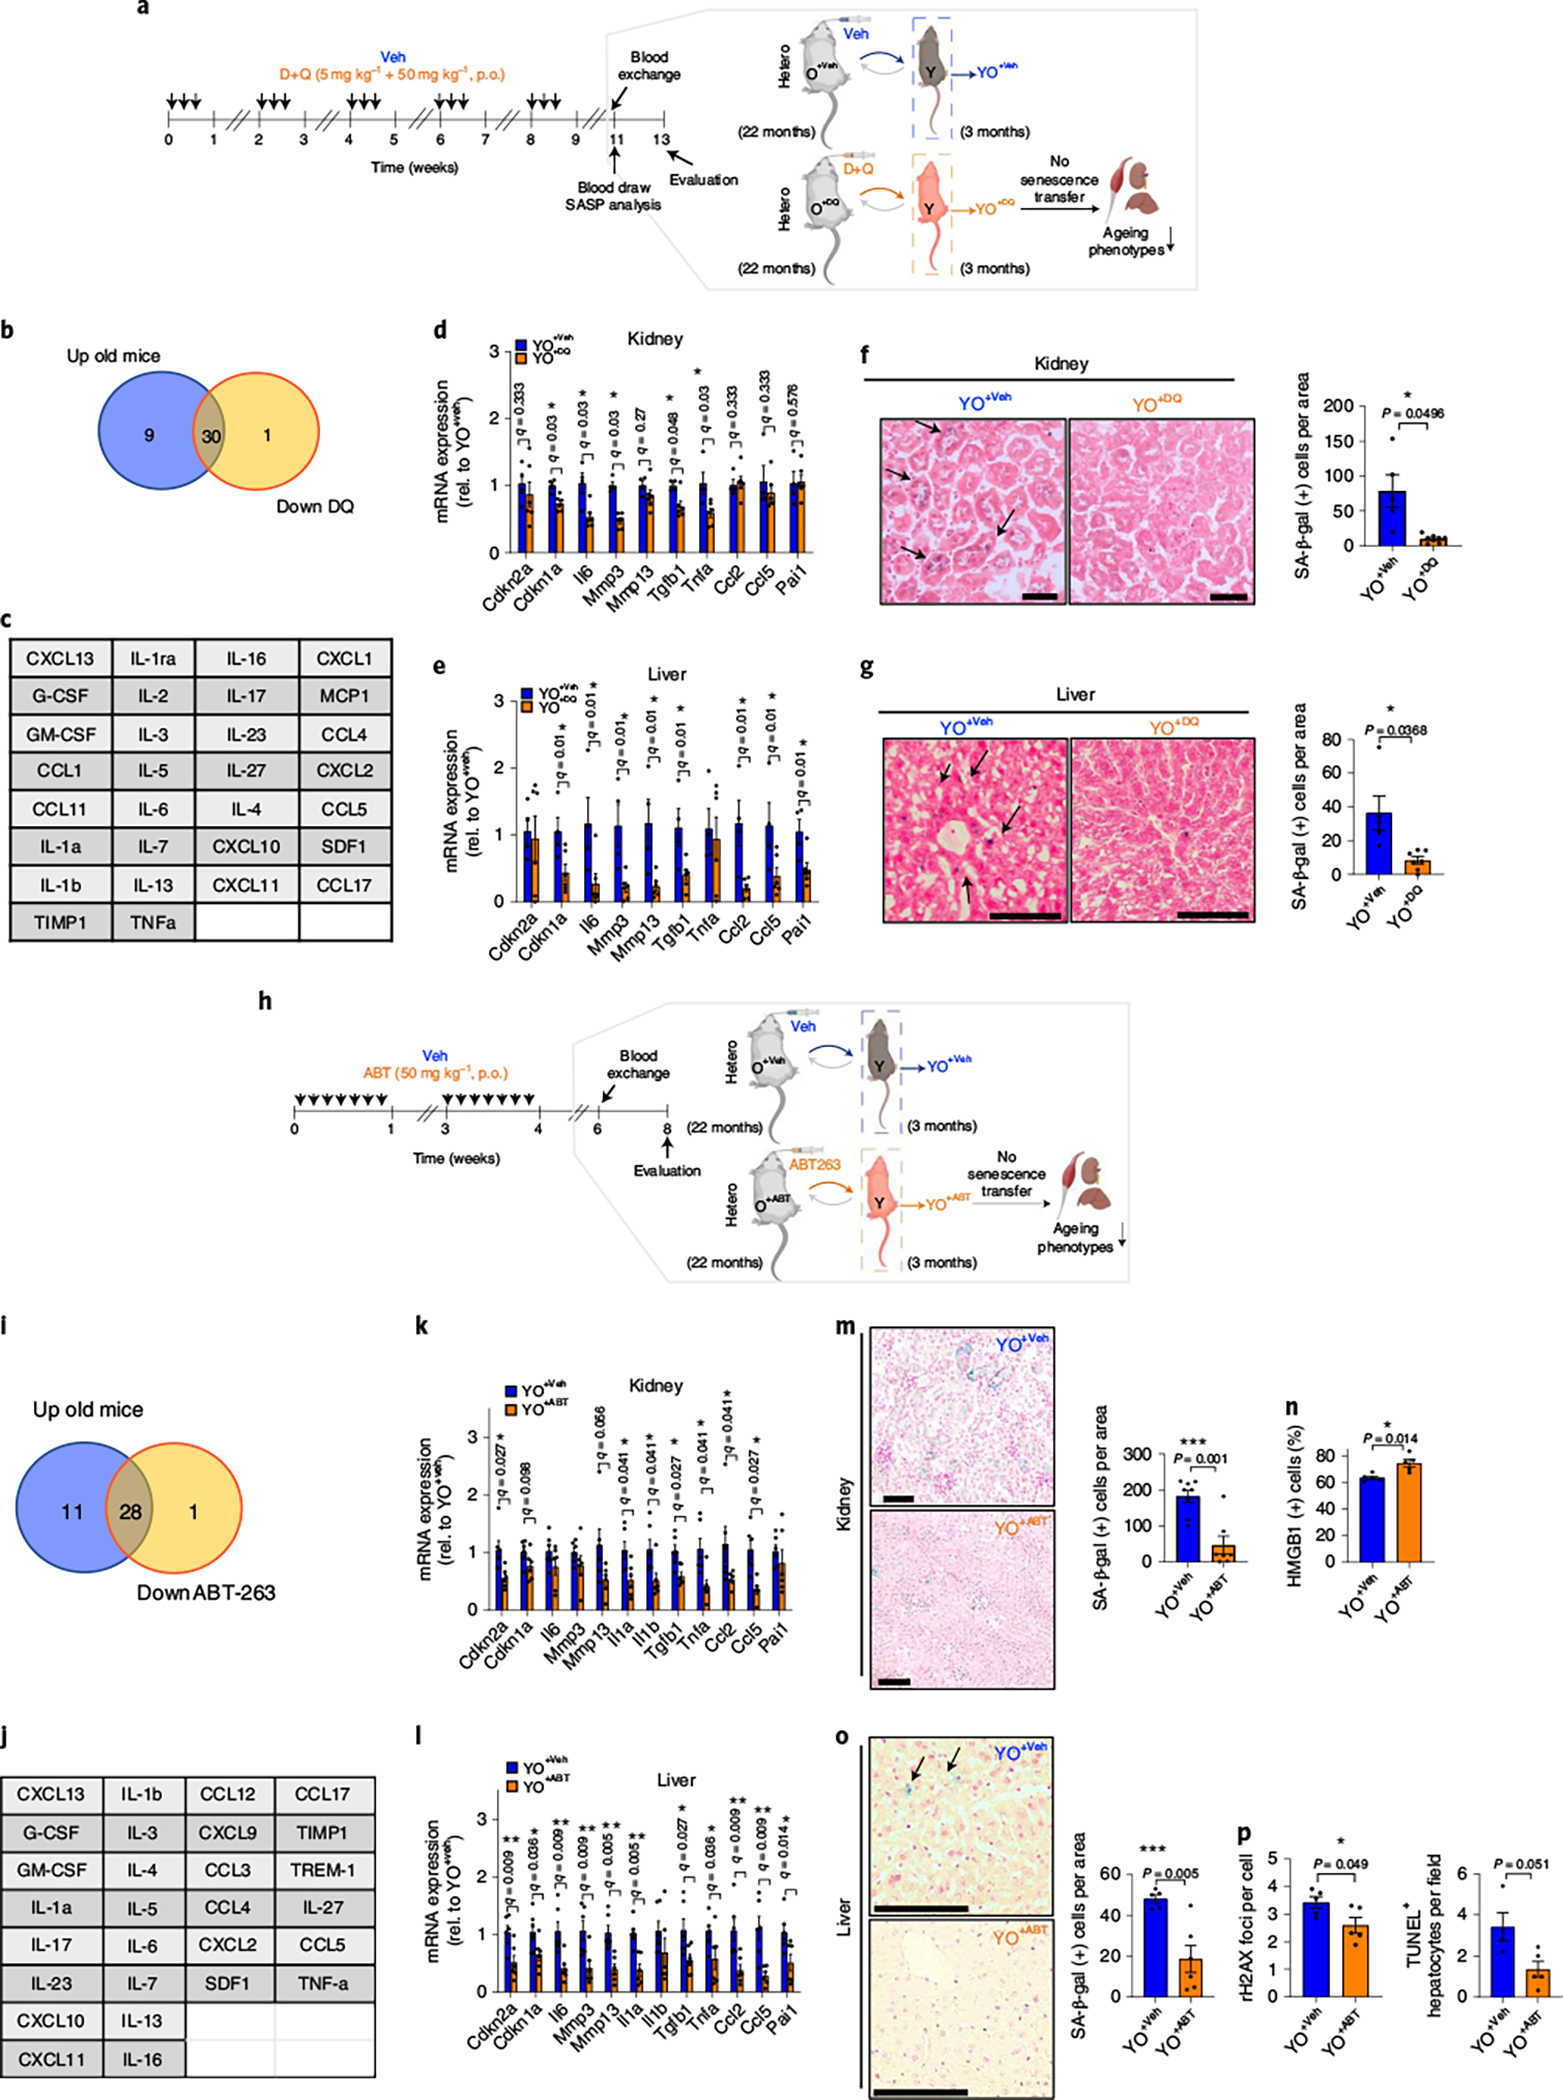
a, Study design used in b–g. b, Venn diagram showing the overlap between up-regulated circulating SASP proteins identified in old versus young mice (>1.5-fold) and down-regulated proteins in vehicle (Veh)-treated versus DQ-treated old mice (<0.7-fold). c, List of overlapping proteins in b. d,e, Senescence/SASP-associated gene expression in kidney (d) and liver (e) of young mice receiving old blood treated with Veh (YO+Veh; n = 4) or DQ (YO+DQ; n = 6). f,g, Representative SA-β-gal staining (n = 5 for YO+Veh; n = 7 for YO+DQ; 10–15 images per mouse) and quantification of SA-β-gal+ cells per area in kidney (f) and liver (g) (n = 5 for YO+Veh; n = 8 for YO+DQ; 7–10 images per mouse). h, Study design used in i–p. i, Venn diagram showing the overlap between up-regulated circulating SASP proteins in old versus young mice (>1.5-fold) and down-regulated proteins in Veh-treated versus ABT263-treated old mice (<0.7-fold). j, List of overlapping proteins in i. k–l, Senescence/SASP-associated gene expression in kidney and liver of young mice receiving old blood treated with Veh (YO+Veh) or ABT263 (YO+ABT) (n = 6 per group). m,n, Representative images of SA-β-gal staining in kidney (n = 8 for YO+Veh; n = 7 for YO+ABT; 6–10 images per mouse) and quantification of SA-β-gal+ cells per area (m) and HMGB1+ tubular cells (n). Scale bar, 500 μm. o,p, Images of SA-β-gal staining in liver (n = 5 for YO+Veh; n = 6 for YO+ABT; ten images per mouse) and quantification of SA-β-gal+ cells per area (o), γ-H2AX foci (n = 5 per group; 6–8 images per mouse) and TUNEL+ hepatocytes (n = 4 for YO+Veh; n = 5 for YO+ABT; 5–9 images per mouse) (p). Scale bar, 100 μm. Two independent experiments were performed. Data are means ± s.e.m. of biologically independent samples. Statistical significance was calculated using multiple Mann–Whitney tests with a two-stage linear step-up procedure of Benjamini, Krieger and Yekutieli, with Q = 5%, *q < 0.05 (d,e,k,l) and a two-tailed t-test with a Welch’s correction (f,g,m–p) with *P < 0.05; **P < 0.01; ***P < 0.001. Rel, relative.
We then performed blood exchanges in young mice but used blood from either vehicle-(YO+Veh) or DQ-treated (YO+DQ) old mice. In kidney and liver, DQ treatment of aged mice prevented the transfer of senescence to young mice, diminishing the mRNA levels of systemically induced Cdkn1a (not Cdkn2a) and the SASP factors, for example, Il6, Mmp3, Tgfb1 and Tnfa in kidney and Il6, Mmp3, Mmp13, Tgfb1, Ccl2, Ccl5 and Pai1 in liver (Fig. 3d,e) and SA-β-gal expression (Fig. 3f,g and Extended Data Fig. 3b,c). This abrogation of SnCs ablation by DQ on the transfer of senescence was replicated in culture (Extended Data Fig. 3d–h). In agreement with studies on the rejuvenating effects of young blood and/or organ exchanges8,30–32, when old mice were exchanged with young blood (Supplementary Fig. 5a), there was decreased acute tubular necrosis, interstitial fibrosis and atrophy, reduced serum KIM-1 and increased LTL-positive renal proximal tubules in kidney (Supplementary Fig. 5b–d). In liver, there was decreased adiposity and fibrosis (Supplementary Fig. 5e–g). Overall, there was increased energy expenditure in the animal (Supplementary Fig. 5h).
Transfusion with blood from DQ-treated old mice (YO+DQ) also reduced renal and serum KIM-1 and counteracted the loss of LTL-positive (healthy) renal tubules in young kidneys in the YO+Veh cohort (Extended Data Fig. 4a–c). However, blood urea nitrogen and creatine levels and renal pathological change were still negatively affected by YO+DQ blood (Extended Data Fig. 4d,e). In the liver, DQ significantly attenuated the negative effects of old blood: fibrosis and adiposity decreased, and pro-fibrogenic gene expression declined (Extended Data Fig. 4f–i).
To substantiate abrogation of pro-geronic influence of old blood on young tissues by senescent cell removal, we performed additional blood exchange studies in young mice but used blood from ABT263 (navitoclax)33,34-treated old mice (Fig. 3h). We first tested whether ABT263 altered SASP factors in the old circulatory system and caused the deleterious effects on young tissue function. We observed a large reduction in the expression of some of the same SASP factors that are up-regulated in the plasma of old mice (compared to that of young mice), including IL-6, CCL5, CCL17, TIMP1 and TNF-a, in plasma from ABT263-treated old mice compared with plasma from vehicle-treated old mice (Fig. 3i,j and Supplementary Fig. 6a). However, ablation of SnCs in old mice by ABT263 did not improve muscle repair, assayed by formation of de novo myofibers, fibrotic indices and minimal Feret diameter (Supplementary Fig. 6b–d), consistent with our findings that in injured muscle many cells with high p16 are de novo myofibers9 and that SnCs are needed for wound healing23. At the same time, the health and function of muscle might be restored by senolytics through better vascularization, enhanced neuro-muscular junctions and/or muscle metabolism, consistent with a previous report24. Finally, we tested the effects of SnC ablation on liver health. ABT263 treatment showed a trend towards reduced liver adiposity (Supplementary Fig. 6e–g).
We then carried out blood exchanges in young mice but used blood from either vehicle-treated (YO+Veh) or ABT263-treated (YO+ABT) old mice (Fig. 3h). Whole-body bioluminescence in young p16-3MR mice that received blood from ABT263-treated C57BL/6J old mice was decreased, compared to young p16-3MR mice that received blood from vehicle-treated C57BL/6J old mice after 14 days after blood exchange (Extended Data Fig. 5a). In kidney and liver, ABT263 treatment of aged mice prevented the transfer of senescence to young mice, diminishing the levels of systemically induced Cdkn2a and Cdkn1a and the SASP factors, for example, Il1a, Il1b, Tgfb1, Tnfa, Ccl2 and Ccl5 in kidney and Il6, Mmp3, Mmp13, Il1a, Tgfb1, Tnfa, Ccl2, Ccl5 and Pai1 in liver (Fig. 3k–l). This abrogating effect of SnCs ablation by ABT263 on the transfer of senescence was replicated in culture (Extended Data Fig. 5b–f). Inhibition of renal senescence in young mice exchanged with blood from ABT263-treated old mice was confirmed by decreased SA-β-gal expression and increased nuclear HMGB1-positive epithelial cells in proximal tubules (Fig. 3m,n and Extended Data Fig. 6a). Further, young livers exposed to the circulatory system from ABT263-treated old mice had significantly fewer SA-β-gal, γH2AX foci and TUNEL positive hepatocytes than those given blood from vehicle-treated old mice (Fig. 3o,p and Extended Data Fig. 6b). Because both SnCs and platelets, but not non-SnCs, are affected by ABT263 and possible connection of nucleotide released by lysed platelets and senescence35,36, we verified the specificity of ABT263 by following blood platelet counts before heterochronic blood exchange. Blood platelets measured 14 days after the last dose of ABT263 by oral gavage were not significantly decreased, compared with vehicle-treated old mice (Supplementary Table 1). Thus, the effects of ABT263 on SnCs and were probably not due to changes in platelets.
Transfusion with blood from ABT263-treated old mice (YO+ABT) also reduced renal and serum KIM-1 and counteracted the loss of LTL-positive (healthy) renal tubules in young kidneys (Extended Data Fig. 6c–e). However, blood urea nitrogen and creatine levels and glomerular sclerosis scores were still negatively affected by O+ABT blood (Extended Data Fig. 6f). In liver, ABT263 significantly attenuated the negative effects of old blood: fibrosis and damage decreased, pro-fibrogenic gene expression declined and activated hepatic stellate cell numbers and liver function became normalized in young animals exposed to blood from ABT263-treated old mice, compared to blood from vehicle-treated old mice. In agreement with the results above and previously published8, there was no significant induction or inhibition of liver adiposity in young mice that were exchanged with the blood from either control or ABT263-treated old animals (Extended Data Fig. 6g–k). These data indicate that eliminating SnCs by ABT263 blunts the ability of an old systemic milieu to induce age-related changes in young tissues.
In skeletal muscle, DQ senolytic that is administered to the old mice before heterochronic blood exchange significantly attenuated the transfer of senescence to young mice, for example, lowering the levels of Cdkn1a and the SASP factors, Mmp3 and Tnfa, in the young gastrocnemius and tibialis anterior muscles (Fig. 4a,b). Similar to DQ, ABT263 treatment of aged mice before the blood transfer decreased the levels of systemically induced Cdkn2a and Cdkn1a, Il6, Tgfb1 and Ccl5 in the young skeletal muscle (gastrocnemius and tibialis anterior) (Fig. 4c,d).
Fig. 4 |. Treatment of old mice with senolytics before the blood exchange attenuates the negative effects on young skeletal muscle.
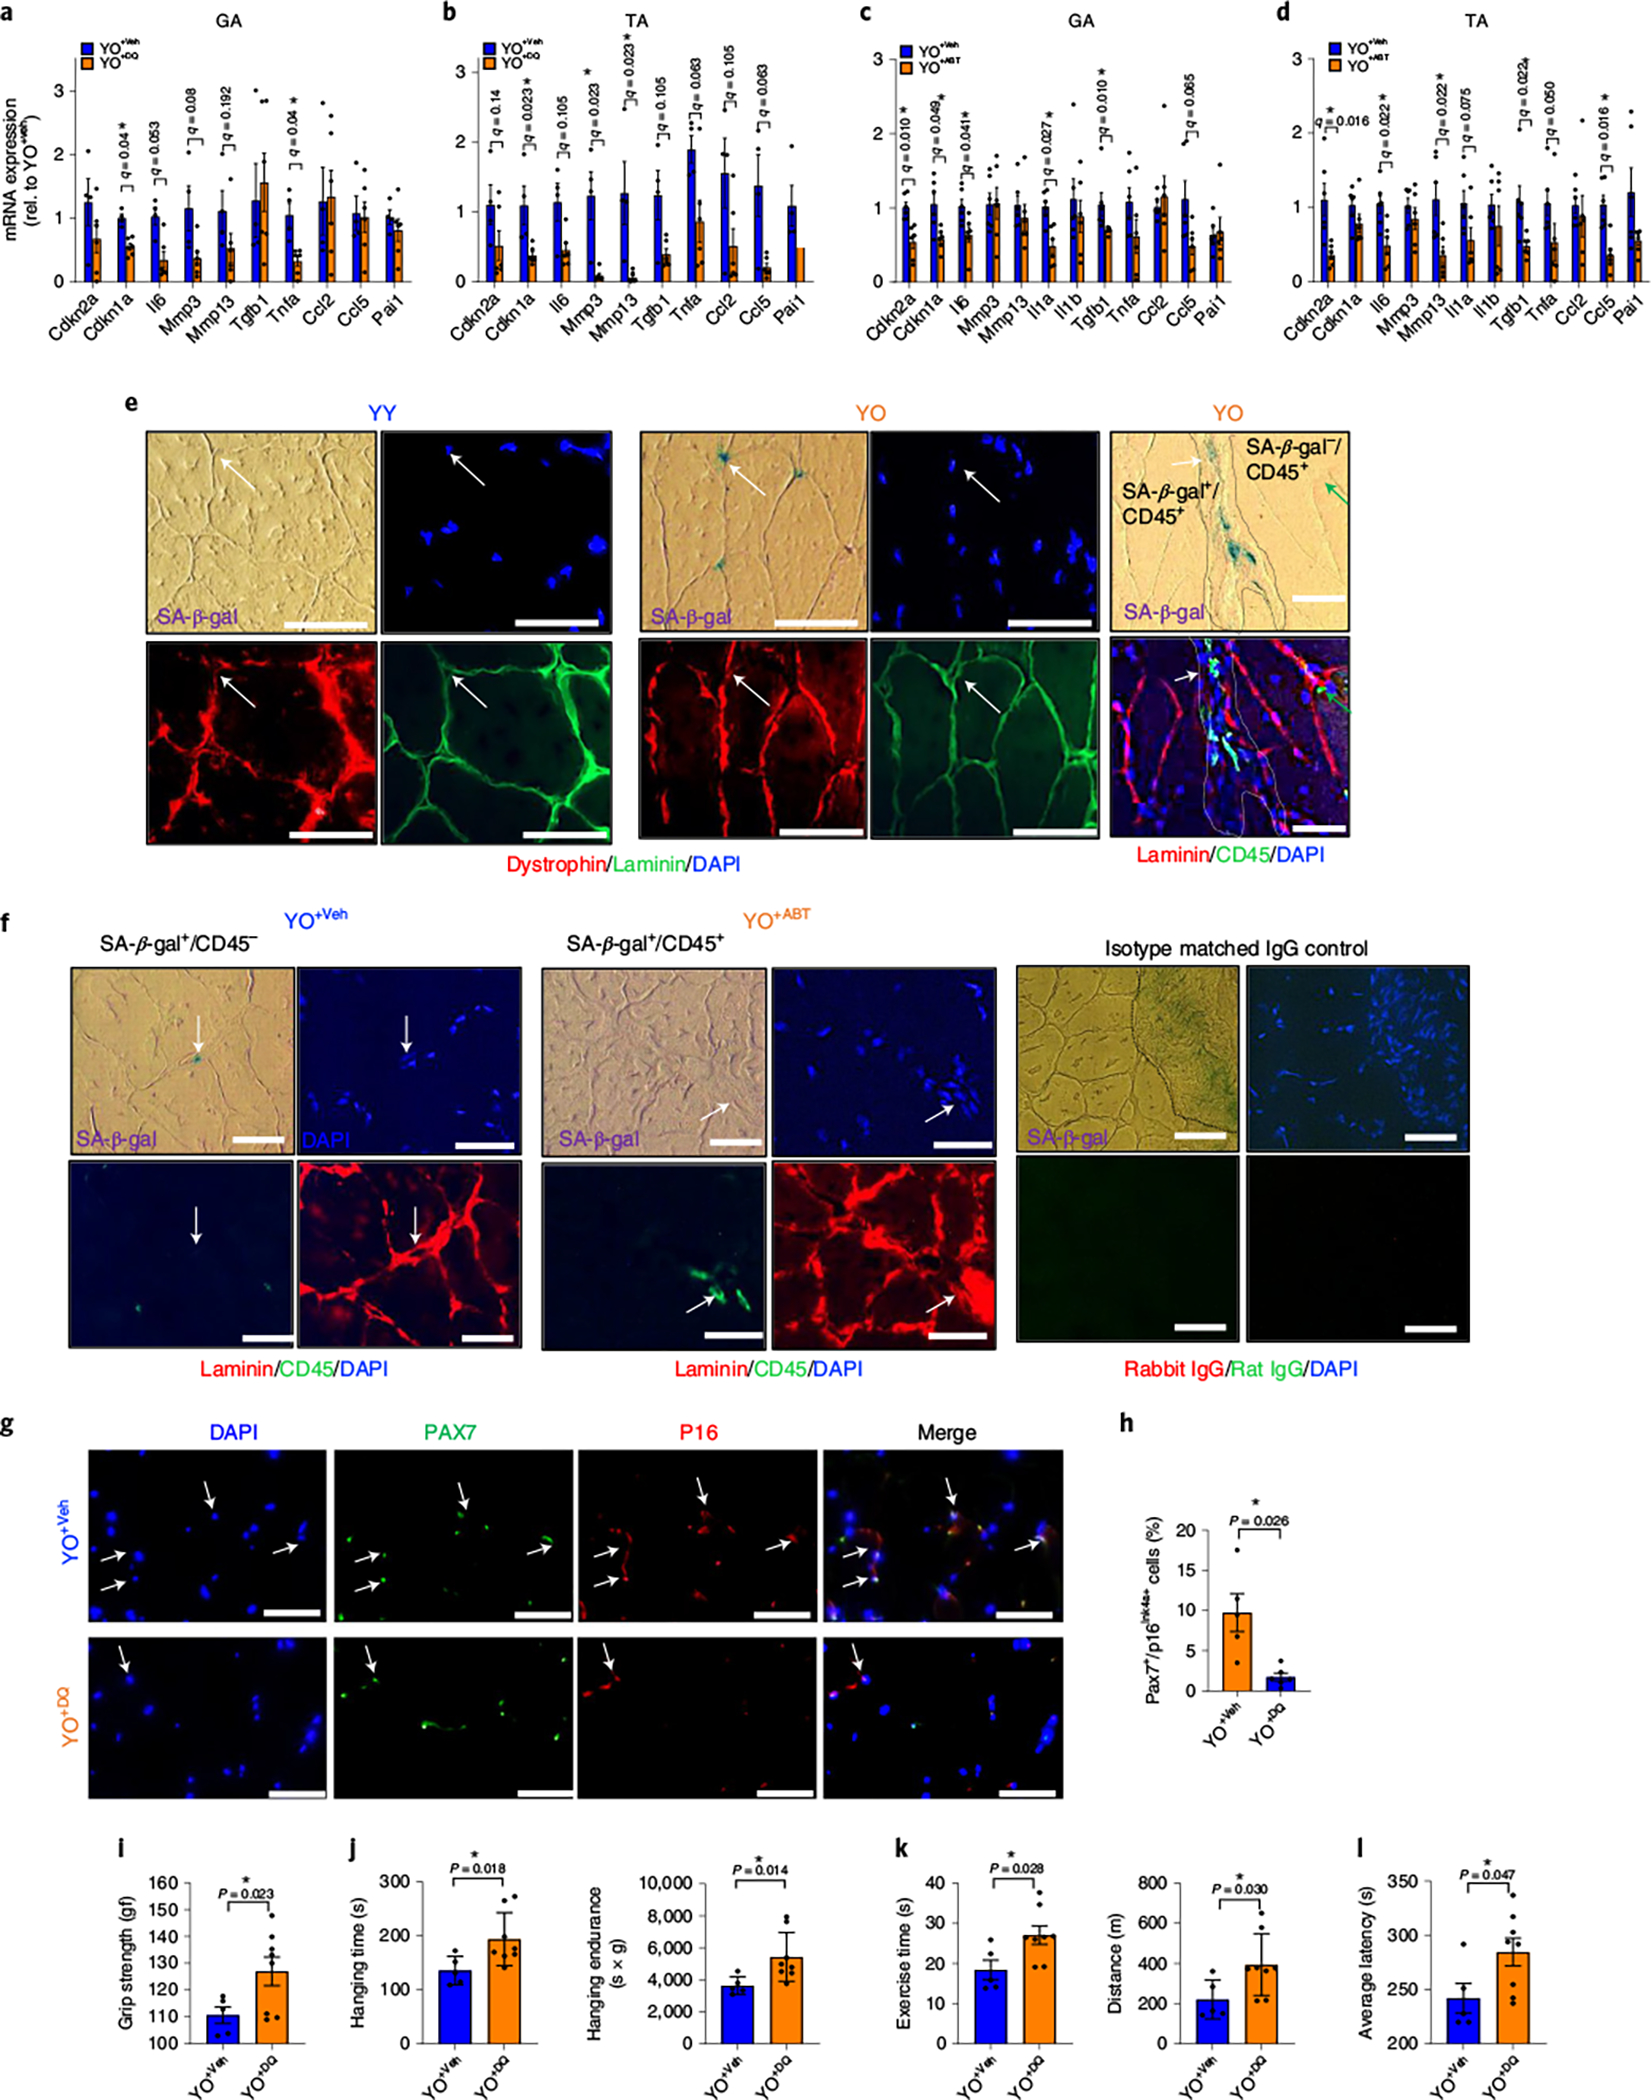
a–d, Expression of senescence and SASP markers by RT–PCR in muscles (gastrocnemius (GA) (a) and tibialis anterior (TA) (b)) of young mice receiving old blood treated with DQ (YO+DQ; n = 6) or vehicle control (YO+Veh; n = 4) and in GA (c) and TA (d) of young mice receiving old blood treated with ABT263 (YO+ABT; n = 6) or vehicle control (YO+Veh; n = 6). e, Representative images of costaining for SA-β-gal/laminin/dystrophin or SA-β-gal/laminin/CD45 (pan-leukocyte marker) in the same section of young skeletal muscle after exchanging blood from either young (YY) or old (YO) C57BL/6J mice (three mice per group/4–5 images per mouse). Arrows point to the same cells in SA-β gal-phase, DAPI and laminin/dystrophin images. In the rightmost panels of e, white arrow points to SA-β gal+/CD45+ cells and green arrow points to SA-β gal−/CD45+ cells in the DAPI and laminin/CD45 images. f, Costaining for SA-β-gal/laminin/CD45 in the same section of (n = 5 mice for YO+Veh; n = 7 mice for YO+ABT/three images per mouse). Isotype matched negative IgG control for these immunofluorescence assays is shown in the rightmost panels; the non-specific fluorescence is minimal to non-existent. g, Immunofluorescence for p16 and Pax7 protein in the muscles of YO+Veh and YO+DQ mice (n = 5 for YO+Veh; n = 7 for YO+DQ/five images per mouse). h, Percentage of Pax7 and p16 double plus cells in g. i–l, Grip strength (i), hang time and endurance (j), treadmill running time and distance (k) and latency time (l) to fall from the rotarod in YO+Veh (n = 5) or YO+DQ (n = 8). All data are expressed as means ± s.e.m. of biologically independent samples and each data point represents an individual mouse. Statistical significance was calculated using multiple Mann–Whitney tests with a two-stage linear step-up procedure by Benjamini, Krieger and Yekutieli, with Q = 5%, *q < 0.05 (a–d) and a two-tailed t-test with a Welch’s correction (h,i–l), with *P < 0.05. Scale bars, 50 μm. Rel, relative.
To examine which cells are induced into senescence in young skeletal muscle through the aged blood circulation and less so when senolytics were used in old mice before the blood exchange, SA-β-gal staining and laminin/dystrophin immunofluorescence (or alternatively, SA-β-gal staining and laminin/CD45 (pan-leukocyte marker) (immunofluorescence)) were performed on the exact same 10 μm muscle cryosection (Fig. 4e). We found that an exchange of young mice with old blood induces senescence of some SA-β-gal+ satellite cells that were located between the laminin + basal lamina and dystrophin-outlined subsarcolemma37,38. As expected, there also were SA-β-gal+ interstitial cells, some of which, but not all, were CD45+ intramuscular leukocytes (Fig. 4e,f). Last, some of the CD45+ intramuscular leukocytes were SA-β-gal+, while others were SA-β-gal− (Fig. 4f). These data indicate that not all in trans SnCs in young muscle are CD45+ cells from the old blood.
To confirm and extrapolate the important conclusion on the in situ senescence of young satellite cells by old blood, we performed quantitative p16/Pax7 immunofluorescence assay on the muscle cryosections. Numerous p16+/Pax7+ senescent satellite cells were found in young muscles of the mice that were exposed to the circulatory system from Veh-treated old mice (YO+Veh cohort) (Fig. 4g). We also found that DQ and ABT263 treatment of the old mice before the heterochronic blood exchanges attenuated the numbers of these young in trans SnCs (Fig. 4f,g). Taken as whole, these results indicate that old blood induces and senolytics administered to the old mice before heterochronic blood exchange reduce the numbers of senescent satellite cells and senescent muscle interstitial cells in young mice. It is difficult to say whether CD45+ SnCs come from the old mice or are the young, senesced leukocytes, but their elimination by senolytic treatment of the old mice before heterochronic blood transfusion is interesting, in any case.
Further, like previous studies on the rejuvenative properties of young blood, when old mice were exchanged with young blood, there was decreased accumulation of intramuscular lipid and fibrosis, diminished fatigability and improved muscle endurance (Extended Data Fig. 7a–e). Eliminating SnCs from old mice by DQ and ABT263 in the old mice before the blood transfer also abrogated the negative effects of old blood on the muscle function in young mice. Namely, YO+DQ muscles showed the reduction in muscle strength and physical endurance in young mice from old blood (Fig. 4i–l). Eliminating SnCs from old mice by ABT263 showed a trend towards increased force and rate of force generation and relaxation during contractions compared to YO+Veh muscles (Extended Data Fig. 7f). This improvement in muscle function in YO+ABT compared to YO+Veh mice correlated with less intramuscular lipid (Extended Data Fig. 7g). Functionally, a treadmill exhaustion test showed that the YO+ABT cohort ran greater distances than the YO+Veh cohort (Extended Data Fig. 7h). This improvement could be due to improved physical ability, metabolism or food intake. Metabolic cage measurements showed that energy expenditure (night) was significantly higher in the YO+ABT, compared to the YO+Veh, cohort. However, metabolic rate (respiratory quotient) and food and water intake were comparable between these cohorts (Extended Data Fig. 7i).
These findings indicate that SnC clearance attenuates the negative effects of old blood on energy balance and on the impairment of physical activity. All experiments shown in this paper demonstrate that an exchange with old blood induces senescence in young skeletal muscles—specifically in satellite cells and muscle interstitial cells—and this phenomenon negatively affects skeletal muscle tissue function. Moreover, this in trans senescence is attenuated by DQ or ABT263 senolytic drugs, concomitant with attenuated pro-geronic influences of old blood on young mice.
Considering the robust positive effects of SnC elimination on reducing the transfer of senescence and ageing phenotypes, we analysed proteins in sera from YO+Veh and YO+ABT mice, and YY and YO mice, using a Luminex array. Compared to serum from young mice receiving blood from vehicle-treated old mice, serum from young mice receiving blood from ABT263-treated old animals showed decreased levels of chemokines (for example, CXCL10 and CCL5), pro-inflammatory cytokines (for example, IFN-a and IL-2), anti-inflammatory cytokines (for example, IL-5) and TGF-β (which inhibits tissue repair when age-elevated9,39) (Extended Data Fig. 8a). CXCL1, CCL3, and IL-6 and -5 increased in serum of YO mice compared to YY mice (Extended Data Fig. 8b). IL-5 was higher in YO mice than YY mice, but was reduced in YO+ABT compared to YO+Veh mice (Extended Data Fig. 8c). Together, these findings suggest that SnC clearance diminishes the negative effects of the aged systemic milieu on young tissues from heterochronic blood exchange.
The rejuvenating effects of a young systemic milieu on old tissues prompted us to test whether the systemic milieu from young or old mice in which SnCs were cleared could induce similar effects. Blood from ABT263-treated young mice trended towards decreased senescence markers in skeletal muscle, liver and kidney and increased muscle force in young mice, given the small number of animals in this study (Extended Data Fig. 9). This result indicates synergy between SnCs elimination and the young systemic milieu on tissue function in young mice. However, compared to old animals receiving blood from vehicle-treated old mice (OO+Veh), blood from ABT263-treated old mice (OO+ABT) did not reduce senescence markers, including mRNA levels of Cdkn2a, Cdkn1a and SASP factors (Il6, Mmp3, Mmp13, Il1a, Cxcl1, Tnfa) (Extended Data Fig. 10a,b), nor did it reverse the loss of muscle strength, renal damage, liver fibrosis and lack of physical endurance (Extended Data Fig. 10c–i). These findings indicate there are senescence-unrelated factors in the old systemic milieu (Extended Data Fig. 10j), which agrees with the side-by-side comparison between the dilution of old plasma and the administration of ABT263 senolytic to old mice2.
While the potential for rejuvenation through young blood factors has been explored, the ability of physiologic SnCs to accelerate ageing and senescence in vivo, in general or through the circulation, are new models. The findings of this work are supported by rejuvenation through old plasma dilution6,7, and they suggest the use of senolytics to prevent systemic propagation of senescence, to better understand ageing and to develop rational therapies for a longer health span. The potential contributions of SnCs to age-related pathology through the circulation have been questioned40. Here, however, we show that natural old-age SnCs are an important mechanism by which the old systemic milieu propagates ageing, at least in the muscle, kidney and liver. Such in trans effects can take place even in young mice, before chronologic cell-intrinsic pro-geronic changes and without damaging agents, such as radiation. This transfer of senescence appears to be conserved between mice and humans, at least in culture, and it is confirmed by the attenuation of the in trans senescence when SnCs are ablated before to the delivery of old blood to young mice. But a limitation of this study is the use of solely male mice to avoid increased variability caused by daily hormonal changes.
Regarding the specifics of SnC ablation, p16INK4a is not a sole marker of senescence. SnCs have been recently shown to be highly heterogeneous; further, some young differentiating cells express p16 (refs. 41–44). Thus, ganciclovir in p16-3MR mice would be less definitive of the phenomenon, compared to the use of broadly acting senolytics that act through different pathways and eliminate SnCs regardless of their markers, for example as done in current study.
It is yet to be determined whether soluble molecules, exosomes, SnCs themselves or a combination of these factors are responsible for the observed transfer of senescence. On the basis of comparative proteomics, one systemic pro-geronic determinant is probably TGF-β1, in agreement with a report showing rejuvenation of multiple old tissues by an inhibitor of the TGF-β/pSmad pathway9,17. This work expands our understanding of senescence in vivo, showing that it is systemically transferable to intrinsically young healthy mice, and suggests that targeting SnCs may complement therapeutic strategies that are based on blood heterochronicity.
In summary, using heterochronic blood exchange, we report a transfer of physiologic senescence from old to young mice. This response is unrelated to experimental cell damage (irradiation and so on), or to chronological age—cumulative intrinsic tissue damage. It acts in trans and it is concurrent with the transfer or acquisition of ageing phenotypes in young skeletal muscle, kidney and liver. The removal of SnCs in old animals attenuates such in trans senescence, partly recapitulating the enhancement of tissue health seen after exchange with young blood. Overall, mammalian ageing appears to be driven by the excess of systemic factors that include SASP, and the attenuation or removal of these factors is expected to yield new therapeutic strategies for health span extension.
Methods
Mice and drug treatments.
Young (3 months old) male C57BL/6J mice were purchased from the Jackson Laboratory and Central Lab Animal Inc. The 13-month-old male C57BL/6J were from the ageing research facility of the Korea Basic Science Institute and 18-month-old male C57BL/6J mice were from the National Institute on Aging. p16-3MR transgenic mice (C57BL/6J) were generated as described23 and bred in the animal facility at the Buck Institute for Research on Aging. Mice were maintained on a standard chow diet in alternating 12/12 h light/dark cycles (6:00–18:00, light) at 20–22.2 °C. The experimental protocol was approved by and performed in accordance with protocols from the Institutional Animal Care and Use Committee at the Buck Institute (A10174), UC Berkeley (AUP-2016-07-8963) and Korea University of College Medicine (KOREA-2020-0168). All mice were randomly assigned to control or treatment groups. For drug treatments, 22–24-month-old male C57BL/6J mice were treated with vehicle, ABT263 (APExBIO, A3007) or dasatinib (Sigma, D33072G) plus quercetin (Sigma, Q4951) diluted in 10% ethanol, 30% polyethylene glycol 400 (Sigma, 807485) and 60% Phosal 50 PG (Medchem Express, HY-Y1903). ABT263 was administered by gavage at 50 mg per kg body weight per day (mg kg−1 d−1) for 7 d per cycle for two cycles with a 2-week interval between cycles. Dasatinib (5 mg kg−1 d−1) and quercetin (50 mg kg−1 d−1) were administrated by oral gavage for 3 d per cycle for five cycles with a 1-week interval between cycles.
Blood exchange.
All blood exchanges with either vehicle- or DQ-treated old C57BL/6J mice as well as either vehicle- or ABT263-treated C57BL/6J mice were performed 14 days after the last drug treatments, as described8. A venous catheter was inserted in the right jugular vein. Using a 10-ml Hamilton syringe, 10 μl of catheter locking solution containing 500 units per ml lithium heparin in 90% glycerol and 10% phosphate-buffered saline (PBS) were introduced into the catheter to prevent clot formation. The animals were allowed to heal for 24 h and then were immobilized with isoflurane anaesthesia at 1% concentration. The locking solution was removed from the catheters and a bolus of PBS containing 0.5 units per ml lithium heparin was administered IV at 100 units per kg and were connected to our blood exchange apparatus. Briefly, 150 μl of blood was transferred from one mouse to another 15 times with a 30 s delay between transfusions to yield approximately 90% homogenization of blood between the two mice.
Bioluminescence.
p16-3MR mice were injected intraperioneally with 15 μg of Xenolight RediJect Coelenterazine h (Perkin Elmer, 760506). After 25 min, the mice were anaesthetized with isoflurane and luminescence measured using a Xenogen IVIS-200 Optical imaging System (Caliper; 5 min, medium binning). For cell culture experiments, a Renilla Luciferase Assay System (Promega, E2820) was used according to the manufacturer’s protocol, and luminescence intensity was measured using a plate reader (EnSpire Alpha 2390, Perkin Elmer).
Tissue isolation.
For histology, tissue isolation was performed post mortem, and muscle, liver, kidney, lung, heart and brain were snap frozen in isopentane (−70 °C) and embedded in tissue-tek optimal cutting temperature (OCT) (Sakura Finetek, 4583). To extract RNA, the tissues were dissected, immediately transferred to liquid nitrogen and then pulverized with a cryoPREP automated dry pulverizer (Covaris, CP02).
Mouse serum and plasma isolation.
Blood from young (4 months old) or old mice (32 months old) was collected by cardiac puncture using a 1-ml syringe with 22-gauge needle. Serum was prepared by allowing the blood in 1.5-ml Eppendorf tubes to clot at room temperature for 30 min, followed by centrifugation at 2,000g for 20 min at 4 °C and collecting the supernatant. For plasma collection, blood was placed in a K2EDTA coated tubes (BD Microtainer, 365974), centrifuged at 2,000g for 20 min at 4 °C and the supernatant was collected. Both serum and plasma samples were stored at −80 °C.
In vivo platelet counting.
Male 22–24-month-old C57BL/6J mice were treated with ABT263 (50 mg kg−1 d−1). Fourteen days after the last treatments, roughly 50 μl of whole blood was drawn from each mouse via the submandibular vein using sterile 23G needles, collected in K2EDTA coated tubes and immediately sent to NEODIN BioVet. Complete blood counts including platelets were enumerated by using an automated haematology analyser ADVIA 2120i (Siemens Healthcare) (Supplementary Table 1).
Real time PCR.
Total RNA was prepared from cells and tissues using commercially available kits (Isolate II, BIO-52073, Bioline for cells; Direct-zol, 2052, Zymo for tissues) according to the manufacturer’s instructions. RNA was reverse transcribed using a High Capacity complementary DNA Reverse Transcription Kit (Thermo, 4368814). RT–qPCR reactions were performed on a Light Cycler 480 II (Roche Diagnostics). Primer/probe sets for human and mouse genes are listed in Supplementary Table 2.
Human primary cells culture.
For senescence induction by human plasma, 2 × 10⁴ human primary lung fibroblast (IMR-90; CCL-186, ATCC), skeletal muscle myoblasts (CC-2580, Lonza), renal cortical epithelial cells (PCS-400-011, ATCC), subcutaneous preadipocytes (PCS-210-010, ATCC) or mammary epithelial cells (PCS-600-010, ATCC) in 12-well plates were cultured in OptiMEM (Gibco, 31985062) supplemented with 5% plasma from young (20–30 years) or old (70–80 years) human participants for 3 or 6 days. Human plasma samples, without personal identifiers were not linked to or traced back to any personal information, and were purchased from Blood Centres of the Pacific (BSI Facility) as part of an material transfer agreement between Buck Institute for Research on Aging and the Blood Centres of the Pacific. Media were changed every other day until the end of the experiment.
MDF culture.
For senescence induction by mouse serum, 2 × 10⁴ primary MDFs from 1-month-old male p16-3MR or C57BL/6J mice in 12-well plates were cultured in OptiMEM with 5% serum from young (4-month-old), old (32-month-old) animals, 2.5% serum from young plus 2.5% serum from old animals, 5% vehicle-treated, DQ-treated or ABT263-treated old animals for 3 or 6 days. Mouse serum samples were purchased from the National Institute on Aging. MDF proliferation was determined by counting the number of EdU-positive nuclei per Hoechst-positive total cells in ten random fields per chamber slide (Lab-Tek II, 154534PK) after addition of EdU (Click-iT EdU Alexa Fluor 488 imaging kits, Promega, C10337) for 24 h.
Enzyme-linked immunosorbent assays (ELISA).
For human plasma-treated cells, conditioned media was prepared by incubating in serum-free basal medium for 24 h. The conditioned media was collected and centrifuged at 2,000g for 10 min to eliminate cell debris. Supernatants were transferred to a tube, and cells were trypsinized and counted. IL-6 levels were detected by a bead-based ELISA kit (AlphaLISA, Perkin Elmer, AL223C) according to the manufacturer’s protocols and normalized to cell number. MMP-3 and HMGB1 levels were quantified in human plasma by using HMGB1 detection kit (Chondrex, 6010) and MMP-3 quantikine ELISA kit (R&D system, DMP300). Kidney Injury Molecule (KIM-1; R&D system, MKM100), neutrophil gelatinase-associated lipocalin (Abcam, ab199083), ALT (Cayman Chemical, 700260), bilirubin (Sigma Aldrich, MAK126), urea nitrogen (Abcam, ab83362) and creatinine (Crystal Chem, 80350) were determined in serum samples, according to the manufacturer’s instructions.
Immunohistochemistry.
OCT-embedded skeletal muscles, kidney and liver sections on glass coverslips were washed in PBS, fixed in 4% paraformaldehyde, quenched with 50 mM glycine, permeabilized with 0.3% Triton X-100 in PBS and saturated with 3% goat serum (Thermo, 50062Z). Vectastain Elite ABC universal kit-haematoxylin counterstain (Vector Laboratories, PK-6200) with Vector DAB Peroxidase Substrate (Vector Laboratories, SK-4100) was used following the manufacturer’s instructions. Primary antibodies were used for phosphor-histone H2A.X (1:400; Cell Signaling, 9718), HMGB1 (1:1,000; Abcam, ab18256) and Desmin (1:200; Abcam, ab15200).
Immunofluorescence.
Monolayers or frozen tissue sections were fixed in 4% paraformaldehyde (Sigma, 1.00496), permeabilized with PBS containing 0.25% Triton X-100 (Sigma, X-100) for 10 min and then blocked with 4% BSA (Sigma, A7906) containing 0.25% Triton X-100 for 30 min at room temperature. The cells were incubated with primary antibodies against HMGB1 (1:1,000; Abcam, ab18256) and Lamin B1 (1:500; Santa Cruz, sc-30264). Tissue sections were incubated with mouse hybridoma anti-eMyHC (1:50; Developmental Studies Hybridoma Bank, F1.652), KIM-1 (0.25 μg ml−1; R&D, AF1817), biotinylated lotus tetragonolobus lectin (10 μg ml−1; Vector Laboratories, B-1325), Laminin α-2 (1:200; Abcam, ab11576), Pax7 (1:10; Developmental Studies Hybridoma Bank, no. PAX7), CD45 (1:100; Abcam, ab23910), dystrophin (1:10; Invitrogen, PA1-21011) and rat IgG (1:100; Biolegend, 407402) overnight at 4 °C. Then, samples were incubated with goat anti-rabbit IgG (H + L) conjugated with Alexa Fluor 594 (1:1,000; Invitrogen, A-11012), donkey antimMouse IgG (H + L) conjugated with Alexa Fluor 594 (1:200; A-21203, Invitrogen) or 488 (1:200; A-21202, Invitrogen), donkey anti-rabbit IgG (H + L) conjugated with Alexa Fluor 488 (1:200, A-21206, Invitrogen) or Alexa Fluor 594 (1:200, A-21207, Invitrogen) and donkey anti-rat, Alexa Fluor 488 (1:200; A-21208, Invitrogen) for 45 min. Nuclei were counterstained with 4,6-diamidino-2-phenylindole (DAPI; 1:1,000; Sigma, D9542) or Hoechst 33342 (1:1,000; Sigma, B2261) for 5 min, and slides imaged using fluorescence microscopy (Carl Zeiss).
SA-β-galactosidase staining.
SA-β-gal staining was performed using a kit from Biovision (K320-250) according to the manufacturer’s instructions. SnCs were identified as blue-stained cells under light microscopy. For cell culture experiments, cells were counted using nuclear DAPI counterstain in ten random fields per culture dish to determine the percentage of SA-β-gal-positive cells. For in vivo experiments, the SA-β-gal+ cells per area was quantified in 4–10 random fields of the image using a consistent colour-threshold function in ImageJ.
Double staining for SA-β-galactosidase and laminin/dystrophin/leukocyte markers.
SA-β-gal staining was performed using Cell Signaling Kit (no. 9860) with a modified protocol from Cazin et al.45. SA-β-gal stained muscle sections were subsequently permeabilized with 0.3% Triton X-100 for 15 min, blocked with 1% bovine growth serum (Hyclone, SH30541.03), incubated with primary antibodies against CD45 (1:100; Abcam, ab23910), laminin (1:200; Abcam, ab11575) and dystrophin (1:10; Abcam, ab11576) for 2 h at room temperature, washed four times for 5 min each in PBS and incubated with secondary fluorochrome tagged antibodies and DAPI Fluoromount-G (SouthernBiotech, 0100-20) for 2 h at room temperature.
Cardiotoxin muscle injury.
For Supplementary Fig. 6, ABT263 was administered to 22 to 24-month-old C57BL/6J mice by gavage at 50 mg kg−1 d−1 for 7 d per cycle for two cycles with a 2-week interval between the cycles. Two days after the last drug treatment, aged mice were injured by intramuscular injections of cardiotoxin (Sigma, 217503, 10 ml per muscle at 0.1 mg ml−1) into the TA. Five days after the injury, TA muscles were isolated, embedded in OCT and snap frozen in isopentane chilled to −70 °C in a dry ice/alcohol bath.
Haematoxylin and eosin (H&E) staining.
After dehydration and removal of OCT in 70% ethanol for 3 min, sections were hydrated in deionized water for 1 min, stained with haematoxylin for 5 min, rinsed 1× Scott’s water for 1 min, stained with eosin for 4 min and dehydrated at 70, 95, 99 and 100% ethanol for 1 min each. Sections were cleared with xylenes twice, 1 min each. 2–3 drops of 50% resin/50% xylenes mounting medium were added to each slide and glass coverslips were placed. Five random images of injury sites were obtained by light microscopy.
Oil red O staining.
Liver and skeletal muscle 10 μm sections were hydrated in 1× PBS for 10 min, washed in 60% isopropanol for 3–5 min and placed in isopropanol-based Oil Red (Sigma, O0625) staining solution for 15 min. The sections were washed in 60% isopropanol again for 1 min. Nuclei were stained after a 5-min wash in haematoxylin. The sections were washed in deionized water for 1 min and mounted in Fluoromount (Sigma, F4680).
TUNEL staining.
Dehydrated cryosections on slides were permeabilized for 2 min in 0.2% Triton X-100 in PBS and washed three times with PBS. After adding equilibration buffer for 10 min, cryosections were incubated in the dark for 1 h at 37 °C with 50 μl of TUNEL reaction mixture (Promega, G3250). Slides were immersed in stop reaction solution and rinsed three times with PBS, counterstained with DAPI and mounted.
Sirius Red staining.
Cryosections on slides were thawed and fixed in Bouin’s Solution for 1 h and stained in Picrosirius Red Solution (Polysciences, 24901-250) for 1 h, washed in 0.1 N hydrochloride Acid for 5 min, serially dehydrated in 90, 95 and 100% ethanol, washed twice in xylene for 2 min and mounted with Permount Mounting Medium (VWR, 17986-01).
Pathological analysis of kidney.
Acute tubular necrosis, interstitial inflammation, fibrosis and tubular atrophy were evaluated on the basis of H&E staining (Abcam, ab245880). Scores were based on the percentage of hepatocytes with phenotypes as shown in Supplementary Table 3.
Multiplex protein analysis using Luminex.
Relative serum concentrations of cytokines and signalling molecules were measured in mouse sera using standard antibody-based multiplex immunoassays (Luminex mouse 38-plex) that detects 38 secreted proteins by the Human Immune Monitoring Center at Stanford University. All samples were measured in technical duplicates and all analyses performed using mean fluorescence intensity values as recommended. All measurements were obtained in a blinded fashion. To compare YO to YY, YO+Veh to YO+ABT, or OO+Veh to OO+ABT, log2-transformed fold changes in cytokine levels were calculated by subtracting the log (base 2) of mean fluorescence intensity in YO from YY, in YO+ABT from those in YO+Veh, or in OO+ABT from OO+Veh.
Data quantification.
Muscle fibrosis was quantified by measuring fibrotic areas in arbitrary units using ImageJ. Fibrotic areas were normalized to the area of the image taken at 20× (roughly 14,000 mm2). Adiposity was calculated by obtaining the total area of the red fatty droplets as a percentage of the entire 10× area, using a consistent colour-threshold function in ImageJ.
Indirect calorimetry.
Mice were individually housed at least for 3 d before recording and analysis. Metabolic cages (Promethion System, Sable Systems) were used while the mice were awake to simultaneously measure energy expenditure, respiratory quotient, water and food intake and body weight. Ten days after blood exchange, all mice were monitored and metabolism recorded for four consecutive days.
Rotarod.
Each daily session included a training trial of 5 min at 4 r.p.m. on the apparatus (Ugo Basile). After 1 h, the animals were tested for three consecutive accelerating trials of 5 min with the speed changing from 0 to 40 r.p.m. over 300 s and an intertrial interval of at least 30 min. The latency to fall from the rod on each trial was recorded. Mice remaining on the rod for >300 s were removed, and their time scored as 300 s.
Treadmill.
Mice were first accustomed to running on a treadmill over the course of 2 days. At each session, mice run at a 1° grade for 5 min with the treadmill increasing in velocity from 5 to 25 m min−1 at a ramp acceleration of 5 m min−1. Then 7 d after blood exchange, mice run at 25 m min−1 until exhaustion. Mice refusing to run received puffs of air that stimulated them to continue running. Exhaustion time was recorded when a mouse stopped running and was no longer responsive to the air puff stimulus.
In vivo assessments of skeletal muscle function using Aurora.
Mice were placed under deep anaesthesia and one hindlimb shaved and cleansed with alcohol. Mice were then placed supine onto a thermo-pad at 37 °C to maintain body temperature and receive gel to protect their eyes. Mice remained anaesthetized via an isoflurane ventilator, and the right limb was secured into a foot plate attached to an electric motor. Needle electrodes were inserted through the skin behind the knee to deliver sufficient voltage through the sciatic nerve to produce maximal isometric contractions for three recordings at a pulse of 0.5 ms. Then, three maximal twitches were recorded followed by stimulations at multiple frequencies (20, 40, 60, 80, 100, 125 Hz) for 200 ms to measure ankle extensor torque. A 45 s rest period occurred after each stimulation to provide time for recovery between the first and second test, as well as between each frequency tested. Mice were then stimulated intermittently every second for 2 min at 30–50 Hz and 0.5 s trains with 0.1 s pulses for 2 min to elicit prolonged contraction to determine time to half peak torque. This technique provided data on the fatigue index of skeletal muscle by evaluating the time to half maximal tension. Finally, mice were stimulated once every 5 min over the course of 15 min (4× in total at 0, 5, 10 and 15 min; 125 Hz) after the fatigue trial to collect data on the recovery rate of force transmission relative to maximal tetanic force in the skeletal muscle of mice.
Grip strength.
Forelimb grip strength was determined using a Grip Strength test (Biosebs). The mice were allowed to grab the metal grid and then pulled backwards in the horizontal plane. The force (in g) applied to the grid just before grip loss was recorded as the peak tension. Results were averaged over ten trials.
Hanging test.
Mice were placed onto a 2 mm thick metal wire and allowed to grab the wire with both forelimbs and hindlimbs. Hanging endurance was normalized to body weight as hanging time (s) × body weight (g). Results were averaged from three trials for each mouse.
Cytokine antibody array assay.
Cytokine levels from each mouse plasma were assessed using the Proteome Profiler Mouse Cytokine Array kit, panel A (R&D Systems, ARY006) according to the manufacture’s protocol. Cytokine arrays were developed using ChemiDoc Touch imaging system (BIO-RAD, 1708370) and analysed using ImageJ software (National Institutes of Health (NIH)). The mean background signal (pixel density) of each membrane was subtracted before further analysis. The pixel intensity was then averaged for each group. The final results for each cytokine were represented by the intensity fold change (a.u.) in old mice (22 to 24-month-old) versus young mice (3-month-old), ABT263-treated old mice versus vehicle-treated old mice or DQ-treated old mice versus vehicle-treated old mice.
Mouse preadipocytes cell culture.
Mouse preadipocytes were isolated as followed46; After euthanasia, inguinal fat depots were removed under sterile conditions from male C57BL/6J (1–2-month-old) mice. Adipose tissue was cut into small pieces, digested in collagenase (1 mg ml−1; Sigma, C0130) for 30 min at 37 °C and then filtered through a 240-μm nylon mesh. After centrifugation at 500g for 10 min, cell pellets were resuspended with red blood cell lysis solution (Sigma, R7757) for 1 min, washed with PBS once and filtered through a 70-μm cell strainer. Cells were plated in DMEM/F12 (Corning, 10-017-CV) containing 10% FBS (Gibco, 16000-044) and 1% penicillin-streptomycin (10,000 U ml−1, Thermo, 15140-122). After 12 h, adherent preadipocytes were washed, trypsinized and replated to use in culture and in vivo experiment.
Senescent cell transplantation.
Senescent mouse preadipocytes were induced by ionizing irradiation with (20 Gy X-ray) (Xstrahl, RS320) and control cells were mock irradiated. Senescent cells were cultured for 20 days to allow development of the senescent phenotype. Senescent cells and control cells were cultured in DMEM/F12 (Gibco, 11320033) containing 10% FBS (ATCC, 30-2020) and 1% penicillin-streptomycin. Cells were labelled with CellTracker CM-DiI dye according to the manufacturer’s instructions (Thermo, C7000). The 3–4-month-old male C57BL/6J mice were anaesthetized using isofluorane and 1 × 10⁶ senescent or control cells were injected intraperitoneally through a 22G needle. Five days after cell transplantation, the abdominal cavities of the mice were opened just before the imaging and imaged with 30 s exposure by using NightOWL LB 983 in vivo imaging system (Berthold Technologies). Mice were imaged for detection of the transplanted senescent and control cells 1, 7, 14, 21 and 28 post-transplantation.
Data and statistical analyses.
No statistical methods were used to predetermine sample size. The group size was based on previously published study using similar methodologies8. All analyses were performed using Prism v.9.2 software from GraphPad and Microsoft Excel 2019. Data are expressed as the mean ± s.e.m. Unpaired t-tests (two-sided) with a Welch’s correction were applied to comparisons between two groups if variances were significantly different between groups with statistical significance defined as P < 0.05. For comparisons among more than two groups, one-way analysis of variance (ANOVA) was used, followed by Dunnett’s post hoc test for adjusted P values (significant at an adjusted P value threshold <0.05). For statistical comparison of three or more datasets (multiple senescence and SASP genes and proteins), multiple t-test or two-way ANOVA was used, followed by the two-stage linear step-up procedure of Benjamini, Krieger and Yekutieli, with a false discovery rate (FDR) < 5%. Significance was assessed using FDR-corrected q values <0.05. For the correlation study, data were analysed using the Pearson correlation test. When using parametric tests (t-test or ANOVA), normal distribution of data was tested using a Shapiro–Wilk test or the Kolmogorov–Smirnov test. When normality was not satisfied, Mann–Whitney tests were performed on comparisons among groups/conditions. All statistical tests, sample sizes and their P values or FDR-corrected q values are now provided in the figures and corresponding legends.
Reporting summary.
Further information on research design is available in the Nature Research Reporting Summary linked to this article.
Extended Data
Extended Data Fig. 1 |. Senescence-induction in non-senescent mouse cells (MDFs) in culture by serum from old mice.
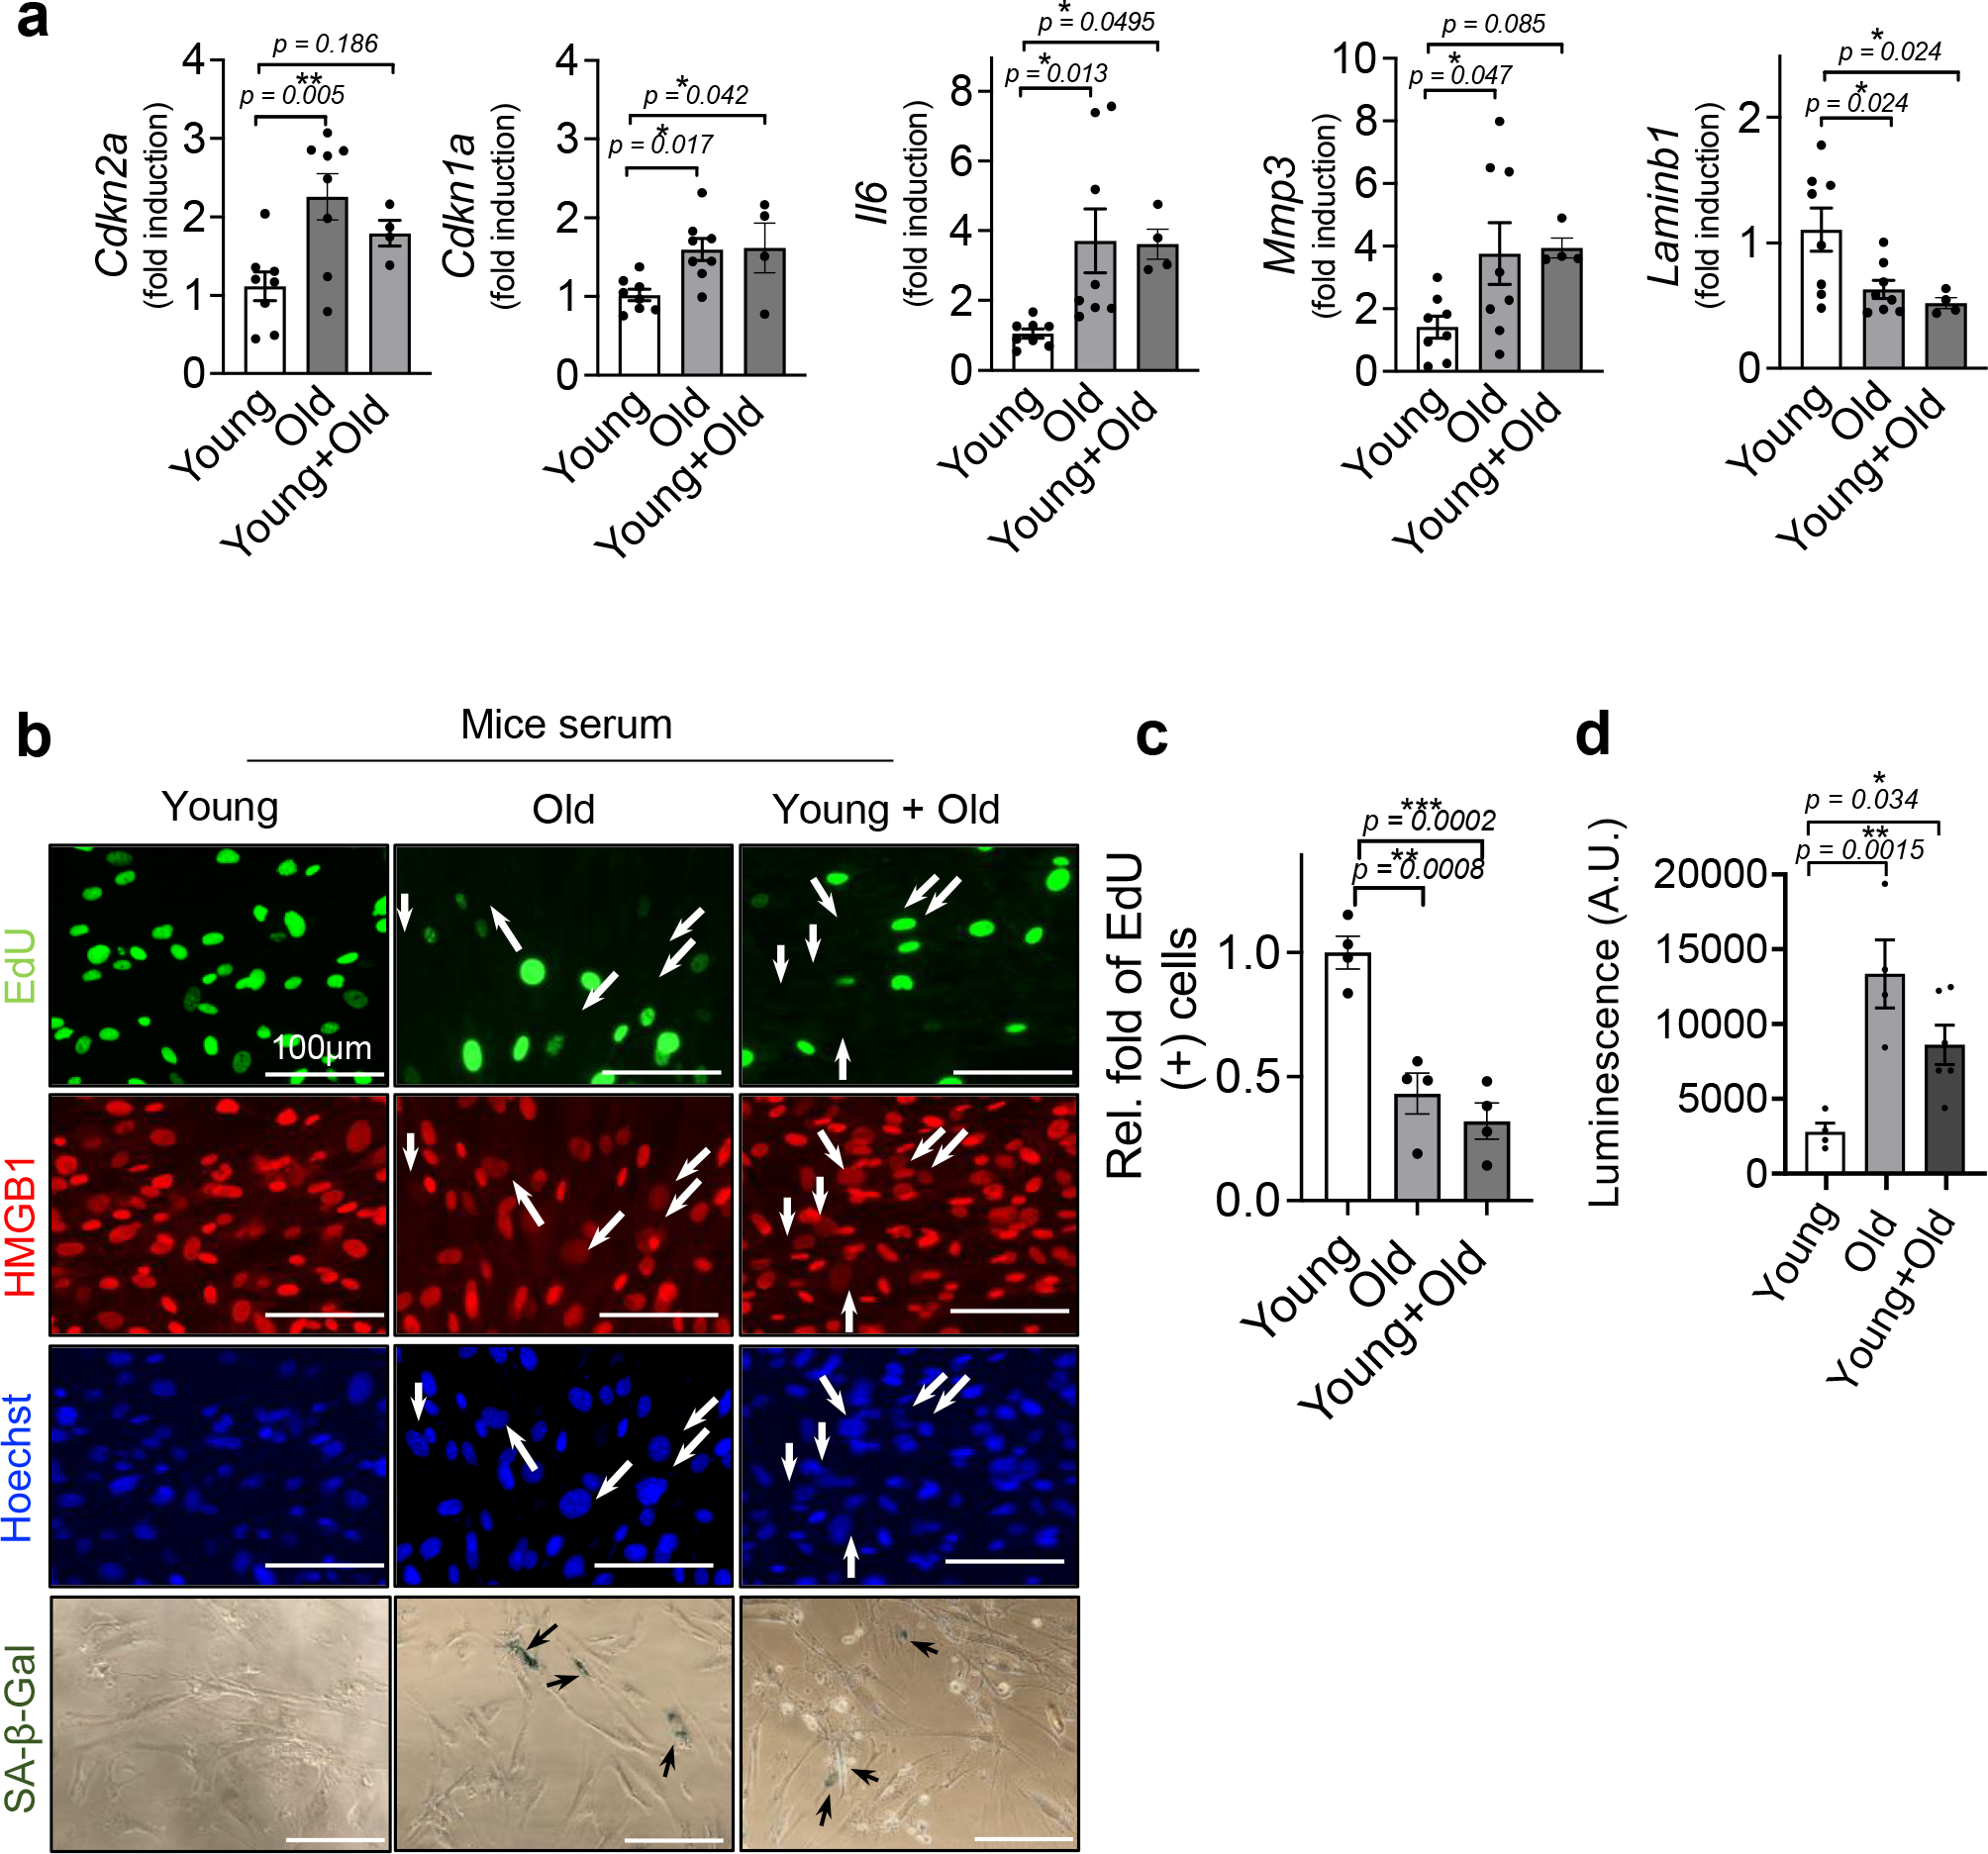
(a) mRNA levels for Cdkn2a and Cdkn1a and SASP factors Il6, Mmp3 and Laminb1, normalized to Actb mRNA, determined by RT–PCR (n = 8 for young or old serum treatment for 3 days; n = 4 for young + old (50/50) serum treatment for 3 days). (b) Representative EdU (green; EdU negative non-proliferating SnCs in arrows), HMGB1 (red; SnCs marked by HMGB1 nuclear loss with arrows), Hoechst labelled nuclei (blue) visualized by fluorescence microscopy (3–6 images per n) and SA-β-gal staining (3–7 images per n) and (c) quantification of EdU-positive SnCs in MDFs 3 days after culturing in young, old or young + old (50/50) mouse serum (n = 4 for each group). (d) Bioluminescence from 3MR-expressing cells (Renilla luciferase assay) in non-senescent MDFs from cultured in young (4-month-old), old (32-month-old) or young+old (50/50) mouse serum for 6 days (A.U.) (n = 4 for young or old mouse serum; n = 6 for young+old mouse serum). Data are means ± s.e.m. of biologically independent samples. Statistical significance was tested using one-way ANOVA followed by Dunnett’s post hoc test for multiple comparisons with *, P < 0.05; **, P < 0.01; ***, P < 0.001. Scale bars, 100 μm. Rel, relative.
Extended Data Fig. 2 |. Aged blood decreases muscle strength in young mice.
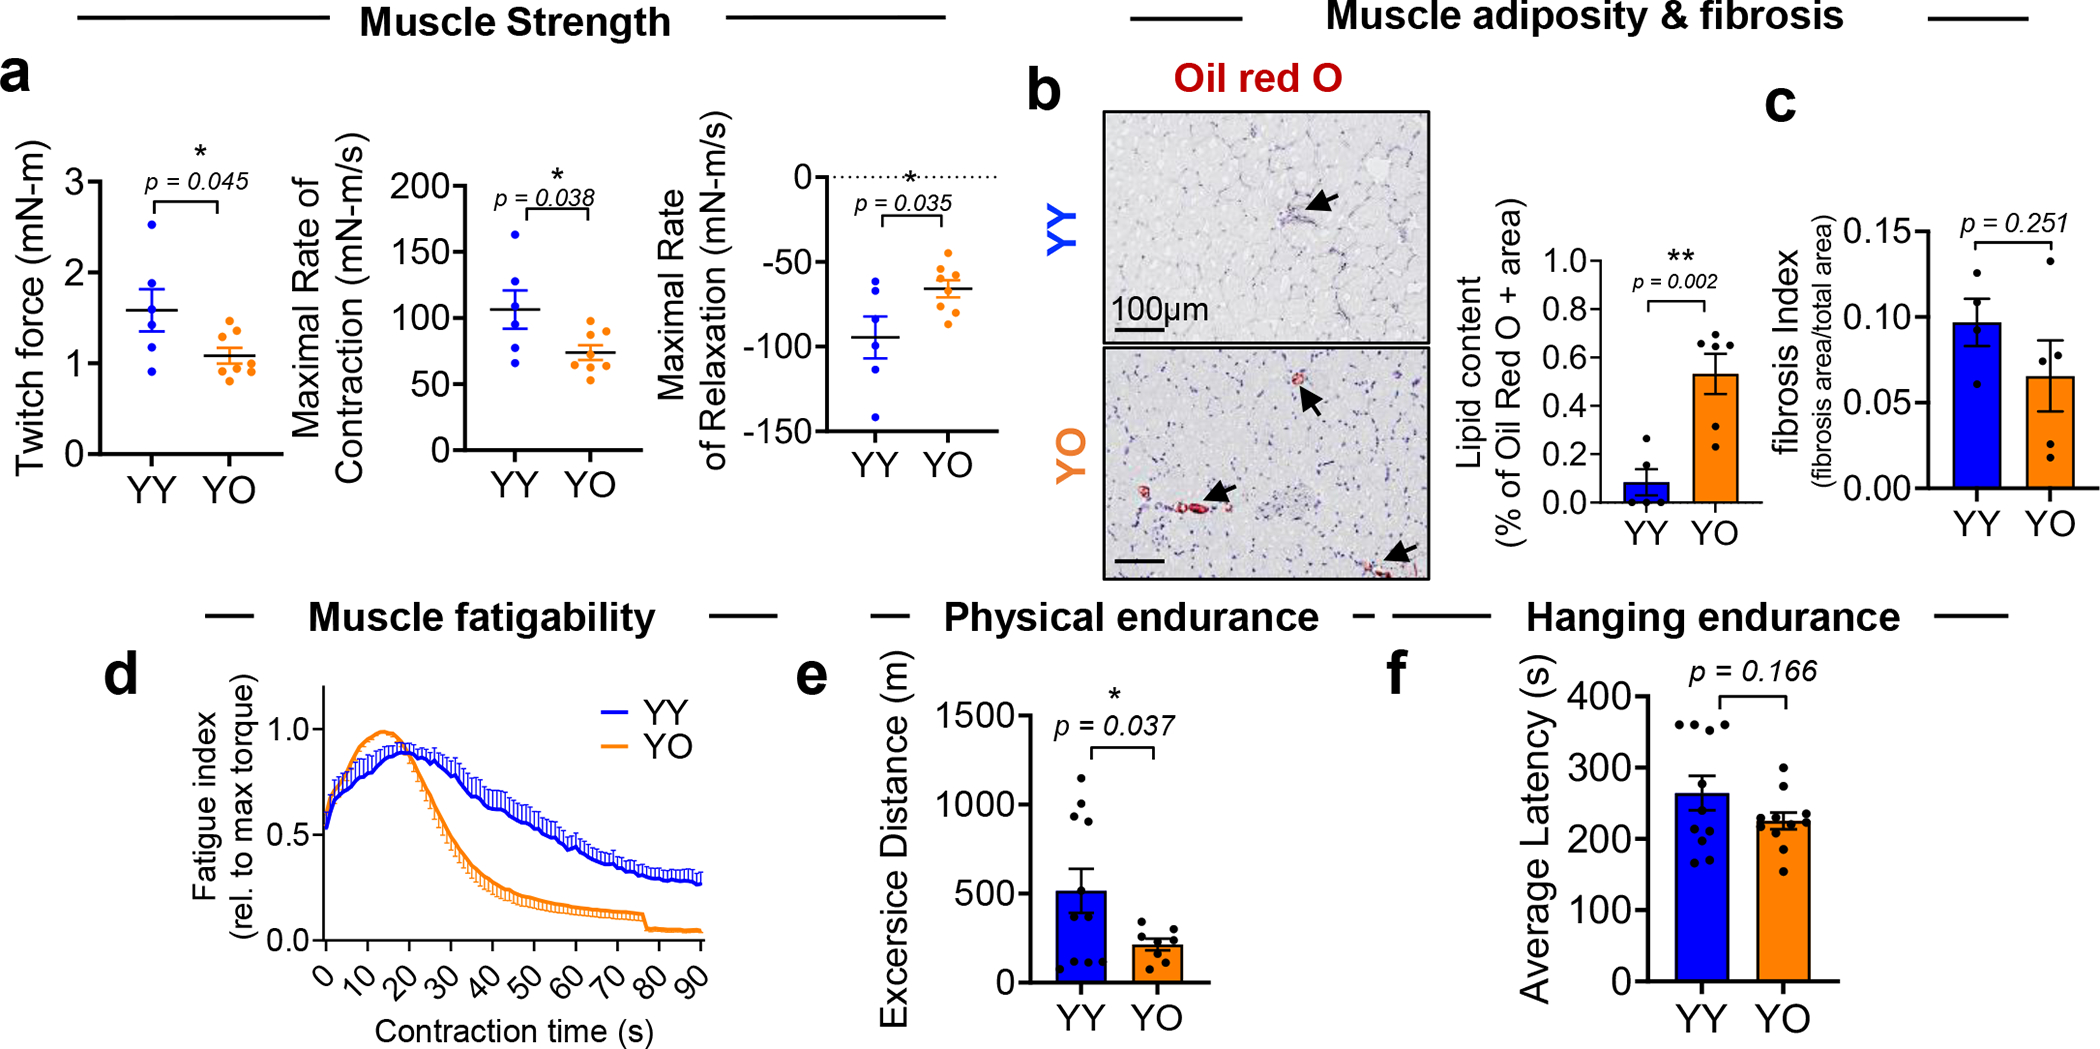
(a) Twitch force generated by skeletal muscles and maximal rate of contraction and relaxation during contractions (n = 6 for YY; n = 8 for YO). (b) Representative images of Oil Red O staining and quantification of Oil Red O + area of skeletal muscles of young mice receiving old (YO; 4–10 images per mice / n = 5 mice) or young (YY; 3–5 images per mice / n = 6 mice) mouse blood, showing more accumulation of adipose tissues in endomysium (interstitial connective tissue) between fibers in YO mice and (c) percentage of fibrosis (n = 4 for YY; n = 5 mice; 3–4 images per mice). (d) Skeletal muscle fatigue assessment in YY and YO mice (n = 6 for YY and n = 5 for YO). (e) Running distance in meter of YY and YO on treadmill (n = 11 for YY and n = 8 for YO). (f) Latency time to fall off the rotarod as a measure of motor coordination. Data are means ± s.e.m. of biologically independent samples. A two-tailed Student t-test (a) and two-tailed t-test with a Welch’s correction (b-c, e-f) with *, P < 0.05; **, P < 0.01were used for statistical analysis. Scale bars are shown in each image.
Extended Data Fig. 3 |. DQ-treated old mice serum inhibits induction of senescence in non-senescent mouse cells (MDFs) in culture.
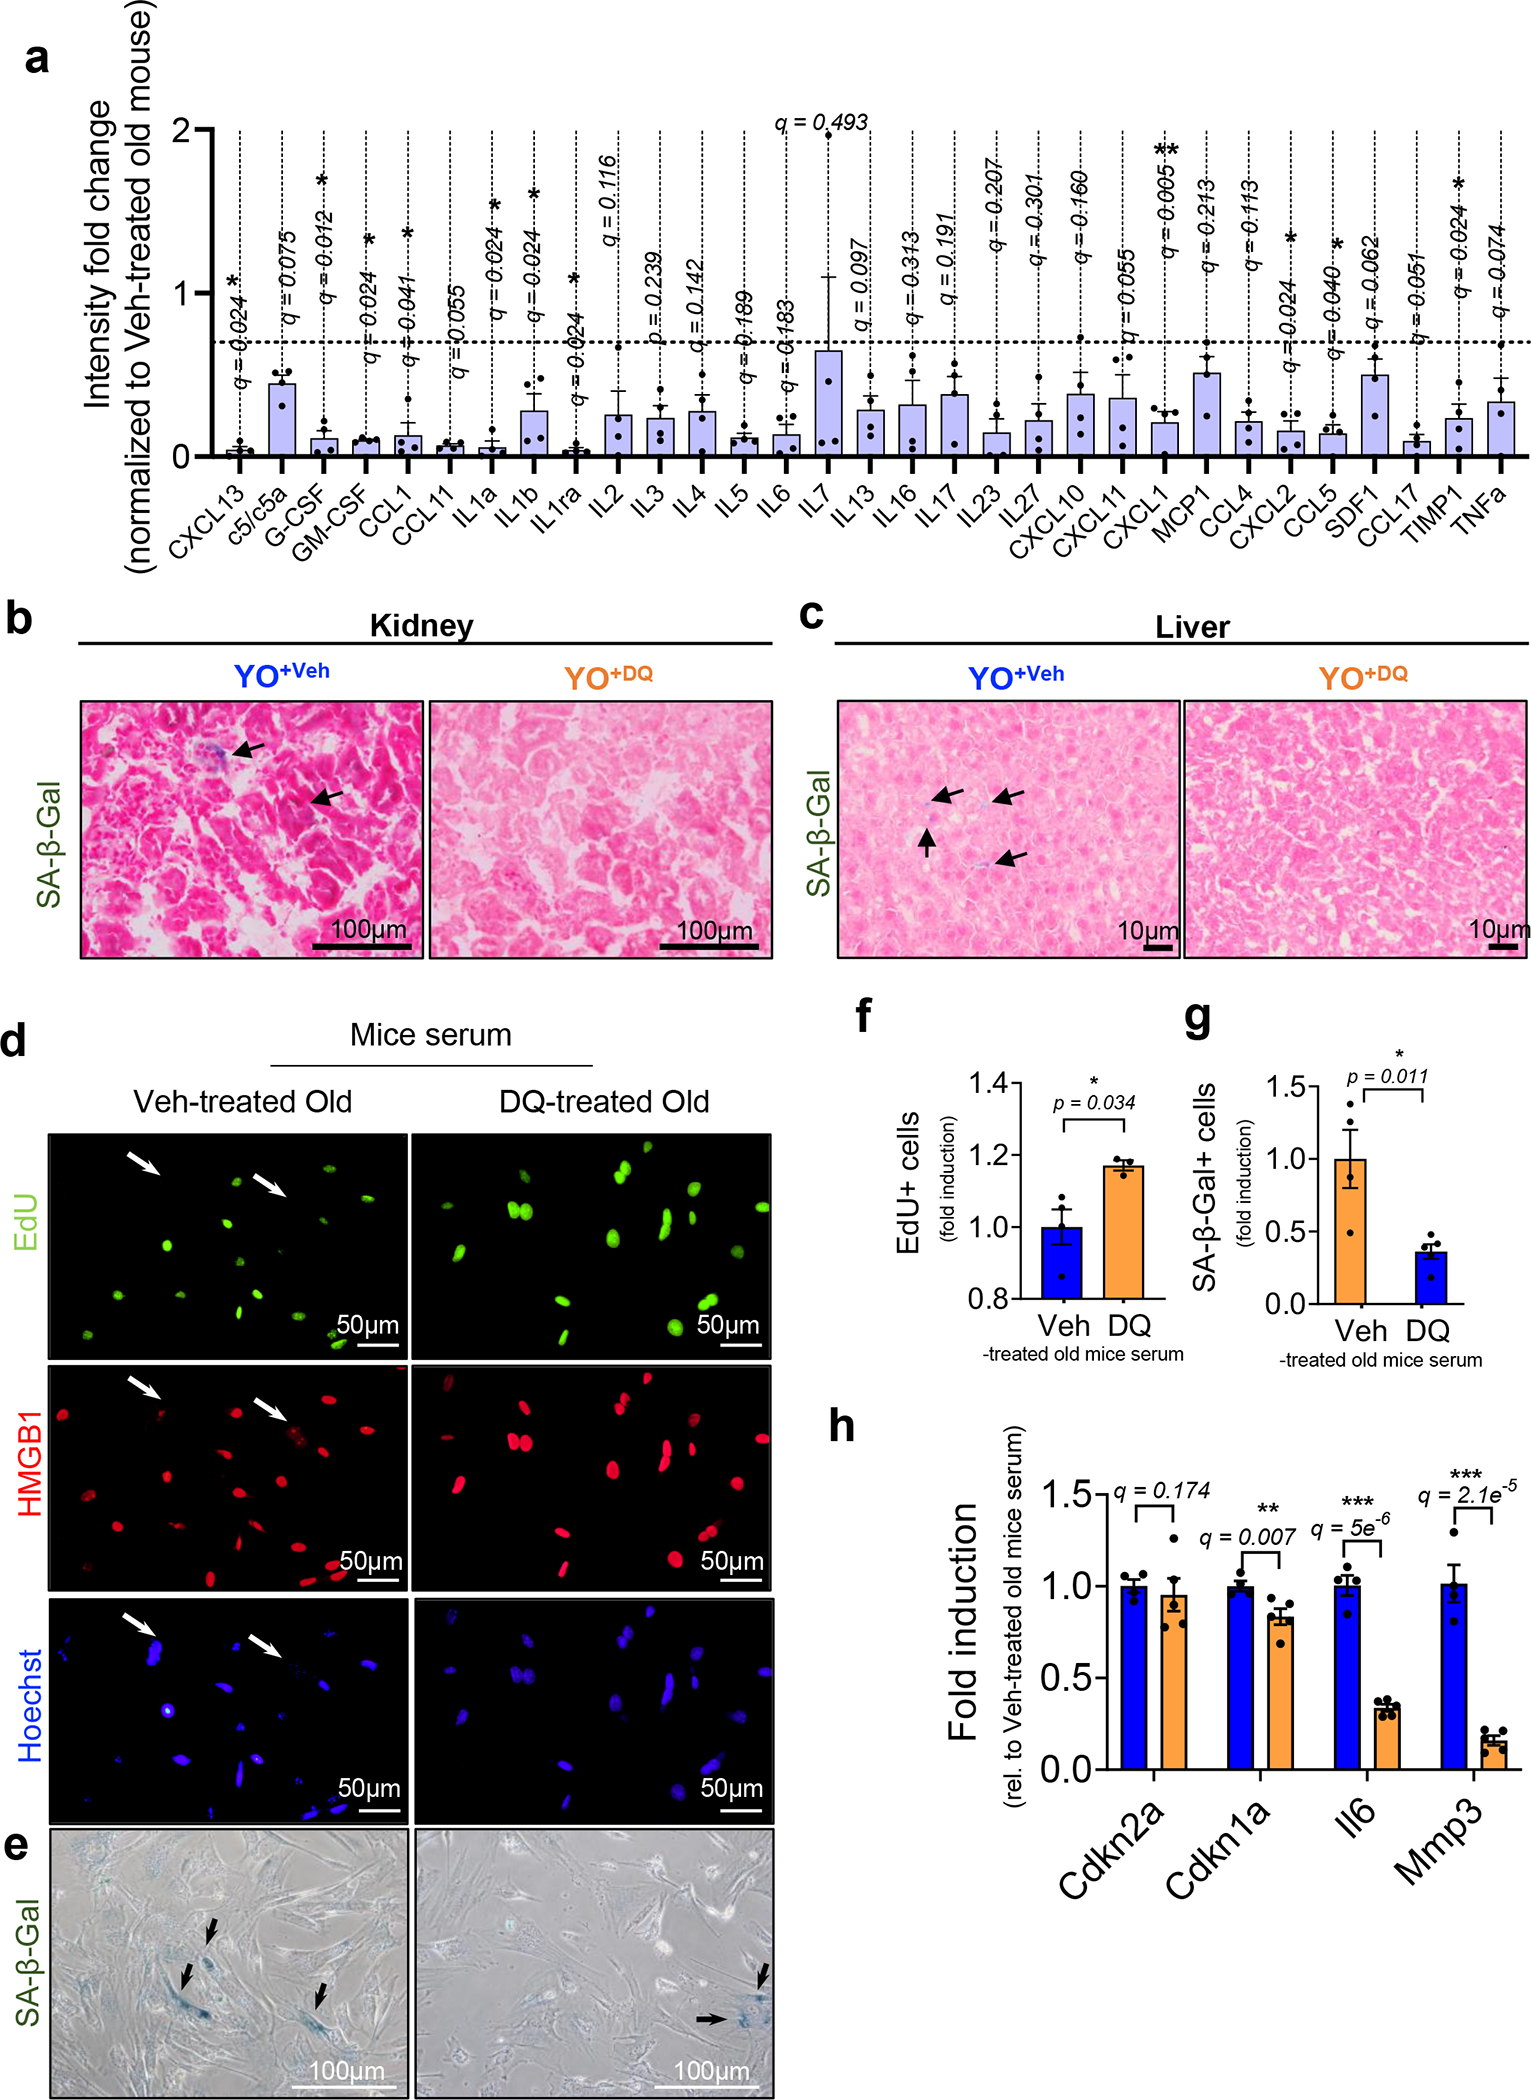
(a) Relative protein expression ratio (< 0.7-fold) of SASP proteins in plasma from DQ-treated C57BL/6J old mice (DQ; n = 4) normalized to vehicle treated C57BL/6J old mice (Veh; n = 3), measured by antibody array. Each data point represents an individual mouse. Additional SA-β-gal images of (b) kidney and (c) liver in young C57BL/6J mice receiving old C57BL/6J mice treated with Veh (YO+Veh) or DQ (YO+DQ). (d) Representative EdU (green; EdU negative non-proliferating SnCs in arrows), HMGB1 (red; SnCs marked by HMGB1 nuclear loss in arrows), and Hoechst labeled nuclei (blue) visualized by fluorescence microscopy (n = 4 for each group / at least 7 images per n) and (e) SA-β-gal staining in MDFs cultured in Veh- or DQ-treated old mice serum for 3 days (n = 4 for veh-treated old mice serum treated; n = 5 for DQ-treated old mice serum / at least 6 images per n). Quantification of (f) EdU + (n = 4 for Veh-treated old mice serum treated; n = 3 for DQ-treated old mice serum treated) and (g) SA-β-gal + (n = 4 per group) MDFs. (h) mRNA levels for Cdkn2a and Cdkn1a and SASP factors Il6 and Mmp3 3 days after culturing in Veh- or DQ-treated old mice serum, determined by RT–PCR (n = 4 for Veh-treated old mice serum treated; n = 5 for DQ-treated old mice serum treated). Data are means ± s.e.m. of biologically independent samples. Statistical significance was calculated using multiple t test with two-stage linear step-up procedure of Benjamini, Krieger and Yekutieli, with Q = 5%, *q < 0.05; **q < 0.01 (a, h) and two-tailed Student’s t test (f-g) with *, P < 0.05. Scale bars are shown in each image.
Extended Data Fig. 4 |. Inhibition of age-related tissue phenotypes induced by aged circulation in kidney and liver of young animals after exchanging blood of old mice in which SnCs were removed by DQ.
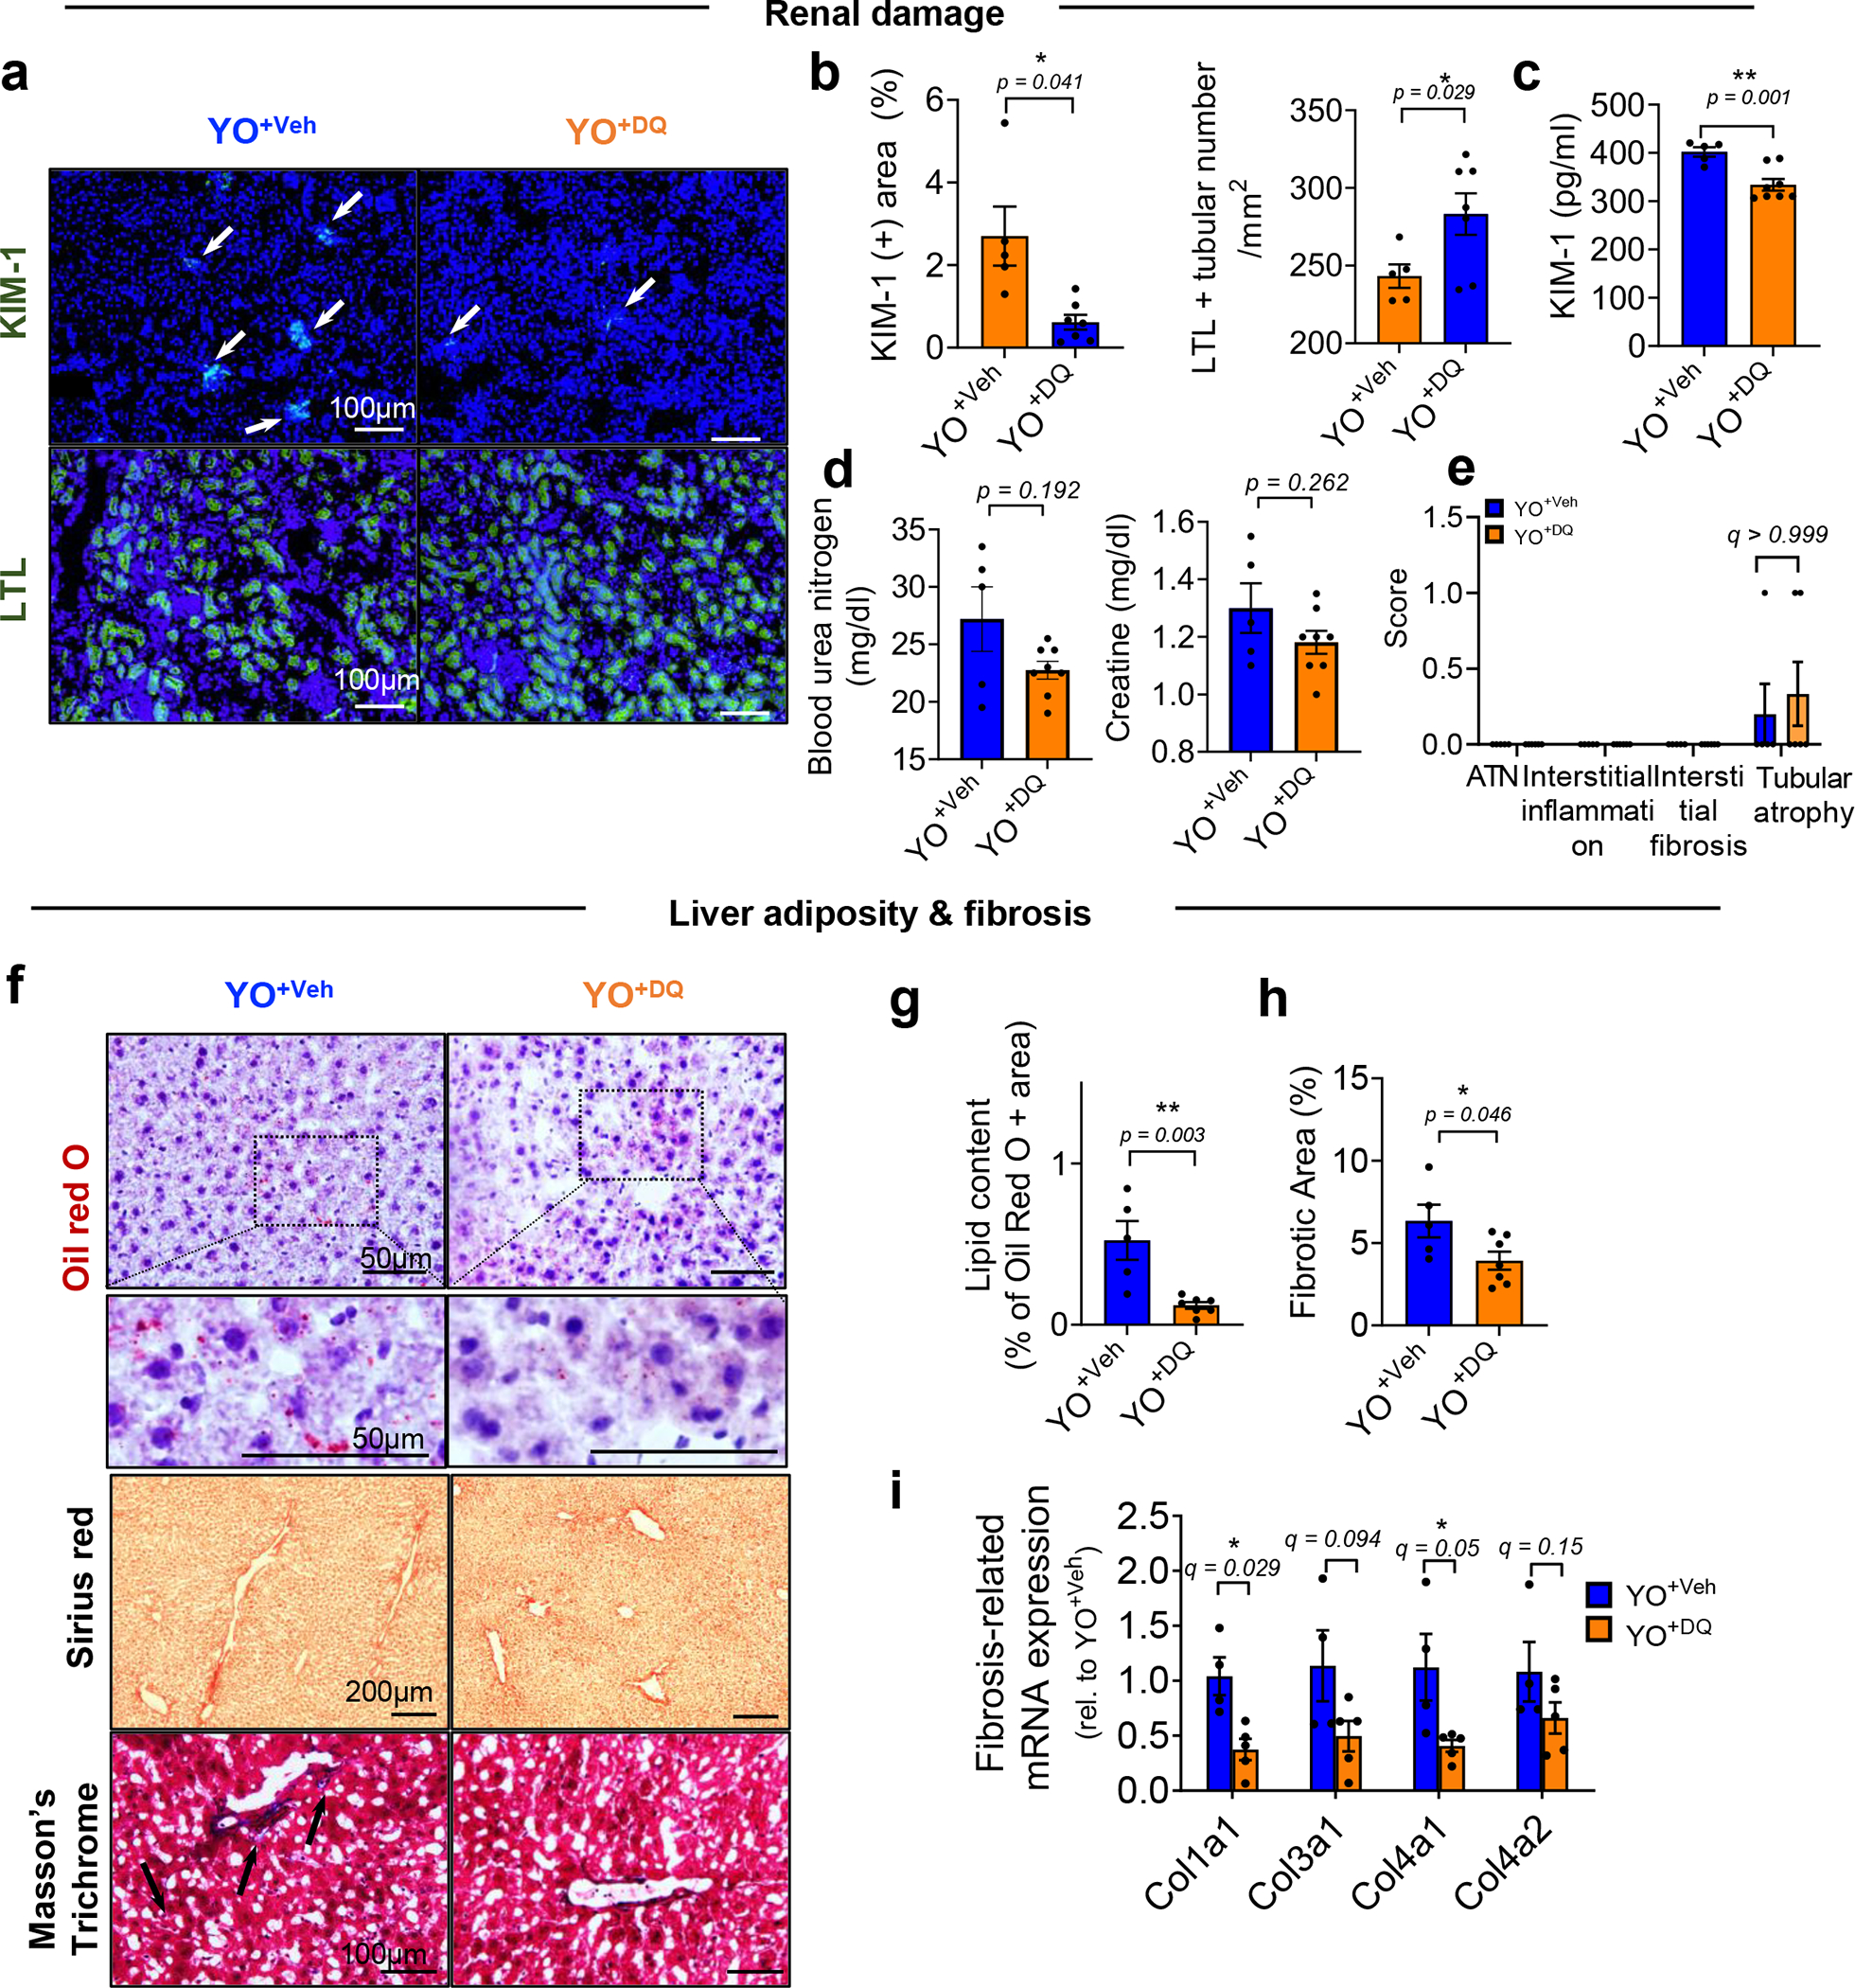
(a) Representative images of KIM-1 (n = 5 mice for YO+Veh; n = 7 mice for YO+DQ / 6–10 images per mice) and LTL (n = 5 mice for YO+Veh; n = 7 mice for YO+DQ / 6–8 images per mice) and (b) quantification of KIM-1 positive area (%) and LTL + tubular number as a marker of healthy renal tubules. (c) Measurements of KIM-1 levels and (d) blood urea nitrogen and creatine in serum of YO+Veh (n = 5) and YO+DQ mice (n = 8). (e) Scores of ATN, interstitial inflammation, interstitial fibrosis and tubular atrophy of renal cortex (n = 5 for YO+Veh; n = 6 for YO+DQ). (f) Representative images of Oil red O (n = 5 mice for YO+Veh; n = 7 mice for YO+DQ / 8–15 images per mice), Sirius red (n = 5 mice for YO+Veh; n = 7 mice for YO+DQ; 10–15 images per mice) and Masson’s Trichrom (n = 4 for YO+Veh; n = 5 for YO+DQ; 15–20 images per mice) staining and (g-h) quantification of Oil Red O-positive and fibrotic areas. (i) Quantification of fibrosis-related mRNAs encoding Col1a1, Col3a1, Col4a1, and Col4a2 in the liver (n = 4 for YO+Veh; n = 5 for YO+DQ). Data are means ± s.e.m. of biologically independent samples and each data point represents an individual mouse. A two-tailed t test with a Welch’s correction (b-d), Student’s t test (g-h) with *, P < 0.05; **, P < 0.01, multiple Mann-Whitney tests (e) and multiple t-tests (i) with a two-stage linear step-up procedure of Benjamini, Krieger and Yekutieli, with Q = 5%, *q < 0.05 was used for statistical analysis. Scale bars are shown in each image. Rel, relative.
Extended Data Fig. 5 |. ABT263-treated old mouse serum abrogates senescence induction in non-senescent mouse cells (MDFs) in vivo and in culture.
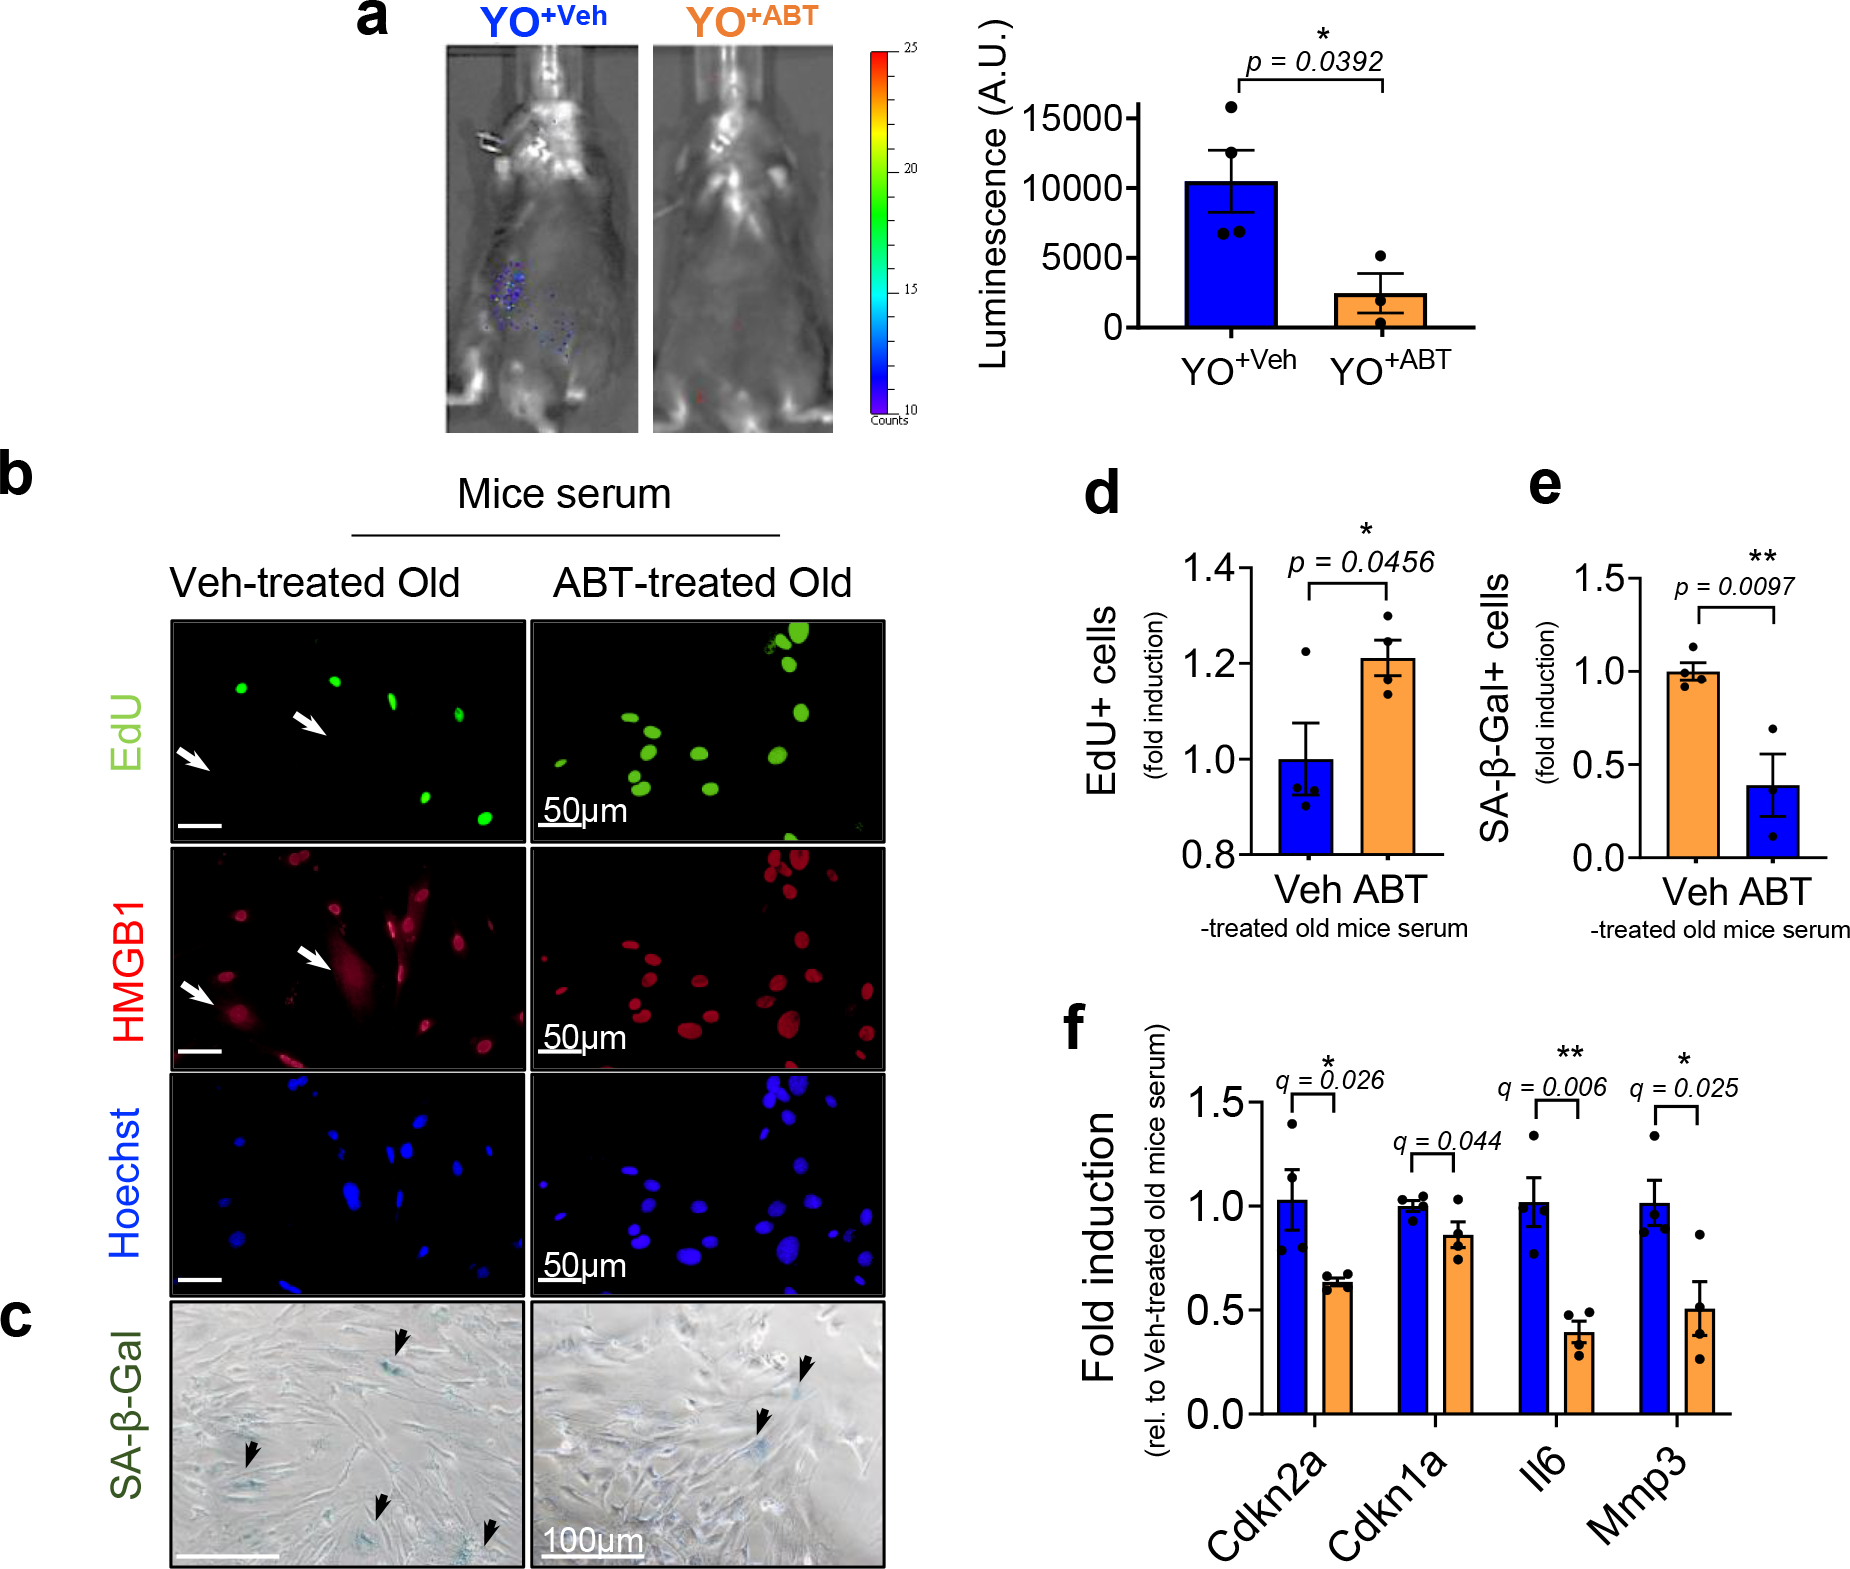
(a) Representative luminescence images of young p16-3MR mice (3-month-old) receiving blood (22-month-old) from old C57BL/6J mice treated with vehicle (YO+Veh) or ABT263 (YO+ABT) 14 days after blood exchange (left) and quantification of the luminescence (right) (A.U.) (n = 4 mice for YO+Veh; n = 3 mice for YO+ABT). Each data point represents an individual mouse. (b) Representative EdU (green; EdU negative non-proliferating SnCs with arrows), HMGB1 (red; SnCs marked by nuclear loss with arrows), and Hoechst labeled nuclei (blue) visualized by immunostaining (n = 4 for each group / 5–8 images per n) and (c) SA-β-gal staining in MDFs cultured in Veh- or ABT-treated old mouse serum for 3 days (n = 4 for veh-treated old mice serum treated; n = 3 for ABT-treated old mouse serum; 3–6 images per n). Quantification of (d) EdU + and (e) SA-β-gal + MDFs. (f) mRNA levels for Cdkn2a and Cdkn1a and SASP factors Il6 and Mmp 3 days after culturing in Veh- or ABT-treated old mouse serum, determined by RT–PCR (n = 4 for each group). Data are means ± s.e.m. of biologically independent samples. Statistical significance was calculated using two-tailed Student’s t test (a, d-e) (exact P value was shown in the figures) and multiple t tests with a two-stage linear step-up procedure of Benjamini, Krieger and Yekutieli, with Q = 5%, *q < 0.05 (f). Scale bars are shown in each image. Rel, relative.
Extended Data Fig. 6 |. Removal of SnCs by ABT263 inhibits age-related tissue phenotypes induced by an aged circulation in kidney and liver young tissues.
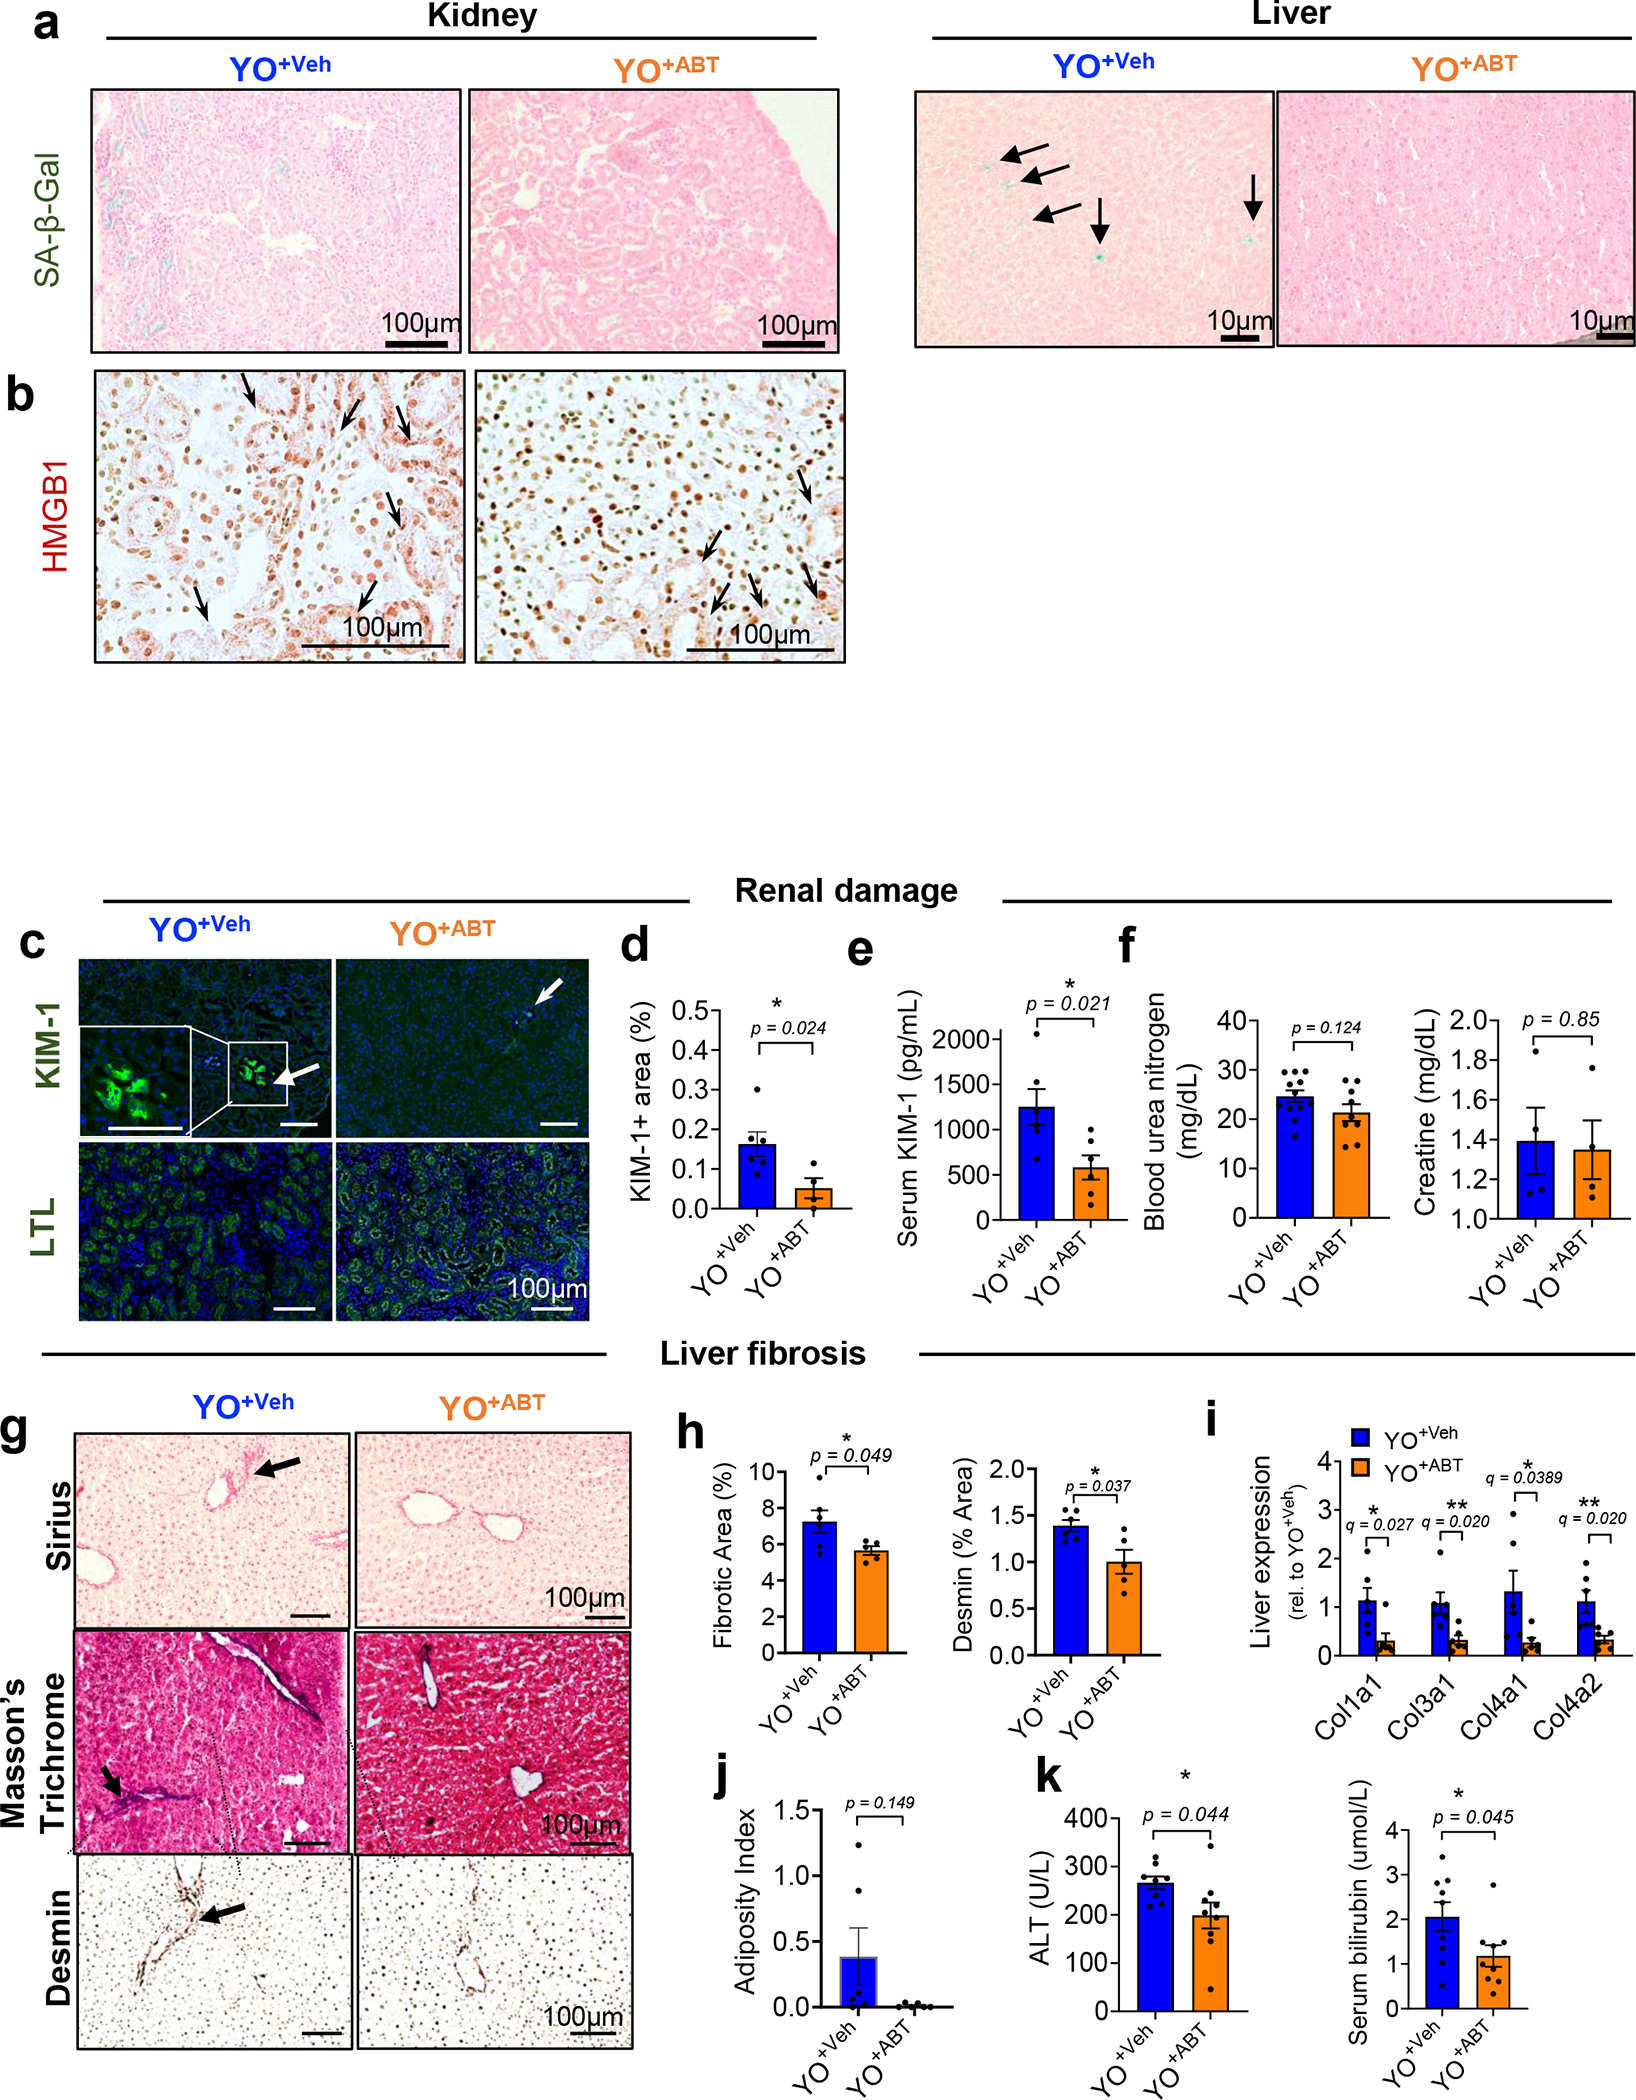
(a) Additional SA-β-gal images of kidney (left) and liver (right) in young C57BL/6J mice receiving old C57BL/6 blood treated with vehicle (YO+Veh) or ABT263 (YO+ABT). (b) HMGB1 immunohistochemistry (brown staining of HMGB1 re-localized to cytoplasm of kidney cells with arrows) (n = 5 per group; 10–15 images per mice). (c) Immunohistochemical staining for KIM-1 (n = 6 for YO+Veh; n = 4 for YO+ABT; 4–5 images per mice) and LTL (n = 5 per group; 5–7 images per mice) on kidney tissues and (d) quantification of KIM-1 + area (%). (e) Serum concentration of KIM-1 (n = 6 per group), (f) blood urea nitrogen (n = 12 for YO+Veh; n = 9 for YO+ABT) and creatine (n = 4 per group). (g) Representative images of Sirius Red (n = 6 for YO+Veh; n = 5 for YO+ABT; 10–15 images per mice) and Masson Trichrom staining and desmin immunohistochemistry (n = 6 mice for YO+Veh; n = 5 mice for YO+ABT; 10–15 images per mice) in livers. Arrows indicate collagen deposition. (h) Quantifications of fibrotic area, as % of area occupied by Sirius Red stain, and desmin + area (n = 6 for YO+Veh; n = 5 for YO+ABT). (i) Quantification of mRNAs encoding Col1a1, Col3a1, Col4a1 and Col4a2 in the liver (n = 6 per group). (j) Oil Red O + area (%) indicated as adiposity index (n = 6 per group; 5–9 images per mice). (k) Serum analyses for ALT (n = 8 for YO+Veh; n = 9 for YO+ABT) and bilirubin (n = 9 per group). All data are expressed as means± s.e.m. of biologically independent samples. A two-tailed t test with a Welch’s correction (d-f, h, j-k; *, P < 0.05) and multiple t test with a two-stage linear step-up procedure of Benjamini, Krieger and Yekutieli, with Q = 5%, *q < 0.05; **q < 0.01 (i). Scale bars, 100 μm. Rel, relative.
Extended Data Fig. 7 |. Abrogation of senescence induction by ABT263 treatment of old mice before heterochronic apheresis attenuates the negative effects of old blood on skeletal muscle function.
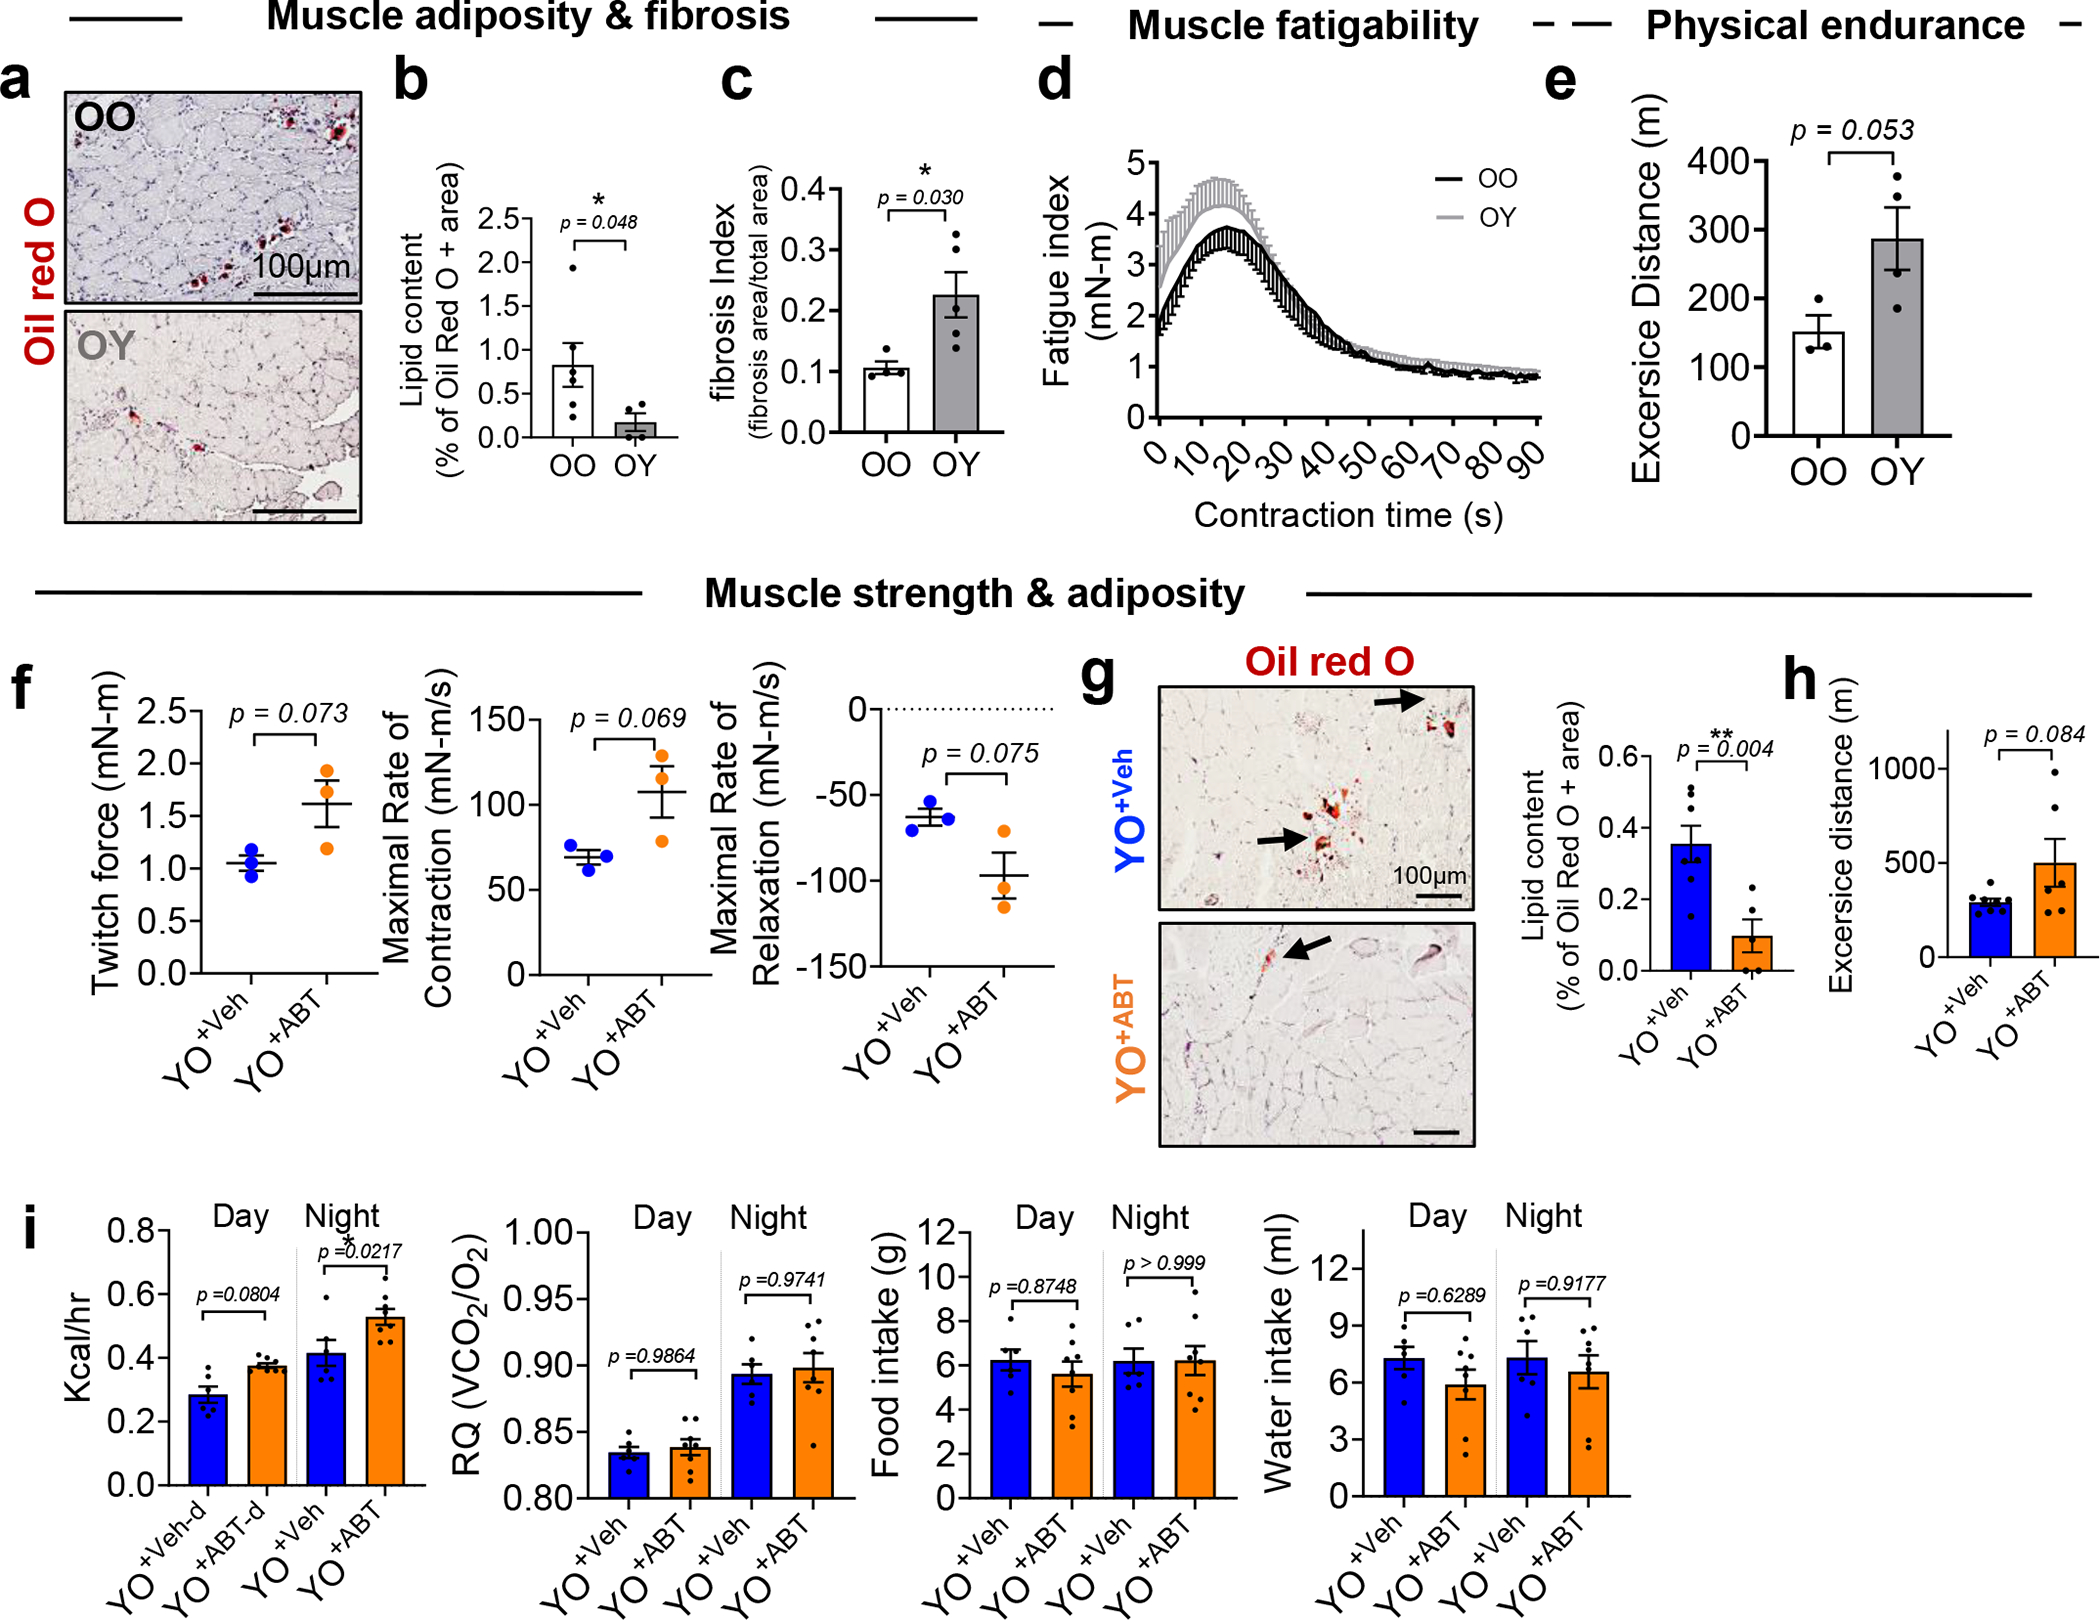
(a) Representative images of Oil Red O staining and (b) % of Oil Red O + area in muscles of old mice receiving old blood (OO) or young blood (OY) mice 14 days after blood exchange (n = 6 mice for OO; n = 4 mice for OY; 6–10 images per mice). (c) Fibrosis index, calculated from images of H&E staining (n = 4 for OO; n = 5 for OY; 3 images per mice). (d) Skeletal muscle fatigue assessment (n = 4 for OO; n = 3 for OY) and (e) treadmill running distance in meters (n = 3 for OO; n = 4 for OY). (f) Maximal twitch force generated by muscles and maximal rate of contraction between onset of contraction and peak force and maximal rate of relaxation ranging from peak force until force had declined to baseline during contractions in YO+Veh and YO+ABT (n = 3 per group). (g) Representative images of Oil Red O and quantification of Oil Red O + staining of skeletal muscles (n = 7 mice for YO+Veh; n = 5 mice for YO+ABT; 5–8 images per mice). (h) Running distance in meters of on treadmill (n = 8 for YO+Veh; n = 6 for YO+ABT). (i) Measured energy expenditure and respiratory quotient (RQ) to assess ratio of CO2 produced to O2 consumed and food intake in metabolic cages during the day and night cycles (n = 6 for YO+Veh; n = 8 for YO+ABT). Data are the average of 4 day and night cycles for 4 consecutive days. Data are means ± s.e.m. of biologically independent samples. A two-tailed t test with a Welch’s correction (b-c, e), Student t-test (f-h) (*, P < 0.05), and one-way ANOVA, Tukey’s multiple comparison test with *, P < 0.05 (i) was used for statistical analysis. Scale bars, 100 μm.
Extended Data Fig. 8 |. Systemic cytokine levels in sera from young mice after heterochronic blood exchange and after blood exchange with old mice in which SnCs were removed by ABT263.
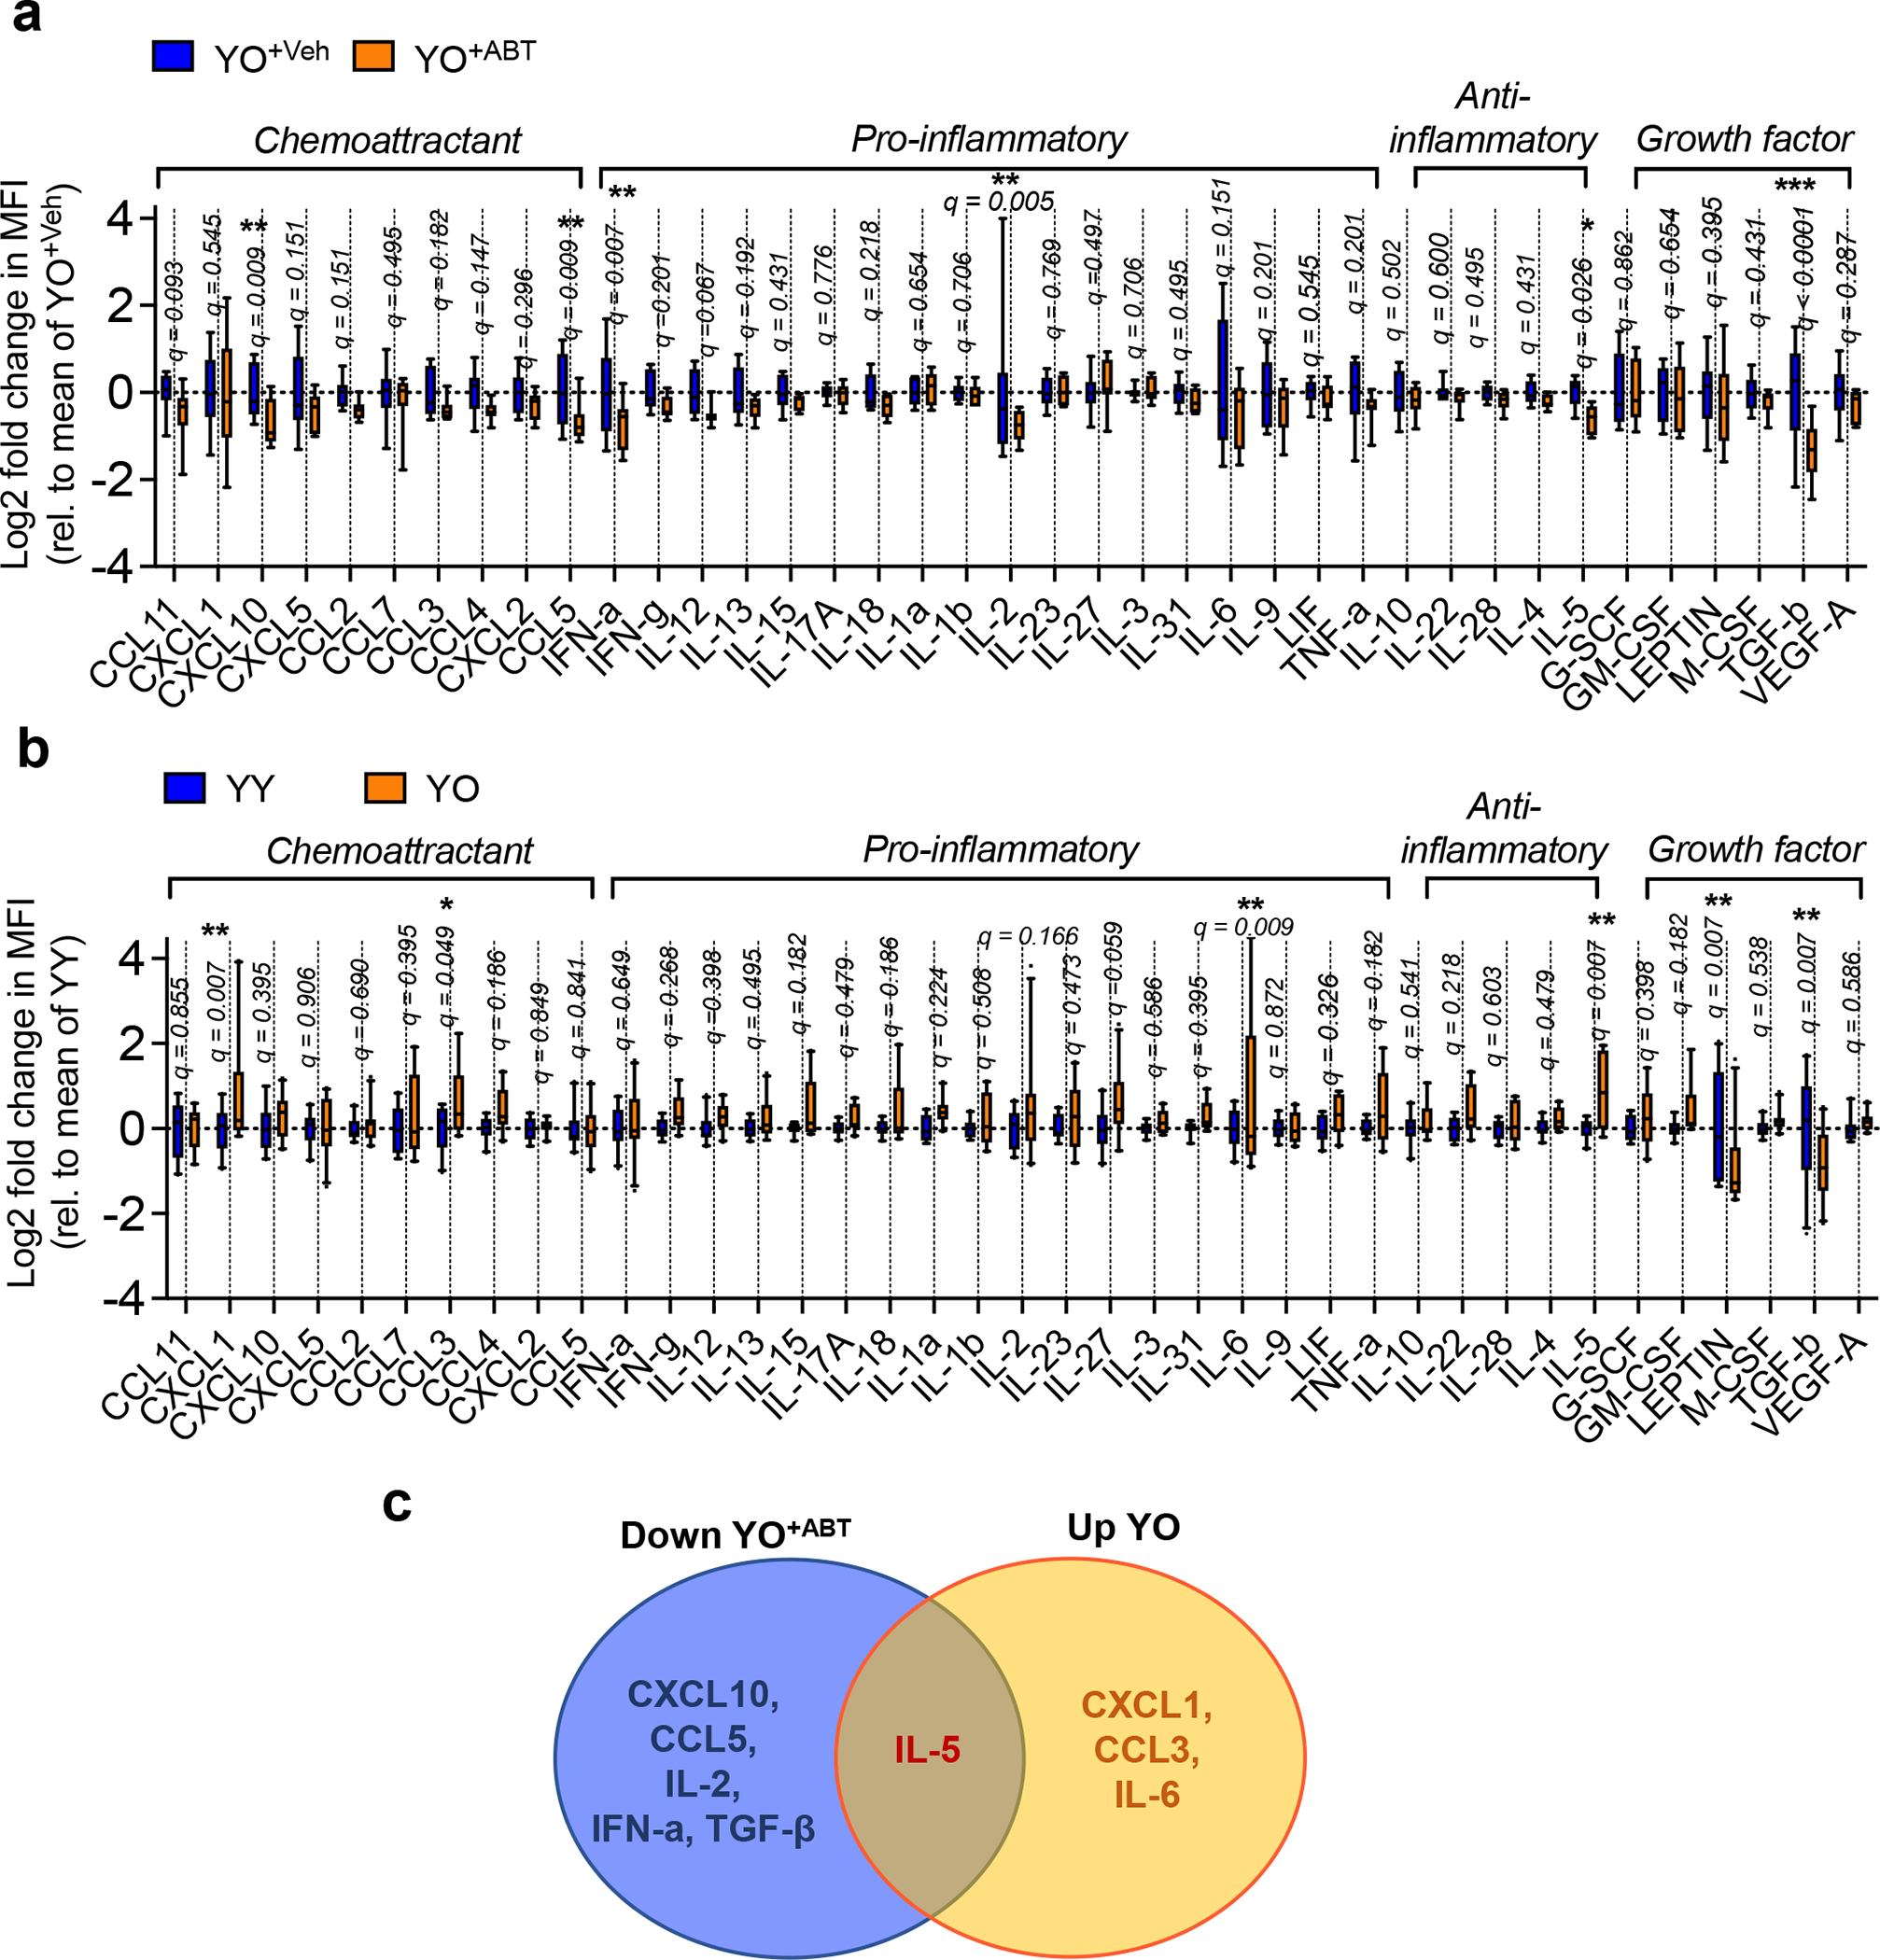
(a) Changes in cytokine levels in serum from YO+Veh and YO+ABT mice (n = 10 for each group). Box-and-whisker plots of log2-transformed fold change in mean fluorescence intensity (MFI) compared to the average of YO+Veh. (b) Changes in cytokine levels in serum from YY and YO mice (n = 10 for each group) using a Luminex array. Box-and-whisker plots of log2-transformed fold change in MFI compared to the average of YY. Box plots depict median, with whiskers indicating 10–90 percentile values of biologically independent samples. Statistical significance was calculated using 2-way RM ANOVA followed by two-stage step-up method of Benjamini, Krieger and Yekutieli, FDR < 0.05 (a-b). *q < 0.05; **q < 0.01; ***q < 0.001. (c) Venn diagram of serum proteins altered in young mice after blood exchange with old mice or with ABT263-treated old mice. The orange area indicates the four factors that increased in serum from YO compared to serum from YY (up YO). The blue area shows the six factors that decreased in YO+ABT compared to serum from YO+Veh (down YO+ABT). In the intersection of the orange and blue areas is one factor showing altered levels in both screens.
Extended Data Fig. 9 |. Removal of SnCs by ABT263 in young mice reduces capacity to induce senescence in young animals by blood exchange.
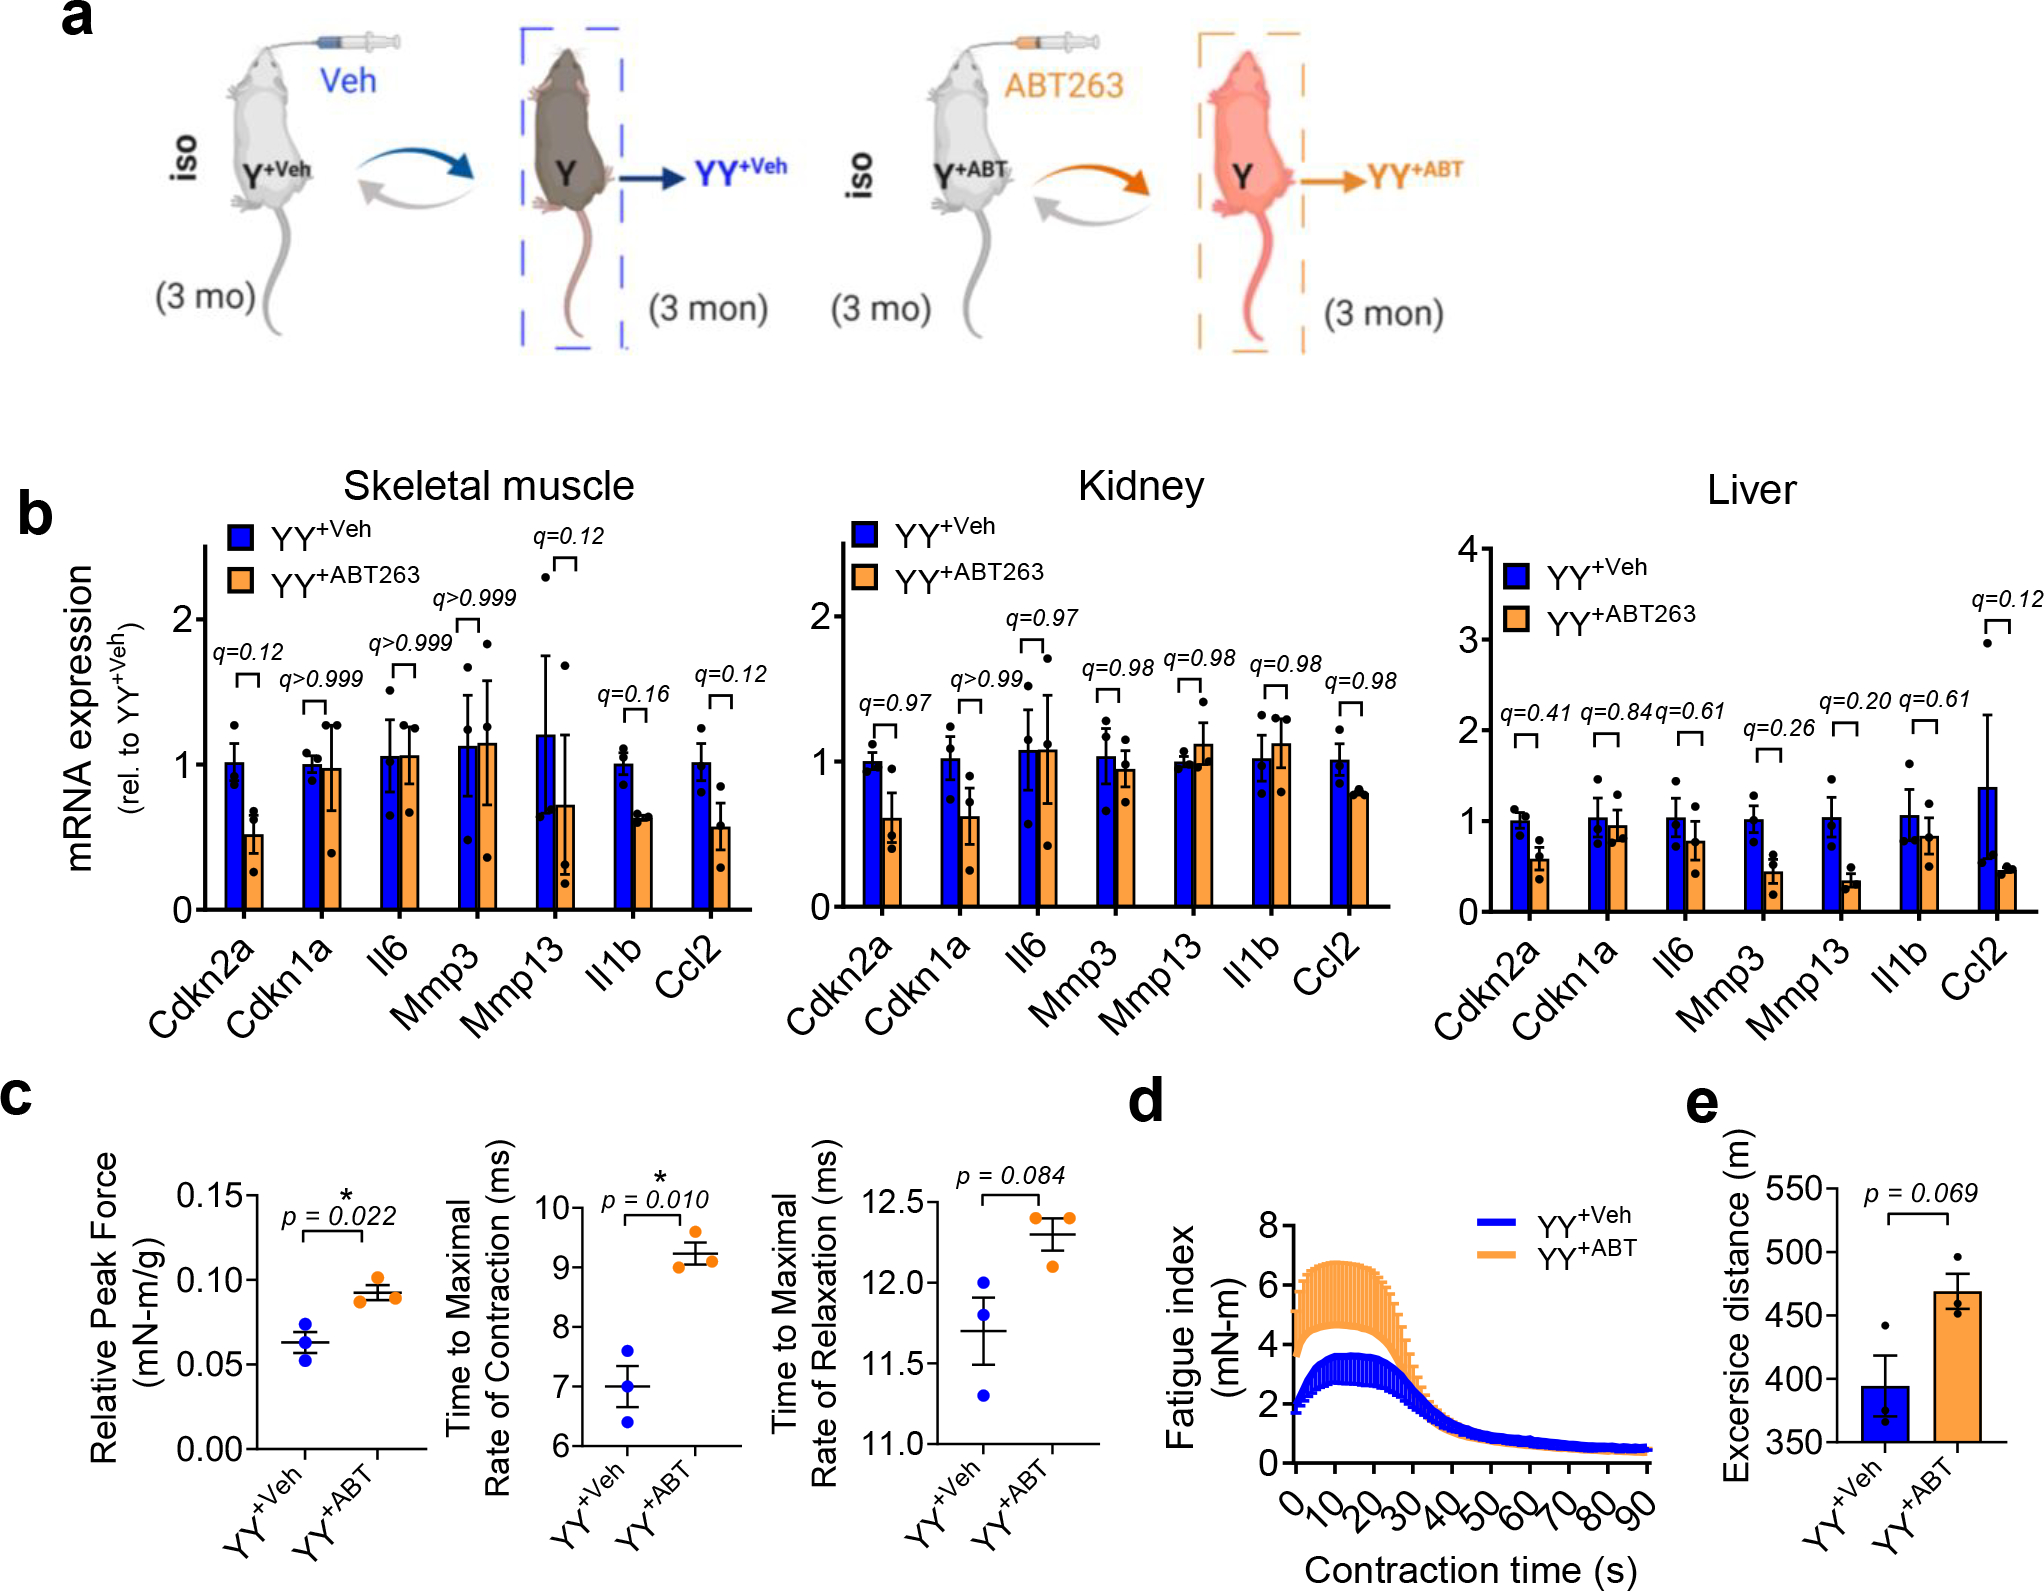
(a) Schematic showing isochronic pairings using blood exchange. Young C57BL/6J mice were exchanged with blood of young C57BL/6J mice either treated with vehicle (YY+Veh) or ABT263 (YY+ABT). (b) Fold change in gene expression of senescence and SASP markers, determined by RT–PCR, in skeletal muscle (gastrocnemius), kidney and liver of YY+ABT animals compared with YY+Veh 14 days after blood exchange. (c) Maximal twitch force generated by skeletal muscles, time to maximal rate of contraction and relaxation. (d) Skeletal muscle fatigue assessment. (e) Treadmill running distance in meters of YY+Veh and YY+ABT. Data are means ± s.e.m. of biologically independent samples and each data point represents an individual mouse. Data are collective of one independent experiment. n = 3 for each group in this experiment. Statistical significance was calculated using two-way ANOVA followed by two-stage step-up method of Benjamini, Krieger and Yekutieli, FDR < 0.05 (b) and two-tailed t-test with Welch’s correction (c, e), *P < 0.05. Rel, relative.
Extended Data Fig. 10 |. Systemic removal of SnCs by ABT263 in aged mice ablates rejuvenating effects by blood exchange.
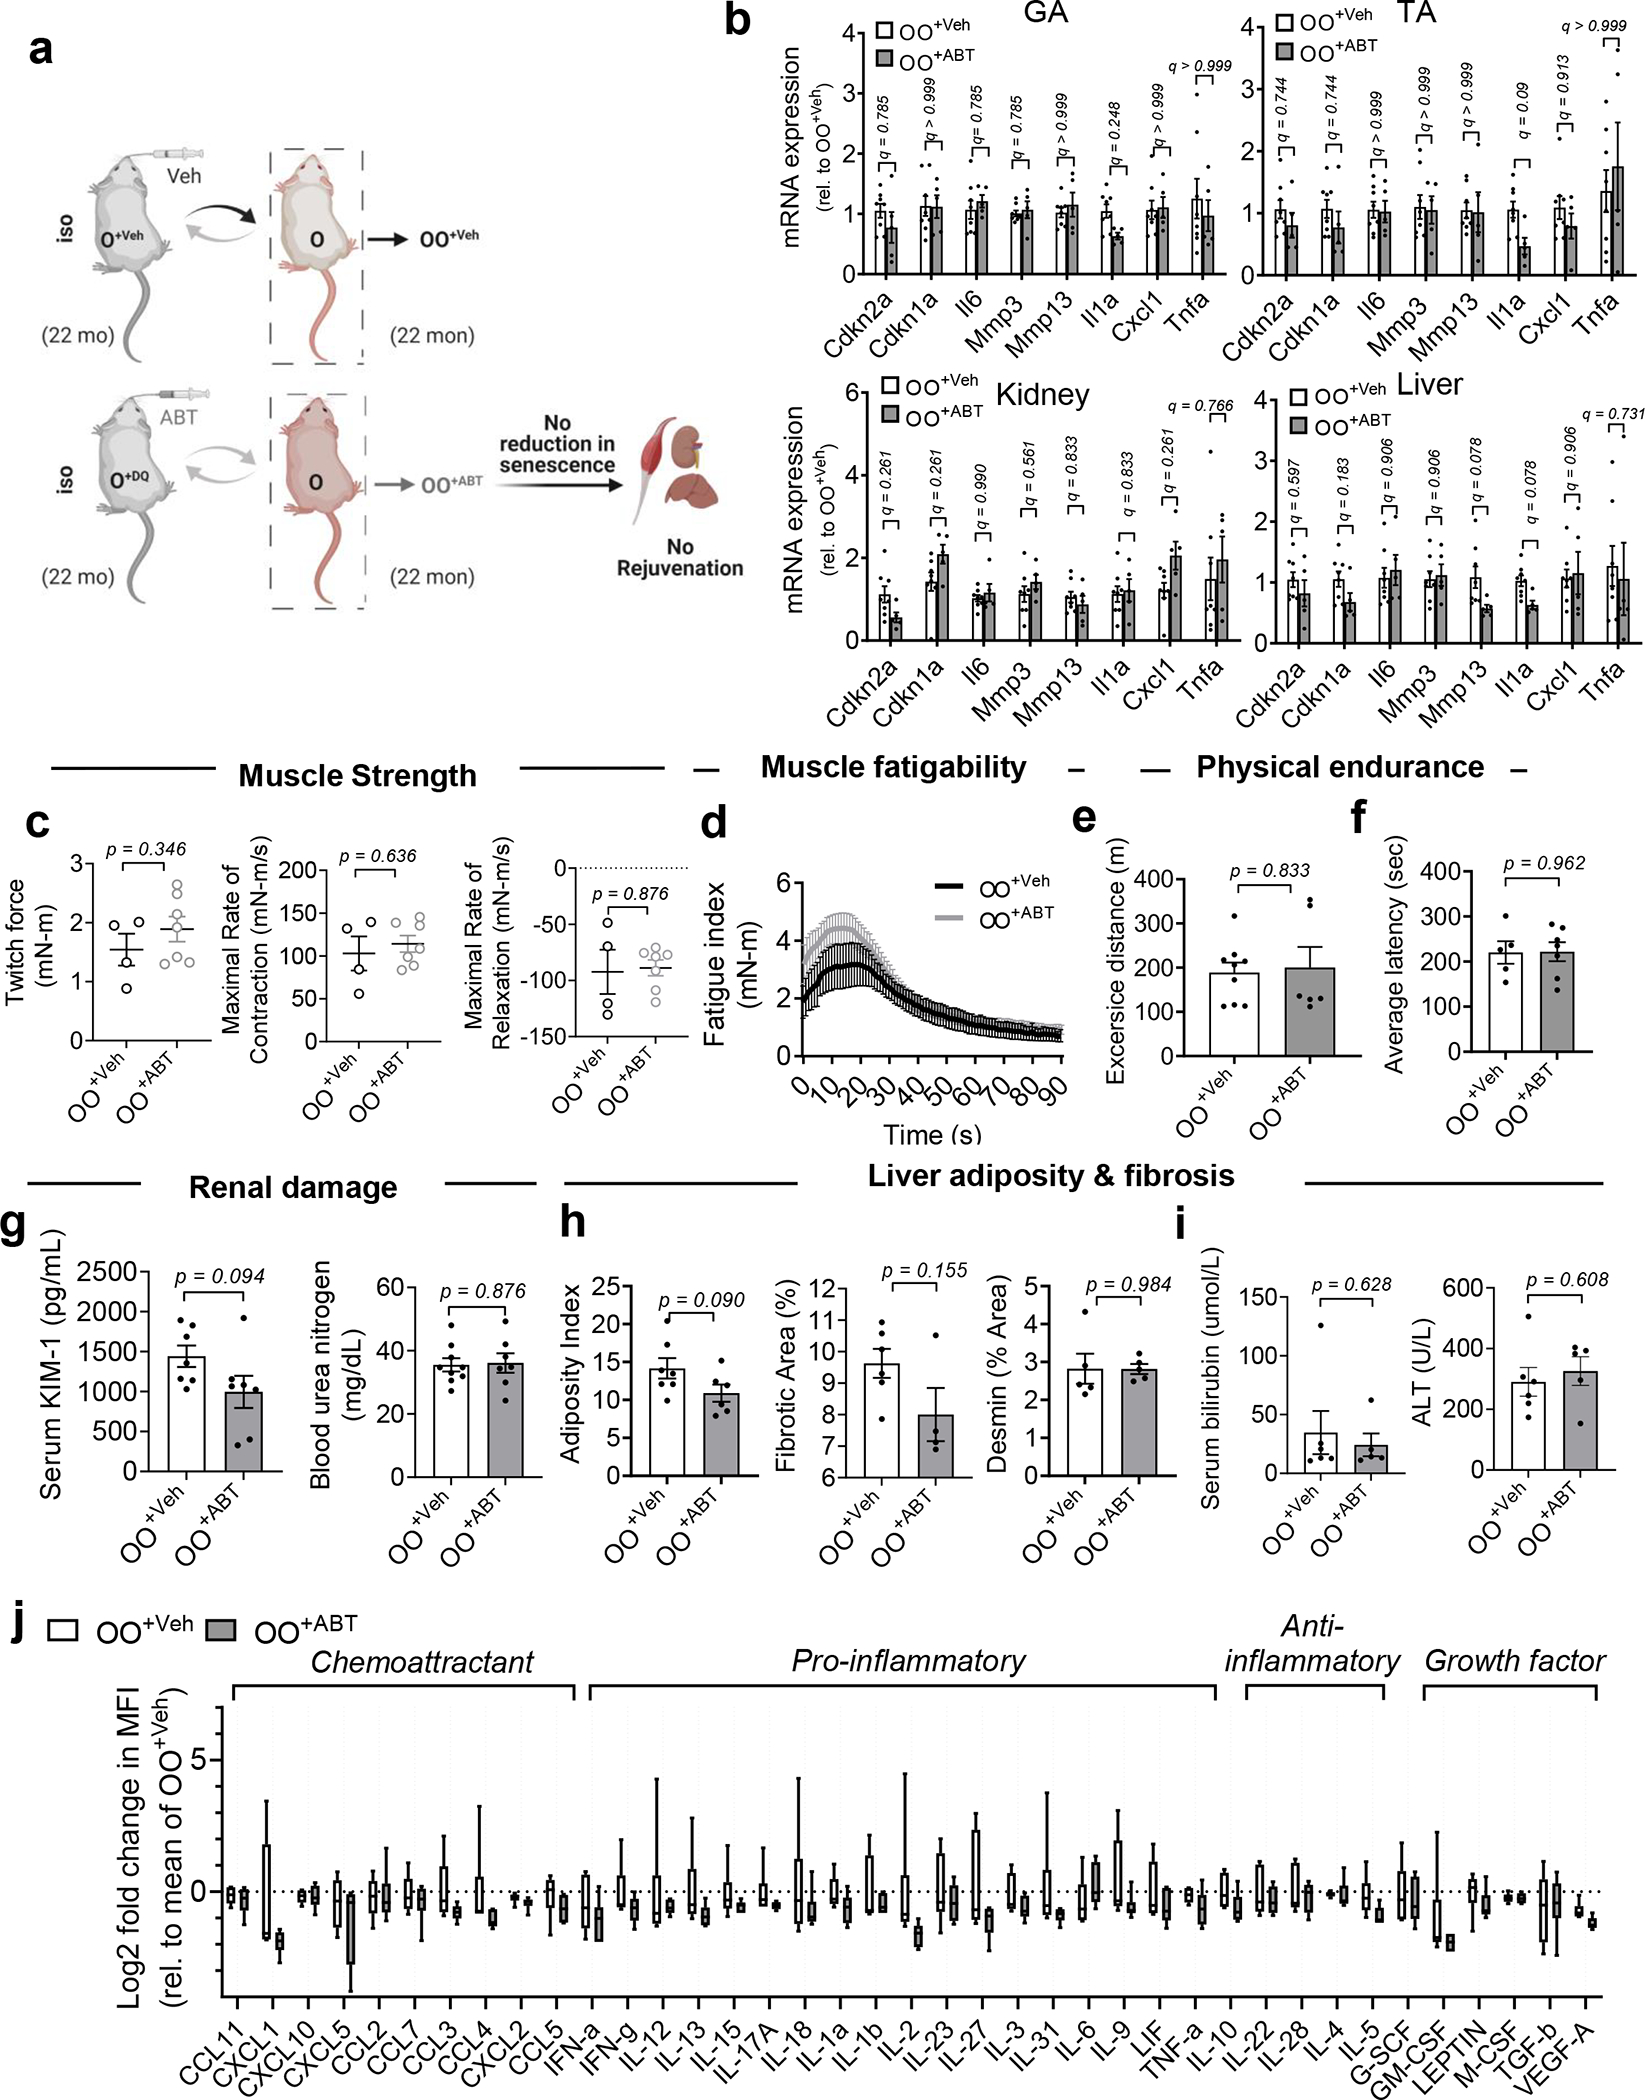
(a) Schematic showing isochronic pairings using blood exchange. (b) Gene expression of senescence and SASP markers, in skeletal muscle (GA and TA), kidney and liver of old C57BL/6J mice receiving blood from old C57BL/6J mice treated with vehicle (OO+Veh) or ABT263 (OO+ABT) (n = 8 for OO+Veh; n = 5 for OO+ABT). (c) Absolute peak isometric torque of the plantarflexors, maximal rate of contraction between onset of contraction and peak force, and maximal rate of relaxation ranging from peak force until force had declined to baseline. (d) Skeletal muscle fatigue assessment (n = 4 for OO+Veh; n = 7 for OO+ABT). (e) Running distance in meters on treadmills (n = 9 for OO+Veh; n = 6 for OO+ABT). (f) Latency time to fall from the rotarod (n = 5 for OO+Veh; n = 7 for OO+ABT). (g) Serum analysis for KIM-1 (n = 7 for group) and blood urea nitrogen (n = 9 for OO+Veh; n = 7 for OO+ABT). (h) Adiposity (shown as a % of Oil Red O; n = 7 for OO+Veh; n = 6 for OO+ABT), collagen deposition (n = 5 for OO+Veh; n = 4 for OO+ABT), as the % of area occupied by Sirius Red stain, and desmin-positive-area (n = 5 for group). (i) Serum analysis for bilirubin and ALT (n = 6 for OO+Veh; n = 5 for OO+ABT). (j) Box-and-whisker plots of log2-transformed fold change in MFI compared to the average of OO+Veh. Box plots depict median, with whiskers indicating 10–90 percentile values (n = 6 for each group). Data are means ± s.e.m. Data are collective of two independent experiments. Multiple Mann-Whitney tests with a two-stage linear step-up procedure of Benjamini, Krieger and Yekutieli, with Q = 5% (*q < 0.05; **q < 0.01) (b, j) and two-tailed t test with Welch’s correction, with *P < 0.05 (c, e-i) was used for statistical analysis. Rel, relative.
Supplementary Material
Acknowledgements
We thank I. Silverstein for help with blood exchange procedures and T. Rando and a subaward from the Glenn Foundation for Medical Research for funding our early background work. This work was supported by a postdoctoral fellowship from the Glenn Foundation for Medical Research, Korea University grant nos. K2006261 and K2025261; the National Research Foundation of Korea Government grant nos. NRF 2020R1C1C1009921 (O.H.J.) and NIH T32 AG002266 (N.W.A.); the Pew Charitable Trust awarded to the Buck Institute for Research on Aging; by grants from the NIH nos. P01 AG017242 and R01 AG051729 (J.C.); grant nos. NIH 1R01AG071787, R56 AG058819, R01 EB023776, R01 HL139605, and the Open Philanthropy Foundation and the QB3 Calico Award (I.M.C.). A collaborative grant no. R56 AG052988 SA23061 (J.C. and I.M.C.) greatly aided these studies. Schematics of all experimental designs were created with BioRender.com.
Footnotes
Competing interests
J.C. is a founder and shareholder of Unity Biotechnology, which develops senolytic drugs. All other authors declare no competing interests.
Additional information
Extended data are available for this paper at https://doi.org/10.1038/s42255-022-00609-6.
Supplementary information The online version contains supplementary material available at https://doi.org/10.1038/s42255-022-00609-6.
Data availability
Source data are provided with this paper. The data from this study are available from the corresponding author upon reasonable request.
References
- 1.Vijg J & Campisi J Puzzles, promises and a cure for ageing. Nature 454, 1065–1071 (2008). [DOI] [PMC free article] [PubMed] [Google Scholar]
- 2.Campisi J Aging, cellular senescence, and cancer. Annu Rev. Physiol. 75, 685–705 (2013). [DOI] [PMC free article] [PubMed] [Google Scholar]
- 3.Coppe JP et al. Senescence-associated secretory phenotypes reveal cell-nonautonomous functions of oncogenic RAS and the p53 tumor suppressor. PLoS Biol. 6, 2853–2868 (2008). [DOI] [PMC free article] [PubMed] [Google Scholar]
- 4.Jeon OH et al. Senescence cell-associated extracellular vesicles serve as osteoarthritis disease and therapeutic markers. JCI Insight 10.1172/jci.insight.125019 (2019). [DOI] [PMC free article] [PubMed] [Google Scholar]
- 5.Acosta JC et al. A complex secretory program orchestrated by the inflammasome controls paracrine senescence. Nat. Cell Biol. 15, 978–990 (2013). [DOI] [PMC free article] [PubMed] [Google Scholar]
- 6.Mehdipour M et al. Plasma dilution improves cognition and attenuates neuroinflammation in old mice. Geroscience 43, 1–18 (2021). [DOI] [PMC free article] [PubMed] [Google Scholar]
- 7.Mehdipour M et al. Rejuvenation of three germ layers tissues by exchanging old blood plasma with saline-albumin. Aging 12, 8790–8819 (2020). [DOI] [PMC free article] [PubMed] [Google Scholar]
- 8.Rebo J et al. A single heterochronic blood exchange reveals rapid inhibition of multiple tissues by old blood. Nat. Commun. 7, 13363 (2016). [DOI] [PMC free article] [PubMed] [Google Scholar]
- 9.Mehdipour M et al. Rejuvenation of brain, liver and muscle by simultaneous pharmacological modulation of two signaling determinants, that change in opposite directions with age. Aging 11, 5628–5645 (2019). [DOI] [PMC free article] [PubMed] [Google Scholar]
- 10.Khrimian L et al. Gpr158 mediates osteocalcin’s regulation of cognition. J. Exp. Med. 214, 2859–2873 (2017). [DOI] [PMC free article] [PubMed] [Google Scholar]
- 11.Loffredo FS et al. Growth differentiation factor 11 is a circulating factor that reverses age-related cardiac hypertrophy. Cell 153, 828–839 (2013). [DOI] [PMC free article] [PubMed] [Google Scholar]
- 12.Smith LK et al. beta2-microglobulin is a systemic pro-aging factor that impairs cognitive function and neurogenesis. Nat. Med. 21, 932–937 (2015). [DOI] [PMC free article] [PubMed] [Google Scholar]
- 13.Castellano JM et al. Human umbilical cord plasma proteins revitalize hippocampal function in aged mice. Nature 544, 488–492 (2017). [DOI] [PMC free article] [PubMed] [Google Scholar]
- 14.Villeda SA et al. The ageing systemic milieu negatively regulates neurogenesis and cognitive function. Nature 477, 90–94 (2011). [DOI] [PMC free article] [PubMed] [Google Scholar]
- 15.Naito AT et al. Complement C1q activates canonical Wnt signaling and promotes aging-related phenotypes. Cell 149, 1298–1313 (2012). [DOI] [PMC free article] [PubMed] [Google Scholar]
- 16.Li L et al. Impairment of chondrocyte proliferation after exposure of young murine cartilage to an aged systemic environment in a heterochronic parabiosis model. Swiss Med. Wkly 148, w14607 (2018). [DOI] [PMC free article] [PubMed] [Google Scholar]
- 17.Yousef H et al. Systemic attenuation of the TGF-beta pathway by a single drug simultaneously rejuvenates hippocampal neurogenesis and myogenesis in the same old mammal. Oncotarget 6, 11959–11978 (2015). [DOI] [PMC free article] [PubMed] [Google Scholar]
- 18.Yousef H et al. Aged blood impairs hippocampal neural precursor activity and activates microglia via brain endothelial cell VCAM1. Nat. Med. 25, 988–1000 (2019). [DOI] [PMC free article] [PubMed] [Google Scholar]
- 19.Wiley CD & Campisi J From ancient pathways to aging cells-connecting metabolism and cellular senescence. Cell Metab. 23, 1013–1021 (2016). [DOI] [PMC free article] [PubMed] [Google Scholar]
- 20.Jeon OH et al. Local clearance of senescent cells attenuates the development of post-traumatic osteoarthritis and creates a pro-regenerative environment. Nat. Med. 23, 775–781 (2017). [DOI] [PMC free article] [PubMed] [Google Scholar]
- 21.Bussian TJ et al. Clearance of senescent glial cells prevents tau-dependent pathology and cognitive decline. Nature 562, 578–582 (2018). [DOI] [PMC free article] [PubMed] [Google Scholar]
- 22.Rodier F & Campisi J Four faces of cellular senescence. J. Cell Biol. 192, 547–556 (2011). [DOI] [PMC free article] [PubMed] [Google Scholar]
- 23.Demaria M et al. An essential role for senescent cells in optimal wound healing through secretion of PDGF-AA. Dev. Cell 31, 722–733 (2014). [DOI] [PMC free article] [PubMed] [Google Scholar]
- 24.Baker DJ et al. Naturally occurring p16(Ink4a)-positive cells shorten healthy lifespan. Nature 530, 184–189 (2016). [DOI] [PMC free article] [PubMed] [Google Scholar]
- 25.Xu M et al. Senolytics improve physical function and increase lifespan in old age. Nat. Med. 24, 1246–1256 (2018). [DOI] [PMC free article] [PubMed] [Google Scholar]
- 26.Zhu S et al. Aging- and obesity-related peri-muscular adipose tissue accelerates muscle atrophy. PLoS ONE 14, e0221366 (2019). [DOI] [PMC free article] [PubMed] [Google Scholar]
- 27.Kishi S et al. Proximal tubule ATR regulates DNA repair to prevent maladaptive renal injury responses. J. Clin. Invest. 129, 4797–4816 (2019). [DOI] [PMC free article] [PubMed] [Google Scholar]
- 28.Ogrodnik M et al. Cellular senescence drives age-dependent hepatic steatosis. Nat. Commun. 8, 15691 (2017). [DOI] [PMC free article] [PubMed] [Google Scholar]
- 29.Zhu Y et al. New agents that target senescent cells: the flavone, fisetin, and the BCL-XL inhibitors, A1331852 and A1155463. Aging 9, 955–963 (2017). [DOI] [PMC free article] [PubMed] [Google Scholar]
- 30.Liu A et al. Young plasma reverses age-dependent alterations in hepatic function through the restoration of autophagy. Aging Cell 10.1111/acel.12708 (2018). [DOI] [PMC free article] [PubMed] [Google Scholar]
- 31.Huang Q et al. A young blood environment decreases aging of senile mice kidneys. J. Gerontol. A Biol. Sci. Med Sci. 73, 421–428 (2018). [DOI] [PubMed] [Google Scholar]
- 32.Sousa-Victor P et al. MANF regulates metabolic and immune homeostasis in ageing and protects against liver damage. Nat. Metab. 1, 276–290 (2019). [DOI] [PMC free article] [PubMed] [Google Scholar]
- 33.Zhu Y et al. Identification of a novel senolytic agent, navitoclax, targeting the Bcl-2 family of anti-apoptotic factors. Aging Cell 15, 428–435 (2016). [DOI] [PMC free article] [PubMed] [Google Scholar]
- 34.Chang J et al. Clearance of senescent cells by ABT263 rejuvenates aged hematopoietic stem cells in mice. Nat. Med. 22, 78–83 (2016). [DOI] [PMC free article] [PubMed] [Google Scholar]
- 35.Wan QL et al. Intermediate metabolites of the pyrimidine metabolism pathway extend the lifespan of C. elegans through regulating reproductive signals. Aging 11, 3993–4010 (2019). [DOI] [PMC free article] [PubMed] [Google Scholar]
- 36.Li W et al. Thymidine phosphorylase participates in platelet signaling and promotes thrombosis. Circ. Res. 115, 997–1006 (2014). [DOI] [PMC free article] [PubMed] [Google Scholar]
- 37.Dumont NA et al. Dystrophin expression in muscle stem cells regulates their polarity and asymmetric division. Nat. Med. 21, 1455–1463 (2015). [DOI] [PMC free article] [PubMed] [Google Scholar]
- 38.Chang NC et al. The dystrophin glycoprotein complex regulates the epigenetic activation of muscle stem cell commitment. Cell Stem Cell 22, 755–768 e756 (2018). [DOI] [PMC free article] [PubMed] [Google Scholar]
- 39.Mehdipour M et al. Key age-imposed signaling changes that are responsible for the decline of stem cell function. Subcell. Biochem. 90, 119–143 (2018). [DOI] [PubMed] [Google Scholar]
- 40.Lau A, Kennedy BK, Kirkland JL & Tullius SG Mixing old and young: enhancing rejuvenation and accelerating aging. J. Clin. Invest. 129, 4–11 (2019). [DOI] [PMC free article] [PubMed] [Google Scholar]
- 41.Tang H et al. Single senescent cell sequencing reveals heterogeneity in senescent cells induced by telomere erosion. Protein Cell 10, 370–375 (2019). [DOI] [PMC free article] [PubMed] [Google Scholar]
- 42.Petit C et al. Proteomics approaches to define senescence heterogeneity and chemotherapy response. Proteomics 19, e1800447 (2019). [DOI] [PubMed] [Google Scholar]
- 43.Wiley CD et al. Analysis of individual cells identifies cell-to-cell variability following induction of cellular senescence. Aging Cell 16, 1043–1050 (2017). [DOI] [PMC free article] [PubMed] [Google Scholar]
- 44.Hernandez-Segura A et al. Unmasking transcriptional heterogeneity in senescent cells. Curr. Biol. 27, 2652–2660 e2654 (2017). [DOI] [PMC free article] [PubMed] [Google Scholar]
- 45.Cazin C, Chiche A & Li H Evaluation of injury-induced senescence and in vivo reprogramming in the skeletal muscle. J. Vis. Exp. 10.3791/56201 (2017). [DOI] [PMC free article] [PubMed] [Google Scholar]
- 46.Kaiping Y Adipose Tissue Protocols: Methods in Molecular Biology 2nd edn (Humana Press, 2008). [Google Scholar]
Associated Data
This section collects any data citations, data availability statements, or supplementary materials included in this article.
Supplementary Materials
Data Availability Statement
Source data are provided with this paper. The data from this study are available from the corresponding author upon reasonable request.


